printed wiring board reliability evaluation methods - pwb
TRANSCRIPT

Copyright 2003 by Northrop Grumman Space Technology. Published by Society for the Advancement of Material and Process Engineering with Permission.
PRINTED WIRING BOARD RELIABILITY EVALUATION METHODS CORRELATIONS OF IST VS THERMAL SHOCK
Wennei Chen, Bill Bjorndahl, Brian Parrish
Northrop Grumman Space Technology One Space Park, R6/2184, Redondo Beach, California 90278
Bill Birch
PWB Interconnect Solutions, Inc 103-235 Stafford Rd. West, Ottawa, ON K2H 9C1, Canada
Ronald Carter Alion/PMTEC
215 Wynn Drive, Suite 101, Huntsville, AL 35805
ABSTRACT Thermal tests and cross-section methods have been utilized as Printed Wiring Board (PWB) screening/qualification methods over the past several decades. These traditional methods are expensive and take time to perform. The current market trend of reducing product-development-cycle time generates the need for highly accelerated test methods. A relatively new test method called Interconnect Stress Testing (IST) has demonstrated the capability of producing reliability data in a timely manner. In order to have confidence in the highly accelerated IST methods, the equivalence to more traditional methods must be established. This evaluation examined IST and IPC coupons associated with several PWB designs and PWB fabrication lots. The coupons tested varied from an as-received condition to exposure of solder assembly cycles prior to IST and thermal shock testing. Cross-sectional microscopy techniques were applied on both coupon groups. This study found a correlation between IST and thermal shock test severity. The results indicated that a total of 300 IST cycles would induce fatigue effects on plated barrels at least as severe as 100 thermal shock cycles. KEY WORDS: Interconnect Stress Test (IST), Plated-Through Hole (PTH), Thermal Shock Equivalency

1. INTRODUCTION The printed wiring board (PWB) industry is continually developing new process technologies and utilizing new materials as they become available. Determining the feasibility of new PWB designs that utilize new materials and processes for high reliability space application is often a long and arduous process. The most common PWB screening/qualification method has been the use of thermal-oven tests in conjunction with cross-sections. This traditional method can no longer keep pace with PWB technology advancements. IST technology was developed in anattempt to generate reliability data in a timely manner. This report presents the results of a correlation study among data produced by two (2) methods. The first group of data was generated by a well-known and widely-used traditional thermal-oven method called the “thermal shock test”, or “shock test”. It is similar to IPC-TM-650, Method 2.6.7.2, air-to-air cycling between -65°C ~ 125°C. This test involved a dwell time of 15 minutes at each temperature extreme and a maximum transition time of 2 minutes between the two extremes. No daisy chains were monitored since most of the coupons were the conventional IPC coupon types A and B. Cross-sectioning microscopy analysis was conducted at the end of 100 cycles of thermal shock. The second group of data was generated by the relatively new IST method. The test was performed in accordance with IPC-TM-650, Method 2.6.26. Unlike the first method above, no thermal oven was involved. All coupons were daisy chained. Each coupon consists of hundreds of plated barrels connected to form daisy chains. DC current was applied to one circuit, called the “Power Circuit”, to create heat through the board substrate. The coupons were heated in this manner from ambient to 150°C in approximately 3 minutes. A full IST cycle lasts approximately 6 minutes (including 3 minutes cool down). During each cycle, resistance changes for all circuit nets were continuously monitored. Coupon performance was tracked by small changes in resistance which indicated interconnect integrity changes. These changes indicated that failures were being initiated and the interconnect lost some ability to withstand further stress. As the test progresses, these small interconnect integrity changes increase the total circuit resistance due to the accumulated damage. The IST machine graphed the resistance changes as a function of the numbers of IST cycles for each net. When larger changes are detected, the system automatically stops the testing at a pre-determined level. In order to understand how the IST method correlates to the thermal shock method, the data from the two test methods were compared. Cross-section microscopy analysis was performed on IST coupons after testing to compare with cross-sections from thermal shock tests. The goal was to establish a test-severity equivalency between IST and the thermal shock method. Note that theoretical analyses were not within the scope of this investigation. The equivalency was derived based on empirical data and limited to certain PWB attributes.
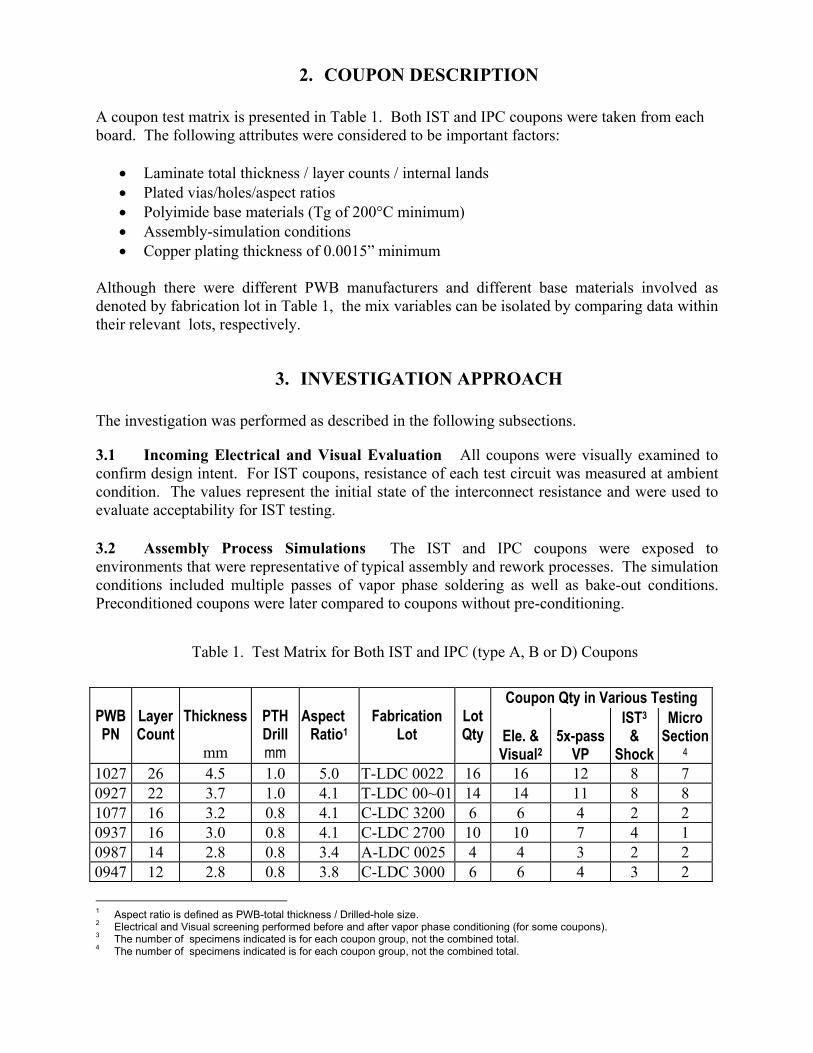
2. COUPON DESCRIPTION A coupon test matrix is presented in Table 1. Both IST and IPC coupons were taken from each board. The following attributes were considered to be important factors:
• Laminate total thickness / layer counts / internal lands • Plated vias/holes/aspect ratios • Polyimide base materials (Tg of 200°C minimum) • Assembly-simulation conditions • Copper plating thickness of 0.0015” minimum
Although there were different PWB manufacturers and different base materials involved as denoted by fabrication lot in Table 1, the mix variables can be isolated by comparing data within their relevant lots, respectively.
3. INVESTIGATION APPROACH The investigation was performed as described in the following subsections.
3.1 Incoming Electrical and Visual Evaluation All coupons were visually examined to confirm design intent. For IST coupons, resistance of each test circuit was measured at ambient condition. The values represent the initial state of the interconnect resistance and were used to evaluate acceptability for IST testing.
3.2 Assembly Process Simulations The IST and IPC coupons were exposed to environments that were representative of typical assembly and rework processes. The simulation conditions included multiple passes of vapor phase soldering as well as bake-out conditions. Preconditioned coupons were later compared to coupons without pre-conditioning.
Table 1. Test Matrix for Both IST and IPC (type A, B or D) Coupons
Coupon Qty in Various Testing
PWB PN
Layer Count
Thickness
mm
PTH Drill mm
Aspect
Ratio1
Fabrication
Lot
Lot Qty
Ele. & Visual2
5x-pass
VP
IST3 &
Shock
Micro Section
4 1027 26 4.5 1.0 5.0 T-LDC 0022 16 16 12 8 7 0927 22 3.7 1.0 4.1 T-LDC 00~01 14 14 11 8 8 1077 16 3.2 0.8 4.1 C-LDC 3200 6 6 4 2 2 0937 16 3.0 0.8 4.1 C-LDC 2700 10 10 7 4 1 0987 14 2.8 0.8 3.4 A-LDC 0025 4 4 3 2 2 0947 12 2.8 0.8 3.8 C-LDC 3000 6 6 4 3 2
1 Aspect ratio is defined as PWB-total thickness / Drilled-hole size. 2 Electrical and Visual screening performed before and after vapor phase conditioning (for some coupons). 3 The number of specimens indicated is for each coupon group, not the combined total. 4 The number of specimens indicated is for each coupon group, not the combined total.

3.3 IST Test Procedure As shown in Table 1. Selected IST coupons (both pre-conditioned and as-received) were tested in accordance with IPC-TM-650, Method 2.6.26. The IST test consists of cycling the coupon from ambient to 150C ±3°C, in 3 minutes +2/-0 seconds, followed by forced air cooling to ambient in 2 minutes +2/-0 seconds. PTH-post-interconnect and plated barrels’ resistances were graphed individually as a function of the number of IST cycles. IST testing was set to stop when the coupons achieved a 10% increase in elevated resistance calculated from the initial elevated resistance measurement, or a maximum of 1500 cycles. All IST coupons underwent a thermograph analysis. An infrared camera produces a thermal image of the DC powered IST coupons which identifies locations where either failure or maximum deterioration occurred. The plated vias/holes were then sectioned at these suspect locations. Figure 1 shows an example of an infrared thermal graph generated by the Thermal Imaging System. For comparison purposes, sizes of the cracks relative to the barrel wall thickness as well as the count of cracks for given lengths of barrels were measured.
Figure 1. An Infrared Picture Identifying Barrel-Crack Defects (the Red Areas) on an IST Coupon

3.4 Thermal shock Test Thermal shock tests were conducted per IPC-TM-650 2.6.7.2 on selected IPC coupons (Types A, B or D) including both pre-conditioned and as-received coupons. The test ran 100 cycles between -65 ~ 125 °C (15 minutes dwell and 2 minute transition). No daisy chains were used on any of these IPC coupons. Cross-sections were performed on each coupon at random locations. Again, size and number of cracks were measured the same way as performed on the IST cross-sections.
3 RESULTS AND DISCUSSIONS The IST resistance plots and cross-sectional crack measurements were analyzed to find answers to the following questions: 1. When an IST test ran for 1500 cycles without detectable resistance changes; were there any
changes as observed in the cross-section? 2. If there were detectable changes in resistance (<10%) at the end of 1500 IST cycles, what
were the observed changes in the cross-section? 3. What changes occur in the cross-sections of IST coupons when the 10% resistance change
failure limit is reached before the IST reaches 1500 cycles? 4. When IPC coupons have no cracks, what do the IST resistance curves of the corresponding
IST coupon look like for those coupons? 5. When IPC coupons have cracks, what do the IST resistance curves of the corresponding IST
coupon look like for those coupons?
4.1 IST Coupons that Had No Resistance Changes A total of 11 IST coupons associated with 4 PWB designs/fabrication lots show no significant resistance changes as presented in Figure 2. Note that 40 milliohms represents a 10% increase in resistance. A total of 7 IST coupons were cross-sectioned including coupons with and without the pre-conditioning. As was expected, no cracks were found in any sections, and no evidence of damage could be identified within the coupons, pre-conditioned or not. Representative photos have been provided in Figures 3 and 4. This means that no change in IST resistance, even after 1500 cycles, indeed correlates to crack-free cross-sections.
4.2 IST Coupons That Had Detectable Changes (<10%) at the End of 1500 Cycles There were two IST coupons from PN 0927 that showed rising resistance after 500 cycles as shown in Figure 5. When the test stopped at the 1500th cycle, the total resistance changes were about 33 ohms less than the 10% increase limit set for this investigation. Note that the graphical axis of the resistance variable was scaled such that the maximum value was approximately equivalent to a 10% increase in the coupon’s resistance values. An examination of an IST coupon (Figure 6) shows barrel cracking. This indicates that the PTH resistance changes detected by IST system as small as 33 ohms correlate to barrel cracking. Since the resistance changes began to rise much earlier than the 1500th cycle, it’s reasonable to consider that barrel degradation is responsible for the resistance rise observed in Figure 5; otherwise, the resistance curves should be as in Figure 2.

PN 0947
-20
-10
0
10
20
30
40
50
60
70
-10
20
30
40
1 101 201 301 401 501 601 701 801 901 1001 1101 1201 1301 1401IST CYCLES (Ambient ~ 150 C)
PN 0937 PN 0987
PLATED THROUGH HOLE (PTH) TEST (Sense Circuit)
0
10
PN 1077
RES
ISTA
NC
E C
HA
NG
E IN
MIL
LIO
HM
S A
T 15
0 C
RES
ISTA
NC
E C
HA
NG
E IN
MIL
LIO
HM
S A
T 15
0 C
For P
N 0
937,
098
7 an
d 10
77
For P
N 0
947
Figure 2. Resistance change of PTH barrel as a function of IST cycles. Among the 11 coupons tested, 7 coupons were subjected to 5-pass vapor-phase soldering simulation prior to IST cycling. The integrity of the barrels was confirmed by crack-free cross-sections. Coupon ID: PN 0937, SN 9-1, LDC 2700 Test conditions: 5-pass vapor phase, 1500 IST cycle
Figure 3. No cracks detected from the IST coupons PN 0937, 0947, 0987 and 1077.

Coupon ID: PN 0947, SN 4-1, Artwork TV12027A, PTH Test conditions: 5-pass vapor phase, 1500 IST cycles
Figure 4 No cracks detected from the IST coupons PN 0937, 0947, 0987 and 1077.
PLATED THROUGH HOLE (PTH) TEST FOR PN 0927(Sense Circuit)
-5
5
15
25
35
45
1 101 201 301 401 501 601 701 801 901 1001 1101 1201 1301 1401
NUMBER OF IST CYCLES (AMBIENT TO 150 C)
SN 3-3 SN 4-3
RES
ISTA
NC
E C
HA
NG
E IN
MIL
LIO
HM
S A
T 15
0 C
Figure 5. Resistance change of PTH barrel as function of IST cycles. The rising resistance implied degradation of PTH barrels. Barrel cracking was confirmed by cross-section.

Coupon ID: PN 0927, SN 4-3, LDC 0801 Test conditions: Pre-conditioned , 1500 IST cycle
Figure 6. Barrel Cracks found in Cross-section after 1500 IST cycles, corresponding to the 33 ohm change in barrel circuit resistance.
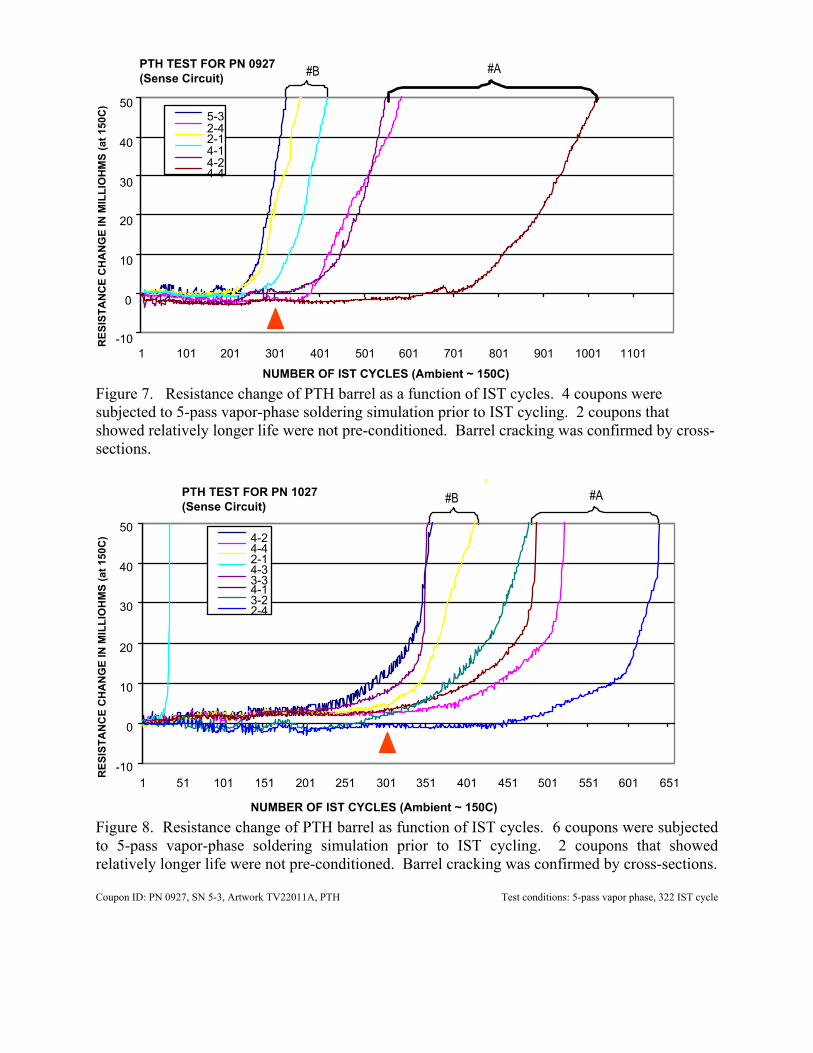
4.3 IST Coupons That Failed the 10% Criterion Using the same analysis logic, higher values in resistance changes should indicate more severe barrel cracking. This is demonstrated by Figures 7 through 10. A total of 14 coupons from PN 0927 and 1027 all show 10% resistance increase. The coupons had failed after varying amounts of IST cycles, between 39 and 1006 cycles. All of these resistance curves had a common characteristics. There is a steep rise in the slope of the resistance measurement shortly after the resistance departs from horizontal. A total of 14 cross-sections, one for each IST coupon, were performed. Large circumferential barrel cracks were identified. This finding correlates to the steep slope of the resistance curves. The cross-sections also show a consistent relationship between crack density and the failure modes. Coupon SN 4-3 (Figure 8) was the exception. It was believed that the failure in coupon SN 4-3 was fabrication defect related. The micrograph analyses could not differentiate between coupons pre-conditioned with 5-pass-vapor-phase simulation and coupons without the pre-conditioning. Cross-sectional analysis did not show differences between coupons with 300 IST cycles and coupons with 1000 cycles. These micrographs are shown in Figures 9 and 10. Note that the cross-sections were not at random locations. They were guided by the infrared thermal analyses to maximize defect-locating accuracy.
4.4 IST vs. Thermal Shock in Test Severity IPC Coupons, corresponding to IST coupons presented in Figure 2 with similar PTH properties and pre-conditioning treatment, were thermal shocked. All cross-sections showed no cracks. This was consistent with the IST finding.

There were also no cracks found post thermal shock in IPC coupons corresponding to the IST coupons in Figure 5. As analyzed in the above section, the rising IST resistance at 500 cycles should correspond to barrel cracking. Therefore, the crack-free state of coupons after thermal shock indicated that the stress induced by thermal shock is not as high as 500 IST cycles. IPC coupons corresponding to the IST coupons in Figures 7 and 8 were tested the same way as the other IPC coupons mentioned above. The cross-section results are divided into 2 groups. The “no-crack” IPC coupons correlated to the IST coupons bracketed by #A (Figure 7 and 8). The related resistance curves all have a relatively flat section extending beyond approximately 300 IST cycles. The “crack” IPC coupons correlated to the IST coupons bracketed by #B (Figure 7 and 8). The related resistance curves show rising resistance before the 300 cycle mark, a relatively low count of IST cycles. Therefore, it is reasonable to conclude 300 IST cycles from ambient to 150°C should induce the same level of fatigue stress damage, if not more as seen from the figures, as 100 cycles of thermal shock testing from -65 °C~125 °C. 300 cycles of IST testing requires 30 hours total time while 100 cycles of IPC testing requires 58 hours total time. The micrographs from thermal shocked IPC coupons indicate a crack density of about 50% of what is observed from the failed IST coupons (10% ∆ resistance). No through-wall crack or circumferential cracks are observed. Note that the cross-sections in IPC coupons are randomly located. A representative micrograph of IPC coupons is presented in Figure 11.
5 CONCLUSIONS The following conclusions were drawn: • IST resistance curves provide consistent indication of PTH barrel performance. Zero
resistance change indicates no barrel cracking. Larger resistance change indicates more severe barrel cracking.
• The IST method can be used to differentiate between production lots. Robust and weak coupons are differentiated by the number of IST-cycles achieved.
• An IST coupon with a 10% resistance increase in cross-section will show 50% more cracks than a cross-section of a coupon that has experienced 100 thermal shock cycles.
• A severity equivalence is established between IST and thermal shock. 300 IST cycles (ambient~ 150°C, 30 hours total test time) are equivalent to 100 cycle thermal shock (-65 °C~125 °C, 58 hours total test time). It’s expected that the value of 300 may be reduced in the future when there are more data available to fine tune the correlation.
IST resistance provides an indication of the reliability behavior of the PTH barrel from the on-set of degradation through the end of barrel life. The cross-section evidence supports this correlation. This means that for a given shape of a resistance curve with a given amount of resistance increase, the physical degradation may be predictable.
PTH TEST FOR PN 0927(Sense Circuit)
-10
0
10
20
30
40
50
1 101 201 301 401 501 601 701 801 901 1001 1101
5-32-42-14-14-24-4
RES
ISTA
NC
E C
HA
NG
E IN
MIL
LIO
HM
S (a
t 150
C)
NUMBER OF IST CYCLES (Ambient ~ 150C)
#A#B
Figure 7. Resistance change of PTH barrel as a function of IST cycles. 4 coupons were subjected to 5-pass vapor-phase soldering simulation prior to IST cycling. 2 coupons that showed relatively longer life were not pre-conditioned. Barrel cracking was confirmed by cross-sections.
PTH TEST FOR PN 1027(Sense Circuit)
-10
0
10
20
30
40
50
1 51 101 151 201 251 301 351 401 451 501 551 601 651
4-24-42-14-33-34-13-22-4
#B
NUMBER OF IST CYCLES (Ambient ~ 150C)
RES
ISTA
NC
E C
HA
NG
E IN
MIL
LIO
HM
S (a
t 150
C)
#A
Figure 8. Resistance change of PTH barrel as function of IST cycles. 6 coupons were subjected to 5-pass vapor-phase soldering simulation prior to IST cycling. 2 coupons that showed relatively longer life were not pre-conditioned. Barrel cracking was confirmed by cross-sections. Coupon ID: PN 0927, SN 5-3, Artwork TV22011A, PTH Test conditions: 5-pass vapor phase, 322 IST cycle

Figure 9. Large circumferential barrel crack found in cross-section of a failed IST coupon. The severity of barrel cracking relates to the 10% resistance increase. Coupon ID: PN 0927, TV22011A, PTH Test conditions: 5-pass vapor phase, IST resistance change > 10%
Figure 10. Typical PTH cracks found in coupons that failed IST test.
Barrel crack
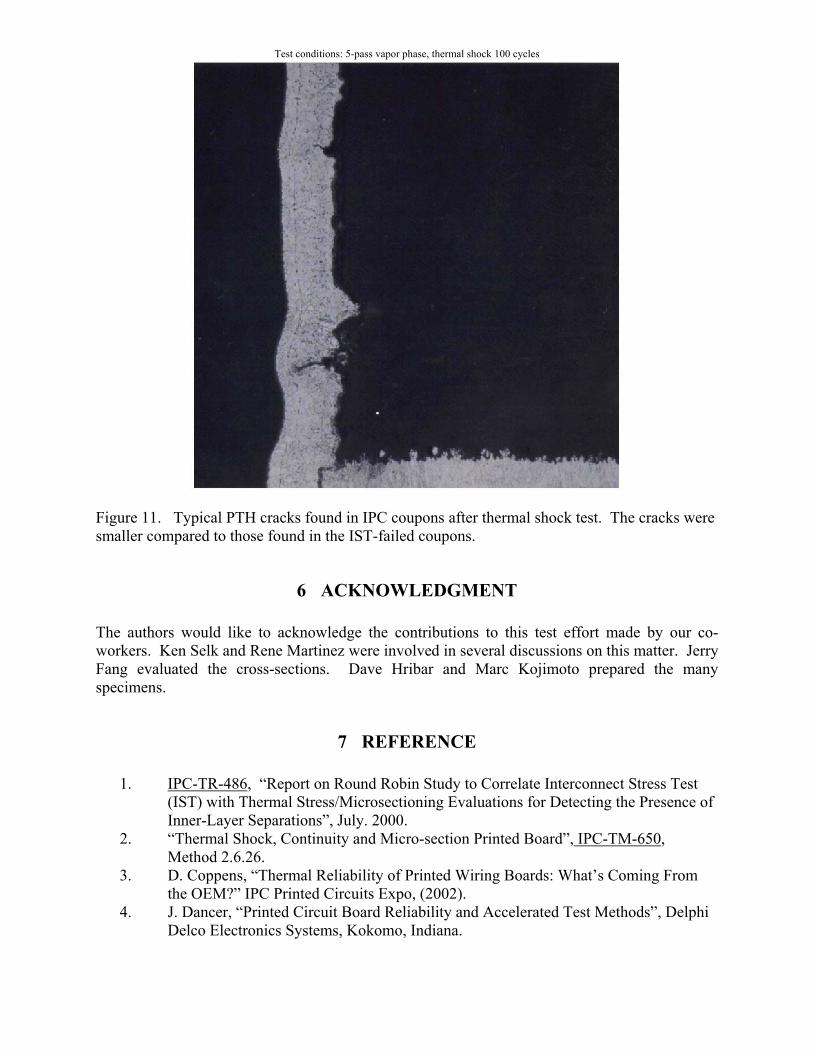
Test conditions: 5-pass vapor phase, thermal shock 100 cycles
Figure 11. Typical PTH cracks found in IPC coupons after thermal shock test. The cracks were smaller compared to those found in the IST-failed coupons.
6 ACKNOWLEDGMENT The authors would like to acknowledge the contributions to this test effort made by our co-workers. Ken Selk and Rene Martinez were involved in several discussions on this matter. Jerry Fang evaluated the cross-sections. Dave Hribar and Marc Kojimoto prepared the many specimens.
7 REFERENCE
1. IPC-TR-486, “Report on Round Robin Study to Correlate Interconnect Stress Test (IST) with Thermal Stress/Microsectioning Evaluations for Detecting the Presence of Inner-Layer Separations”, July. 2000.
2. “Thermal Shock, Continuity and Micro-section Printed Board”, IPC-TM-650, Method 2.6.26.
3. D. Coppens, “Thermal Reliability of Printed Wiring Boards: What’s Coming From the OEM?” IPC Printed Circuits Expo, (2002).
4. J. Dancer, “Printed Circuit Board Reliability and Accelerated Test Methods”, Delphi Delco Electronics Systems, Kokomo, Indiana.

5. W. Chen, “Qualification Plan: Interconnect Stress Test (IST) Technology for TRW PWB Acceptance”, D410.PM&P.00-491, Northrop Grumman, Redondo Beach, California, (2000).
6. W. Chen, “Qualification Test Results, I: Status of IST Evaluation on 1st lot of Type 3 (Regular Multilayer) PWBs, D410.PM&P.00-492, Northrop Grumman, Redondo Beach, California, (2000).
8 BIOGRAPHIES Wennei Y. Chen is a Staff Engineer within the Electronics Production Technology Department of Northrop Grumman. Prior employment was as a senior engineer with the Advanced Materials and Systems Division of Dupont. She has a Ph.D. and a M.S. in Mechanical Engineering from the University of Delaware with an emphasis on composites. Her undergraduate study was mostly done at the South China Institute of Technology. Bill D. Bjorndahl is currently director of Electronic Production for Northrop Grumman Space Technology within Production and Supply Chain Management. Bill attended Pierce Junior College in the San Fernando Valley and then UCLA where he obtained a B.S. in Biochemistry and an M.S. and Ph.D. in Engineering. His primary interests outside of work and his family are surfing, text processing, graphic arts and programming. Ronald R. Carter started working with Sperry corporation (now know as Unisys) in 1964 in their newly formed Printed Circuit Board fabrication facility. Ron held several management and engineering positions while with Unisys before moving to Intergraph Corporation in Huntsville, AL. Ron worked with Intergraph as a process engineer until 1998 at which time Ron came to PMTEC / IIT Research Institute (IIT is now Alion Science and Technology). Ron is the project manager for the IST testing and failure analysis work at PMTEC. Brian E. Parrish is a Northrop-Grumman (formerly TRW) 6-sigma green-belt staff engineer working in electronics packaging of digital, mixed signal and mmW devices since 1991. His products have been connectors, single and multi chip modules, circuit boards, antennas, units and general design processes. He holds two patents and two degrees; a B.S. in Mechanical Engineering in 1993 and a M.S. in Mechanical Engineering in 1998.