principles of visual design - medieninformatik · pdf fileprinciples of visual design lucia...
TRANSCRIPT

Page 1 Smart Graphics - SS07 - Design
Principles of Visual Design
Lucia Terrenghi
Page 2 Smart Graphics - SS07 - Design
Talk about rules in design
No fixed rules
Just guidelines, principles
Where do they come from?
How can I apply them?

Page 3 Smart Graphics - SS07 - Design
Outline
Origins of the principles
The world as information
display, the foraging theory
of information
Strategies of visual design
for effective and efficient
communication
Principles and tools of visual
design
Page 4 Smart Graphics - SS07 - Design
Scientific basis for design guidelines
Perception
Evolution of perception
system
What is perception good for?
Page 5 Smart Graphics - SS07 - Design
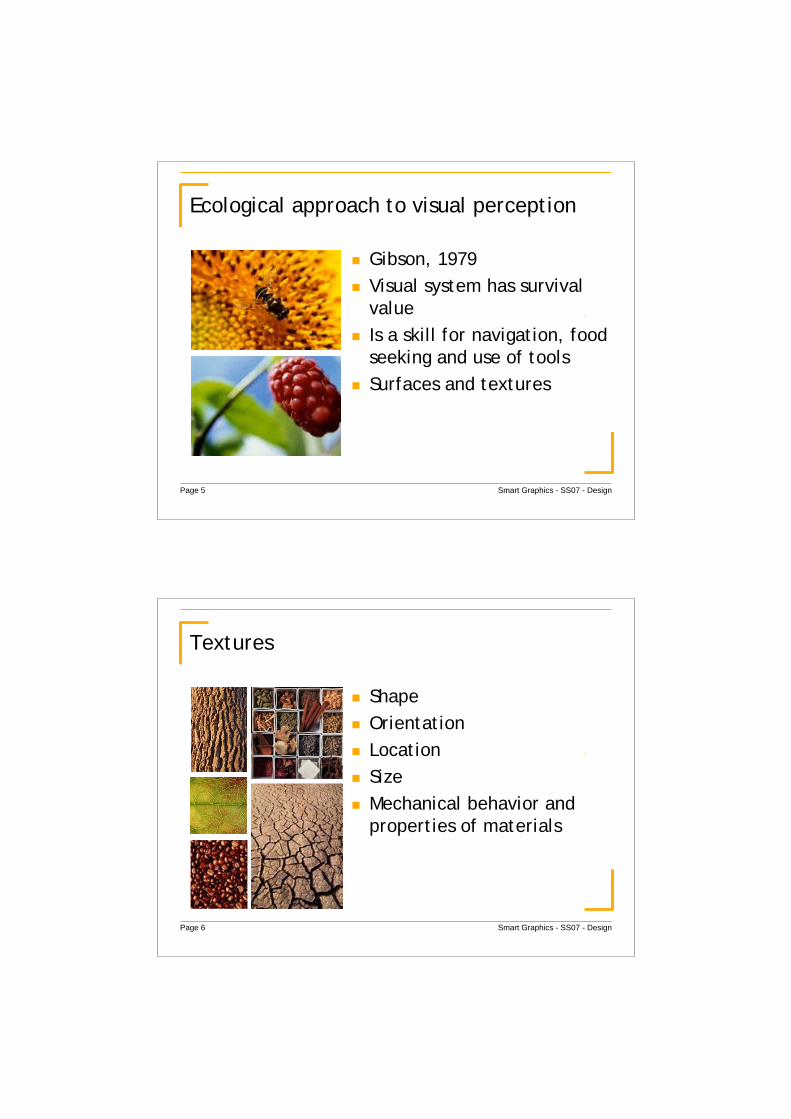
Ecological approach to visual perception
Gibson, 1979
Visual system has survival
value
Is a skill for navigation, food
seeking and use of tools
Surfaces and textures
Page 6 Smart Graphics - SS07 - Design
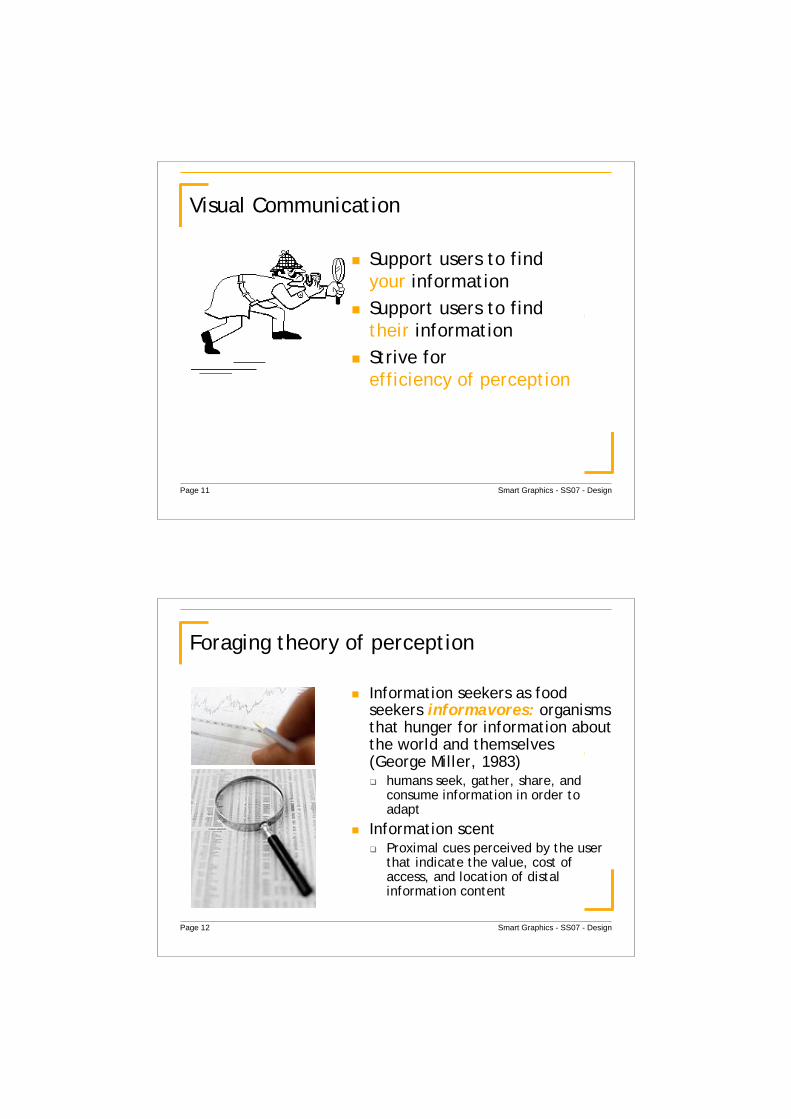
Textures
Shape
Orientation
Location
Size
Mechanical behavior and
properties of materials

Page 7 Smart Graphics - SS07 - Design
Affordances
Aspects of an object which
suggest how the object
should be used; a visual clue
to its function and use
Essentials for understanding
the potential for interaction
and manipulation in the
environment
Page 8 Smart Graphics - SS07 - Design
World as information display
An affordance is something
of both actual and perceived
properties (perception and
action based on human
attributes)

Page 9 Smart Graphics - SS07 - Design
Design as a language
Communication of a message
Implies understanding the
audience
Implies confidence with
grammar, logic, vocabulary,
expressions
Varies depending on the
medium
Page 10 Smart Graphics - SS07 - Design
Playing with the „World Display“
„dall’ orto all’arte“, advertising campaign by Armando Testa 1995
Page 11 Smart Graphics - SS07 - Design
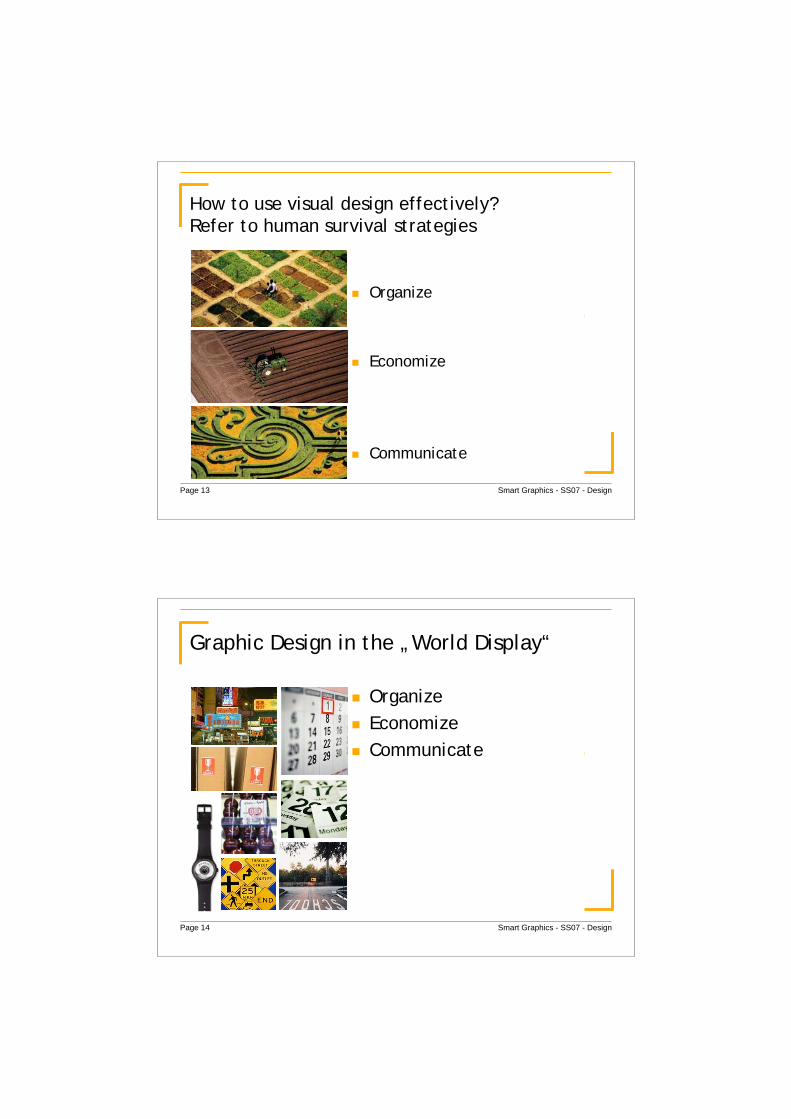
Visual Communication
Support users to find
your information
Support users to find
their information
Strive for
efficiency of perception
Page 12 Smart Graphics - SS07 - Design
Foraging theory of perception
Information seekers as foodseekers informavores: organismsthat hunger for information aboutthe world and themselves(George Miller, 1983)
humans seek, gather, share, andconsume information in order toadapt
Information scentProximal cues perceived by the userthat indicate the value, cost ofaccess, and location of distalinformation content
Page 13 Smart Graphics - SS07 - Design
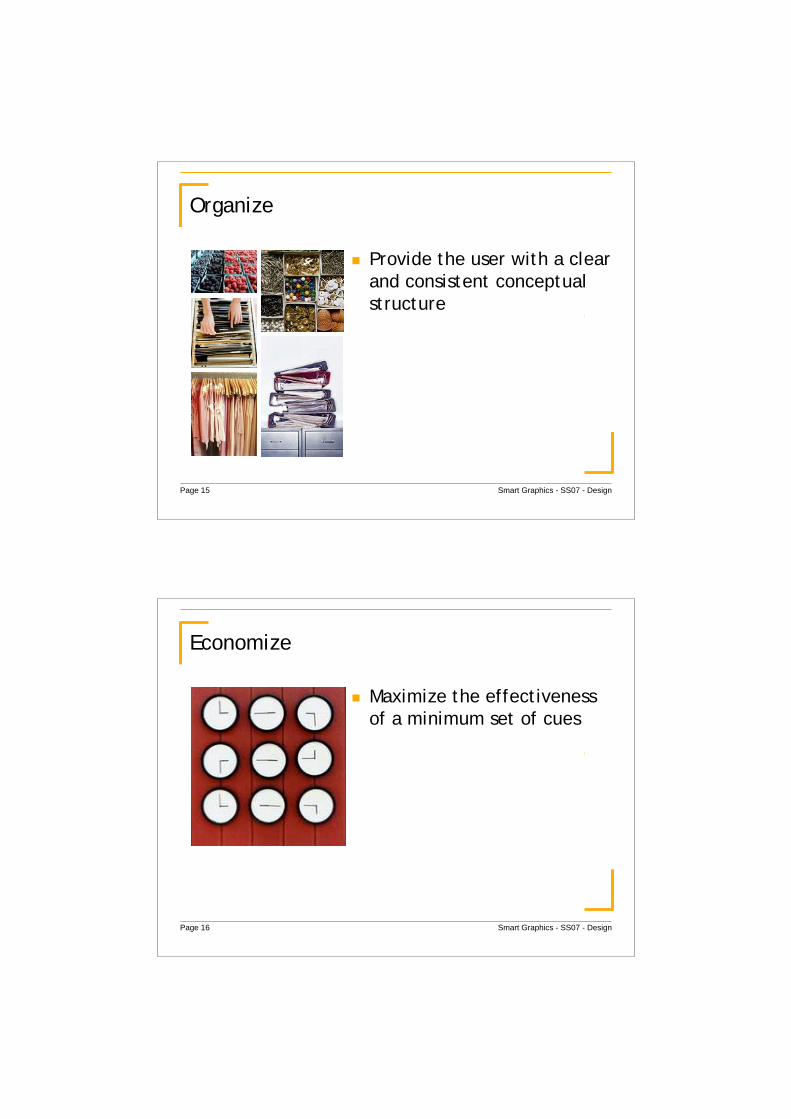
How to use visual design effectively?
Organize
Economize
Communicate
Refer to human survival strategies
Page 14 Smart Graphics - SS07 - Design
Graphic Design in the „World Display“
Organize
Economize
Communicate
Page 15 Smart Graphics - SS07 - Design
Organize
Provide the user with a clear
and consistent conceptual
structure
Page 16 Smart Graphics - SS07 - Design
Economize
Maximize the effectiveness
of a minimum set of cues

Page 17 Smart Graphics - SS07 - Design
Communicate
Match the presentation to
the capabilities of the user
Page 18 Smart Graphics - SS07 - Design
Entities of a visual language
Layout
Typography
Color and texture
Imagery
Animation
Sequencing
Sound
Visual identity

Page 19 Smart Graphics - SS07 - Design
Organization
„To Design is to plan and
organize, to order,
to relate, and to control“
Joseph Albers, 1975
Sub-principles
Consistency
Screen layout
Relationships
Navigability
Page 20 Smart Graphics - SS07 - Design
Page 21 Smart Graphics - SS07 - Design
Page 22 Smart Graphics - SS07 - Design
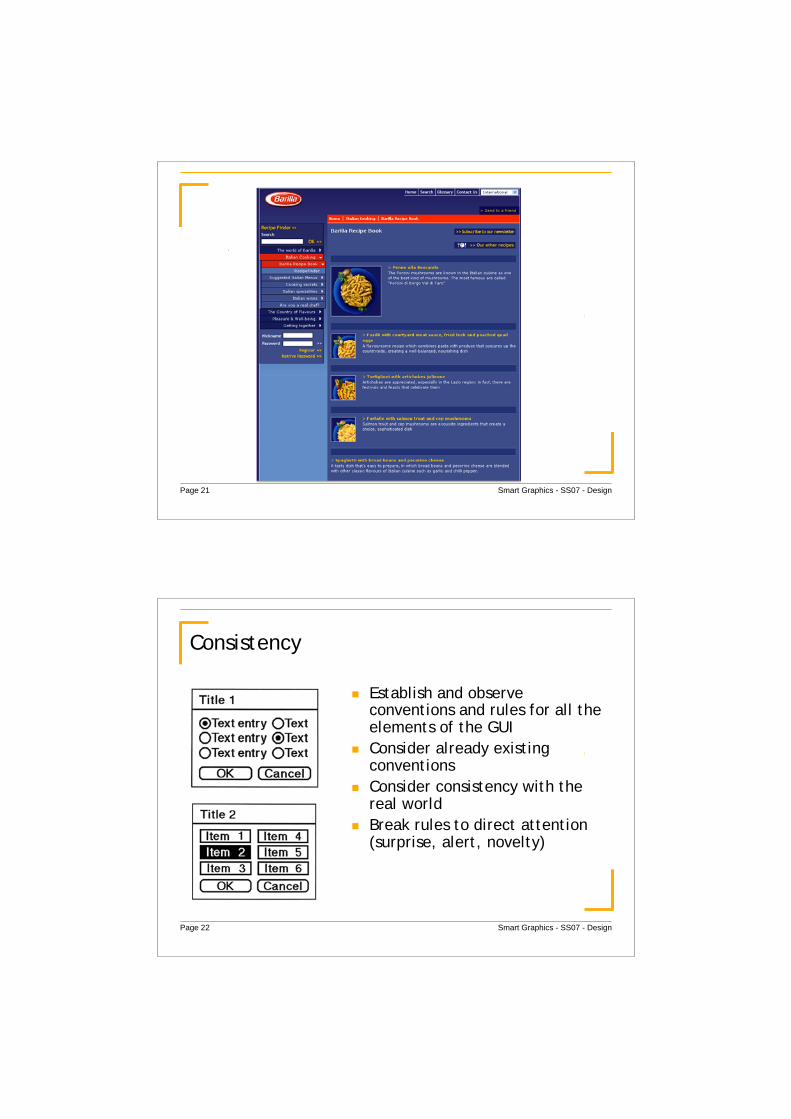
Consistency
Establish and observeconventions and rules for all theelements of the GUI
Consider already existingconventions
Consider consistency with thereal world
Break rules to direct attention(surprise, alert, novelty)

Page 23 Smart Graphics - SS07 - Design
Screen layout
Structure the display byclarifying the relation ofwindows, menus, dialogue boxes,control panels
Isolate control, data, status orfeedback regions with the display
Ensure that frequent buttransient objects appear in apredictable location
Page 24 Smart Graphics - SS07 - Design
Grids: purpose
Unify design by imposing a
structure
Provide a basis for controlled
variation in layout components
Simplify development by
reducing uncertainty about
object location, extent, and
orientation

Page 25 Smart Graphics - SS07 - Design
Grid development
Identify objects to be arranged
Identify display constraints
Determine measuring units(e.g., text size)
Explore relation of objects
Define semantic areas
Draw guidelines
Develop single basic layoutscheme
Align major object groups withmajor grid subdivisions
Page 26 Smart Graphics - SS07 - Design
Grids
Incorporate complex rhythms
and indicate spaces between
objects
Define how objects are related
Ensure that comparable objects
are placed consistently across
displays
Page 27 Smart Graphics - SS07 - Design
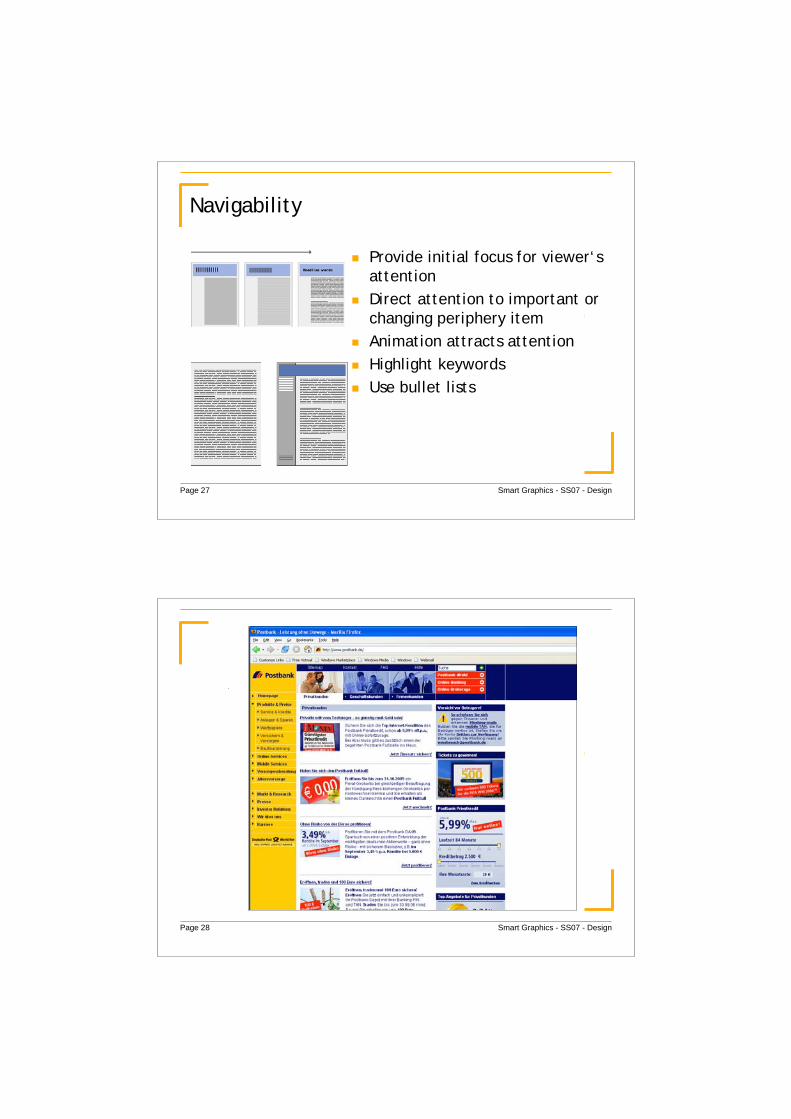
Navigability
Provide initial focus for viewer‘s
attention
Direct attention to important or
changing periphery item
Animation attracts attention
Highlight keywords
Use bullet lists
Page 28 Smart Graphics - SS07 - Design
Page 29 Smart Graphics - SS07 - Design
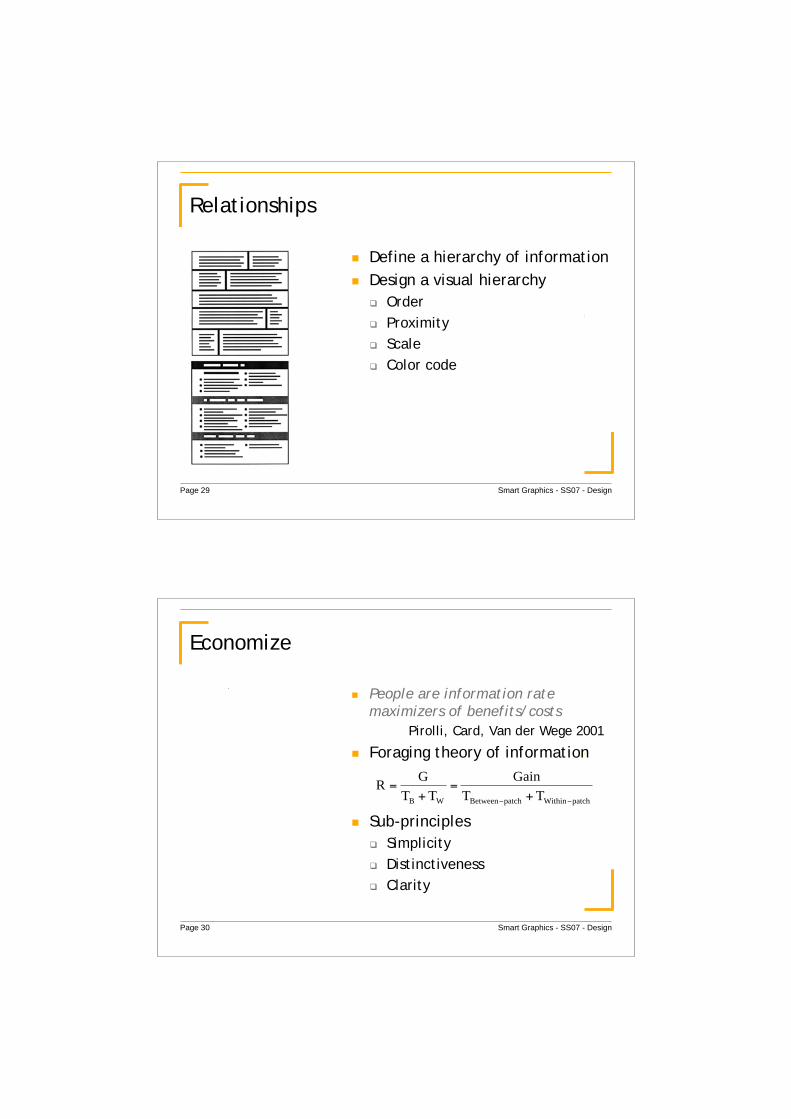
Relationships
Define a hierarchy of information
Design a visual hierarchy
Order
Proximity
Scale
Color code
Page 30 Smart Graphics - SS07 - Design
Economize
People are information rate
maximizers of benefits/costs
Pirolli, Card, Van der Wege 2001
Foraging theory of information
Sub-principles
Simplicity
Distinctiveness
Clarity
patchWithinpatchBetweenWB TT
Gain
TT
GR
+=
+=

Page 31 Smart Graphics - SS07 - Design
Page 32 Smart Graphics - SS07 - Design
Simplicity
Fewer controls/choices to be
taken make the interface
easier
Minimize number of controls
(Miller’s law ±7)
Include only elements that
are essential for
communication

Page 33 Smart Graphics - SS07 - Design
Distinctiveness
Make most important
elements easily perceivable
Saliency
Page 34 Smart Graphics - SS07 - Design
Clarity
Avoid ambiguity

Page 35 Smart Graphics - SS07 - Design
Communicate
Communication is a social process
within a specified context in which
signs are produced, transmitted,
perceived and treated as messages from
which meaning can be inferred.
Sub-principles
Legibility
Readability
Typography
Symbolism
Multiple views
Color/texture
Mexico City subway pictograms
Page 36 Smart Graphics - SS07 - Design
Legibility
Design characters, symbols, and
graphic elements to be easily
noticeable and distinguishable
Select visualization techniques
that are appopriate for the
output display technology
Use color with high contrastbetween the text and the
background

Page 37 Smart Graphics - SS07 - Design
Readability
Design a comprehensible
display, i.e. easy to identify
and interpret
Use concise writing
Use summaries
It is important to design a
readable display. This
improves the navigability of
the page and increases
perception efficiency.
It is important to design a
readable display.
This improves the navigability
of the page and increases
perception efficiency.
Page 38 Smart Graphics - SS07 - Design
Typography
At most 3 fonts in a page
choose suitable legibility,
clarity and distinctiveness to
differentiate classes of
information
Consider the media
in print: usually sans serif for
titles and serif for body text
on a monitor: sans serif is easier
to read
Arial
Helvetica
Times New Roman
Courier
Arial
Helvetica
Times New Roman
Courier
Arial
Helvetica
Times New Roman
Courier

Page 39 Smart Graphics - SS07 - Design
Typography
Select appropriate
alphanumerics, punctuation,
and symbols for each
typeface
Adjust character, word and
line spacing and
paragraphing, to enhance
readability of critical
information
i. Topic 1
i. Subtopic 1.1
ii. Topic 2
i. Subtopic 2.1.
iii. Topic 3
i. Subtopic 3.1.
Topic 1
Subtopic 1.1
Topic 2
Subtopic 2.1.
Topic 3
Subtopic 3.1.
Page 40 Smart Graphics - SS07 - Design
Typography
Use 1-3 sizes
Set text flush left
Set numbers flush right
Avoid centered text
Avoid short justified text
User upper and lowercase
characters
Avoid all capitalized lines of
text
Set
text
flush
left
Set
numbers
flush
right
Avoid
centered
text
Avoid short
justified text
AVOID CAPITALIZED LINES
OF TEXT
Avoid dangling words after line
breaks

Page 41 Smart Graphics - SS07 - Design
Symbolism
Use appropriate bullets, rules,
charts, maps, diagrams,
pictograms, and ideograms to
communicate clearly the
intended meaning
0
10
20
30
40
50
60
70
80
90
1st Qtr 2nd Qtr 3rd Qtr 4th Qtr
East
West
North
Page 42 Smart Graphics - SS07 - Design
Thank you.
Questions?