principles and analytical applications of phase-transfer catalysis introduction
TRANSCRIPT

ISSN-1680-9955
Pak. J. Anal. Envir. Chem. Vol. 7, No. 1, (2006) 1 � 7
Principles and Analytical Applications of Phase-Transfer Catalysis
YIANNIS C. FIAMEGOS, CONSTANTINE D. STALIKAS* AND MILTIADIS I. KARAYANNIS Laboratory of Analytical Chemistry, Department of Chemistry, University of Ioannina, Ioannina 451 10, Greece
*E-mail: [email protected]
Abstract Phase-transfer catalysis (PTC) has been widely used for the synthesis of organic compounds for more than three decades. The scope and mechanistic features of PTC have been the aim of numerous studies. This review is approaching the subject by focusing on the extraction-preconcentration-derivatization prior to analysis, reporting recent progress made. Moreover an attempt is made to approach the salient aspects of PTC modes including a brief review of mechanistic pathways and kinetics pointing out the potency of PTC in analytical chemistry. Optimization guidelines for PTC-based analysis are given with respect to all parameters influencing the analytical method under development, highlighting the capabilities and limitations of PTC reactions. Keywords: phase-transfer catalysis, analytical applications.
Introduction Isolation and preconcentration of analytes by liquid-liquid extraction is a rather popular sample pretreatment technique in trace analysis for the removal of interferences. Classical solvent exchange consists in bringing into contact two immiscible solvents such as water and an organic one transferring solutes from one liquid phase to the other. Based on the assumption that a reaction between lipophilic and hydrophilic reactants is facilitated by enhancement of mutual solubility, the transfer of a solute between phases is crucial for the establishment of liquid-liquid distribution equilibria [1]. Thus, high transfer rate is required, which can be achieved by increasing the area of the interface [2]. Phase-Transfer Catalysis (PTC) is a well-known method of promoting reactions between reagents with opposite solubility preferences. In such systems each reactant is dissolved in the appropriate solvent. Commonly, the two solvents are immiscible to one another, and then a phase-transfer catalyst is added to facilitate the transport of one reactant into the other phase.
By means of the catalytic step, the enhanced reactivity between the ionic species leads to increase of the rate of the desired reaction. The unique characteristics of phase-transfer catalysis are essential for developing analytical applications and thus PTC has been implemented as a tool for the simultaneous extraction, preconcentration and derivatization in the analysis of certain organic and inorganic compounds. The multiple aspects of PTC in analytical chemistry can be considered in a general-purpose review, but the aim of this brief one is twofold: Firstly to present certain developed analytical applications based on PTC. Secondly, to present the theoretical background of the overall process giving in short, some kinetic and mechanistic properties of the most common applications published. Historical Development and Principles In the seventies, PTC became a method for overcoming problems of mutual solubility with simultaneous activation of anions [3] and was *Author for Correspondence

Pak. J. Anal. Envir. Chem. Vol. 7, No. 1, (2006)
2
2
Aqueous phase Q+Y� + X� Y� + Q+X�
Interface Organic phase QY + RX RY + QX
originally employed for reactions between ionic compounds and organic, water insoluble substances in solvents of low polarity [4]. Later, PTC included extraction of cations or even neutral molecules from one phase into another by means of the catalyst. �Inverse� phase-transfer-catalyzed extraction of species into the water phase was also studied using partially water-soluble pyridines [5,6]. The mechanism of PTC reaction was first proposed in 1971 [7]. According to Starks� original work, a quaternary ammonium halide dissolved in the aqueous phase (Q+X�) undergoes anion exchange with the anion of the reactant dissolved in the aqueous solution. The ion-pair formed (Q+Y�) can cross the liquid-liquid interface due to its lipophilic nature and diffuses from the interface into the organic phase, this step being the �phase-transfer�. In the organic phase, the anion of the ion-pair being quite nucleophilic undergoes a nucleophilic substitution reaction with the organic reagent forming the desired product (RY). The catalyst subsequently returns to the aqueous phase and the cycle continues. An overview of PTC reactions is given in the scheme bellow: A prerequisite for a substance to function as a PT-Catalyst is to form ion-pairs soluble in the organic phase and to be transferred in a highly active state [8,9]. High extraction constant values for the ion-pair are obtained as lipophilic chain of quaternary onium cations is elongated [10,11]. An important issue that dictates reactivity is the solvation. The amount of water that is co-extracted with the ion-pair into the organic phase may interfere with the desired reaction. Reducing the hydration sphere of the anion or using solid-liquid PTC conditions can overcome this drawback. As this mode presupposes water-free reactions, it found few followers in the field of analytical chemistry. Such applications are the determination of carboxylic acids [12], the quantitation of acidic tryptophan metabolites [13],
the determination of 5-fluorouracil in plasma [14] and uracil in DNA [15], the analysis of long chain fatty acids [16] and the simultaneous determination of trace levels of haloacetic acids in biological samples as their pentafluorobenzyl derivatives [17]. Other mechanisms that can be considered as phase-transfer catalytic are: 1. PTC of uncharged species: complexation and
transfer of uncharged protic species or metal salts into the organic medium as complexes of the phase -transfer agent [18].
2. Electron-transfer catalysis for Redox systems [19-22].
3. metal ion-transfer from aqueous solutions into water-immiscible ionic liquids containing neutral complexing agents [23].
4. Pyrolytic alkylation process, whereby thermal decomposition of a quaternary ammonium salt yields a volatile alkyl derivative in the heated injector of a gas chromatograph [22].
The PTC techniques have, in principle, been used in connection with separation analytical methods, with gas and liquid chromatography being the main applications. De Ruiter and Lingeman in the �Handbook of phase-transfer catalysis� provide significant reference on analysis by PTC [18]. It should be clear that only recent and significant analytical PTC derivatizations are included in this review article. Phase-Transfer Catalysis Phase transfer catalysts can be either homogeneous (soluble in one or both solvents) or heterogeneous. Homogenous PTC applications Quaternary ammonium, phosphonium and arsonium salts (generally termed �onium� salts) provide a source of singly charged lipophilic cations. In general, catalyst efficiency is influenced by the large number of carbon atoms (high lipophilicity) and the symmetry of the carbon atom chains about the heteroatom.

Pak. J. Anal. Envir. Chem. Vol. 7, No. 1, (2006)
3
3
Homogenous PTC is based on the mechanism described in paragraph 2 and according to this a number of applications have been developed. Chlopyralid in soil samples, was analyzed by GC-MS after its reaction with tetrabutylam-monium hydroxide [24]. Aliphatic alcohols were derivatized to dithiocarbonates and determined by capillary zone electrophoresis [25]. Alkylphenols were converted to their 4-tetrafluoropyridyl derivatives and analyzed with GC-MS [26]. Urine saliva and hair extracted smoke uptake parameters (thiocyanate, nicotine and cotinine) were determined with GC after their PTC pentafluor-obenzylation [27]. Haloacetic acids have been methylated and analyzed by a static headspace GC-MS method [28] while organic acids were rapidly methylated and extracted using supercritical carbon dioxide containing methylation reagents and PTC [29, 30].
In this concept, PTC was used for the analysis of carboxylic acids [31-33] acidic herbicides [22,34], diuretics, urinary acidic moieties and buprenorfine [35-38], ethylene thiourea [39], sulphide, polysulphides, cyanide, and thiocyanate [40-43], nitrate, nitrite [44,45], methanol [46], iodide, cyanide, nitrite and thiocyanate [47,48], levorphanol [49], phenols [50], phenoxyacetic acids [51] and perfluoro-octanoic acid [52]. The cryptates like Kryptofix 222, and the so-called �polypodes� [53] and �octopus molecules� [54,55] were not widly used as catalysts, because they are difficult to prepare and most of them are commercially unavailable. Tertiary amines (e.g. triethylamine) can form in situ onium salts acting as PTCs. In this context, phenols [56] methamphetamine and amphetamine [57] were GC analyzed after derivatization with triethylamine. Additionally, phenylacetic acid in human plasma was determined by a PTC-based method [58], while a precolumn derivatization method with Nile Blue in the presence of 2-chloro-1-methylpyridinium iodide and triethylamine, as catalyst was used for the determination of acids.
Heterogenous PTC applications
PTCs linked to a polymer matrix are described as heterogenous catalysts [59]. Many materials have been developed in this context, some of them specialized to catalyze specific reactions [60-62]. In this case, the catalyst is bonded to a matrix forming a third immiscible solid phase between the organic and aqueous ones involving a swelling, mixing and diffusion during the reaction. Due to diffusion retardation, reactions with slow intrinsic reaction rates are much slower with a tri-phase catalyst than with its homogeneous counterpart [11,32]. On the other hand, the use of tri-phase PTC simplifies the removal of the catalyst after the reaction which can be re-used until they lose their mechanical stability [9,63,64]. In general, a polymer-supported catalyst consists of a hydrophobic polymer backbone solvated in the organic solvent and a hydrophilic part containing water and the nucleophile. In agreement to the extraction mechanism for homogenous PTC reactions, phase-transfer cycle in a tri-phase PTC consists of an ion-exchange step in the aqueous phase followed by the reaction in the organic-phase. A major difference between the two mechanisms is that in a tri-phase PTC system the catalyst movement is restricted and the organic and aqueous reagents must be brought to the catalyst cation. The catalyst structure and loading, the spacer chain, the polymer structure, the agitation and the swelling power of the solvent, the concentration of reactant, the type of the anion, the organic leaving group and the catalyst cation are some of the criteria that should be considered in tri-phase PTC. Application of polymeric bonded PTC for the determination of cyanide, iodide, nitrite, sulphide and thiocyanate, led to easy layer separation and PTC-free injection of the sample into the chromatograph [65, 66]. Tributylbenzylammonium bromide was used for the determination of tetrahydroiso-quinolines [67]. Cyanuric acid which is a highly polar, hydrophilic molecule was simultaneously extracted-preconcentrated and derivatized under tri-phase PTC conditions [64]. Anionic organic compounds in aqueous samples were analyzed by

Pak. J. Anal. Envir. Chem. Vol. 7, No. 1, (2006)
4
4
extractive pentafluorob-enzylation using tri-n-butylmethylphosphonium salt [68]. Phenolates were also derivatized with considerable yields in a range of acidity (from thymol to pentachlorophenol) and polarity (from resorcinol to pentachlorophenol) [69]. Tri-phase PTC was also used for the determination of: carboxylic acids [70], 4-hydroxycoumarin anticoagulants [71], amino acids and peptides [72], dialkylphosphates, carboxylic acids and phenols [73], fluoroacetic acid and phenoxy acid herbicides [74], alkylmethylp-hosphonic acids [75], azide, cyanide and thiocyanate [76], phenolic acids and flavonoids [77]. Kinetics and Interfacial Phenomena in PTC Small amounts of PT catalyst in extremely slow reactions between components existing in two immiscible phases are usually sufficient to accelerate them. This capability strongly depends on: i) The distribution equilibrium of the PTC in
the two phases, ii) The mass-transfer rate between the imiscible
phases and iii) The reaction rate in the organic phase. The distribution of quaternary salts and their surface activity near the interface between the two media is a critical factor for the reaction [78-80]. The interfacial area depends on the rate of stirring and affects the position of the extraction equilibrium of the ion-pairs [79]. Kinetics and mechanism in homogenous phase-transfer catalysis, under vigorous agitation conditions, have been reviewed [81]. The reaction rate strongly depends on the distribution ratio DQY as given below. [Q+Y�]org DQY = = Kex(QY) . [Q
+] [Y�] where Q+ is the counter ion, Y� is the nucleophilic anion, Kex(QY) is the extraction constant and DQY is the distribution ratio of the ion-pair Q+Y�. From
this equation is obvious that the distribution ratio depends on the concentration of Q+ and the extraction constant, Kex(QY). The reaction mixture requires a minimum stirring speed to achieve optimum phase contact. Under these conditions it is assumed that the phases are in equilibrium with each other. In this vain, the rate of the overall reaction is controlled by the reaction in the organic phase which is a pseudo-first-order reaction [10]. Rate = kobs [QY]org , where kobs is the pseudo-first-order reaction rate constant. The solvation of polar analytes by water molecules, in polar solvents affects the anionic reactivity significantly. Wu et al assessed the extraction behaviour of various quaternary salts in the presence of NaOH based on their respective distribution data from aqueous solution to dichloromethane or chlorobenzene [82]. In tri-phase PTC there are various parameters affecting the overall behaviour of the reaction [83-87]. Ion-exchange kinetics, mass transfer of reactants in the bulk aqueous and organic phases as well as diffusion of reactants within the catalyst are seriously considered. It is commonly suggested that the ion-exchange reaction is very fast and thus is always in equilibrium. As a result, the mass transfer of reactants, the intraparticle diffusion of reactants, and the intrinsic organic reaction rate at the active sites determines the reaction rate. Research studies have assumed that this kind of PTC reactions have as rate limiting step the intrinsic reaction rate at the catalyst�s active sites [83,88,89]. The overall rate of reaction between an organic substrate RX and an inorganic nucleophile Y� to form organic product RY in the presence of tri-phase catalyst QX, depends on the concentrations of RX and Q+Y�: Rate = korg [RX]org[Q
+Y�]s where [RX]org is the concentration of the reactant in the organic phase and [Q+Y�]s the concentration of ion-pair (nucleophile) in the catalytic sites.
Pak. J. Anal. Envir. Chem. Vol. 7, No. 1, (2006)
5
5
Method Development
Several factors affect the reaction rate and derivatization yield of simple PTC reactions like the one between an organic reagent and an analyte. These factors are: the structure of R groups, the activity of the leaving group, the nucleophilicity of the group analyte, the relative transfer efficiency of the analyte between phases, the organic solvent type, the reagent concentration, the agitation intensity and the temperature. In general, heterogenous PTC have a lower reactivity compared to their soluble analogs although there are specific reaction conditions under which the supported catalysts perform better than their soluble counterparts [9,64]. Optimization of the reaction conditions for the development of a PTC-based analytical method, include parameters such as pH, kind of solvent and catalyst, the concentration of the organic reagent, the phase ratio and volumes, the reaction time, the temperature and the agitation. Compounds with more than one labile protons lead to the formation of several derivatives making the overall procedure more complicated. In this case, careful optimization of the reaction conditions is required in order to move the reaction to the desired products. Literature search shows that analysts can acquire good performance with economical and multiple-use instruments such as GC and HPLC by expedient sample extraction-derivatization-preconcentration. Finally, of paramount importance are the study of interferences to the derivatization rate and the extent of conversion. Usually, interferences are associated with co-existing nucleophilic anions like Cl� which can be avoided by mercury(II) complexation and dilution [90]. Conclusions Method-development strategies usually discount analytical derivatization at the outset because of additional steps, excess of reagent and the concomitant potential for interferences. However, there are numerous examples where analytical derivatizations are called for to enhance sensitivity, selectivity, extraction efficiency and overall quality of the data. Improvements resulting
from derivatization in instrumental methods are well known. The development of automated and/or miniaturized techniques in connection with the measuring analytical devices at hand, demonstrated that the concerns regarding extra steps and time requirements are not necessarily at issue. Derivatization of the analytes in a PTC system looks more advantageous than conventional techniques such as time-consuming extraction procedures. In the domain of analytical chemistry, PTC methods offer extraction-preconcentration and derivatization of analytes in one step increasing detection sensitivity. In this way, analysts can obtain high performance with economical and multiple-use instruments such as GC and HPLC. It can, therefore, be regarded a promising technique focussed on the analytical chemistry solution reactions. References 1. B. Tremillon, In: Reactions in solutions. An
applied analytical approach. J. Wiley (Eds.), Chichester, (1997).
2. C. A. Bunton, In: Surfactant Science Series; M. Gratzel, K. Kalyanasundaram, Eds.; Marcel Dekker, Inc.: New York, Vol. 38 (1991).
3. E. V. Dehmlow, Angew. Chem. Int. Ed. Eng., 16 (1977) 493.
4. D. R. Knapp, In: Analytical Derivatization Reactions. J. Wiley (Eds.), New York, 1979.
5. C. -S. Kuo, J. -J. Jwo, J. Org. Chem., 57 (1992) 1991.
6. B. Boyer, A. Hambardzoumian, G. Lamaty, A. Leydet, J. -P. Roque, P. Bouchet, New J. Chem., 20 (1996) 985.
7. C. M. Starks, J. Am. Chem. Soc., 93 (1971) 195.
8. C. De Ruiter, R. Otten, U. Brinkman, R. Frei, J. Chromatogr., 436 (1988) 429.
9. H. J. Glatzer, L. K. Doraiswamy, Chem. Engin. Sci., 55 (2000) 5149.
10. E. V. Dehmlow, S. S. Dehmlow, In: Phase-Transfer Catalysis, VCH: Weinheim and New York, (1993).
11. C. M. Starks, C. L. Liotta, M. Halpern, In: Phase-Transfer Catalysis: Fundamentals, Applications and Industrial Perspectives, Chapman & Hall, (1994).

Pak. J. Anal. Envir. Chem. Vol. 7, No. 1, (2006)
6
6
12. A. Arbin, H. Brink, J. Vessman, J. Chromatogr. A, 196 (1980) 255.
13. D. B. Naritsin, B. R. L., S. P. Markey, Anal. Chem., 67 (1995) 863.
14. K. Wang, M. Nano, T. Mulligen, E. D. Bush, R. W. Edom, J. Am. Soc. Mass Spectrom., 9 (1998) 970.
15. J. Ren, A. Ulvik, H. Refsum, P. M. Ueland, Anal. Chem., 74 (2002) 295.
16. C. Y. Lu, H. L. Wu, S. H. Chen, H. S. Kou, Chromatographia, 51 (2000) 315.
17. M. Jia, W. W. Wu, R. A. Yost, P. A. Chadik, P. W. Stacpoole, G. N. Henderson, Anal. Chem., 75 (2003) 4065.
18. Y. Sasson, R. Neumann, In: Handbook of Phase Transfer Catalysis, Blackie Academic, Glasgow (1997).
19. G. Rothenberg, G. Barak, Y. Sasson, Tetrahedron, 55 (1999) 6301.
20. T. Endo, Y. Saotome, M. Okawara, J. Am. Chem. Soc., 106 (1984) 1124.
21. K. K. Park, C. H. Oh, W. K. Joung, Tetrahedron Lett., 34 (1993) 7445.
22. M. Rompa, E. Kremer, B. Zygmunt, Anal. Bioanal. Chem., 377 (2003) 590.
23. M. P. Jensen, J. A. Dzielawa, P. Rickert, M.L. Dietz, J. Am. Chem. Soc., 124 (2002) 10664.
24. S. Schutz, H. Vedder, R. -A. During, B. Weissbecker, H.E. Hummel, J. Chromatogr. A, 754 (1996) 265.
25. W. Lee, L. Liu, D. Lau, R. Chan, Anal. Lett., 32 (1999) 1235.
26. M. Kojima, S. Tsunoi, M. Tanaka, J. Chromatogr. A, 984 (2003) 237.
27. J. Torano, H. Van Kan, Analyst, 128 (2003) 838.
28. P. L. Neitzel, W. Walther, W. Nestler, Fresenius J. Anal. Chem., 361 (1998) 318.
29. V. Lopes-Avila, N. S. Dodhiwala, W. F. Beckert, J. Agric. Food Chem., 41 (1993) 2038.
30. M. Y. Croft, E. J. Murby, R. J. Wells, Anal. Chem., 66 (1994) 4459.
31. Y. L'emeillat, J. F. Menez, F. Berthou, L. Bardou, J. Chromatogr. A, 206 (1981) 89.
32. M. K. Bicking, N. A. Adinolfe, J. Chromatogr. Sci., 23 (1985) 348.
33. S. Jacobsson, A. Larsson, A. Arbin, A. Hagman, J. Chromatogr., 447 (1988) 329.
34. H. D. Meiring, G. den Engelsman, A. P. J. M. de Jong, J. Chromatogr. A, 644 (1993) 357.
35. A. M. Lisi, G. J. Trout, R. Kazlauskas, J. Chromatogr. B, 563 (1991) 257.
36. A. M. Lisi, R. Kazlauskas, G. J. Trout, J. Chromatogr. B, 581 (1992) 57.
37. A. M. Lisi, R. Kazlauskas, G. J. Trout, J. Chromatogr. B, 617 (1993) 265.
38. A. M. Lisi, R. Kazlauskas, G. J. Trout, J. Chromatogr. B, 692 (1997) 67.
39. H. D. Meiring, A. P. J. M. de Jong, J. Chromatogr. A, 683 (1994) 157.
40. S. Kage, T. Nagata, K. Kimura, K. Kudo, J. Forensic Sci., 33 (1988) 217.
41. S. Kage, T. Nagata, K. Kudo, J. Chromatogr. B, 564 (1991) 163.
42. S. Kage, T. Nagata, K. Kudo, J. Chromatogr. B, 675 (1996) 27.
43. R. Hyspler, A. Ticha, M. Indrova, Z. Zadak, L. Hysplerova, J. Gasparic, J. Churacek, J. Chromatogr. B, 770 (2002) 255.
44. S. Kage, K. Kudo, N. Ikeda, J. Chromatogr. B, 742 (2000) 363.
45. S. Kage, K. Kudo, N. Ikeda, J. Anal. Toxicol., 26 (2002) 320.
46. S. -H. Chen, H. -L. Wu, C. -H. Yen, S. -M. Wu, S. -J. Lin, H. -S. Kou, J. Chromatogr. A, 799 (1998) 93.
47. S. -J. Lin, H. -L. Wu, C. -Y. Lin, Anal. Chim. Acta, 386 (1999) 113.
48. F. Lin, H. Wu, H. Kou, S. Lin, J. Agric. Food Chem., 51 (2003) 867.
49. E. T. Everhart, P. Shwonek, P. Jacob III, M. C. Rowbotham, R. T. Jones, J. Chromatogr. B, 729 (1999) 173.
50. F. Feng, B. Uno, M. Goto, Z. Zhang, D. An, J. Chromatogr. Sci, 41 (2003) 337.
51. M. I. Catalina, J. Dalluge, R. J. J. Vreuls, U. A. T. Brinkman, J. Chromatogr. A, 877 (2000) 153.
52. Y. Ylinen, H. Hanhijarvi, P. Peura, O. Ramo, Arch. Environ. Contam. Toxicol., 6 (1985) 713.
53. B. Dietrich, J. M. Lehn, Tetrahedron Lett., 14 (1973) 1225.
54. E. Nomura, H. Taniguchi, K. Kawaguchi, Y. Otsuji, J. Org. Chem., 58 (1993) 4709.
55. R. Fornasier, F. Montanari, G. Podda, P. Tundo, Tetrahedron Lett., 17 (1976) 1381.
Pak. J. Anal. Envir. Chem. Vol. 7, No. 1, (2006)
7
7
56. K. -R. Kim, H. Kim, J. Chromatogr. A, 866 (2000) 87.
57. S. Motoyasu, M. Toshiyuki, J. Pharm. Biomed. Anal., 16 (1997) 139.
58. S. Rahavendran, H. Karnes, Anal. Chem., 69 (1997) 3022.
59. S. L. Regen, J. Am. Chem. Soc., 97 (1975) 5956.
60. R. Annunziata, M. Benaglia, M. Cinquini, F. Cozzi, G. Tocco, Org. Lett., 2 (2000) 1737.
61. E. J. Corey, F. Xu, M. C. Noe, J. Am. Chem. Soc., 119 (1997) 12414.
62. P. Tundo, P. Venturello, Inorg. Chim. Acta, 40 (1980) 134.
63. T. Ido, T. Yamamoto, G. Jin, S. Goto, Chem. Engin. Sci., 52 (1997) 3511.
64. Y. Fiamegos, C. Konidari, C. Stalikas, Anal. Chem., 75 (2003) 4034.
65. S. -H. Chen, H. -L. Wu, M. Tanaka, T. Shono, K. Funazo, J. Chromatogr. A, 502 (1990) 257.
66. S. Chen, S. Wu, H. Kou, H. Wu, Anal. Toxicol., 18 (1994) 319.
67. H. Haber, H. M. Haber, M. F. Melzig, Anal. Biochem., 224 (1995) 256.
68. A. Miki, H. Tsuchihashi, H. Yamano, M. Yamashita, Anal. Chim. Acta, 356 (1997) 165.
69. Y. C. Fiamegos, C. G. Nanos, G. A. Pilidis, C. D. Stalikas, J. Chromatogr. A, 983 (2003) 215.
70. A. Arbin, H. Brink, J. Vessman, J. Chromatogr. A, 170 (1979) 25.
71. H. H. Maurer, J. W. Arlt, J. Chromatogr. B, 714 (1998) 181.
72. F. X. Zhou, I. S. Krull, B. Feibush, J. Chromatogr., 648 (1993) 357.
73. A. Miki, H. Tsuchihashi, K. Ueda, M. Yamashita, J. Chromatogr. A, 718 (1995) 383.
74. A. Miki, H. Tsuchihashi, M. Yamashita, J.
Anal. Toxicol., 22 (1998) 237. 75. A. Miki, M. Katagi, H. Tsuchihashi, M.
Yamashita, J. Anal. Toxicol., 23 (1999) 86. 76. A. Miki, M. Nishikawa, H. Tsuchihashi, J.
Health Sci., 46 (2000) 81. 77. Y. C. Fiamegos, C. G. Nanos, J. Vervoort, C.
D. Stalikas, J. Chromatogr. A, 1041 (2004) 11.
78. D. Mason, S. Magdassi, Y. Sasson, J. Org. Chem., 55 (1990) 2714.
79. W. Lasek, M. Makosza, J. Phys. Org. Chem., 6 (1993) 412.
80. R. S. Juang, S. C. Liu, Ind. Eng. Chem. Res., 37 (1998) 4625.
81. M. L. Wang, In: Kinetic modeling of catalytic phase transfer systems (Y. Sasson, Newmann, R., (Eds.), Chapman & Hall: New York, (1997).
82. H. -S. Wu, T. -R. Fang, S. -S. Meng, K. -H. Hu, J. Mol. Catal. A, 136 (1998) 135.
83. S. Desikan, L. K. Doraiswamy, Ind. Eng. Chem. Res., 34 (1995) 3524.
84. F. Montari, S. Quinci, P. Tundo, J. Org. Chem., 48 (1983) 199.
85. P. F. Marconi, W. T. Ford, J. Catal., 83 (1983) 160.
86. M. L. Wang, H. M. Yang, Ind. Eng. Chem. Res., 30 (1991) 2384.
87. M. L. Wang, H. M. Yang, Ind. Eng. Chem. Res., 31 (1992) 1868.
88. S. D. Naik, L. K. Doraiswamy, Phase-Transfer Catalysis: Chemistry and Engineering. A.I.Ch.E. J., 44 (1998) 612.
89. E. Ruckenstein, L. Hong, J. Catal., 136 (1992) 378.
90. N. Adinolfe, M. Bicking, J. Chromatogr. Sci., 23 (1985) 407.

Pak. J. Anal. Envir. Chem. Vol. 7, No. 1, (2006)
8
ISSN-1680-9955
Pak. J. Anal. Envir. Chem. Vol. 7, No. 1, (2006) 8 � 16
Active Carbon Production from Modified Asphalt
ABDELRAHMAN BASIL FADHI Department of Chemistry, College of Science, University of Mosul, Mosul, Iraq.
Abstract A granular activated carbons (GACs) have been prepared from some local raw materials such as Qiayarah asphalt (QA) after some modification treatments of this asphalt by various ratios of its original constituents (asphaltenes and maltens) at 180 °C. Thermal carbonization method by sulfur and steam physical activation have been used for AC preparation. The carbons thus prepared were characterized in the term of iodine, methylene blue (MB), P-nitro phenol (PNP) and CCl4 adsorption. The BET surface area of the prepared ACs has been estimated via a calibration curve between iodine numbers and surface area determined from N2 adsorption isotherm from previous studies, also, the surface area of the prepared ACs were determined through another methods such as retention method by ethylene glycol mono ethyl ether (EGME), adsorption from vapor phase using acetone vapor and adsorption from solution method using PNP and MB as solutes. The results referred to the success of modification method for preparing ACs of good micro porosity as compared with the AC from the untreated asphalt as well as the commercial sample.
Keywords: Modified asphalt; Granular activated carbons (GACs); Adsorption properties; Surface area; Retention method; Adsorption from solution.
Introduction Adsorption now plays a key role in modern industries, especially in the field of environmental protection engineering, with the increasing environmental awareness of people all over the world. Adsorption processes are being employed widely for large scale biochemical, chemical and environmental recovery and purification applications [1].
With the expanding demand for activated
carbon due to their environmental applications, a great interest has been developed to seek steadier and cheaper feed stocks for the manufacture of AC, including the focus on by-product and waste materials [2].
Activated carbon is a highly porous material which has various applications in adsorption of both gases and solutes from aqueous solution. Granular activated carbon is widely accepted for the removal and recovery of toxic
metals because of its low cost and high affinity towards the scavenging metal ions. The adsorption on GAC has many advantages [3].
1) The rate of adsorption and the capacity vary significantly for different potentially hazardous compounds and different commercial carbons. The capacity and the rate are both important determining factors in the design and operational criteria.
2) The capacity and the rate of adsorption for many organic and inorganic pollutants are affected significantly by the presence of other organic substances and by the conditions of the solutions temperature and pH.
The demand for activated carbon is
growing particularly for its use for waste water and contaminated ground water treatment due to the higher awareness of the limited supply of water of this planet. Coals, lingo-cellulose materials and

Pak. J. Anal. Envir. Chem. Vol. 7, No. 1, (2006)
9
asphalt are good starting raw materials for preparing AC. As the production of an activated carbon must satisfy economical viability with high performance, cheap precursors materials readily available and convertible to an active carbon using minimum of resources could become very attractive raw materials [4]. The two main classical methods for preparing activated carbons are physical and chemical activation. It is known that any precursors of highly carbon content could be used for active carbon preparating [3]. Biomass waste such as fruit stones, asphalt and modified asphalt have been used to prepare activated carbon. Asphalt is a dark to black cementitious material; solid, semisolid (Bitumen) or liquid in consistency. The chemical composition of asphalt is very complicated and composed of two main parts (asphaltenes and maltenes). Asphaltenes which are dark to black friable solids, consisting of large molecular size, so they fall within the colloidal range. They are insoluble in light naphtha and their existence in asphalt imposes important effects on its physical properties (solubility, colloid, dispersion or peptization). They appear to be the final condensation products indicated from oxidation where the scheme of reaction.
Oils→resins→asphaltenes
The asphaltenes remained dispersed in the oil medium (maltenes) due to the hydrogen bonding interaction between asphaltenes and resins. The second part of asphalt is maltenes which is the soluble part of asphalt in naphtha. It can be further divided into resins and mineral oils [5].
This study is a complementary one for previous studies which have been achieved in Mosul University, and aimed to modify the rheological properties of asphalt which is found in two main types (Biji asphalt and Qiayarah asphalt) for paving purposes, whereas others such as our study make use of such modified systems for ACs preparation [5-10]. Experimental
Materials
In this work, Qiayarah asphalt (QA) which is produced from Qiayarah refinery (north of Iraq)
was the cheapest staring material for AC carbon preparation. The most important properties of this asphalt are shown in table 1 [11] and the chemical analysis of this asphalt is given in table-2 [12]. Table 1. Physco-chemical properties of Qiayarah asphalt
property ASTM Value
Penetration at 25 C° (100 gm 5sec.01mm) D5 55
Specific Gravity at 15 C° D70 1.0576
Ductility at 25 C° (5cm/min.) D113 75
Softening Point (R&B) C° D36 55
Asphaltenes, % wt. D4 25.67
Saturates % wt. D4 14.22
Naphthenes, Aromatics, %wt. D4 52.20
Polar, Aromatics,% wt. D4 6.90
Table 2. Chemical analysis of QA
C % 82.47
H % 9.62
S % 7.73
Balance 0.18
Chemicals and Reagents All chemicals used in this work were
obtained from Fluka and Merck with 99 % purity.
Preparation of samples Fractionation of Qiayarah asphalt
The fractionation of QA has been made
according to Ali et.al method [13]. A known quantity of asphalt was shaken with petroleum spirit (60-80°) in ratio (1w/ 40v) at room temperature for 4hrs, and then the mixture is filtrated. The insoluble part (precipitate) is asphaltenes and the soluble one is maltens after solvent evaporation.
Modification and preparation methods
Qiayarah asphalt (QA) has been modified
by different ratios of asphaltenes and maltens which were separated from the same asphalt in

Pak. J. Anal. Envir. Chem. Vol. 7, No. 1, (2006)
10
ratios (1, 5, 10, 15 and 20 % w/w) apart via physical mixing at 180°C for 2hrs followed by a chemical treatment at the same temperature for 1hr using AlCl3 as catalyst.
The Carbonization method used in this
study was the thermal carbonization by raw elemental sulfur (sulfur was obtained from Al-Mishraq sulfur field north of Iraq) which is characterized by containing 1% carbonaceous impurity [14]. A known quantity of modified asphalt was mixed with the same quantity of raw elemental sulfur, then, mixture was heated gradually till 240 ± 5°C was obtained, and the process went on till gases release stopped. The semi carbonized material was ground and sieved to 20-40 mesh and then activated by steam as an activating agent at 750-800°C for 1hr into stainless steel tube by means of a tubular oven to obtain the AC.
Equipments
A digital spectrophotometer (UV-Visible
Spectrophotometer Shimadzu -1650PC) was used for measuring the absorbance of dyes solutions before and after adsorption. Characterization tests
The adsorptive ability of the prepared ACs
was examined through some basic tests such as:
1- Iodine number (IN): Iodine number which is defined as the mg of iodine adsorbed per gram of carbon, this test was determined by ASTM D 4607-86 method [15].
2- Service time: Quantity of CCl4 vapor adsorbed per gram of AC at certain time [16].
3- Dyes values: Milligrams of dyes (MB and PNP) adsorbed per gram of AC .These dyes are the most common used. A known quantity (0.1g) of dried AC at 110°C for 24hrs was shaken with 100ml of MB (30ppm) or 50ml of PNP (100ppm) solutions at room temperature till equilibrium was obtained which took 24 hr. After that, the samples were filtered and the dye concentration in the supernatant solution was estimated by measuring absorbance with a Shimadzu UV-Vis 1260 PC. The wavelength was selected so as to obtain maximum
absorbance for each dye stuff and the ëmax values are given as follows: for Methylene Blue, ëmax 665nmand for p-nitro phenol ëmax 318nm [17].
The amount of dye adsorbed on the
carbons, qe (mg/g) was calculated by mass balance relationship by Eq. (1): qe = [Co-Ce) V /W (1) Where Co and Ce are the initial and equilibrium liquid phase concentrations, respectively (mg/L), V the volume of the solution and W the weight of the carbon used (g).
As regard surface area determination by solution adsorption, a known volume of different concentrations of used dyes (from 5-50 ppm for MB and 40-200 ppm for PNP) were contacting with 0.1 gm of AC till equilibrium was obtained. The linear form of Langmuire equation which is valid for monolayer sorption onto a surface was used for this purpose as expressed in Eq. (2):
Ce / Qe = 1/ KLQm + Ce / Qm (2) Where Qm is the amount adsorbed per unit mass of adsorbent corresponding to complete monolayer coverage on the surface bound at high Ce and b is the constant related to the affinity of binding sites. Result and Discussion Chemical composition
It is known that any material of highly carbon content can be used for AC preparation. Qiayarah asphalt has been used as starting material for its higher carbon content as well as the nature of its chemical composition. It is one of the highly condensed aromatics types .The modification treatment of this asphalt aimed to a partial change in its chemical structure by governing reaction conditions as mentioned previously. As an evidence for this change, softening point was measured as a function of molecular weight change. Figs. 1 and 2 shows the softening point values of the modified samples.

Pak. J. Anal. Envir. Chem. Vol. 7, No. 1, (2006)
11
0
10
20
30
40
50
60
70
80
0 5 10 15 20 25
Asphaltenes %
So
ften
ing
po
int
C°
0
10
20
30
40
50
60
70
0 5 10 15 20 25
Maltenes %
So
ften
ing
Po
int
C°
As can be seen from Figs. 1 and 2, the chemical composition of QA has been changed due to modification treatments, but, asphaltenes modified Qiayarah asphalt (AMQAs) have been shown higher softening points than (MMQAs), this is due the ability of added asphaltenes to coalesce Figure 1. relation between Asphaltenes % and softening points
Figure 2. Relation between Maltenes % and softening points
(compatibility) with the authentic asphaltenes of the asphaltic system, in addition, asphaltenes are highly molecular weight molecules consist mainly of polynuclear aromatic systems bearing mainly alkyl side chains up to C30, therefore the molecular weight of asphalt [18] was incresead, also, asphaltenes are the heaviest part of the asphaltic system, therefore, all heavy metals and their compounds are aggregate in asphaltenes which may act as an additional catalyst for the reaction.
The direct relation between softening points of (AMQAs) and asphaltenes% may reinforce our conclusions as can be seen from Fig.1.
As regard (MMQAs), slightly increase in the softening points has been observed in the beginning and then a decrease in these values, as can be seen from Fig. 2. This is due to the low molecular weight of maltenes which is less condensed aromatic rings than asphaltenes and has a large numbers of side alkyl chains leading to decrease in softening points may be because of dilution effect. Adsorption Properties
This study is a complementary one to previous studies aimed to prepare ACs from QA after being modified by different materials such as polymer wastes and sulfur [9, 12]. Tests used to characterize the prepared ACs are given in Tables 3 and 4. Table 3. Sorption properties of ACs from AMQAs
Sample IN mg/g
MB mg/g
PNP mg/g
CCl4 mg/g
Humidity% Yield %
QAC 227.0 17.5 65 39 0.86 66
QAAC1 900 363 400 162 4.9 24.8
QAAC2 735 351 158 54 3.8 35.25
QAAC3 750 187 `73 50 4.4 36.36
QAAC4 725 207 207 81 1.4 33
QAAC5 700 133 143 41 2 41.84
ACBDH 297 63.8 88 43 0.53 ND
Table 4. Adsorption properties of ACs from MMQAs
Sample IN mg/g
MB mg/g
PNP mg/g
CCl4
mg/g Humidity% Yield %
QAC 227.0 17.5 65 39 0.86 66
QMAC1 722 168 150 93 3.9 33.8
QMAC2 705 130 135 54 3.8 38.81
QMAC3 630 120 188 74 4.4 36
QMAC4 650 185 218 40 4.2 47.54
QMAC5 700 130 226 91 3.8 31.88
ACBDH 297 63.8 88 43 0.53 ND
Pak. J. Anal. Envir. Chem. Vol. 7, No. 1, (2006)
12
The adsorption of iodine can be used as a function of micro porosity and this test is a complementary test for N2/77 K adsorption isotherm, and assumed to measure the micro pores sizes ≥ 10 A2 [19] .Phenols and their compounds are often used as reference solutes to simulate certain toxic chemicals in the liquid-phase adsorption studies and even to measure the specific surface area of adsorbents. The adsorption of PNP is another test for micro porosity since this molecule measure the microspores equals to (0.52 nm2).The adsorption of CCl4 is a good gauge of vapor phase adsorption capacity. This test is a rough measure of micro pore volume of the AC [16]. The dye adsorption tests help to determine the capacity of carbon to adsorb molecules of a particular size. The methylene blue molecule can be used as a function of mesoporosity and has a minimum molecular cross-section of about 0.8 nm and it has been estimated that the minimum pore diameter it can enter is 1.3 nm. Therefore, it can only enter the largest micropores, but most of it is likely to be adsorbed in mesopores, also it is good test for AC on removing colors from waste water and underground water.
From Tables 3 and 4, generally, The
decreasing in yields % of the produced ACs is good evidence for the ability of modification treatments on increasing the porous structures of the produced ACs as compared with AC from the untreated asphalt, and as consequence the adsorption properties of the products were increased and gave larger values than the AC prepared from the untreated asphalt (QAC), also, our ACs were superior to the commercial AC sample (ACBDH) especially the sample QAAC1 which has shown highest adsorption properties than others. The prepared ACs have shown good micro porosity, where, they gave higher INs and showed good ability to remove dyes of small size molecule (PNP) from their aqueous solution, in addition to the higher adsorptive capacity toward CCl4
adsorption as compared with AC from the untreated asphalt QAC and the commercial one. The values of MB adsorption were also higher as compared with the QAC and the commercial sample indicating that modification process was successed to increase the meso pores volume (wider micro pores) of the prepared ACs.
The adsorption properties (IN and MB values) of our ACs were superior to all ACs prepared from QA modified with different materials such as (waste poly ethylene, scrape tires, waste poly styrene and sulfur). As compared with previous studies, the ACs prepared from QA modified with aforementioned materials have been given lower adsorption values than our results. The adsorption properties of the previous studies are given in table 5 which also shows the best ratio of modifier. Therefore, depending on these results, we can say that modification of QA by its original constituents was more successful to produce ACs of highly porous structures and adsorption properties. Surface area determination Determination of surface area by vapor phase adsorption
The measurement of the specific surface area of finely divided solids such as AC became increasingly important in laboratory and technical process. One of the most employed methods for such measurement is vapor phase adsorption using N2/77K or other gases such as CO2, Ar, He and H2O vapor.
In this work, the surface area was
determined via the adsorption of acetone vapor. The measurement method is a gravimetrically one and has been explained detaily in an earlier study [20]. The SAacetone values are given in Table 7.
Determination of the surface area by adsorption from solution method
Liquid phase adsorption has been shown to be an effective method for color removal from aqueous solutions, and AC is the most widely adsorbent for this purpose.
Methylene blue (MB) which is a cationic
dye and p-nitro phenol (PNP) are convenient solutes for many adsorbents. These solutes were used for SA measurement by many investigators [8, 9.17, 19-22]. This method gives a good correlation with N2/77 K method for many
Pak. J. Anal. Envir. Chem. Vol. 7, No. 1, (2006)
13
0
0.1
0.2
0.3
0.4
0.5
0.6
0.7
0.8
0.9
1
0 50 100 150 200
Ce mg/L
Ce/
Qe
g/L
QAAC1 R2=0.992 QMAC5 R2=0.972
0
0.02
0.04
0.06
0.08
0.1
0.12
0.14
0 10 20 30 40 50
QAAC1 R2=0.994 QAAC5 R
2=0.968
Ce/
Qe
g/L
Ce mg/L
0
50
100
150
200
250
300
350
0 50 100 150 200
Ce mg/L
QAAC1 QMAC5
Ce/
Qe
g/L
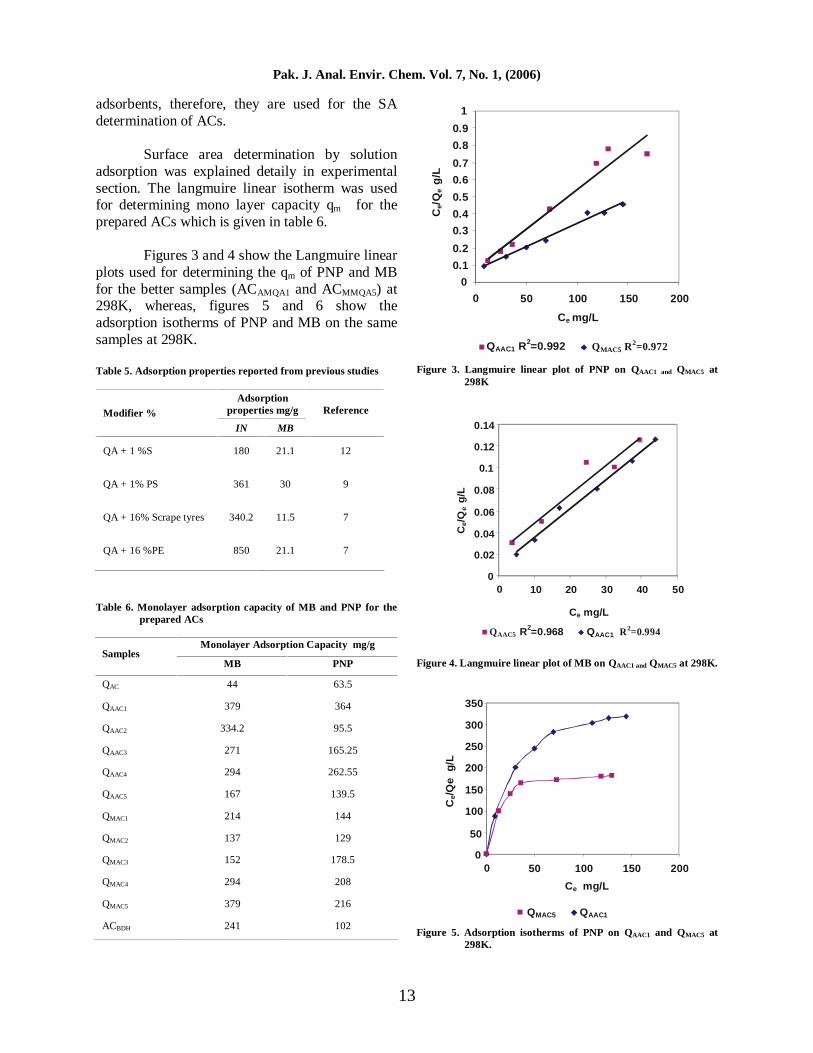
adsorbents, therefore, they are used for the SA determination of ACs.
Surface area determination by solution
adsorption was explained detaily in experimental section. The langmuire linear isotherm was used for determining mono layer capacity qm for the prepared ACs which is given in table 6.
Figures 3 and 4 show the Langmuire linear
plots used for determining the qm of PNP and MB for the better samples (ACAMQA1 and ACMMQA5) at 298K, whereas, figures 5 and 6 show the adsorption isotherms of PNP and MB on the same samples at 298K. Table 5. Adsorption properties reported from previous studies
Adsorption properties mg/g Modifier %
IN MB
Reference
QA + 1 %S 180 21.1 12
QA + 1% PS 361 30 9
QA + 16% Scrape tyres 340.2 11.5 7
QA + 16 %PE 850 21.1 7
Table 6. Monolayer adsorption capacity of MB and PNP for the prepared ACs
Monolayer Adsorption Capacity mg/g
Samples MB PNP
QAC 44 63.5
QAAC1 379 364
QAAC2 334.2 95.5
QAAC3 271 165.25
QAAC4 294 262.55
QAAC5 167 139.5
QMAC1 214 144
QMAC2 137 129
QMAC3 152 178.5
QMAC4 294 208
QMAC5 379 216
ACBDH 241 102
Figure 3. Langmuire linear plot of PNP on QAAC1 and QMAC5 at
298K
Figure 4. Langmuire linear plot of MB on QAAC1 and QMAC5 at 298K. Figure 5. Adsorption isotherms of PNP on QAAC1 and QMAC5 at
298K.

Pak. J. Anal. Envir. Chem. Vol. 7, No. 1, (2006)
14
0
50
100
150
200
250
300
350
400
0 10 20 30 40 50
Ce mg/g
QAAC1 QMAC5
Qe
mg
/g
0
200
400
600
800
1000
1200
0 200 400 600 800 1000 1200
IN mg/g
SA
BE
Tm
2 /g
R2=0.997
Figure 6. Adsorption isotherms of MB on QAAC1 and QMAC5 at
298K
Surface area related to dye adsorption was calculated using the following equation: SADye = Qm. Õ .10-20. N / n (3) Where SADye is the surface area related to dye in m2/g, Õ is the cross sectional area of adsorbate (A2), Qm amount of solute adsorbed at the plateau of the isotherm in (mole/g), N the Avogadro's number and n is the coverage factor which reflects the average number of dye ions in a micelle, or the aggregation number since the dyestuff were adsorbed from aqueous solution in the form of ionic micelle, this value was 2 for MB and 1 for PNP. The SA values measured via PNP and MB adsorption are given in Table 7. Table 7. Surface area of ACs prepared from (AMQAs and
MMQAs). Sample EstimatedBET
m2/g SAEGME
m2/g SA Acetone
m2/g SAMB m2/g
SAPNP m2/g
QAC 215 255 115 50 143
QAAC1 833 788 700 430 820
QAAC2 687 670 610 379 215
QAAC3 690 750 519 307 372
QAAC4 650 625 566 333 591
QAAC5 620 500 551 189 314
QMAC1 647 622 568 242 323
QMAC2 600 566 639 155 290
QMAC3 680 537 636 172 402
QMAC4 667 458.39 697 333 469
QMAC5 667 613 700 430 486
ACBDH 275 ND ND 273 230
Estimation of the BET surface area
The BET surface area of the prepared ACs was estimated via a calibration curve obtained from linear relation between iodine numbers and the BET surface area of previous studies. [23] calibration curve is shown in Fig. 5 and the estimated SABET values are also given in Table 7.
Figure 7. Calibration curve of the estimated SABET
Determination of the surface area via retention method of EGME.
The procedure includes wetting a sample
with EGME, equilibrating, and then removing the excess liquid by evacuation. Samples were removed periodically and weighed until a constant mass was obtained. The specific surface area was computed from the mass of the retained liquid under the assumption that a monomolecular layer of EGME was adsorbed on the surface. The procedure applied in this work was made according to Lutengger method [24]. The SAEGME values are shown in Table 7.
The adsorption of organic vapors such as acetone vapor was used for SA determination by Cal who found that it gives closer results to N2 adsorption isotherm which refers to micro porosity [25]. PNP adsorption was used by many investigators for determining SA of finely adsorbents such as AC from their aqueous solution. Giles et.al and Uzun et.al reported a closer result of SA measured by PNP adsorption as compared to SA measured by N2 adsorption which also indicates to the micro porosity. Velan et.al used EGME retention method for determining SA of the
Pak. J. Anal. Envir. Chem. Vol. 7, No. 1, (2006)
15
AC and the results gave very closer results to those obtained using BET/ N2 adsorption which means that this method can be used for measuring the micro porosity of the AC [26].
The estimated SABET, SAAcetone, SAEGME
and SAPNP of our ACs have been shown higher values than those obtained from MB (SAMB) adsorption indicating that the prepared ACs have higher micro pores than meso pores (wider micro pores) since the adsorption of MB can be used as a function of mesoporosity [27], also as in adsorption properties, our ACs have been given higher SAs than QAC and ACBDH which reinforces our conclusion that modification treatments have been succeeded to increase the porous structure of the resulted ACs as compared with the AC from the untreated asphalt.
Taking the estimated SABET as reference,
the SAEGME were given closer results of the estimated BET values, and this is a good indication about the higher micro porosity of our ACs and, also our results were resemble to those obtained by Velan et.al [25].
Surface area calculated from adsorption of
acetone vapor SAAcetone and the estimated SABET have been given higher values than those calculated from adsorption solution phase, because dyes and other high molecular weight pollutants don't penetrate in the inner pores of the particles leading to a rapid saturation of adsorbent, furthermore, the penetration of the dyestuff molecules becomes more difficult because of the aggregation since the organic dyestuffs are adsorbed in the form of ionic micelles from the aqueous solution .In highly porous solids such as AC, adsorption from solution gives similar or closer results to vapor phase adsorption and some times lower. In the latter case, some pores are clearly large to admit vapors molecules such as acetone and N2 molecules but not solute molecules (MB and PNP), but, some times, solution adsorption gives higher values than vapor, because adsorption from solution takes place under agitation conditions whereas, adsorption of vapors takes place under static conditions.
The adsorption isotherms of MB and PNP
were determined for samples QAAC1 and QMAC5
since they gave good adsorption properties and surface area values, the isotherms were fitted to langmuire type of isotherms which indicates to the micro porosity [17].
By arranging the SA values (table 7)
obtained from different adsorbates, it can be seen that the SA values increased in the order SAMB <SAPNP <SAAcetone <SAEGME <SABET <IN, therefore, we can conclude that our samples are meso porous in addition to developed micro porosity.
Conclusion
According to the obtained results, it can be said that modification of QA with different amounts of its constituents (asphaltenes and maltenes), therefore, we reached to the following:
1- Active carbons of very good adsorptive properties can be obtained from locally available raw materials such as QA.
2- Treatment of QA with certain amount of its constituents (asphaltenes and maltenes) via our handling has been improved the adsorptive ability of the product as compared with previous handlings and the AC from the untreated asphalt.
3- Our activated carbons have been shown high porosity for their higher adsorption properties and surface areas as compared with the AC from the untreated asphalt and the commercial AC.
4- The difference in the adsorption values belongs to many factors such as the nature and composition of modifier, surface area, pore volume, surface chemistry and the nature of adsorbate.
5- The resulted ACs shown good ability to ward adsorption from both vapor phase and liquid phase. The adsorption process follows the Langmuir isotherms as could be seen from plots showing monolayer coverage of dye molecules at the outer surface.
6- Our samples shown higher adsorption ability as compared with the commercial one that means that our preparation method was effective to prepare a high quality AC.
7- Despite that ACs prepared from AMQA were given the better sample but those prepared from MMQA were also shown good adsorption properties and SAs as

Pak. J. Anal. Envir. Chem. Vol. 7, No. 1, (2006)
16
compared with ACs from AMQA and superior in SAs to some of them as well as to the AC from the untreated asphalt and the commercial one, from other hand, all our samples were shown good adsorptive properties and SAs for all ratios of asphaltenes and maltenes.
8- The samples showed the presence of both micro pores and meso pores according to the used adsorbates, therefore, we can say that they are meso porous in addition to developed micro porosity
Acknowledgement
The author is very thankful for Mr. Mohammad M. T. for his assistance in achieving this work. Abrreviatives
QA: Qiayarah asphalt. SPs: Softening points. GACs: Granular activated carbons. AMQA: Qiayarah asphalt that was treated with different ratios of asphaltenes. MMQA: Qiayarah asphalt that was treated with different ratios of Maltenes. INs: Iodine numbers. SA: Surface area SAs: Surface areas
References 1. A. Gurses C. Dogar, S. Karaca, M.
Acikyildiz and R. Bayrak, J. Haz. Mat. B131, (2006) 254.
2. M. M. Maroto-Valer, and H. H. Schobert, 24th Biennial Conf. on Carbon 1, (1999) 558.
3. D. Satapathy, G. S. Natarajan and S. J Patil, J. Chi. Che. Sco., 52, (2005) 35.
4. P. Le Cloirec, C. Brasquet, and E. Subrenat, Energy &fuel, 11(2), (1997) 331.
5. K. A. AL-Ghannam, Mosul University Ph.D. Thesis, (1996).
6. L. A Saleh, Mosul University, M.Sc. Thesis, (1992).
7. A. H. Tha'er, Mosul University, M.Sc. Thesis, (1999).
8. A. B. Fadhil, Energy Edu. Sci .Technol., 15, (2005) 71.
9. A. B. Fadhil, Energy Edu. Sci. Technol. 16, (2005) 1.
10. A. B. Fadhil, Energy Edu. Sci .Technol. 17, (2005) 1.
11. M. F. Al-Jarrah, R. L. Apikian, I. Al-salemm, and S.S. Nao'om, Fuel Science Technology Int� l, 4, (1986) 249.
12. F. F. Saleem, Mosul University, Ph.D. Thesis, (1998).
13. L. H. Ali, and K. A. AL-Ghannam, Fuel, 60, (1981) 1034.
14. R. Ijiri, Central Researches Laboratory, Idemitsu Kosan Co., Ltd., Kamizumi, Japan, Sekiyu GakKaishi, 20(1): Japan.Chem. Abst. (87): 154461s, 104, (1977) 10.
15. ASTM, Standard Test Method for Determination of Iodine Number of Activated Carbon, D 4607-86, 384.
16. R. Chaney, and S. John, Industrial Eng. Chem.15, (1923) 244, 1251.
17. C. H. Giles, H. Mcewanh, S. N. Nakhwa, Smith D. J. Chem. Soc. (1960) 3973.
18. I. A. Al-Douboni, Mosul University. M.Sc. Thesis, (1977).
19. A. A. Attia, E.W. Rashwan, and S. A. Khedr,. J. Dye. Pig., 69, (2006) 133.
20. K. J. Aswad, A. B. Fadhil, and E. I. Ahmed, (in preparation for publishing).
21. F. Guzel, I. Uzun. Turk. J. Chem., 26, (2002) 369.
22. O. Inel, and F. Tumsek, Turk. J. Chem., 24, (2000) 9.
23 A. B. Fadhil and M. M. Deyab, in publication in Arab. Jour. Sci. Eng.
24. A. B. Cerato and A. J. Lutenegger, Geotech. Test. Jour. 25(3), (2002) 2.
25. P. C. Mark, University of Illinois at Urbana-Champaign, Ph.D. Thesis, (1995).
26. B. G. Prakash Kumar, K. Shivakamy, L. R. Miranda and M. Velan, Journal of Hazardous Materials, (2006) (article in press).
27. S. Yenisoy-Karakas, A. Aygun, M. Gunes and E. Tahtasakal, Carbon, 42, (2004) 478.

Pak. J. Anal. Envir. Chem. Vol. 7, No. 1, (2006)
17
ISSN-1680-9955
Pak. J. Anal. Envir. Chem. Vol. 7, No. 1, (2006) 17 � 30
Oscillatory transenantiomerization of the selected 2-arylpropionic acids (2-APAs) in vitro as a spontaneous phenomenon
MIECZYSLAW SAJEWICZ AND TERESA KOWALSKA*
Institute of Chemistry, Silesian University, 9 Szkolna Street, 40-006 Katowice, Poland
*Email: [email protected]
Abstract In this paper, we summarize the results of our earlier investigations on an attempted enantioseparation of the selected 2-arylpropionic acids (2-APAs) by means of the chiral thin layer chromatography (TLC). These results have been originally presented in a series of the research papers published in several chromatography journals. In the current article it was reminded that the prolonged storage of the investigated 2-APAs in the aqueous and the non-aqueous solutions results in an oscillatory change of the respective retardation factor (RF) and the specific rotation ([á]D) values. An assumption is introduced as to the chemical nature of the observed phenomenon. It is assumed that the observed oscillations are due to the repeated structural inversion (in our study labelled as oscillatory transenantiomerization) of one enantiomer to its respective antimer. One attempts to at least roughly explain the molecular mechanism of transenantiomerization either by keto-enol tautomerism, or by formation of an intermediate enolic anion, any of these two reaction mechanisms possible only in the basic environment. Then one reflects on the most probable mechanism responsible for the oscillatory nature of the observed structural inversion. It is concluded that the oscillations could be due to an enhanced viscosity of the investigated 2-APA solutions (as compared with those of the respective pure solvents) and/or due to the molecular self-organization within these solutions, resulting in anisotropic properties thereof. Finally, it is concluded that an ultimate explanation of the observed oscillatory transenantiomerization of the selected 2-APAs could probably be offered by the Brusselator-type kinetic model implemented with the diffusion term. In the last section of this paper, argumentation is presented strongly in favour of this particular model and against any alternative speculation as to the supramolecular nature of the observed oscillatory phenomena.
Introduction
The 2-arylpropionic acids (2-APAs), or profens, are an important class of nonsteroidal antiinflammatory drugs (NSAIDs) that have been in clinical use for ca. 40 years now. Widely used members of this drug class include naproxen, ibuprofen, ketoprofen, and flurbiprofen. The most important therapeutic activity of 2-APAs consists in their antiinflammatory and pain relieving action. All 2-APAs contain one asymmetric carbon atom in their molecular structure and hence, they can appear in the two enantiomeric forms, as the S-(+) and the R-(-) species. From the pharmacological investigations it comes out that the S-(+)
enantiomers are incomparably more effective than their respective antimers.
In the case of any enantiomeric drug one problem always is of an ultimate importance: Should these drugs be administered to the patients as racemates, or as single and optically pure enantiomers? Since the greatest tragedy of modern pharmacology caused in the late fifties and the early sixties of the past century by Thalidomide advertised as a �miraculous� sedative and administered in almost fifty countries as a racemic mixture to pregnant women, one of the paramount threats of all racemic drugs is a possible *Author for Correspondence
Review

Pak. J. Anal. Envir. Chem. Vol. 7, No. 1, (2006)
18
theratogenic activity of the �ballast� antimer present in the mixture.
Modern tendency to administer enantiomeric drugs in their optically pure form can be put into practice in the two different ways, i.e., either by chromatographic enantioseparation of the racemic mixture and extraction of the curative species, or by asymmetric synthesis resulting in a single enantiomer of choice. Presently, the strategy of enantioseparations is better established, as it seems more rapid, flexible, and cost effective than asymmetric synthesis, although the latter one becomes a dynamically growing field of organic chemistry.
It has been our initial target to re-examine the performance of thin layer chromatography (TLC)�the least frequently utilized chromato-graphic technique�in the area of enantioseparations on an analytical scale. The first class of analytes we have focused on were 2-APAs, and more specifically ibuprofen, naproxen, and 2-phenylpropionic acid. We started our investigations from repeating and modifying an analytical procedure of enantioseparating the racemic ibuprofen mixture established by Bhushan and Parshad [1], but pretty soon we realized that our analytes of choice undergo a strange and unexplained process, when stored for a longer period of time in the solutions of the different solvents. Basic characteristics of 2-APAs employed in our study are given in Table 1.
Table 1. Schematic representation of the chemical structures of the three 2-APAs and their specific rotation ([á]D), as taken from literature

Pak. J. Anal. Envir. Chem. Vol. 7, No. 1, (2006)
19
Investigations on a prolonged storage of the selected 2-APAs in solutions of different solvents
Optically pure enantiomers are quite expensive and for the sake of economy, we decided to store the 2-APA solutions for a longer period of time, instead of preparing the fresh solutions prior to each thin layer chromatographic experiment. An encouragement to do so came from pharmaceutical literature saying that these particular compounds are practically indestructible, when dissolved in common solvents like water, alcohols, dichloromethane, tetrahydrofuran etc. In
this part of our experiment we employed the following three 2-APA samples: S-(+)-ibuprofen and S-(+)-naproxen as the optically pure isomers, and S, R-(±)-2-phenylpropionic acid as a racemate. Very soon we discovered that positions of the investigated 2-APAs on the thin layer chromatograms (expressed in form of the retardation factor, RF,
values) change in an
oscillatory manner with the time of storage of the respective samples. In Fig. 1, we present this phenomenon in a schematic way.
Figure 1. Schematic presentation of the oscillatory changes of the RF
values (valid for each investigated 2-APA) as a function of storage
time in the solutions. Stationary phase: silica gel impregnated with L-arginine; mobile phase: ternary liquid mixture composed of ACN, MeOH, and H20, plus several drops of glacial acetic acid (originally published in [7]).
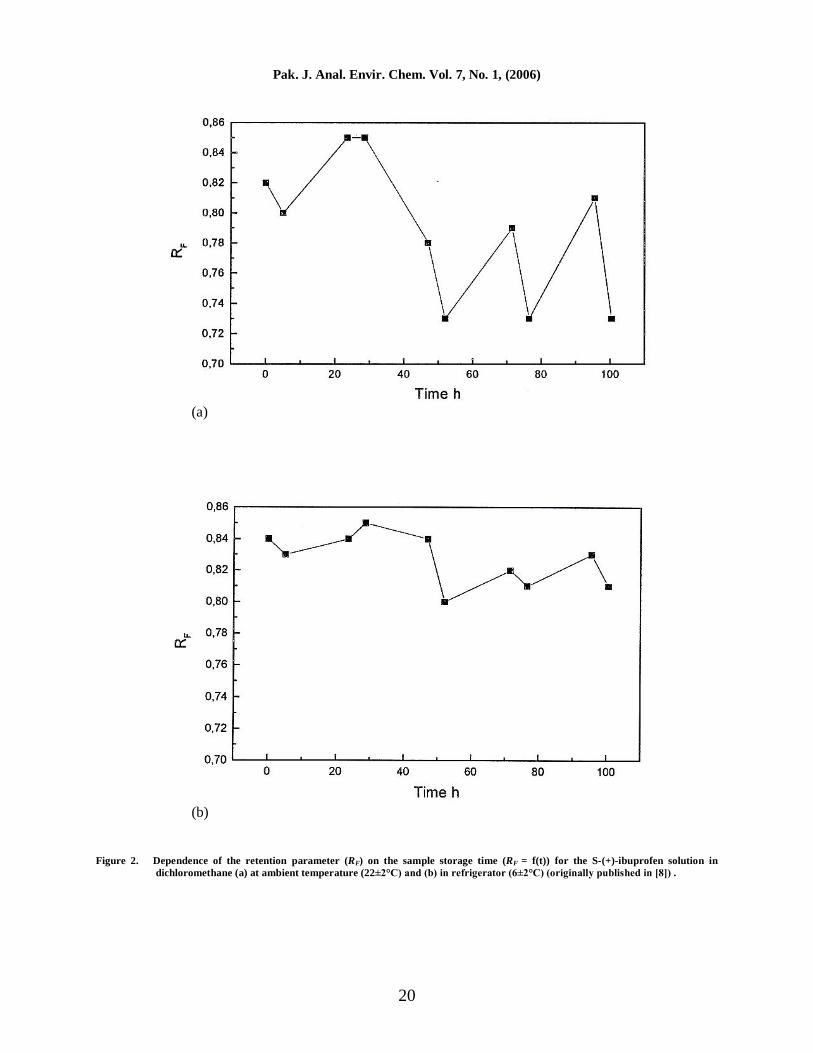
The experiments on measuring the retardation factor (RF) values of the three 2-APAs as a function of their storage time were carried out for the low-concentration solutions of these compounds in the following solvents: 70% ethanol, dichloromethane, and physiological salt. The obtained results were abundant and many of them are shown in papers [7-9]. For the sake of illustration, in Fig. 2 we present the example of the oscillating retardation factor (RF) values, taken from paper [8].
Oscillations of the retardation factor (RF) values with the three investigated 2-APAs were accompanied by the strongly pronounced changes of the concentration profiles of these compounds on the chromatograms, as registered by use of densitometric detection. In Fig. 3, we present the sequence of the changing concentration profiles with S, R-(±)-2-phenylpropionic acid dissolved in 70% ethanol and stored at 22±2°C, in the form of the �movie pictures�.
Pak. J. Anal. Envir. Chem. Vol. 7, No. 1, (2006)
20
(a)
(b) Figure 2. Dependence of the retention parameter (RF) on the sample storage time (RF
= f(t)) for the S-(+)-ibuprofen solution in
dichloromethane (a) at ambient temperature (22±2°C) and (b) in refrigerator (6±2°C) (originally published in [8]) .

Pak. J. Anal. Envir. Chem. Vol. 7, No. 1, (2006)
21
Figure 3. Sequence of the densitometric concentration profiles of S,R-(±)-2-phenylpropionic acid after: (a) 0 h; (b) 22.5 h; (c) 27.5 h; (d)
46.5 h; (e) 51.5 h; and (f) 70.5 h storage time in 70% ethanol at 22 ± 2°C. Changes of the concentration profiles are accompanied by the changing RF
values (originally published in [7])
From the results of our thin-layer chromatographic experiments given in papers [7-9] it became apparent that the optically pure 2-APA enantiomers (S-(+)-ibuprofen and S-(+)-naproxen), and also the racemic sample (S,R-(±)-2-phenylpropionic acid), were undergoing the
oscillatory changes of their respective retardation factor (RF) values, when dissolved in 70% ethanol, dichloromethane, and physiological salt. These changes were most vigorous (in terms of the highest amplitude and the shortest period) in 70% ethanol and the least pronounced in the non-
(a) (d)
(b) (e)
(c) (f)

Pak. J. Anal. Envir. Chem. Vol. 7, No. 1, (2006)
22
aqueous solvent, i.e. dichloromethane. Moreover, it was experimentally confirmed that in spite of the oscillatory changes of the analytes� retardation factor (RF) values, the prolonged storage of the samples did not result in any molecular destruction or transformation. In these circumstances, the only possible explanation of the observed oscillations seemed a continuous (and also oscillatory) structural inversion of the S-(+) species to their respective R-(-) antimers and vice verse. The phenomenon of structural inversion of the selected enantiomeric profen drugs running in vivo had been described in multiple pharmacological articles prior to our own study (e.g., in [10-12]), but there was no information in the available literature as to the structural inversion of these compounds in vitro. Thus the most direct way to check the hypothesis as to such structural inversion of 2-APAs (called in our articles the �oscillatory transenantiomerization�) was by use of polarimetry.
Polarimetric investigation of the selected 2-APAs stored in solutions of different solvents
The easiest way to scrutinize our hypothesis as to the oscillatory structural inversion of the three investigated 2-APAs could be by use of polarimetry. Although the oscillatory changes of the specific rotation ([á]D) with the aqueous and non-aqueous solutions of these compounds could not be considered as a sufficient proof in favour of this hypothesis, they certainly can act as a significant hint. In papers [7-9], we presented the experimental results of polarimetric measurements
of the specific rotation ([á]D) with the solutions of S-(+)-ibuprofen, S-(+)-naproxen, and S,R-(±)-2-phenylpropionic acid, stored for the longer periods of time. In fact, one observed quite vigorous oscillatory changes of the specific rotation values with the optically pure 2-APAs (ibuprofen and naproxen), and moderate oscillations in the case of the racemate (2-phenylpropionic acid), when dissolved in 70% ethanol. In the case of dichloromethane, the oscillatory changes of the specific rotation values for all three 2-APAs were also observed, although quite weak in comparison with 70% ethanol used as a solvent. In Fig. 4, the selected examples of the obtained results are given.
The results of our polarimetric measurements supported the hypothesis as to the possible oscillatory transenantiomerization of ibuprofen, naproxen, and 2-phenylpropionic acid, when stored for the longer periods of time in the selected solvents. It seemed apparent that the oscillatory transenantiomerization is running vigorously in the aqueous medium (70% ethanol), but to a modest extent it can also take place in dichloromethane. These results gave rise to the following two questions:
(i) What is the mechanism of the observed chiral
inversion of 2-APAs? (ii) What is the mechanism that generates
oscillations of this chiral inversion? We attempted to find the relevant answers to these two questions.

Pak. J. Anal. Envir. Chem. Vol. 7, No. 1, (2006)
23
Figure 4. Dependence of the specific retention ([á]D) of S-(+)-ibuprofen (a), S-(+)-naproxen (b), and S,R-(±)-2-phenylpropionic acid
(c) dissolved in 70% ethanol on the sample storage time ([á] = f(t)) at 6±2 °C (originally published in [7]) Possible mechanisms of transenanti-omerization
As mentioned in the preceding sections of this paper, no report had been available in the literature prior to our papers [7-9] on a possibility of the in vitro racemization of the 2-APAs. However, many reports are available on the analogous racemization processes running in vivo. In paper [13], a suggestion was made that racemization of 2-APAs is possible in the basic environment, involving keto-enol tautomerism as an intermediate reaction step. Schematic presentation of this process is given below. Another mechanism is also reported in literature [14] as highly probable in the basic
environment. This mechanism is particularly applicable to the dissociated form of the substituted propionic acids and involves the enolic anion, as shown in Scheme 2:
It seems rather difficult to decide, which one of the two transenantiomerization mechanisms (given by Schemes 1 and 2) is more probable in the case of the phenomena observed in our study and for this reason we decided to consider them as parallel.
To additionally confirm the correctness of the reports known from the literature and stating that the basic environment catalyzes the keto-enol tautomerism (and also the structural inversion via

Pak. J. Anal. Envir. Chem. Vol. 7, No. 1, (2006)
24
the enolic anion), whereas the acidic environment inhibits this process, we performed a study on the storage of S-(+)-naproxen both in the basic and the acidic environment. The results of the performed experiment are extensively discussed in paper [15]. It was clearly demonstrated that the prolonged storage of S-(+)-naproxen in the basic solution
(with the solvent composed of ethanol and the buffer, pH = 9, 7:3, v/v) resulted in partial conversion of S-(+)-naproxen to its R-(-) antimer. The process of conversion was rapid and it was not accompanied by any oscillatory changes of the specific rotation [á]D
with the investigated solution.
Scheme 1. The mechanism of transenantiomerization of 2-APAs via the keto-enol tautomerism (X: aryl substituent of propionic acid in position 2 of the carbon chain)
Scheme 2. The mechanism of transenantiomerization of 2-phenylpropionic acid via the enolic anion
S-(+)-naproxen was also stored in the
acidic solution (with the solvent composed of ethanol and glacial acetic acid, 7:3, v/v). In this case, even a prolonged storage did not result in a measurable structural inversion of the original enantiomer and no oscillatory changes of the specific rotation [á]D
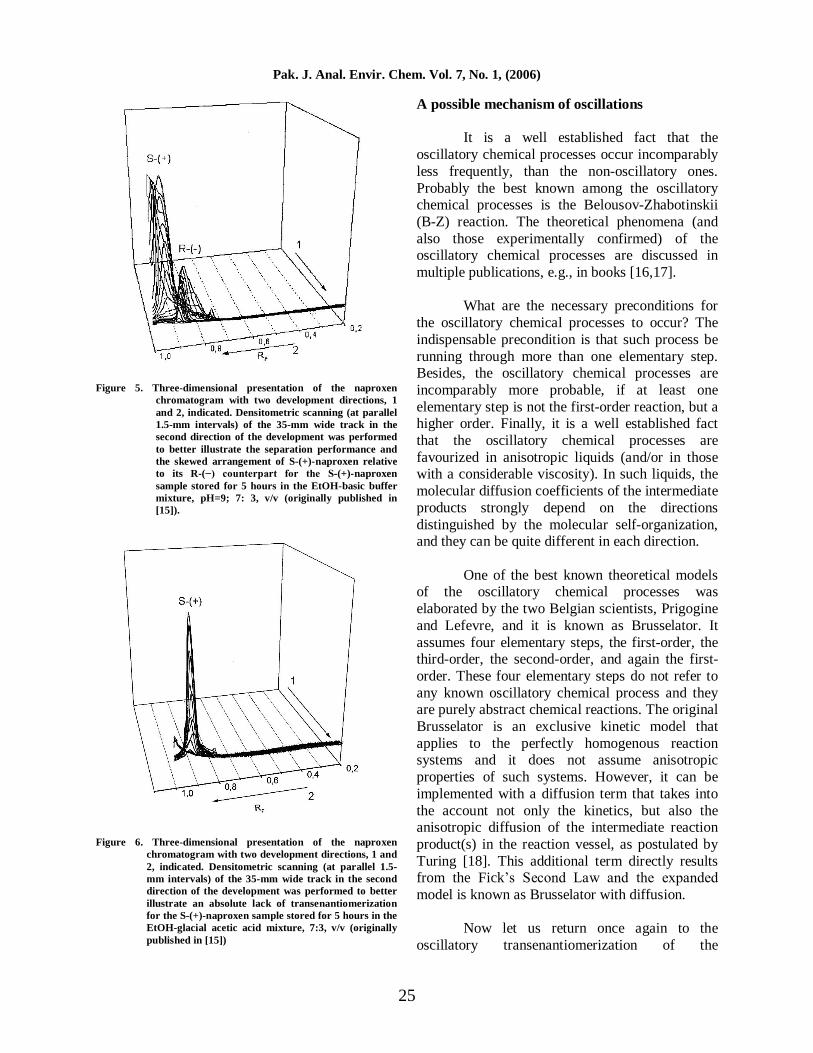
or the retardation factor (RF) with the investigated enantiomer were observed. In Figs 5 and 6, we present the two three-dimensional chromatograms originating from a two-dimensional TLC development of the samples of S-(+)-naproxen dissolved, respectively, in the basic and the acidic medium, and then stored for 5 hours at 22±2°C.
Thus it seems justified to assume that the
structural inversion of the three investigated
2-APAs occured via the keto-enol tautomerism and/or via the formation of the enolic anion. In the case of the aqueous solvent (70% ethanol), oscillations of the RF
and the [á]D values were
incomparably more vigorous than in the organic one (dichloromethane). This observation remains in good agreement with the general knowledge about the mechanisms of this type of structural inversions. Namely, water and ethanol are the recognized amphiprotic solvents, apparently able to catalyze transenantiomerization of 2-APAs. Moreover, migration of the proton (which is indispensable with this type of inversion) occurs much easier in the aqueous medium than in the purely organic one.
Pak. J. Anal. Envir. Chem. Vol. 7, No. 1, (2006)
25
Figure 5. Three-dimensional presentation of the naproxen chromatogram with two development directions, 1 and 2, indicated. Densitometric scanning (at parallel 1.5-mm intervals) of the 35-mm wide track in the second direction of the development was performed to better illustrate the separation performance and the skewed arrangement of S-(+)-naproxen relative to its R-(−) counterpart for the S-(+)-naproxen sample stored for 5 hours in the EtOH-basic buffer mixture, pH=9; 7: 3, v/v (originally published in [15]).
Figure 6. Three-dimensional presentation of the naproxen chromatogram with two development directions, 1 and 2, indicated. Densitometric scanning (at parallel 1.5-mm intervals) of the 35-mm wide track in the second direction of the development was performed to better illustrate an absolute lack of transenantiomerization for the S-(+)-naproxen sample stored for 5 hours in the EtOH-glacial acetic acid mixture, 7:3, v/v (originally published in [15])
A possible mechanism of oscillations It is a well established fact that the
oscillatory chemical processes occur incomparably less frequently, than the non-oscillatory ones. Probably the best known among the oscillatory chemical processes is the Belousov-Zhabotinskii (B-Z) reaction. The theoretical phenomena (and also those experimentally confirmed) of the oscillatory chemical processes are discussed in multiple publications, e.g., in books [16,17].
What are the necessary preconditions for
the oscillatory chemical processes to occur? The indispensable precondition is that such process be running through more than one elementary step. Besides, the oscillatory chemical processes are incomparably more probable, if at least one elementary step is not the first-order reaction, but a higher order. Finally, it is a well established fact that the oscillatory chemical processes are favourized in anisotropic liquids (and/or in those with a considerable viscosity). In such liquids, the molecular diffusion coefficients of the intermediate products strongly depend on the directions distinguished by the molecular self-organization, and they can be quite different in each direction.
One of the best known theoretical models
of the oscillatory chemical processes was elaborated by the two Belgian scientists, Prigogine and Lefevre, and it is known as Brusselator. It assumes four elementary steps, the first-order, the third-order, the second-order, and again the first-order. These four elementary steps do not refer to any known oscillatory chemical process and they are purely abstract chemical reactions. The original Brusselator is an exclusive kinetic model that applies to the perfectly homogenous reaction systems and it does not assume anisotropic properties of such systems. However, it can be implemented with a diffusion term that takes into the account not only the kinetics, but also the anisotropic diffusion of the intermediate reaction product(s) in the reaction vessel, as postulated by Turing [18]. This additional term directly results from the Fick�s Second Law and the expanded model is known as Brusselator with diffusion.
Now let us return once again to the
oscillatory transenantiomerization of the
Pak. J. Anal. Envir. Chem. Vol. 7, No. 1, (2006)
26
investigated 2-APAs. In fact, the detailed mechanism of this process (in terms of the consecutive elementary steps and their respective kinetic constants) remains fully unknown, and Schemes 1 and 2 provide a rough and temporary explanation only. E.g., the crucial role played by the basic environment as a catalyst of the observed structural inversion is not reflected in any of these two schemes. Thus one can rightfully assume that the oscillatory transenantiomerization has a more complicated mechanism than the two elementary steps only and one cannot exclude that some of these steps are of the second, or even of the third order. In our study, we managed to gather a convincing enough experimental evidence in favour of the molecular self-organization in the solutions of 2-APAs in the low-molecular-weight solvents (like, e.g., 70% ethanol and dichloromethane). E.g., in paper [19] the results of the acoustic and volumetric studies of the dilute solutions of S-(+)-naproxen in acetonitrile were presented and it was firmly established, that the limiting partial compressibility of S-(+)-naproxen
is close to zero and it decreases only slightly with an increasing temperature. In paper [20], we presented different results in favour of a considerably enhanced viscosity of the 2-APA solutions in certain low-molecular-weight solvents (as compared with the pure solvents) and/or of the molecular self-organization of the respective solutions. These results originate from such diverse measuring techniques, as viscosimetry, high-performance liquid chromatography (HPLC), and spectroscopy of the nuclear magnetic resonance (1H NMR).
The HPLC evidence of a considerably
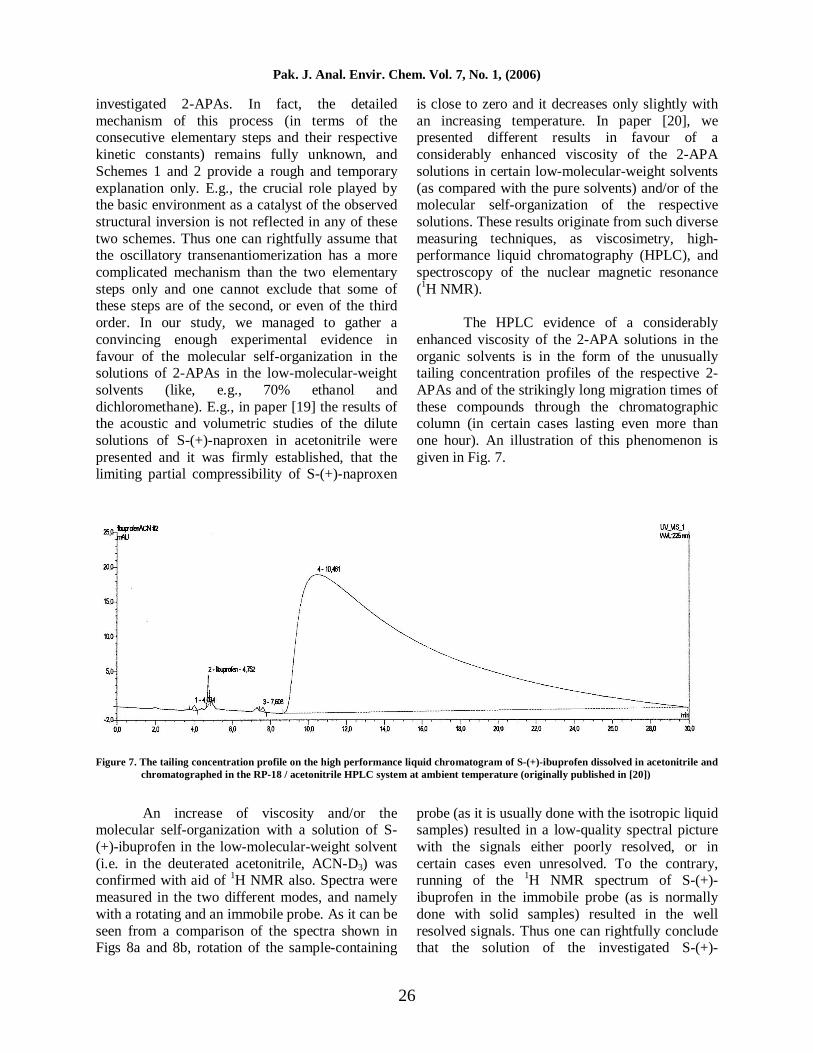
enhanced viscosity of the 2-APA solutions in the organic solvents is in the form of the unusually tailing concentration profiles of the respective 2-APAs and of the strikingly long migration times of these compounds through the chromatographic column (in certain cases lasting even more than one hour). An illustration of this phenomenon is given in Fig. 7.
Figure 7. The tailing concentration profile on the high performance liquid chromatogram of S-(+)-ibuprofen dissolved in acetonitrile and
chromatographed in the RP-18 / acetonitrile HPLC system at ambient temperature (originally published in [20])
An increase of viscosity and/or the molecular self-organization with a solution of S-(+)-ibuprofen in the low-molecular-weight solvent (i.e. in the deuterated acetonitrile, ACN-D3) was confirmed with aid of 1H NMR also. Spectra were measured in the two different modes, and namely with a rotating and an immobile probe. As it can be seen from a comparison of the spectra shown in Figs 8a and 8b, rotation of the sample-containing
probe (as it is usually done with the isotropic liquid samples) resulted in a low-quality spectral picture with the signals either poorly resolved, or in certain cases even unresolved. To the contrary, running of the 1H NMR spectrum of S-(+)-ibuprofen in the immobile probe (as is normally done with solid samples) resulted in the well resolved signals. Thus one can rightfully conclude that the solution of the investigated S-(+)-

Pak. J. Anal. Envir. Chem. Vol. 7, No. 1, (2006)
27
ibuprofen in ACN-D3 demonstrates the property of
the anisotropic liquid and in a way resembles that of a liquid crystal. This molecular self-organization of the investigated profen-containing liquid system is inevitably accompanied by an increase of the viscosity thereof.
Summing up, it seems very likely that the
well documented oscillations of the retardation factor (RF) values and also of the specific rotation ([á]D) values with the selected 2-APAs (i.e., with S-(+)-ibuprofen, S-(+)-naproxen, and S,R-(±)-2-phenylpropionic acid) are due to the oscillatory transenantiomerization of the discussed compounds. The detailed mechanism of
transenantiomerization (i.e. the respective elementary steps) for 2-APAs so far remains unknown, except for the fact that the process can be effectively catalyzed in the basic (and apparently in the amphiprotic) environment, and inhibited in the acidic one. Oscillations can be generated by the molecular self-organization and/or an enhanced viscosity of the 2-APA solutions in the selected low-molecular-weight aqueous and non-aqueous solvents. Explanation of this striking phenomenon seems to be possible by means of the Brusselator-like kinetic model (based on the knowledge of the valid elementary steps and of the kinetic constants thereof), implemented with the relevant diffusion term.
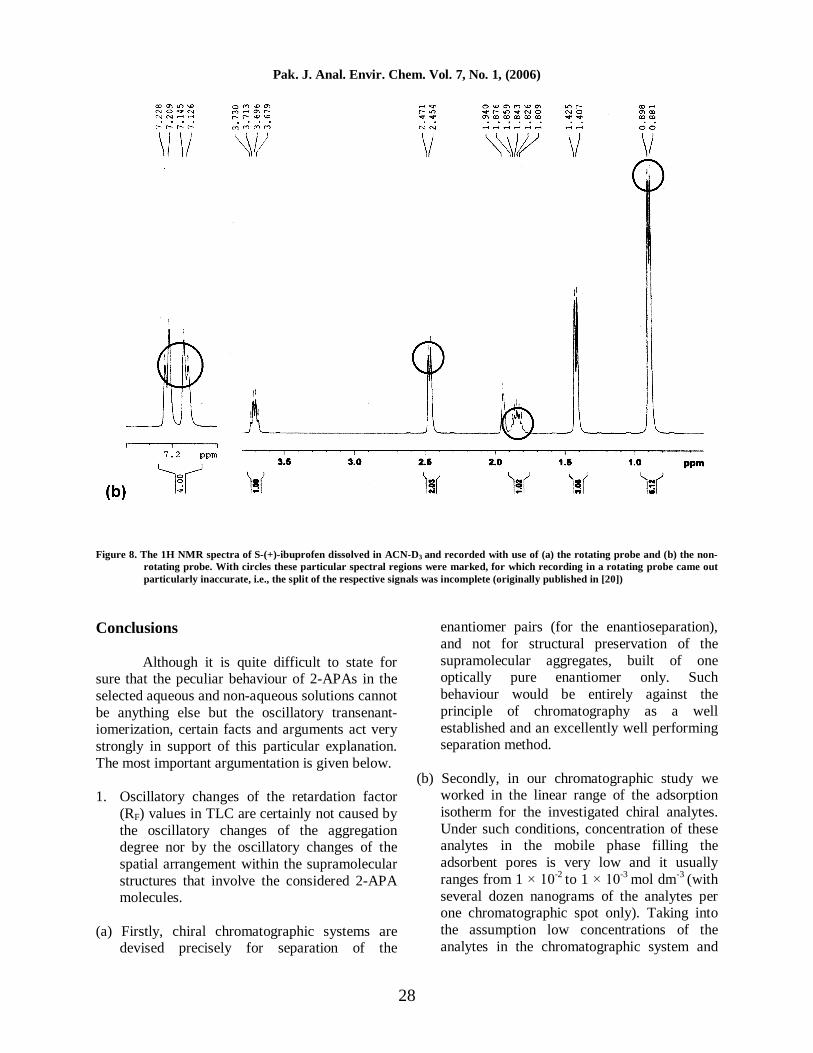
Pak. J. Anal. Envir. Chem. Vol. 7, No. 1, (2006)
28
Figure 8. The 1H NMR spectra of S-(+)-ibuprofen dissolved in ACN-D3
and recorded with use of (a) the rotating probe and (b) the non-
rotating probe. With circles these particular spectral regions were marked, for which recording in a rotating probe came out particularly inaccurate, i.e., the split of the respective signals was incomplete (originally published in [20])
Conclusions
Although it is quite difficult to state for sure that the peculiar behaviour of 2-APAs in the selected aqueous and non-aqueous solutions cannot be anything else but the oscillatory transenant-iomerization, certain facts and arguments act very strongly in support of this particular explanation. The most important argumentation is given below.
1. Oscillatory changes of the retardation factor
(RF) values in TLC are certainly not caused by the oscillatory changes of the aggregation degree nor by the oscillatory changes of the spatial arrangement within the supramolecular structures that involve the considered 2-APA molecules.
(a) Firstly, chiral chromatographic systems are
devised precisely for separation of the
enantiomer pairs (for the enantioseparation), and not for structural preservation of the supramolecular aggregates, built of one optically pure enantiomer only. Such behaviour would be entirely against the principle of chromatography as a well established and an excellently well performing separation method.
(b) Secondly, in our chromatographic study we
worked in the linear range of the adsorption isotherm for the investigated chiral analytes. Under such conditions, concentration of these analytes in the mobile phase filling the adsorbent pores is very low and it usually ranges from 1 × 10⁻²
to 1 × 10⁻³
mol dm-3
(with several dozen nanograms of the analytes per one chromatographic spot only). Taking into the assumption low concentrations of the analytes in the chromatographic system and

Pak. J. Anal. Envir. Chem. Vol. 7, No. 1, (2006)
29
additionally the presence of the adsorbent able to effectively destroy the so-called lateral (i.e., analyte-analyte) intermolecular interactions, it would be rather difficult to imagine that the oscillating RF
values originate from the different supramolecular forms of a single optically pure enantiomer only that does not decompose to the separate molecules (or to the cyclic H-bonded dimers of the discussed carboxylic acids), in spite of the one hour or more lasting development of the chromatogram.
(c) Thirdly, the narrow and symmetric
concentration profiles of ibuprofen, naproxen, and 2-phenylpropionic acid at the extreme positions on the chromatograms (i.e., at those with the lowest and the highest RF
value) point out to the fact that in these cases we encounter the pure chemical species. Moreover, the lowest RF
value corresponds well with that valid for the R-(-) species and the highest RF value with that for the S-(+) species of the investigated 2-APAs. Thus it can rightfully be concluded that the concentration profile showing the lowest numerical value of the retardation factor (RF) represents optically pure R-(-) enantiomer and that showing the highest RF
value is valid for the pure S-(+) enantiomer. The considerably less symmetrical concentration profiles appearing in the intermediate positions indicate the presence of the two chemical species that are not fully separated. These species most probably are the S-(+) and the R-(-) antimer.
(d) Finally, enantioseparations of the racemic
2-APA mixtures by means of TLC are not only possible, but also often carried out. Many such separations have been successfully performed under the chromatographic conditions either identical with, or very close to those employed in our study. Basic difference between the earlier successful enantioseparations and our own experimental results consists in the fact that the earlier enantioseparations had been carried out for the freshly prepared analyte solutions, while we investigated solutions stored for the longer periods of time prior to commencing the TLC experiment, and then we
examined the dependence of the retention parameter (RF) on the storage time (t).
2. In one of our experiments it was clearly shown
that S-(+)-naproxen stored in the basic solution undergoes a relatively rapid structural inversion and yields a considerable amount of the R-(-) antimer. Apparently, the thermody-namic equilibrium of this inversion is very rapidly attained and the solution does not show any oscillations of its specific rotation, [á]D. In another experiment, S-(+)-naproxen was stored in the acidic solution, which neither resulted in a measurable structural inversion nor in the oscillations of the solution�s specific rotation, [á]D. These two observations remain in agreement with the general knowledge of the reaction mechanisms in organic chemistry. Namely, it is a well established fact that the keto-enol tautomerism with the carboxylic acids (or formation of the respective enolic anions) is catalyzed by the basic environment and hampered by the acidic one. Moreover, it is well known that water and lower alcohols are the amphiprotic solvents, having the weak basic and the weak acidic properties. Oscillations of the specific rotation ([á]D) with solutions of the selected 2-APAs are much more vigorous in the ethanol-water mixture, than in the low-polar organic solvent. It seems that the amphiprotic nature of the ethanol-water solvent combined with a confirmed ability of 2-APAs to self-organize the molecules that constitute a solution are a sufficient precondition of the oscillatory transenantiomerization process, based on combination of the kinetic and the diffusive factor. In the case of the organic solvent that lacks amphiprotic properties, the effect of oscillations is pronounced to a perceptibly lesser degree only.
3. Apart from the amphiprotic nature of the
ethanol-water mixture, one more aspect has to be underlined, related to the efficiency of the oscillatory changes of the RF
and the [á]D values in this particular solvent. Apparently, structural inversion of 2-APAs does not occur immediately, but via the intermediate elementary steps (like, e.g., formation of keto-enol or the enolic anion). The elementary steps
Pak. J. Anal. Envir. Chem. Vol. 7, No. 1, (2006)
30
are indisputably of the ionic nature and for this particular reason the aqueous medium promotes them much better than the organic one.
4. In one experiment, S-(+)-naproxen was
dissolved and stored for the longer periods of time in three different solvents having the same quantitative (and similar qualitative) composition: (i) ethanol � buffer, pH=9 (7 : 3, v/v); (ii) ethanol � water (7 : 3, v/v); and (iii) ethanol � glacial acetic acid (7 : 3, v/v). If the spontaneous oscillations of the specific rotation ([á]D) were the result of structural changes on a supramolecular level (i.e., due to formation of the molecular aggregates with a changing structure and a changing number of the associated molecules), it could logically be awaited that in each of these three solutions similar oscillations of the specific rotation ([á]D) would be observed. However, oscillations were observed exclusively in one case, i.e., in the ethanol � water (7 : 3, v/v) mixture. This outcome seems to deny any supposals as to the supramolecular nature of the observed oscillations.
5. The ability of the selected 2-APAs � ibuprofen
and naproxen � to the in vivo structural inversion (i.e., transenantiomerization) has already been reported in the numerous papers from the fields of pharmacology and biomedicine. In our study, we have for the first time demonstrated that the structural inversion of 2-APAs can also take place in vitro. Recently, the in vitro transenantiomerization of S-(+)-ibuprofen was confirmed by another research team [21].
References 1. R. Bhushan and V. Parshad, J. Chromatogr.
A, 721, (1996) 369. 2. T. Bando, Y. Namba and K. Shishido,
Tetrahedron: Asymmetry, 8, (1997) 2159. 3. E.J. Ebbers, G. J. A. Ariaans, A. Bruggink,
and B. Zwanenburg, Tetrahedron: Asymmetry, 10, (1999) 3701.
4. Z. -L. Wu and Z. -Y. Li, Tetrahedron: Asymmetry, 12, (2001) 3305.
5. X. Yuan, J. Li, Y. Tian, G. -H. Lee, X. -M. Peng, R. Zhu, and X. You, Tetrahedron: Asymmetry, 12, (2001) 3015.
6. V. K. Tandon, Tetrahedron Lett., 42, (2001) 5985.
7. M. Sajewicz, R. Piêtka, A. Pieniak, and T. Kowalska, Acta Chromatog., 15, (2005) 131.
8. M. Sajewicz, R. Piêtka, A. Pieniak, and T. Kowalska, J. Chromatogr. Sci., 43, (2005) 542.
9. M. Sajewicz, R. Piêtka, A. Pieniak, and T. Kowalska, J. Liquid Chromatogr. Relat. Technol., 29, (2006) 2059.
10. S. Scheuerer, K. M. Williams, R. Brugger, A. J. McLachlan, K. Brune, R. O. Day and G. Geisslinger, J. Pharmacol. Experim. Therap., 284, (1998) 1132.
11. A. M. Evans, J. Clin. Pharmacol., 36, (1996) 7.
12. F. Trejtnar, V. Wsol, B. Szotakova, L. Skalova, P. Pavek, and M. Kuchar, Chirality, 11, (1999) 781.
13. Y. Xie, H. Liu, and J. Chen, Int. J. Pharmaceutics, 196, (2000) 21.
14. P. Belanger, J.G. Atkinson, and R.S. Stuart, Chem. Commun., (1969) 1067.
15. M. Sajewicz, R. Piêtka, G. Drabik, and T. Kowalska, J. Liq. Chromatogr. Relat. Technol., 29, (2006) 2071.
16. S. K. Scott, �Oscillations, Waves and Chaos in Chemical Kinetics�, Oxford University Press, Oxford, (1994).
17. P. Gray and S.K. Scott, �Chemical Oscillations and Instabilities. Non-Linear Chemical Kinetics�, Oxford University Press, Oxford, (1994).
18. A. M. Turing, Phil. Trans. R. Soc., B237, (1952) 37.
19. W. Marczak, T. Kowalska, M. Bucek, D. Piotrowski, and M. Sajewicz, J. Phys. IV France, 137, (2006) 219.
20. M. Sajewicz, R. Piêtka, P. Ku�, and T. Kowalska, Acta Chromatogr., 16, (2006) 181
21. J. Krzek, Private communication, (2006).
Pak. J. Anal. Eniro. Chem. Vol. 7, No. 1, (2006)
31
ISSN-1680-9955
Pak. J. Anal. Envir. Chem. Vol. 7, No. 1, (2006) 31 � 38
Optimization of Aqueous Enzymatic Oil Extraction from Kernel of Oil Palm (Elaeis Guineensis) Using three Phase Partitioning and Microwave Irradiation
N. SAIFUDDIN
Chemistry Unit, Department of Science; College of Engineering, University of Tenaga Nasional, Km 7, Jalan Puchong-Kajang, 43900 Kajang, Selangor, Malaysia
E-mail: [email protected]
Abstract The use of microwave irradiation as a pretreatment before aqueous enzymatic oil extraction from oil palm kernel was found to be useful. The microwave irradiation for 10 min -assisted extraction was found to be a simpler and more effective alternative to the solvent extraction methods for the productions of palm kernel oil. Further enhancement was achieved when the microwave irradiated slurries were treated with a commercial enzyme preparation of proteases, followed by three phase partitioning. This resulted in 93% (w/w) oil yields form the palm kernel. The efficiency of the present technique is comparable to solvent extraction with an added advantage of being less time consuming and using t-butanol which is a safer solvent as compared to n-hexane used in conventional oil extraction process. The technique also tries to reduce the amount of enzyme used and hence reduces the overall cost. Key words: Microwave irradiation; palm kernel; aqueous enzymatic extraction; three phase
partitioning. Introduction Industrial processes for the extraction of edible oil from oilseeds generally involve a solvent extraction step which may or may not be preceded by pressing. Extraction with n-hexane is a widely used approach for obtaining edible oils [1]. For such processes, it is possible to achieve oil yields in excess of 95%. The new tendency to avoid the use of toxic organic solvents in large installations has renewed interest in alternative extraction processes (involving the use of water, alcohol aqueous solutions and supercritical fluids) and has led during the last three decades to continuous research on biorenewable solvents [2,3]. Three phase partitioning has been extensively used for both upstream and downstream steps in bioseparation of proteins/enzymes [4,5].
Although water is not a specific oil solvent, aqueous processes represent an innovation in extraction technology for any processed oilseed [3, 6-10]. Aqueous oil extraction is undoubtedly an emerging technology in the fats and oil industry since it presents no risks of fires and explosions, the solvent is not toxic, the mild processing ensures high quality in the products of the process, and does not produce volatile organic compounds (VOC) as pollutants. The operation is more flexible since start-up and shut-down are safer in the absence of flammable solvents. The main disadvantages, as compared to conventional technologies, are the lower efficiency of oil extraction, the reduction of the product stability, which contains more residual oil and the ease of microbial contamination. Permeability of the cells wall to oil passage can be increased either by mechanical or thermal conditioning or by enzymatic digestion of the cell walls. Aqueous *Author for Correspondence

Pak. J. Anal. Eniro. Chem. Vol. 7, No. 1, (2006)
32
enzymatic oil extraction (AEOE) has emerged as a promising technique for extraction of oil from plant materials [11,12]. Its main advantages are that it is environment friendly and does not produce volatile organic compounds as atmospheric pollutants [13]. The use of hydrolytic enzymes in aqueous enzymatic oil extraction (AEOE) has enhanced the oil yield of the aqueous extraction process. Cellulose, hemicellulose and pectic substances constitute 80-90% of the cell wall polysaccharide [14-16] and hence the use of these hydrolytic enzymes will facilitate the release of oil from oil bodies enmeshed in protein and cellulosic/hemicellulosic network [13]. One disadvantage associated with AEOE is the long process time which are necessary for enzymes to liberate oil bodies. Another factor (sometime neglected) is the use of enzymes which are not commercially available [17]. Palm oil is reddish-orange oil extracted from the mesocarp of the oil palm (Elaeis guineensis) fruit. A unique feature the oil palm has over other oil crops is that it can deliver two quite distinct types of oil - palm oil from the flesh of the fruit (a mixture of oleic, C18:1 and palmitic oils, C16:0 and about 50% saturated), and palm kernel oil from the seed or kernel (mainly lauric acid, C12:0, and more than 80% saturated). For every 10 tonnes of palm oil, about 1 tonne of palm kemel oil is also obtained [18-20]. The fruits of the oil palm contain between 55 and 70 percent of oil. The seeds of the fruit, the seed kernels also contain oil [21]. There are various methods used to extract the palm oil from the pulp and the seed. The method used most extensively is pressing the pulp to remove the oil. In palm oil milling, the fruits are steam-sterilized and digested for about 40 minutes, the mesocarp is separated from the kernel before pressing it to extracted the oil. The aim of this pre-treatment step is basically to break up the oil-bearing cells (also known as lipid bodies or oleosomes) in order to facilitate the release the oil [10]. The kernel oil is extracted by crushing and pressing or can be done with the help of solvents. Palm kernel may contain up to 50% oil per total weight of the kernels. Palm kernel cake (PKC) is the solid residue left from the extraction of oil from palm kernel. The oil is extracted from the kernel by expeller, i.e. continuous screw press.
Selected enzymes have been tried on different types of oilseeds, resulting in extraction yields much higher than the original aqueous process (in some cases of over 90%). These enzymes mainly hydrolyze the structural polysaccharides which form the cell wall of oilseeds or the proteins which form the cell and lipid body membrane. This concept has already been commercialized for the production of olive oil and has also been investigated for other oil-bearing materials [10, 11, 22-24] The present work describes an alternative approach for extraction of palm kernel oil using aqueous extraction together with protein degrading enzyme, microwave irradiation and three phase partitioning (TPP) for further optimization of oil extraction process. Materials and Methods Materials From the total fruits approximately 5% of kernels would be produced. These kernels would then have to undergo another level of oil extraction. The Palm kernel (dehulled) contains approximately 50% oil and around 80-85% of the oil can be removed by extraction [20]. The oil palm fruits were a gift from MPOB Bangi, Selangor. The kernels were ground using a hammer mill running at 478 RPM. A stainless steel screen with a mesh size of 2 mm was used to obtain a uniform particle size. The ground kernels were wrapped in airtight plastic bags and stored at 4oC until used. Enzyme The enzyme used in this study was a protease (Alcalase), which operates optimally under basic conditions. It was selected based on previous work by Rosenthal, et. al. [11] that found that extraction of oil from soybean using protease resulted in significantly higher yields of oil. The protease used in the experiments, Alcalase 2.4L (Novo Nordisk), had a declared activity of 2.4 AU/g (AU = Anson Unit), which is equivalent to 2,736 I.U. (international standard unit) when soya isolate at pH 8.0 and 50°C was used as substrate.
Pak. J. Anal. Eniro. Chem. Vol. 7, No. 1, (2006)
33
Methods
Preparation of palm kernel
After removing the fruits from the bunch, about 100-150g of the fruits were put in a beaker and water was added so as to submerge the fruits. The beaker was put in a microwave oven equipped with magnetic stirer and non-contact infrared continuous feedback temperature system (model RM 800, Plazmatronika, Wroclaw, Poland; operating frequency 2.5 GHz). The temperature was set at 100oC (for 10 min). The next step was to pound the fruits while they are still hot and soft to separate the mesocarp from the nut. The nuts were cracked, the shell carefully removed and the kernel thus obtained were used for oil extraction.
Grinding
The palm kernels were ground using a hammer mill (Standard Model No.3, Arthur Thomas Co., Philadelphia, PA, U.S.A.) running at 478 RPM. A stainless steel screen with a mesh size of 4 mm, 2 mm, 1.0 mm and 0.75 mm was used to obtain a uniform particle size of the above range. The ground kernels were kept in air tight plastic bags until used. Some studies have shown that particle size can play an important role in oil extraction yield [11, 25]. Aqueous phase oil extraction and effect of particle size Preliminary study was conducted to see the effect of particle size on the yield of oil. This will be used as basis for selection of best particle size for other experiments and also as a basis for calculation of oil recovery for the other method. The ground kernel (25g) of the various particle sizes as mentioned above, were dispersed in 100 ml distilled water and stirred to make a suspension. The pH of the suspension was adjusted to 8.0, and was heated to 50oC overnight with constant shaking at 100 rpm (same condition as used later for enzymatic extraction). The upper oil phase was collected after centrifugation at 10,000 x g for 20
min and weighed. The amounts of oil recovered were calculated as percentages of total oil present in palm seed kernels, which was determined by soxhlet extraction using hexane as a solvent as per the standard AOAC procedure [26]. The particle size that gave the highest oil yield was then used in all subsequent experiments. The solvent extraction of oil using the AOAC method was taken as 100% recovery of oil while calculating the oil recovery by the other subsequent methods. Effect of microwave on aqueous oil extraction (AOE) To see the effect of microwave irradiation, the ground kernels (25g) of particle size 0.75 mm (since it gave slightly higher oil yield as compared with larger size particles as determined above) were dispersed in 100 ml distilled water and stirred to make a suspension. The pH of the suspension was adjusted to 8.0 as above. The slurry was heated to using microwave irradiation (output power 700 Watt) with constant stirring using build in magnetic stirrer for 2, 4, 6, 8 and 10 min. Another sample which was not treated with microwave was used as a control. The upper oil phase was collected after centrifugation at 10,000 x g for 20 min and weighed. The amounts of oil recovered were calculated as percentages of total oil present in palm seed kernels using the standard AOAC procedure as above [26]. Microwave assisted aqueous enzymatic oil extraction process (AEOE) The hydrolytic enzymatic treatment to enhance oil extractability was performed. As above, the ground kernels (25g) of particle size 0.75 mm were dispersed in 100 ml distilled water and stirred to make a suspension. The pH of the suspension was adjusted to 8.0 (optimum pH for enzyme activity). As mentioned above in 2.2.2 the sample was subjected to microwave irradiation (output power 700 Watt) with constant stirring using build in magnetic stirrer for 6 min. For comparison another sample was subjected to aqueous extraction using the similar method as described in 2.2.3, at 50oC for overnight with constant shaking at 100 rpm (no microwave irradiation). Then 1% (v/w) of the protease enzyme Alcalase was added separately to both samples and

Pak. J. Anal. Eniro. Chem. Vol. 7, No. 1, (2006)
34
the mixture were incubated at 50oC for 1 hr. The upper oil phase was collected as described above and the amounts of oil recovered from both samples were calculated as previously mentioned. Extraction of oil by three phase partitioning after enzyme treatment Recently three phase portioning has been reported as an alternative method for oil extraction [12]. Both the samples (microwave treated and non microwave treated) after enzymatic treatment were subjected to three phase partitioning as described previously by Sharma et al., (2002). The pH was adjusted to 7. Varying amount of ammonium sulphate (20%, 30%, 40%, 50% and 60% (w/v) was added to the samples and mixed gently, followed by the addition of the 100 ml of t-butanol (ratio of sample slurry to t-butanol is 1:1; v/v). The mixture was mixed gently and allowed to stand for 1 hr at 25oC for the three phase formation. The three phases formed were separated by centrifugation at 2000g for 10min. The upper organic layer was collected and evaporated on a rotary evaporator to obtain oil extracted in this phase. The amounts of oil recovered were calculated as percentages of total oil present in the kernel. The amount of oil present in these sources was determined by soxhlet extraction using hexane as a solvent as per the standard procedure as mentioned above [26]. The solvent extraction of mango kernel/soybean/rice bran gave yields of 16, 25 and 16.5 g/100 g of plant sources taken (w/w), respectively. Further study on the effect of varying pH was done. Using the optimal ammonium sulphate concentration as obtain above, the pH of the samples was varied. Before the addition of ammonium sulphate, the pH of the samples were adjusted to 4, 7 or 9 by adding 0.1N HCl or 0.1N NaOH. The sample then gentle stirred with a magnetic stirrer. Subsequently the samples were subjected to three phase partitioning as described previously. Calculation of the oil recovery The amount of oil released was calculated as a percentage of the total oil present in the palm kernel. The latter was determined by soxhlet
extraction using hexane as a solvent as per the standard AOAC procedure [26]. The soxhlet solvent extraction of palm kernel gave a yield of 42 g oil/100g of palm kernel. For calculation of the oil recovery by aqueous extraction, aqueous enzymatic extraction methods and three phase partitioning, a value of 42 g oil /100g palm kernel was taken as 100% recovery of the oil. Each extraction was run in duplicate and the yields were found to agree in duplicates within 3%. Results and Discussion
The effect of particle size on oil extraction yield was determined. Particle size reduction from more than 1 mm to 0.75 mm gave slight improvement in the oil extraction for the smaller sizes. The increased was around 7-8 % higher for the smaller size particles. Since it was found that particle size of 0.75 mm gave slight better yield compared to other larger particle sizes, it was chosen for further experiments. The effect of particle size in aqueous extraction has been shown previously in studies on aqueous extraction of oil from sunflower kernel [23] and soybean [11]. Microwave irradiation is emerging as a powerful tool to accelerate many chemical and physical processes. Previously it has been shown that ultrasonication can increase the oil yield during aqueous oil extraction (AOE) [17, 27]. It was shown that using ultrasonication as a pretreatment allows one to cut down the process time to about 6 h without reducing the over all yield [17]. Fig. 1 shows the effect of microwave irradiation exposure time on the oil yield by aqueous oil extraction method as mentioned in section 2.2.4. Six minutes of microwave exposure gave about 52% oil yield while the sample that was not exposed to microwave irradiation (at time 0 min.) gave only about 25% oil yield. This clearly shows that microwave treatment greatly enhances the oil extraction process. Although the enhancement in rate of many chemical reactions have been reported using microwave irradiation, it is still not very clear whether the enhancement are purely due to thermal effects or other non thermal effects [28]. It has been shown that microwave irradiation causes the some protein structural changes which make them become more granular shape instead of �splattered� structure. This
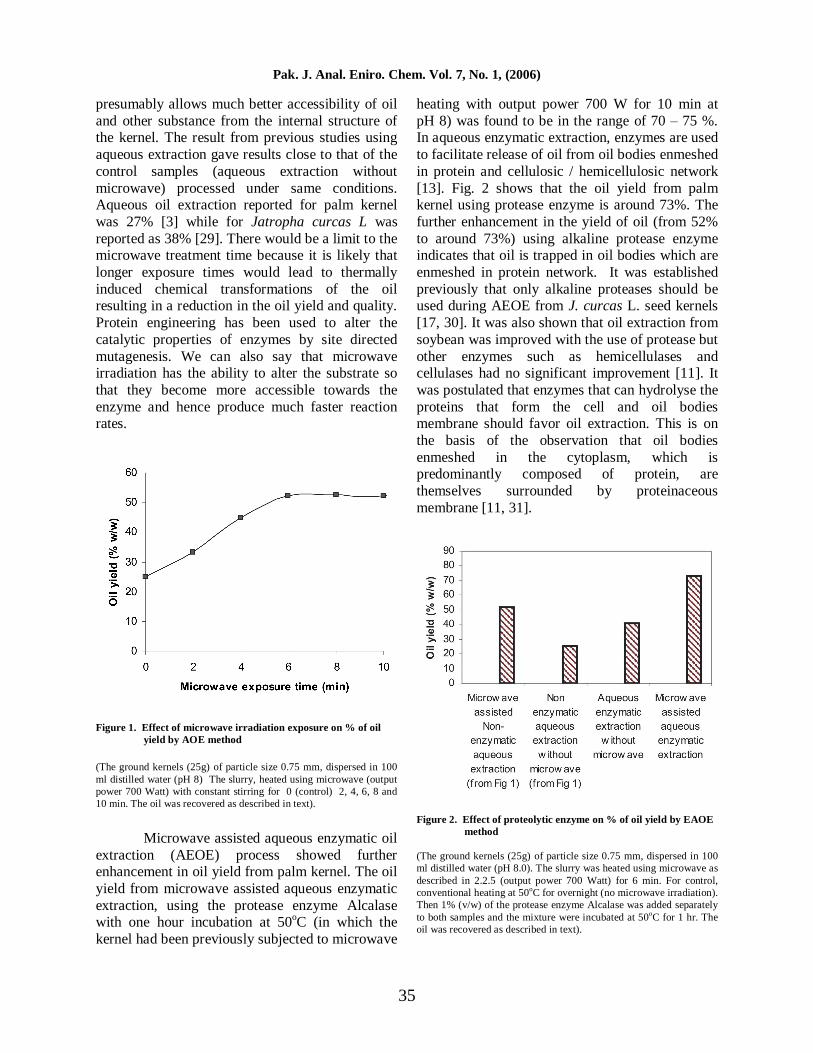
Pak. J. Anal. Eniro. Chem. Vol. 7, No. 1, (2006)
35
presumably allows much better accessibility of oil and other substance from the internal structure of the kernel. The result from previous studies using aqueous extraction gave results close to that of the control samples (aqueous extraction without microwave) processed under same conditions. Aqueous oil extraction reported for palm kernel was 27% [3] while for Jatropha curcas L was reported as 38% [29]. There would be a limit to the microwave treatment time because it is likely that longer exposure times would lead to thermally induced chemical transformations of the oil resulting in a reduction in the oil yield and quality. Protein engineering has been used to alter the catalytic properties of enzymes by site directed mutagenesis. We can also say that microwave irradiation has the ability to alter the substrate so that they become more accessible towards the enzyme and hence produce much faster reaction rates.
Figure 1. Effect of microwave irradiation exposure on % of oil
yield by AOE method (The ground kernels (25g) of particle size 0.75 mm, dispersed in 100 ml distilled water (pH 8) The slurry, heated using microwave (output power 700 Watt) with constant stirring for 0 (control) 2, 4, 6, 8 and 10 min. The oil was recovered as described in text).
Microwave assisted aqueous enzymatic oil extraction (AEOE) process showed further enhancement in oil yield from palm kernel. The oil yield from microwave assisted aqueous enzymatic extraction, using the protease enzyme Alcalase with one hour incubation at 50oC (in which the kernel had been previously subjected to microwave
heating with output power 700 W for 10 min at pH 8) was found to be in the range of 70 � 75 %. In aqueous enzymatic extraction, enzymes are used to facilitate release of oil from oil bodies enmeshed in protein and cellulosic / hemicellulosic network [13]. Fig. 2 shows that the oil yield from palm kernel using protease enzyme is around 73%. The further enhancement in the yield of oil (from 52% to around 73%) using alkaline protease enzyme indicates that oil is trapped in oil bodies which are enmeshed in protein network. It was established previously that only alkaline proteases should be used during AEOE from J. curcas L. seed kernels [17, 30]. It was also shown that oil extraction from soybean was improved with the use of protease but other enzymes such as hemicellulases and cellulases had no significant improvement [11]. It was postulated that enzymes that can hydrolyse the proteins that form the cell and oil bodies membrane should favor oil extraction. This is on the basis of the observation that oil bodies enmeshed in the cytoplasm, which is predominantly composed of protein, are themselves surrounded by proteinaceous membrane [11, 31].
Figure 2. Effect of proteolytic enzyme on % of oil yield by EAOE
method (The ground kernels (25g) of particle size 0.75 mm, dispersed in 100 ml distilled water (pH 8.0). The slurry was heated using microwave as described in 2.2.5 (output power 700 Watt) for 6 min. For control, conventional heating at 50oC for overnight (no microwave irradiation). Then 1% (v/w) of the protease enzyme Alcalase was added separately to both samples and the mixture were incubated at 50oC for 1 hr. The oil was recovered as described in text).
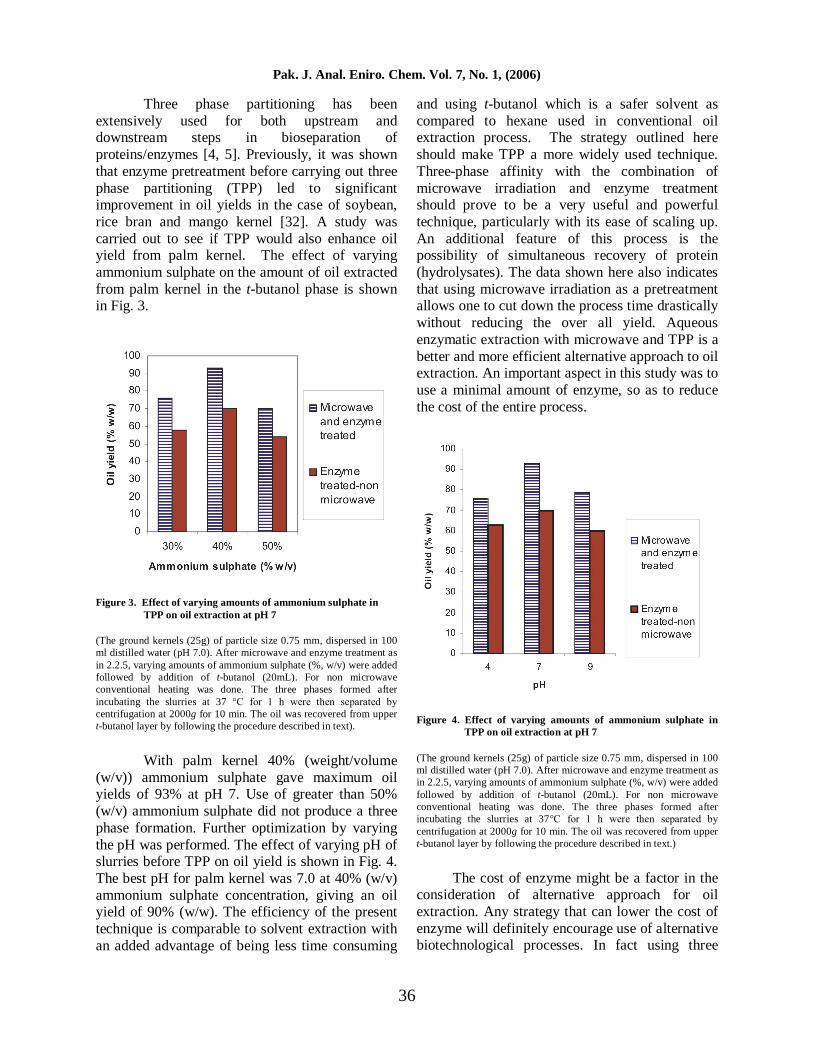
Pak. J. Anal. Eniro. Chem. Vol. 7, No. 1, (2006)
36
Three phase partitioning has been extensively used for both upstream and downstream steps in bioseparation of proteins/enzymes [4, 5]. Previously, it was shown that enzyme pretreatment before carrying out three phase partitioning (TPP) led to significant improvement in oil yields in the case of soybean, rice bran and mango kernel [32]. A study was carried out to see if TPP would also enhance oil yield from palm kernel. The effect of varying ammonium sulphate on the amount of oil extracted from palm kernel in the t-butanol phase is shown in Fig. 3.
Figure 3. Effect of varying amounts of ammonium sulphate in
TPP on oil extraction at pH 7 (The ground kernels (25g) of particle size 0.75 mm, dispersed in 100 ml distilled water (pH 7.0). After microwave and enzyme treatment as in 2.2.5, varying amounts of ammonium sulphate (%, w/v) were added followed by addition of t-butanol (20mL). For non microwave conventional heating was done. The three phases formed after incubating the slurries at 37 °C for 1 h were then separated by centrifugation at 2000g for 10 min. The oil was recovered from upper t-butanol layer by following the procedure described in text).
With palm kernel 40% (weight/volume (w/v)) ammonium sulphate gave maximum oil yields of 93% at pH 7. Use of greater than 50% (w/v) ammonium sulphate did not produce a three phase formation. Further optimization by varying the pH was performed. The effect of varying pH of slurries before TPP on oil yield is shown in Fig. 4. The best pH for palm kernel was 7.0 at 40% (w/v) ammonium sulphate concentration, giving an oil yield of 90% (w/w). The efficiency of the present technique is comparable to solvent extraction with an added advantage of being less time consuming
and using t-butanol which is a safer solvent as compared to hexane used in conventional oil extraction process. The strategy outlined here should make TPP a more widely used technique. Three-phase affinity with the combination of microwave irradiation and enzyme treatment should prove to be a very useful and powerful technique, particularly with its ease of scaling up. An additional feature of this process is the possibility of simultaneous recovery of protein (hydrolysates). The data shown here also indicates that using microwave irradiation as a pretreatment allows one to cut down the process time drastically without reducing the over all yield. Aqueous enzymatic extraction with microwave and TPP is a better and more efficient alternative approach to oil extraction. An important aspect in this study was to use a minimal amount of enzyme, so as to reduce the cost of the entire process.
Figure 4. Effect of varying amounts of ammonium sulphate in
TPP on oil extraction at pH 7 (The ground kernels (25g) of particle size 0.75 mm, dispersed in 100 ml distilled water (pH 7.0). After microwave and enzyme treatment as in 2.2.5, varying amounts of ammonium sulphate (%, w/v) were added followed by addition of t-butanol (20mL). For non microwave conventional heating was done. The three phases formed after incubating the slurries at 37°C for 1 h were then separated by centrifugation at 2000g for 10 min. The oil was recovered from upper t-butanol layer by following the procedure described in text.)
The cost of enzyme might be a factor in the
consideration of alternative approach for oil extraction. Any strategy that can lower the cost of enzyme will definitely encourage use of alternative biotechnological processes. In fact using three
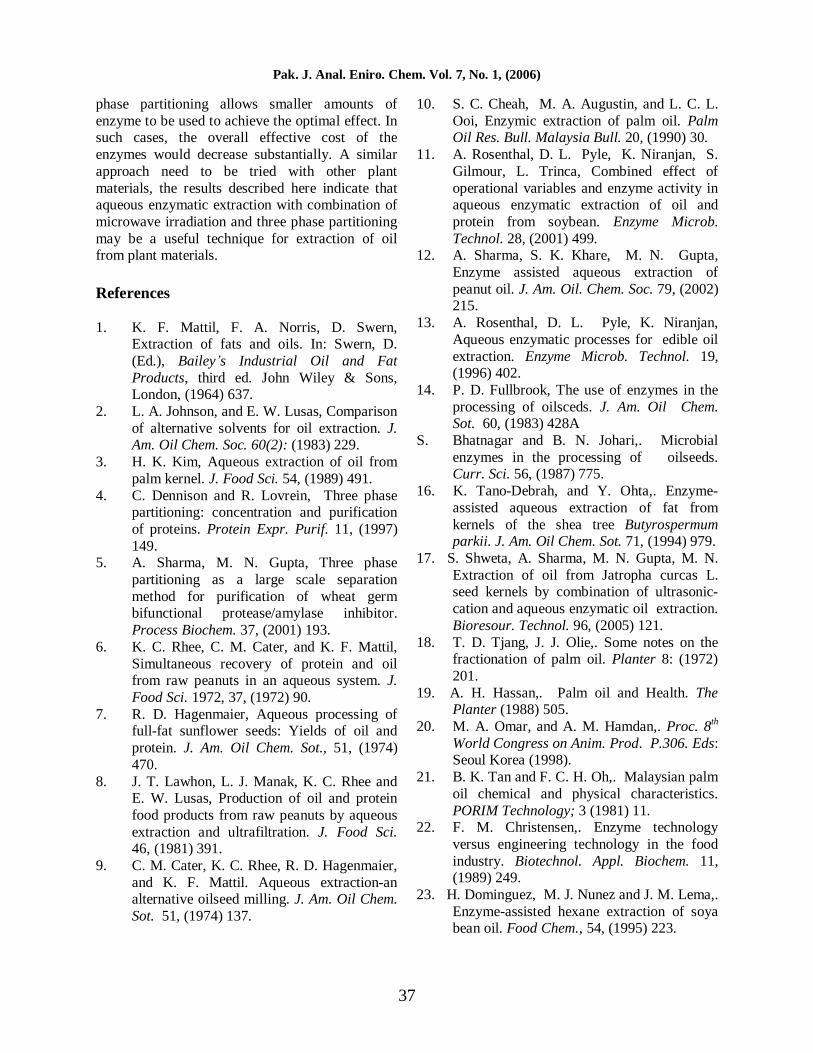
Pak. J. Anal. Eniro. Chem. Vol. 7, No. 1, (2006)
37
phase partitioning allows smaller amounts of enzyme to be used to achieve the optimal effect. In such cases, the overall effective cost of the enzymes would decrease substantially. A similar approach need to be tried with other plant materials, the results described here indicate that aqueous enzymatic extraction with combination of microwave irradiation and three phase partitioning may be a useful technique for extraction of oil from plant materials. References 1. K. F. Mattil, F. A. Norris, D. Swern,
Extraction of fats and oils. In: Swern, D. (Ed.), Bailey�s Industrial Oil and Fat Products, third ed. John Wiley & Sons, London, (1964) 637.
2. L. A. Johnson, and E. W. Lusas, Comparison of alternative solvents for oil extraction. J. Am. Oil Chem. Soc. 60(2): (1983) 229.
3. H. K. Kim, Aqueous extraction of oil from palm kernel. J. Food Sci. 54, (1989) 491.
4. C. Dennison and R. Lovrein, Three phase partitioning: concentration and purification of proteins. Protein Expr. Purif. 11, (1997) 149.
5. A. Sharma, M. N. Gupta, Three phase partitioning as a large scale separation method for purification of wheat germ bifunctional protease/amylase inhibitor. Process Biochem. 37, (2001) 193.
6. K. C. Rhee, C. M. Cater, and K. F. Mattil, Simultaneous recovery of protein and oil from raw peanuts in an aqueous system. J. Food Sci. 1972, 37, (1972) 90.
7. R. D. Hagenmaier, Aqueous processing of full-fat sunflower seeds: Yields of oil and protein. J. Am. Oil Chem. Sot., 51, (1974) 470.
8. J. T. Lawhon, L. J. Manak, K. C. Rhee and E. W. Lusas, Production of oil and protein food products from raw peanuts by aqueous extraction and ultrafiltration. J. Food Sci. 46, (1981) 391.
9. C. M. Cater, K. C. Rhee, R. D. Hagenmaier, and K. F. Mattil. Aqueous extraction-an alternative oilseed milling. J. Am. Oil Chem. Sot. 51, (1974) 137.
10. S. C. Cheah, M. A. Augustin, and L. C. L. Ooi, Enzymic extraction of palm oil. Palm Oil Res. Bull. Malaysia Bull. 20, (1990) 30.
11. A. Rosenthal, D. L. Pyle, K. Niranjan, S. Gilmour, L. Trinca, Combined effect of operational variables and enzyme activity in aqueous enzymatic extraction of oil and protein from soybean. Enzyme Microb. Technol. 28, (2001) 499.
12. A. Sharma, S. K. Khare, M. N. Gupta, Enzyme assisted aqueous extraction of peanut oil. J. Am. Oil. Chem. Soc. 79, (2002) 215.
13. A. Rosenthal, D. L. Pyle, K. Niranjan, Aqueous enzymatic processes for edible oil extraction. Enzyme Microb. Technol. 19, (1996) 402.
14. P. D. Fullbrook, The use of enzymes in the processing of oilsceds. J. Am. Oil Chem. Sot. 60, (1983) 428A
S. Bhatnagar and B. N. Johari,. Microbial enzymes in the processing of oilseeds. Curr. Sci. 56, (1987) 775.
16. K. Tano-Debrah, and Y. Ohta,. Enzyme-assisted aqueous extraction of fat from kernels of the shea tree Butyrospermum parkii. J. Am. Oil Chem. Sot. 71, (1994) 979.
17. S. Shweta, A. Sharma, M. N. Gupta, M. N. Extraction of oil from Jatropha curcas L. seed kernels by combination of ultrasonic-cation and aqueous enzymatic oil extraction. Bioresour. Technol. 96, (2005) 121.
18. T. D. Tjang, J. J. Olie,. Some notes on the fractionation of palm oil. Planter 8: (1972) 201.
19. A. H. Hassan,. Palm oil and Health. The Planter (1988) 505.
20. M. A. Omar, and A. M. Hamdan,. Proc. 8th World Congress on Anim. Prod. P.306. Eds: Seoul Korea (1998).
21. B. K. Tan and F. C. H. Oh,. Malaysian palm oil chemical and physical characteristics. PORIM Technology; 3 (1981) 11.
22. F. M. Christensen,. Enzyme technology versus engineering technology in the food industry. Biotechnol. Appl. Biochem. 11, (1989) 249.
23. H. Dominguez, M. J. Nunez and J. M. Lema,. Enzyme-assisted hexane extraction of soya bean oil. Food Chem., 54, (1995) 223.

Pak. J. Anal. Eniro. Chem. Vol. 7, No. 1, (2006)
38
24. A. Sharma, S. K. Khare, and M. N. Gupta,. Three phase partitioning for extraction of oil from soybean. Bioresour. Technol. 85, (2002) 327.
25. A. Rosenthal, D. L. Pyle, K. Niranjan,. Mechanisms in the simultaneous aqueous extraction of oil and protein from soybean. Transactions of The Institute of Chemical Engineers. Part C. Food and Bioproducts 76: (1998) 224.
26. W. Horowitz,. Methods of Analysis of the Association of Official Analytical Chemists, Washington, DC (1984).
27. Szentmihalyi, K., Vinkler, P., Lakatos, B., Illes, V. and Then, M. Rose hip (Rosa canina L.) oil obtained from waste hip seeds by different extraction methods. Bioresour. Technol. 82, (2002) 195.
28. M. N. Gupta and I. Roy, I., Enzymes in organic media: Forms, functions and application. Eur. J. Biochem. 271, (2004) 2575.
29. G. M. Gubitz, M. Mittelbach, M. Trabi, M. Exploitation of the tropical oil seed plant Jatropha curcas L. Bioresour. Technol. 67, (1999) 73.
30. Winkler, E., Foidl, N., Gubitz, G.M., Staubman, R., Steiner, W. Enzyme supported oil extraction from Jatropha curcas seeds. Appl. Biochem. Biotechnol. 65, 4 (1997) 49.
31. Tzen J. T. C. and Huang A. H. C.,. Surface structure and properties of plant seed oil bodies. J. Biol. Chem; 117: (1992) 327.
32. R. Gaur, A. Sharma, S. K. Khare, and M. N. Gupta, M. N., A novel process for extraction of edible oils Enzyme assisted three phase partitioning (EATPP). Bioresour. Technol.; 98, (2007) 696.
Pak. J. Anal. Envir. Chem. Vol. 7, No. 1, (2006)
39
ISSN-1680-9955
Pak. J. Anal. Envir. Chem. Vol. 7, No. 1, (2006) 39 � 47
Natural Phenolic Antioxidants in Human Fluids: Analytical Approaches and Antioxidant Capacity Studies
KAI ZHANG AND YUEGANG ZUO*
Department of Chemistry and Biochemistry, University of Massachusetts, Dartmouth 285 Old Westport Road, North Dartmouth, MA 02747, USA
*E-mail: [email protected]
Abstract Phenolic compounds are the most abundant natural antioxidants in our diet. Epidemiological studies have shown the possible prevention effects of consumption of fruits and vegetables rich in phenolic compounds on degenerative diseases, such as cardiovascular diseases and cancers. However, there is a serious lack of fundamental knowledge on the uptake and metabolism of phenolic compounds in humans. It is clear that phenolic molecules, only absorbed by humans, can exert biological effects. This review presents a current knowledge on the analytical methods, antioxidant capacity measurements, as well as research strategies related to natural phenolic antioxidants on human health. Both GC-MS and LC-MS have proved to be very useful analytical techniques that can be employed to identify and quantitate targeted phenolic antioxidants and their metabolites in biofluids. Free radical quenching tests provide a direct measurement of antioxidant capacity but lack specificity and may oversimplify the in vivo human physiological environment. Research strategies are diverse and mainly focused on positive health effect of antioxidants. In the future studies, multiple potential bioactivities, both positive and negative, should be considered. Keywords: Natural phenolic antioxidants, flavonoids, antioxidant capacity, free radicals, HPLC,
GC-MS, LC-MS, plasma, urine. Introduction All aerobic cells can produce free radicals and reactive oxygen species (ROS), which are believed to participate in many bioactivities via redox reactions. For example, in vivo, one or two electron reduction of O2 generates O2
- radical and H2O2, respectively, both of which can convert into OH radical in the presence of transitional metal ions (Fe3+ or Cu2+) [1-4]. Hydroxyl radical is extremely reactive and can initiate oxidative modification of biomolecules. Both endogenous and exogenous sources lead to the production of intracellular free radicals. Normally, mitochondrial electron transport, peroxisomal fatty acid metabolism, cytosolic enzyme systems, and phagocytic cells are the major endogenous contributors to the formation of free radicals and ROS. Exogenously,
UV irradiation, exposure to environmental toxins, smoking, and even dietary can significantly affect the free radical concentration in human intracellular environment [3-7]. Studies have shown that free radicals are essential for normal cellular metabolism. Free radicals and ROS are extensively involved with gene expression and signal transduction pathways, as well as regulation of cell growth [7-10]. On the other hand, although the related mechanisms have not been well documented, it is conclusive that free radicals can cause harm in human body [11-14]. It is speculated that aging, heart disease, cancer, Parkinson�s disease, Alzheimer�s disease are all free radical related since free radicals can damage DNA,
*Author for Correspondence
Review

Pak. J. Anal. Envir. Chem. Vol. 7, No. 1, (2006)
40
O
OH
R2
R3
R1
OH
O OH
Benzoic acid R1 = R2 = R3 = H p-Hydroxyphenylacetic Acid o-Hydroxybenzoic Acid R1 = OH, R2 = R3 = H m-Hydroxybenzoic Acid R1 = R3 = H, R2 = OH p-Hydroxybenzoic Acid R1 = R2 = H, R3 = OH o-Phthalic Acid R1 = COOH, R2 = R3 = H 2,3-Dihydroxybenzoic Acid R1 = R2 = OH, R3 = H Vanillic Acid R1 = H, R2 = OCH3, R3 = OH 2,4-Dihydroxybenzoic Acid R1 = R3 = OH, R2 = H
O
OH
R1
R2
R3
R4
OH
OH
OH
trans-Cinnamic Acid R1 = R2 = R3 = R4 = H trans-Resveratrol o-Hydroxycinnamic Acid R1= OH R2 = R3 = R4 = H p-Coumaric Acid R1 = R2 = R4 = H, R3 = OH Ferulic Acid R1 = R4 = H, R2 = OCH3, R3 = OH Caffeic Acid R1 = R4 = H, R2 =R3 = OH Sinapic Acid R1 = H, R2 = R4 = OCH3, R3 = OH
O
OHOH
OH
OH
OH
O
OHOH
OH
OH
OH
Catechin (-)-Epicatechin
O
OOH
8
7
6
5
2'
3'
4'
5'
6'
Flavanols Quercetin 5=7=3�=4�=OH Myricetin 5=7=3�=4�=5�=OH Kaempferol 5=7=4�= OH Galangin 5=7=OH Fisetin 7=3�=4�= OH
Figure 1. Chemical Structures of Common Natural Antioxidants.

Pak. J. Anal. Envir. Chem. Vol. 7, No. 1, (2006)
41
Oxidize cell membrane lipids, and modify enzymes via oxidation if the free radicals and ROS overwhelm the antioxidant systems. Human antioxidant defense system consists of three groups: (i) a variety of antioxidant enzymes such as catalase, and glutathione peroxidase; (ii) a special protein family-peroxiredoxins; and (iii) various small organic compounds such as vitamin A, C, and E, glutathione, and phenolic substances, most of which can be supplied via daily dietary [15-22]. Corresponding antioxidant mechanisms and their sources vary by these species. Antioxidant enzymes and peroxiredoxins are regulated by gene expression and biomessengers. The antioxidant organic compounds are absorbed from ingested food and beverage. The main natural antioxidant components are phenolic compounds derived from vegetables, fruits and other plants, which can be categorized as simple phenolic acids, such as hydroxybenzoic acids, phenylpropanoids (hydroxycinnamic acids), flavonoids (hydroxylated polyphenols), and complex derivatives of these compounds Fig. 1 presents the structures of some common natural phenolic antioxidants. Animal or human cells cannot break down the phenol ring so the consumption of these substances via fruits or vegetables will not produce energy but in the past decade people have never ceased pursuing the possible health benefits associated with the consumption of polyphenol-rich foods, which is due to the fact that phenolic compounds can neutralize free radicals that would adversely affect human health [23-27].
Epidemiological evidence such as studies focused on �French Paradox� makes dietary supplementation a very promising and practical approach to improve the antioxidant defense, which has been supported by amounting in vitro and in vivo studies. Red wine [28-30], olive oil [31], tea [17, 32], coffee [33, 34], cocoa [35], cranberry [19, 36-39], tomato, and other phenol-rich or flavonoid-rich food and beverage have been examined for their antioxidant potential. Successful application of this approach requires a thorough understanding about the metabolism of antioxidants, mechanism of in vivo antioxidant capacity, optimal dosage, and appropriate bioenvironment in which natural antioxidants can affect human antioxidant system. Nevertheless, biospecificity of an antioxidant also should be
investigated. For example, vitamin E showed protective effects in Alzheimer�s disease but not in early Parkinson�s disease [40,41]. Indeed, this approach is much more complicate than it seems to be. This paper provides a minireview of analytical approaches for phenolic antioxidants involved in human health studies. Analytical Techniques
After ingestion of food and beverage, natural phenolic antioxidants enter human intracellular environment via the circulation. Therefore, a great deal of efforts has been invested on the examination for antioxidants and their metabolites or corresponding biomarkers in human fluids such as urine, serum, or plasma. Various analytical methods have been developed to monitor the bioavailability and bioconcentration of natural antioxidants.
Sample Preparation Although sample preparation is the first critical step in the characterization and quantitation of phenolic compounds in human fluids, definitive procedures for collection, storage and pretreatment have not been established. Zhang and Zuo [19] have reported that bloods are usually collected into Vacutainer K2EDTA (potassium ethylenediaminet-etraacetate) tubes to provide anticoagulation. After centrifugation to sediment the cells, the clear platelet-poor plasma was collected and stored at -80oC. In contrast to plasma samples, collection of urine is relatively easier. Phenolic compounds are present predominantly as glucuronide and sulfate conjugates in food products and human fluids [19, 20, 37-39, -44]. A hydrolysis step is usually involved prior to extraction and analysis of phenolics. There are two main procedures to cleave the glycoside and ester bonds reported in the literature, acid- and enzyme- catalyzed hydrolysis [19, 44]. Hydrochloric acid (HCl) in aqueous or methanol solvent is commonly used. To determine specifically the amount of glucuronides or sulfates, -glucuronidase or sulfatase is used. A mixture of -glucuronidase and sulfatase can be employed for the determination of total phenolics. These enzymes are commercially available. The released
Pak. J. Anal. Envir. Chem. Vol. 7, No. 1, (2006)
42
phenolic compounds are then extracted using an organic solvent, most commonly ethyl acetate or methylene chlorid, or a C18 solid-phase extraction (SPE) [45]. It is important to control pH values for both SPE and classic liquid-liquid extraction processes. Ascorbic acid is commonly added into human fluid samples to prevent oxidation of phenolic compounds. When GC or GC-MS is used for the analysis, extraction is often followed by conversion of phenolic molecules into their trimethylsilyl derivatives. The recent application of advanced LC-MS allows simultaneous determination of free and conjugated phenolic compounds in human fluids without a hydrolysis step.
Spectrophotometric methods
The total phenol content of foods, beverages and human fluids is traditional determined as gallic acid equivalents using Folin Ciocalteu reagent [27,46] or a modified method by Swain and Hillis [47] which avoids interference from proteins in biological fluids [48,49]. The blue color formed after reaction of phenolic compounds with Folin-Ciocalteu reagent is measured at 725-735 nm. A disadvantage is that reducing substances, such as ascorbic acid, and transition metals, such as Fe and Cu, may interfere the measurement. All phenolic compounds absorb radiation in the UV region and could be determined by their characteristic absorbance at 280 nm [37]. To determine individual phenolic compounds based on UV spectrometric characteristics, a UV absorption or a photodiode array detector (PAD) is coupled with high performance liquid chromatography (HPLC) or capillary electrophoresis (CE). HPLC/CE with UV absorption, PAD or electrochemical detection
HPLC combined with UV absorption or PAD has been used in the determination of phenolic antioxidants in foods and human fluids. Specific highly purified deconjugating enzymes in combination with HPLC-PAD has also been employed for analysis of plasma samples, containing conjugated phenolic antioxidants and their metabolites [45, 50]. But the identification based on UV spectra has been a major problem. Not only are the in vivo phenolic concentrations
near the detection limits, but the resolution of HPLC is not usually sufficient to separate analytes from sample matrices clearly and the retention times can shift due to residual protein present in biological samples [38,51]. Obviously, retention time and UV-absorbance are useful but inadequate as sole identification and quantification means. HPLC with coulometric-array detection can provide fingerprint-type information on the nature of a compound [52]. However, this technique only allows the identification of previously known substances [53]. The information and availability of the metabolic standards are required for targeted antioxidants. Capillary electrophoresis (CE) is an efficient separation technique, especially when coupled with an on-line photodiode array detector (PAD), for the analysis of phenolics [54, 55]. Unfortunately, CE does not have a good reproducibility, and PAD sensitivity and identification power is not sufficient for characterization of metabolites of phenolic antioxidant [56, 57].
GC-MS methods Since the first studies of metabolites in the late 1960s by Horning�s [58] research group, GC-MS has become one of the most popular analytical techniques for the analysis of complex biological samples due to its extremely high separation and identification power [19, 30, 39, 59]. However, all phenolic antioxidants contain polar functional groups, have a relatively low volatility and are not suitable for direct capillary GC analysis. Derivatisation steps aimed to produce more volatile products thus are required to improve the stability and sensitivity of subsequent GC determination. Zhang and Zuo [19] developed a derivatization procedure using N,O-bis(trimethylsilyl)trifluoroacetamide (BSTFA) + trimethylchlorosilane (TMCS) reagent to identify phenolic and benzoic compounds in human plasma that originate from cranberry juice. Because the previous derivatization protocol did not work well for the flavonoids in plasma samples, the researchers increased the derivatization temperature and time. With the GC-MS method developed, Zhang and Zuo identified 15 flavonoids and phenolic and benzoic acids in cranberry juice, and 7 in human plasma 4.5 hours after consumption of the cranberry juice. The abundant
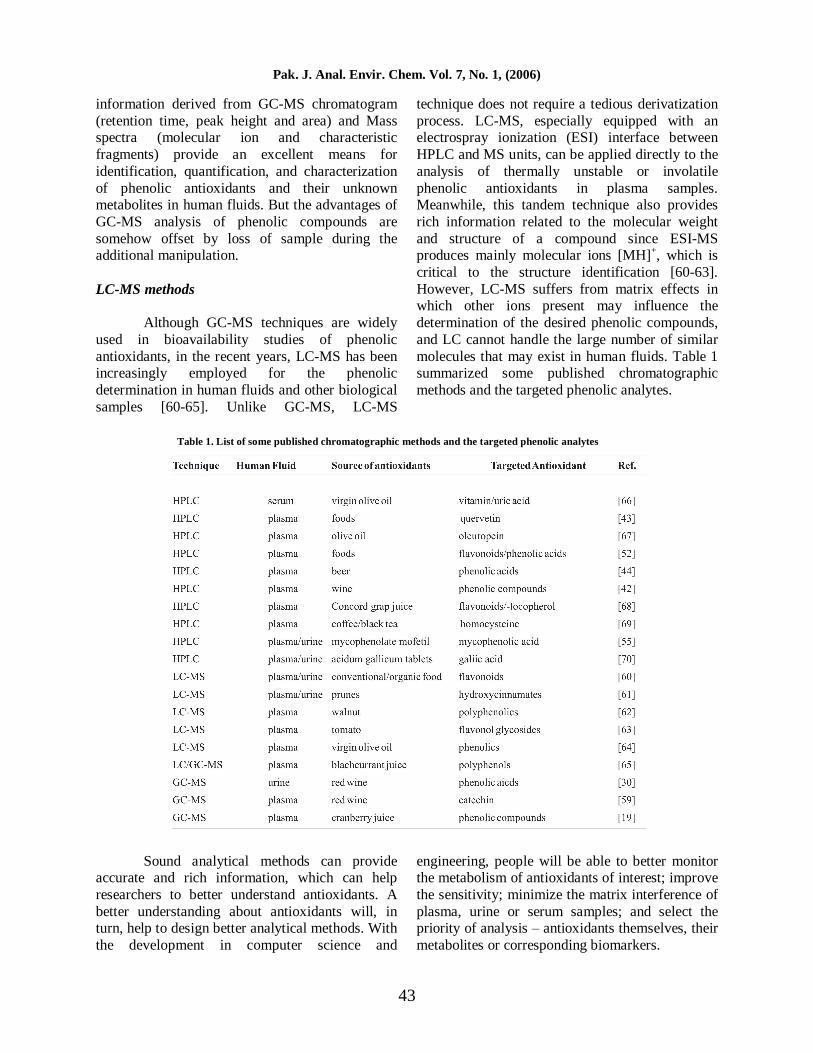
Pak. J. Anal. Envir. Chem. Vol. 7, No. 1, (2006)
43
information derived from GC-MS chromatogram (retention time, peak height and area) and Mass spectra (molecular ion and characteristic fragments) provide an excellent means for identification, quantification, and characterization of phenolic antioxidants and their unknown metabolites in human fluids. But the advantages of GC-MS analysis of phenolic compounds are somehow offset by loss of sample during the additional manipulation. LC-MS methods Although GC-MS techniques are widely used in bioavailability studies of phenolic antioxidants, in the recent years, LC-MS has been increasingly employed for the phenolic determination in human fluids and other biological samples [60-65]. Unlike GC-MS, LC-MS
technique does not require a tedious derivatization process. LC-MS, especially equipped with an electrospray ionization (ESI) interface between HPLC and MS units, can be applied directly to the analysis of thermally unstable or involatile phenolic antioxidants in plasma samples. Meanwhile, this tandem technique also provides rich information related to the molecular weight and structure of a compound since ESI-MS produces mainly molecular ions [MH]+, which is critical to the structure identification [60-63]. However, LC-MS suffers from matrix effects in which other ions present may influence the determination of the desired phenolic compounds, and LC cannot handle the large number of similar molecules that may exist in human fluids. Table 1 summarized some published chromatographic methods and the targeted phenolic analytes.
Sound analytical methods can provide accurate and rich information, which can help researchers to better understand antioxidants. A better understanding about antioxidants will, in turn, help to design better analytical methods. With the development in computer science and
engineering, people will be able to better monitor the metabolism of antioxidants of interest; improve the sensitivity; minimize the matrix interference of plasma, urine or serum samples; and select the priority of analysis � antioxidants themselves, their metabolites or corresponding biomarkers.
Table 1. List of some published chromatographic methods and the targeted phenolic analytes
Pak. J. Anal. Envir. Chem. Vol. 7, No. 1, (2006)
44
Major antioxidant capacity measurements Except identification and quantitation of phenolic antioxidants, researchers are also interested in examining their antioxidant potential under normal bioenvironment. It is useful to quantify the antioxidant potential of a compound, a food, or a beverage, which will make comparison possible since there are so many foods that contain antioxidants and so many compounds that have antioxidant capacity. Oxygen-radical absorbing capacity (ORAC) assay [71] of antioxidants in serum or plasma uses beta-phycoerythrin as an indicator protein and 2,2�-azobis (2-amidinopropane) dihydrochloride (AAPH) as a peroxyl radical generator. Under appropriate conditions, the loss of phycoerythrin fluorescence in the presence of reactive species is an index of oxidative damage. The inhibition by an antioxidant, which is reflected in protection against the loss of phycoerythrin fluorescence is a measure of its antioxidant capacity. O�Byrne et al [68] measured the antioxidant potential of serum by the ORAC assay after the supplementation of Concord grape juice. Natella et al [34] used a similar method, TRAP (total radical trapping antioxidant parameter, which is expressed as the amount of peroxyl radicals trapped by 1L of plasma.) to evaluate the antioxidant potential of human plasma after consumption of coffee and tea. The Trolox equivalent antioxidant capacity (TEAC) is defined as the concentration of Trolox with the same antioxidant capacity as a 1 mM concentration of the antioxidant under investigation. The assay is designed to test the ability of an antioxidant to scavenge a preformed radical, cation chromophore of 2,2�-azinobis (3-ethylbenzothiazoline-6-sulfonic acid) (ABTS+ radical), in relation to that of6-hydroxy-2,5,7,8-tetramethylchroman-2-carboxylic acid (Trolox), an aqueous soluble vitamin E analogue [60,72,73]. Similarly, a method using 1,1-diphenyl-2-picrylhydrazyl (DPPH.) as a reactive free radical has been used to test the antioxidant activity of naturally occurring phenolic compounds resulted from their electronic structure. The resistance of LDL to oxidative species can also reflect the antioxidant capacity of a
compound since after intestinal absorption some suspected antioxidants or their metabolites would bind LDL, which can affect the oxidation of LDL. Princen et al [74] reported a method, in which LDL was oxidized via exposure to copper ions and oxidation kinetics were determined by measuring the formation of conjugated dienes using UV. Caccetta et al. [30] used the method to examine whether ingestion of red wine could affect ex vivo lipoprotein oxidizability. These assays cannot simulate the real free radical environment in human biosystems because of the simplified design, in which there is only one free radical generator. The result is only valid if antioxidants would only behave as a scavenger of free radicals. Indeed, there are various sources of free radical in humans and antioxidant mechanism varies by different antioxidants, which has not been well understood. At least, according to published studies an antioxidant in biofluid can prevent oxidation damage by scavenging radicals or inhibiting the free radical formation [2, 75] so the antioxidant capacity measured by these assays are useful but incomplete. They are just an estimation of the antioxidant capacity of a targeted compound under manipulated conditions. In some studies the antioxidant capacity could not explain biospecificity of some antioxidants [5]. Under difference circumstances, the free radical attack could be universal or specific. Aging has long been related with oxidative stress but studies found that not all the proteins or cells were oxidized at same rate [76]. Would natural antioxidants provide same protection against free radicals or ROS under these conditions? Nevertheless, antioxidant capacity measurements focus on LDL may ignore a very important fact that natural antioxidants not only bind LDL but also other proteins in plasma. Therefore it is not uncommon that some phenols show antioxidant capacity in vitro but not in vivo [66, 77, 78].
Compared with these assays, some indirect measurements based on biomarkers or products of free radical reaction seem more specific and accurate [50, 60, 68]. Under the attack of free radicals, there must be some intermediate products or modification on normal proteins. Information regarding these biomarkers can be directly linked to certain diseases. Monitoring these species might
Pak. J. Anal. Envir. Chem. Vol. 7, No. 1, (2006)
45
be more rational way to present the antioxidant capacity of a compound. However, this approach requires the detailed knowledge of the mechanism of free radical reaction. Research strategies Current research strategies are very diverse but are dominated by the assumption that natural antioxidants can benefit humans. Some researchers focus on a particular antioxidant for various purposes such as an antioxidant compound with a high content in certain food, a compound exhibits significantly higher antioxidant capacity than others, or a compound with a potential pharmaceutical application to certain disease. Quercetin [50] is an antioxidant that has been investigated extensively for the above reasons. For this kind of antioxidant, their food source and analytical methods used to monitor their bioavailability, in vitro antioxidant capacity, and in vivo metabolism have been of great interest. Approach from this angle provides specific information and in-depth understanding of the metabolism, bioconcentration, health effect of a natural phenolic antioxidant. But before its antioxidant acting mechanism is well understood, researchers should not overestimate its antioxidants potential. Neither should they overlook potentials of other co-existing antioxidants in the same food. Some researchers emphasize on certain food or beverage due to epidemiological evidence that consumption of the food or beverage has a negative correlation with certain diseases or the total phenol content is very high, which makes it a good source of antioxidant. Studies of consumption of olive oil, red wine, and cranberry fit in this category. Generally, identification and quantification of antioxidants existing in the food are the first step. Then, emphasis would be laid on the dominant compounds or special antioxidants that have never been found in other sources. Human study is very common in this category. So far, it is less challenging to find the correlation between the consumption of the food and its effect on human health than to clarify the mechanism. This is due to the complex nature of metabolism and limited understanding about the cancer, cardiovascular diseases, and other targeted
diseases. In addition, results of human studies vary by selected subjects, design of studies, and some uncontrollable factors. Based on priorities of a study, two approaches could be applied independently or together. Investigation on different foods would help to find better source for natural antioxidants. Focusing on an antioxidant would lead to a better understanding on its metabolism and health potential. Currently, the studies of natural antioxidants have been dominantly focused on their health benefits. It is known that free radicals are involved in many bioactivities such as gene expression. Too many free radicals can cause oxidative stress, while if the concentration of free radical is lower than normal level it will impair host defenses and decrease proliferative response. It is interesting to understand whether consumption of certain antioxidant-rich food would result abnormally low concentration of free radical; Furthermore, whether these natural antioxidants would affect other physiological functions or not. Future studies of antioxidants Epidemiologic studies show that consumption of certain food may benefit human health by improving antioxidant defense, which can be linked with various diseases such as Alzheimer�s and Parkinson�s diseases caused by free radicals. Molecular biologists have studied these diseases by starting with the proteins or DNA�s affected by free radicals. If they can identify the impaired DNA or protein they will repair it via gene therapy. But the risk of gene therapy is that it might permanently change the genetic characteristics of a patient and the change could be passed to next generation. The alternative approach would be to design a drug that can eliminate the excess free radicals or minimize the damage caused by free radicals. However, the process of drug development is extremely time consuming and expensive. Obviously, dietary supplementary seems more practical and cost and time efficient but it lacks the specificity of gene therapy or drugs. To bridge the gap between these approaches and make them complementary to each other would fully utilize the health benefits of natural antioxidants.

Pak. J. Anal. Envir. Chem. Vol. 7, No. 1, (2006)
46
Acknowledgment This work was partly supported by the Massachusetts Agriculture Research Fund, the University of Massachusetts Dartmouth, and the Institute for Asian American Studies, UMass Boston. References 1. P. M. Wood, J. Biochem., 253 (1988) 287. 2. B. Halliwell, J. M. C. Gutteridge, Archive of
Biochemistry and Biophysics. 280 (1990) 1. 3. Y. Zuo and J. Hoigné, Environmental
Science & Technology 26 (1992) 1014. 4. Y. Zuo and J. Hoigné, Science 260 (1993)
71. 5. T. Finkel and N. J. Holbrook, Nature. 408
(2000) 239. 6. Y. Zuo, Chemosphere 51 (2003) 175. 7. T. Finkel, Current Opinions in Cell Biology.
10 (1998) 248. 8. T. Nishikawa, Nature. 404 (2000) 787. 9. S. Nemoto, K. Takeda, Z. X. Yu, V. J.
Ferrans and T. Finkel, Molecular Cell Biology. 20 (2000) 7311.
10. S. S. Leonard, G. K. Harris and X. Shi, Free Radical Biology & Medicine. 37 (2004) 1921.
11. W. Beyer, J. Imlay and I. Fridovich, Progress in Nucleic Acids Research. 40 (1991) 221.
12. B. Chase, H. Sies and A. Boveris, Physiology Review. 59 (1979) 527.
13. I. Fridovich, Annual Review of Biochemistry. 64 (1995) 97.
14. B. P. Yu, Physiology Review. 74 (1994) 139. 15. H. Z. Chae, S. W. Kang and S. G. Rhee,
Methods in Enzymology. 300 (1999) 219-226.
16. P. G. Pietta, Journal of Natural Products. 63 (2000) 1035.
17. Y. Zuo, H. Chen and Y. Deng, Talanta, 57 (2002) 307.
18. R. J. Robbins, J. Agric. Food Chem. 51 (2003) 2866.
19. K. Zhang and Y. Zuo, Journal of Agricultural and Food Chemistry. 52 (2004) 222.
20. C. Manach, G. Williamson, C. Morand, A. Scalbert and C. Remesy, Am J Clin Nutr 81 (2005) 230S.
21. S. Iqbal and M. I. Bhanger, J. Food Composition & Anal. 19 (2006) 544.
22. S. Iqbal, M. I. Bhanger and F. Anwar, Food Chem. 93 (2005) 265.
23. B. N. Ames, M. K. Shigenagan and T. M. Hagen, Proc. Natl. Acad. Sci. U.S.A. 90 (1993) 7915.
24. J. A. Vinson, X. H. Su and L. Zubik, Journal of Agricultural and Food Chemistry. 49, (2001) 5315.
25. M. V. Eberhardt, C. Y. Lee and R. H. Liu, Nature 405 (2000) 903.
26. G. Paganga, N. Miller and C. A. Rice-Evans, Free Radical Research. 30 (1999) 153.
27. C. Wang, Antioxidant Study of Natural Fruits and Teas. MS thesis, University of Massachusetts Dartmouth, North Dartmouth, MA, USA, 2002.
28. A. C. St. Leger, A. C. Cochrance and F. Moore, Lancet. 1 (1979) 1017.
29. E. B. Rimm, A. Klatsky, D. Grobbee and M. J. Stampfer, BMJ. 312 (1996) 731.
30. A. Caccetta, K. D. Croft, L. J. Beilin and L. B. Puddy, American Journal of Clinic Nutrition. 71 (2000) 67.
31. A. Keys, A. Menotti, M. J. Karvonen, C. Aravanis, H. Blackburn, R. Buzina, B. S. Djordjevic, A. S. Dontas, F. Fidanza and M. N. Keys, American Journal of Epidemiology. 124 (1986) 903.
32. J. M. Hodgson, K. D. Croft, T. A. Mori, V. Burke, L. Beilin and L. B. Puddey, Journal of Nutrition. 132 (2002) 55.
33. M. N. Clifford and J. Wight, Journal of Science of Food and Agriculture. 27 (1976) 73.
34. F. Natella, M. Nardini, I. Giannetti, C. Dattilo and C. Scaccini, Journal of Agricultural and Food Chemistry. 50 (2002) 6211.
35. Hammerstone, J.F., Lazarus, S., Mitchell, A., Rucker, R., Schmitz, H. Identification of procyanidins in cocoa (Theobroma cacao) and chocolate using high-performance liquid chromatography/mass spectrometry. Journal of Agricultural and Food Chemistry. 47, (1999). 490.

Pak. J. Anal. Envir. Chem. Vol. 7, No. 1, (2006)
47
36. A. B. Howell, N. Vorsa, A. D. Marderosian and L. Y. Foo, New England Journal of Medicine. 339 (1998) 1085.
37. H. Chen, Y. Zuo and Y. Deng, Journal of Chromatography A, 913 (2001) 387.
38. H. Chen and Y. Zuo, Food Chemistry 101 (2007) 1374.
39. Y. Zuo, C. Wang and J. Zhan, J. Agriculture and Food Chemistry 50 (2003) 4789.
40. The Parkinson Study Group. New England Journal of Medicine. 328 (1993) 176.
41. M. A. Sano, New England Journal of Medicine. 336 (1997) 1216.
. P. Stremple, J. High Resol. Chromatogr. 19 (1996) 581.
43. C. Manach, C. Morand, V. Crespy, C. Demigne, O. Texier, F. Regerat and C. Remesy, FEBS Lett. 6 (1998) 331.
44. M. Nardini, F. Natella, C. Scaccini and A. Ghiselli, J. Nutr. Biochem. 17 (2006) 14.
45. M. V. Martinez-Ortega, M. C. Garcia-Parrilla and A. M. Troncoso, Anal. Chim. Acta 502 (2004) 49.
46. V. L. Singleton and J. A. Rossi, Am J. Enology and Viticult 16 (1965) 144.
47. T. Swain and E. Hillis, J. Sci. Food Agric. 10 (1959) 63.
48. M. Serafini, G. Maiana and A. Ferro-Luzzi, J. Nutr. 128 (1998) 1003.
49. G. Duthie, M. W. Pedersen, P. T. Gardner, P. C. Morrice, A. M. Jenkinson, D. B. McPhail and G. M. Steele, European J. Clin Nutr., 52 (1998) 733.
50. A. J. Day and G. Williamson, British Journal of Nutrition. 86 (2001) Suppl. 1, S105.
51. G. Paganga and C. Rice-Evans, FEBS letters. 401 (1997) 78.
52. A. Bolarinwa and J. Linseisen, J. Chromatogr. B. 823 (2005) 143.
53. G. Achilli, G. P. Cellerino and P. H. Gamache, Journal of Chromatography. 632 (1993) 111.
54. J. Arnaud, L. Fortis, S. Blachier, D. Kia and A. Favier, Journal of Chromatography. 1991. 572 (1991) 103.
55. K. Wiwattanawongsa, E. L. Heinzen, D. C. Kemp, R. E. Dupuis and P. C. Smith, Journal of Chromatogr. B. 762 (2001) 35.
56. Y. S. Uang, F. L. Kang and K. Y. Hsu, Journal of Chromatogr. B. 673 (1995) 43.
57. G. Mainani, M. Serafini, M. Salucci, E. Azzini and A. Ferro-Luzzi, Journal of Chromatogr. B. 692 (1997) 311.
58. E. C. Horning and M. G. Horning, J. Chromatogr. Sci. 9 (1971) 129.
59. J. L. Donovan, J. R. Bell, S. Kasim-karakas, J. B. German, R. L. Walzem, R. J. Hansen and A. L. Waterhouse, Journal of Nutrition. 129 (1999) 1662.
60. L. Grinder-Pedersen, S. E. Rasmussen, S. Bugel, L. V. Jorgensen, L. O. Dragsted, V. Gundersen and B. Sandstrom, Journal of Agricultural and Food Chemistry. 51 (2003) 5671.
61. P. Cremin, S. Kasim-Karakas and A. L. Waterhouse, Journal of Agricultural and Food Chemistry. 49 (2001) 1747.
62. K. J. Anderson, S. S. Teuber, A. Gobeille, P. Cremin, A. L. Waterhouse and F. M. Steinberg, Journal of Nutrition. 131 (2001) 2837.
63. P. L. Mauri, L. Iemoli, C. Gardana, P. Riso, P. Simonetti, M. Porrini and P. G. Pietta, Rapid Communications in Mass Spectrometry. 13 (1999) 924.
64. K. De la Torre-Carbot, J. L. Chavez-Servin, O. Jauregui, A. L. Castellote, R. M. Lamuela-Raventos, M. Fito, M. I. Covas, D. Munoz-Aguayo and M. C. Lopez-Sabater, Anal. Chim. Acta. 582 (2007) 402.
65. A. Rechner, G. Kuhnle, H. Hu, A. Roedig-Penman, M. H. Van, D. Braak, K. P. Moore and C. A. Rice-Evans, Free Radical Research. 36 (2002) 1229.
66. M. N. Vissers, P. L. Zock, S. A. Wiseman, S. Meyboom and M. B. Katan, European Journal of Clinical Nutrition. 55 (2001) 334.
67. A. Tsarbopoulos, E. Gikas, N. Papadopoulos, N. Aligiannis and A. Kafatos, J. Chromatogr. B. 785 (2003) 157.
68. D. J. O�Byrne, S. Devaraj, S. M. Grundy and I. Jialal, American Journal of Clinical Nutrition. 76 (2002) 1367.
69. M. R. Olthof, P. C. Hollman, P. L. Zock and M. B. Katan, American Journal of Clinical Nutrition. 73 (2001) 532.
70. S. Shahrzad and I. Bitsch, Journal of Chromatography B. 705 (1998) 87.
71. G. Cao and R. L. Prior, Methods in Enzymology. 299 (1999) 50.

Pak. J. Anal. Envir. Chem. Vol. 7, No. 1, (2006)
48
ISSN-168.000-9955
Pak. J. Anal. Envir. Chem. Vol. 7, No. 1, (2006) 48 � 55
Computations between Metallocalix[4]arene Host and a Series of Four Oil-Based Fuel Pollutant Guests
DHRUV A. PATHAK1, NICOLE C. STREET1 and D. MAX ROUNDHILL1Ø[1] MUSTAFA YILMAZ2
, SHAHABUDDIN MEMON*3 and M. I. BHANGER3
1Department of Chemistry & Biochemistry, Texas Tech University, Lubbock, TX 79409-1061 USA 2Department of Chemistry, Selçuk University, Konya 42031, Turkey
3National Center of Excellence in Analytical Chemistry, University of Sindh, Jamshoro-76080, Pakistan Abstract Calculations using PM3 and mechanics methods on metallocalix[4]arene hosts (1-10) and substituted dibenzothiophene guests (A-D), which are generally known as oil-based fuel pollutants, show that host-guest formation is energetically favored. Calculations have been carried out for both 1/1 and 1/4 ratios of host/guest. There is no direct bonding between the metal center of the host and the sulfur of the guest in the host-guest complex. Sterically hindered dibenzothiophene guests show similar energies to the unhindered analogs. For calix[4]arenes (5-10) in partial cone conformations and having hydrogen rather than p-tert-butyl groups on the wide rim, host-guest formation occurs within the narrow rim rather than the wide rim. Host-guest association appears to occur via ð-ð interactions between host and guest phenyl groups rather than via metal-sulfur bonding. The study has importance especially in oil refining to obtain environmentally safe fuel oils and help supramolecular chemists in designing and synthesizing more sophisticated host molecules for the removal of sulfur from crude oil / refinery oil. Keywords: Calixarene, Dibenzothiophene, Host-Guest formation, Methyl mercury,
Metallocalixarene, Supramolecular Chemistry.
Introduction The continued use of oil-based fuels for transportation places ever-increasing environmental demands on the producer of these fuels. One of these demands is meeting future environmental requirements by the production of ultraclean fuel. A challenge that remains in producing such fuels is the removal of the final traces of sulfur. This element needs to be absent because the combustion of sulfur-containing compounds results in the formation of environmentally unacceptable sulfur dioxide. One group of sulfur-containing compounds that is present in oil-based fuels is dibenzothiophenes. These compounds are particularly problematic for removal by hydrodesulphurization when they contain functional groups that sterically inhibit the
sulfur atom from approaching the catalyst surface [2]. Two alternate strategies that have been considered involve either a chemical method where an initial step is the insertion of a metal center into the carbon sulfur bond of the dibenzothiophene [3,4] or a biochemical degradation using Rhodococcus erythropolis KA2-5-1 [5]. An alternate approach to either of these two is solvent extraction [6] or to encapsulate the dibenzothiophene within a host molecule. A calixarene is a potential host for dibenzothiophenes. Furthermore, since calixarenes are conformationally mobile, they can be readily incorporated into sensor systems that are both analytically selective and sensitive [7, 8]. _____________________________________________________________________________________________________________________
*To whom correspondence should be addressed. E-mail: [email protected] Ø Present address: Chem Consulting, 13325 Black Canyon Drive, Austin, Texas 78729, USA

Pak. J. Anal. Envir. Chem. Vol. 7, No. 1, (2006)
49
Calixarenes are cyclic oligomers obtained by a condensation reaction between p-tert-butylphenol and formaldehyde. Calixarenes are like crowns in that they are pre-organized complexants for metal ions. Unlike porphyrins, however, calixarenes are not fully conjugated, and their three-dimensional structure leads to cavities within the molecular framework [9]. Calixarenes are conformationally mobile, and the extreme structures for the calix[4]arenes have been termed the cone (uuuu), the partial cone (uuud), the 1,3-alternate (udud) and the 1,2-alternate (uudd) conformation [10-12]. Each of these conformers can act as a host molecule to uncharged aromatic molecules as guests [13-16], and each has a cavity within both the wide and the narrow rim. Because of the conical geometry of the calix[4]arene structure, the volume of the wide rim cavity is greater than that of the narrow rim [9]. By appending sulfur functionalities onto calix[4]arenes, metal ions such as mercury(II) have been complexed onto both of these rims [17-21]. Metallocalixarenes are potentially useful hosts for thiophenes because, in addition to having wide and narrow rim cavities that are compatible with an aromatic hydrocarbon, they also have a metal center that can coordinate to the sulfur. Mercury has a strong affinity for binding to sulfur, therefore we have chosen a mercury calixarene complex in designing hosts for a substituted dibenzothiophene guest. Recently we have reported the synthesis of a methylmercury(II) complexed calix[4]arene 1,2-ethoxythiolate [22], and carried out our initial computational studies on its function as a host for sulfur containing macrocyclic and heterocyclic guests [23]. These calculations were carried out on systems where the guest was bound via sulfur to the mercury(II) center on the calix[4]arene host. For substituted dibenzothiophenes, however, we need to occlude sterically hindered sulfur containing heterocyclic guests into a molecular host. This represents a different situation from unsubstituted heterocycles because hindered guest molecules may be sterically constrained from having direct mercury(II)-sulfur bonds between the host and guest.
Results This decision to computationally investigate dibenzothiophenes as guests is based on two considerations. The first is that sterically hindered 2, 9-disubstituted dibenzothiophenes (C and D) are among the sulfur-containing heterocyclic compounds that are the most difficult to remove from crude oil [24]. Consequently, host molecules that occlude them would be useful. Secondly, in our previous calculations it was a thiophene guest that showed endothermic binding to the host. Since thiophenes are known to bind only weakly to a metal center, further computational studies may reveal how they interact with metallocalix[4]arene hosts [25]. We have carried out a series of computations between metallocalix[4]arene hosts (1-10) and a series of four sulfur containing heterocyclic guests (A-D) having functional groups appended that have different steric requirements (Schemes 1 and 2). The calculations are allowed to minimize freely without any constraint being introduced to favor mercury(II)-sulfur interactions (Tables 1 and 2). A further set of calculations (Table 3) have been carried out where a metal center other than methylmercury(II) is bonded to the ethoxythiolate sulfur of the substituted calix[4]arenes 5-10 (Scheme 2). These are Ag, EuMe, UMe3, FeMe, and CrMe. Each is uncharged, with the oxidation state being accommodated by methyl groups to make them comparable with the methylmercury(II) derivative. This group has transition metals, a post transition metal, a lanthanide and an actinide. These particular examples are chosen because they have a propensity to complex with unsaturated hydrocarbons or have high coordination numbers [26].
Calculations have been carried out on a DEC alpha computer system (433 MHz) using the SPARTAN Version 5.0.2 software package [27]. This package is chosen because it has the algorithms available for heavy metals. All calculations have been carried out using PM3 ( Setup: semi-empirical; Solvent: none; Total

Pak. J. Anal. Envir. Chem. Vol. 7, No. 1, (2006)
50
ORRO
OROR
OR OROR
OR
OR OR
ORRO
OR
RO
RO
RO
Cone (uuuu) Partial Cone (uuud)
1,2-Alternate (uudd) 1,3-Alternate (udud)
1 2
3 4
1/2/3/4 R = CH2CH2SHgCH3
S
CH3
S
CH3
CH3
S
S
O OO
O
5 M = HgCH3
6 M = Ag7 M = EuCH3
8 M = U(CH3)3
9 M = FeCH310 M = CrCH3
A B
C D
SM
SM
SMSM
Scheme 1. Representation of metallocalix[4]arene host in different conformations
Scheme 2. Representation of metallocalix[4]arenes (5-10) and a series of four sulfur containing heterocyclic guests (Dibenzothiophenes A-D).

Pak. J. Anal. Envir. Chem. Vol. 7, No. 1, (2006)
51
charge: 0; Multiplicity: singlet; Geometry: Merck), mechanics (Force field: Merck), and Density Functional Theory (Theory: SVWN; Basis: DN; Multiplicity: singlet; Total charge: 0) geometry optimization. The semi-empirical molecular orbital (PM3) method is based on a simplified Hartree-Fock model. The method is chosen because it is successful for calculating equilibrium geometries. Table 1. Calculated Energies (PM3)a of the Metallocalix[4]arene
(1-4) Hosts with Dibenzothiophene (A,B,C,D) Guests.
Adduct S B ÄEb Lc
1/A 507.5 469.6 37.9 6.02
1/B 519.2 488.1 31.1 4.46
1/C 534.3 495.4 38.9 4.63
1/D 687.5 652.3 35.2 4.98
2/A 482.9 447.8 35.1 4.55
2/B 485.5 446.5 39.0 4.78
2/C 502.4 472.3 30.1 4.90
2/D 654.7 623.3 31.4 4.97
3/A 456.8 413.1 43.7 5.73
3/B 464.4 435.1 29.3 4.56
3/C 483.9 457.8 26.1 5.72
3/D 648.0 602.8 45.2 5.43
4/A 441.9 418.2 23.7 4.41
4/B 464.3 428.6 35.7 5.74
4/C 493.5 441.1 52.4 6.18
4/D 624.1 590.5 33.6 4.91
aCalculated Energies (PM3) of Separated (S); Bound (B); 1/4 adducts (ÄEb); bÄE is in Kcal mol-1. cCalculated Bond Length Shortest Hg-S (Lc) is in Å.
A limitation is that the method can be less
successful for ground-state conformations and conformational energies in cyclic systems. The density functional theory (SVWN/DN) method performs as well or better than limiting Hartree-Fock models for calculating equilibrium geometries. This method is a useful one for larger molecules, and is a good compromise in terms of
computational time. A limitation is that heavy-atom bond lengths are 0.2-0.3 Å shorter than experimental values. All reasonable conformations have been computationally searched before the one with the minimum energy was chosen. For the dibenzothiophenes (A-D), where there is little conformational flexibility, the energy minimum is quickly and reproducibly obtained by convergence. For the metallocalixarenes (1-10), however, more structural variations are possible. The primary conformation (uuuu etc) is determined by the initially chosen conformational representation of the calixarene structure, and the convergence minimum for that particular structural variation is then obtained. Usually the energy minimum is obtained for this predetermined primary conformation, and there is no crossover into the other conformations. The analogous energy minima for the other three conformations are similarly obtained. After the four separated dibenzothiophene and metallocalixarene combina-tions have been reproducibly minimized in energy, the graphical representation is modified to place the guest molecule (dibenzothiophene) in close proximity to the host (metallocalixarene). Upon commencing the minimization routine the guest molecule either moves away from the host cavity or it is attracted into it. In the latter case, the energy of the host-guest pair is lower than the separate entities.
Table 2. Calculated Energy changes (PM3) of the 1/1 Host-Guest
Adducts of Metallocalix[4]arenes (1-4) with Sterically Hindered Dibenzothiophenes (C and D).
Adduct ÄE* Adduct ÄE*
1/C 0.0 1/D 2.3
2/C 12.5 2/D 9.0
3/C 8.0 3/D 11.9
4/C 9.9 4/D 5.6
* ÄE is in Kcal mol-1.
The 1/1 (host/guest) adducts have all been
investigated in this manner. In no case did we find an attractive interaction when we placed the dibenzothiophene in the vicinity of the wide calixarene rim. The computational energies and
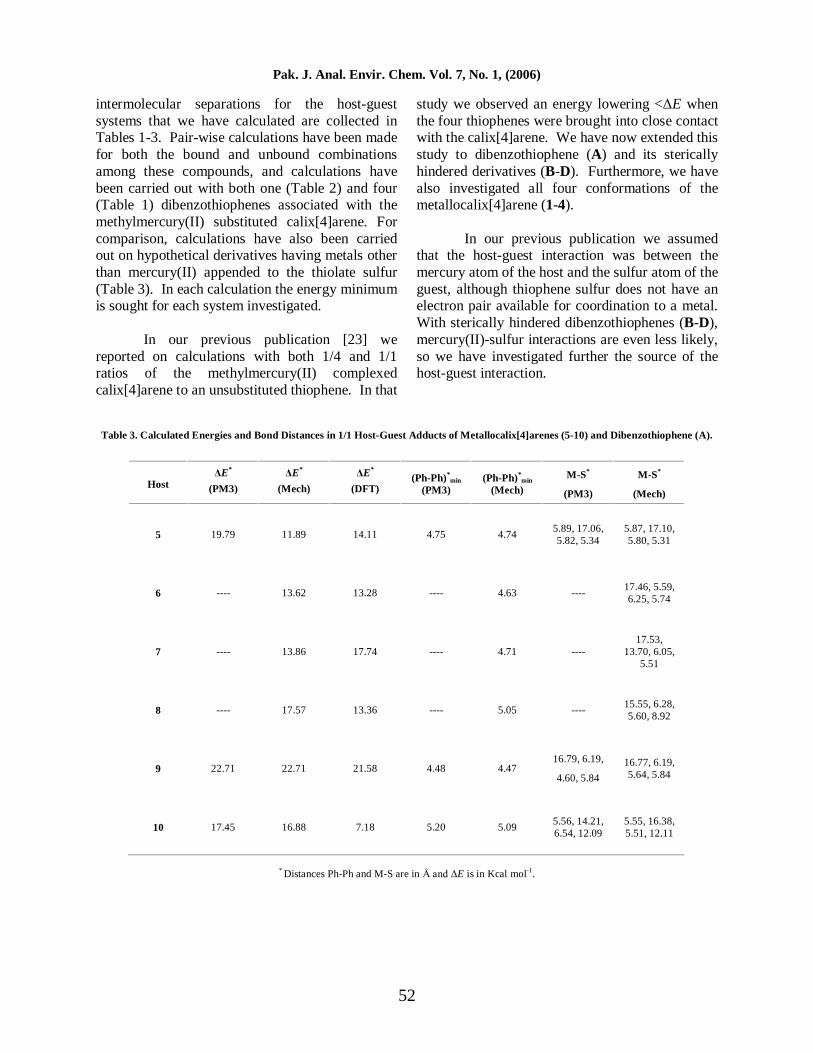
Pak. J. Anal. Envir. Chem. Vol. 7, No. 1, (2006)
52
intermolecular separations for the host-guest systems that we have calculated are collected in Tables 1-3. Pair-wise calculations have been made for both the bound and unbound combinations among these compounds, and calculations have been carried out with both one (Table 2) and four (Table 1) dibenzothiophenes associated with the methylmercury(II) substituted calix[4]arene. For comparison, calculations have also been carried out on hypothetical derivatives having metals other than mercury(II) appended to the thiolate sulfur (Table 3). In each calculation the energy minimum is sought for each system investigated. In our previous publication [23] we reported on calculations with both 1/4 and 1/1 ratios of the methylmercury(II) complexed calix[4]arene to an unsubstituted thiophene. In that
study we observed an energy lowering <ÄE when the four thiophenes were brought into close contact with the calix[4]arene. We have now extended this study to dibenzothiophene (A) and its sterically hindered derivatives (B-D). Furthermore, we have also investigated all four conformations of the metallocalix[4]arene (1-4). In our previous publication we assumed that the host-guest interaction was between the mercury atom of the host and the sulfur atom of the guest, although thiophene sulfur does not have an electron pair available for coordination to a metal. With sterically hindered dibenzothiophenes (B-D), mercury(II)-sulfur interactions are even less likely, so we have investigated further the source of the host-guest interaction.
Table 3. Calculated Energies and Bond Distances in 1/1 Host-Guest Adducts of Metallocalix[4]arenes (5-10) and Dibenzothiophene (A).
Host ÄE*
(PM3)
ÄE*
(Mech)
ÄE*
(DFT) (Ph-Ph)*
min
(PM3) (Ph-Ph)*
min (Mech)
M-S*
(PM3)
M-S*
(Mech)
5 19.79 11.89 14.11 4.75 4.74 5.89, 17.06, 5.82, 5.34
5.87, 17.10, 5.80, 5.31
6 ---- 13.62 13.28 ---- 4.63 ---- 17.46, 5.59, 6.25, 5.74
7 ---- 13.86 17.74 ---- 4.71 ---- 17.53,
13.70, 6.05, 5.51
8 ---- 17.57 13.36 ---- 5.05 ---- 15.55, 6.28, 5.60, 8.92
9 22.71 22.71 21.58 4.48 4.47 16.79, 6.19,
4.60, 5.84
16.77, 6.19, 5.64, 5.84
10 17.45 16.88 7.18 5.20 5.09 5.56, 14.21, 6.54, 12.09
5.55, 16.38, 5.51, 12.11
* Distances Ph-Ph and M-S are in Å and ÄE is in Kcal mol-1.

Pak. J. Anal. Envir. Chem. Vol. 7, No. 1, (2006)
53
Discussion The computational energy data are collected in Tables 1-3. The data in Table 1 are for the methylmercury(II) complex in each of the four different conformations (uuuu, uuud, uudd, udud), and the four different dibenzothiophenes (A-D). These calculations using PM3 have been carried out with the methylmercury(II) complex and the dibenzothiophene in a 1/4 ratio. This 1/4 ratio corresponds to one dibenzothiophene molecule for each of the four methylmercury(II) centers in the complex. These calculations show there is an exothermic interaction (positive ) between the host and guest, even for the most sterically hindered benzothiophene (D) having tert-butyl groups in the 2,9-positions. Thus in each case, the adducts have lower computational energies than do the separated pairs. The energy differences ÄE show no significant discrimination between the groups of dibenzothiophenes (A-D) investigated. Column L in Table 1 lists the shortest distance between a mercury(II) and the dibenzothiophene sulfur in each minimized structure. In no case did we find that a sulfur of a dibenzothiophene guest is close enough to a mercury atom (L, 3.5 Å) to have any interaction. Apparently the positive values for ÄE are not the result of any mercury(II)-sulfur interactions between the host and guest, even for the sterically unhindered dibenzothiophene (A). This result is in agreement with experimental observations that thiophene only weakly complexes with metals [25]. In our previous calculations [23] with thiophene as the guest we found that although there was a positive interaction ÄE between the host and guest when they were in a 1/4 ratio, there was not when the ratio was 1/1. We suggested that this difference could be a consequence of favorable guest-guest interactions in the former case. In order to eliminate the possibility that positive values of ÄE are a result of guest-guest interactions, we have further investigated the most sterically hindered guests C and D in a 1/1 ratio of host to guest. In Table 2 are collected these potential energy data. Again, no steric discrimination is discernible. Both C and D give similar values for ÄE with all four conformers
(1-4). The most disfavored conformation for host-guest formation, however, is the cone (1). This is not an unexpected result because the cone conformation places the most restrictions on the guest molecule in terms of how it can fit into the cavity. There is no obvious explanation, however, why the value of ÄE is larger for the more sterically hindered combination 3/D than it is for 3/C.
In order to try and better understand the host-guest interactions in these combinations we have minimized the steric interactions. In Table 3 are collected the computational energy differences for 1/1 host-guest adducts between the dibenzothiophene A and an analogous calix[4]arene host having hydrogens rather than tert-butyl groups in the para-positions. The elimination of the sterically bulky tert-butyl groups on the wide rim of the calix[4]arene potentially allows for host-guest formation to occur in either the wide or narrow rim cavities. Also, in order to determine whether host-guest formation is uniquely due to the methylmercury(II) substituent, we have carried out calculations with different metal centers. We have therefore concentrated our host-guest formation studies only between A and the partial cone (uuud) conformer of all the metallocalix[4]arenes (5-10). In each case for M = HgCH3, Ag, EuCH3, U(CH3)3, FeCH3, and CrCH3, the guest dibenzothiophene (A) is repelled rather than attracted by the wide rim cavity, resulting is unfavorable energies. By contrast, favorable energies are observed for the narrow rim, and the dibenzothiophene guest is encapsulated within the minimized structure. This result is reflected in positive values for ÄE (Table 3). Again there is no close interaction between the sulfur of the dibenzothiophene guest and the metal center (M-S) of the calix[4]arene host. The shortest such separation is 4.60 Å. Because there is a possibility that the positive ÄE values result from a host-guest attraction that involves ð-ð interactions between phenyl groups on the host and guest, we have computationally estimated the distances between the centers of the phenyl groups of the metallocalixarene host and the guest A in each minimized structure. Since there are four phenyl groups on the host that can interact with the pair of phenyl groups of A that is now in the cavity, it is
Pak. J. Anal. Envir. Chem. Vol. 7, No. 1, (2006)
54
necessary to determine eight phenyl-phenyl separations for each host-guest adduct. Since many of these phenyl-phenyl separations are too large to be significant we are only reporting the shortest one in each case, because this will be the best indicator as to whether these phenyl-phenyl interactions may play a role in host-guest adduct formation. The shortest of these distances range from 4.48 for M = FeCH3, to 5.25 Å for M = EuCH3. With A interacting with the host through a phenyl group, the sulfur atom of A approaches a distance to the metal M somewhat longer. We recognize that these distances are long, and that none of them are sufficiently short that they can make a dominant contribution to the host-guest attraction. Instead, the overall attraction appears to be the sum of several very weak forces. The metal-sulfur (M-S) distances in Table 3 show two types of host-guest formation. For M = HgCH3, U(CH3)3, and FeCH3 there are three short and one long distance, but for M = EuCH3 and CrCH3 there are two short and two long distances. For M = Ag both types are observed depending on the computational method used. At least one long distance is to be expected, because the partial cone conformation places one metal center a long distance away from the narrow rim cavity. For cases with three short distances the guest sulfur is close to being equidistant from the three metals, but for those with only two short distances, the sulfur is only symmetrically close to two metals. The energy differences between these two idealized conformations is small, which is reflected in PM3 and mechanics giving different answers in one case, and in the case of M = U(CH3)3 which has an intermediate conformation for the host-guest complex. We recognize that in molecules of this size and complexity with heavy metals present there are many possible conformations, so we only consider large differences in energy as being significant, and we make no attempt to rationalize small energy differences.
Conclusion The study emphasized here elaborates the importance of computational methodology in constructing model host molecules for targeted guest species. The calculations made show that there is a weak interaction between metallocalixarene hosts and dibenzothiophene
guests. Metal-sulfur interactions make minimal contribution to the energies of attraction. The presence of sterically bulky substituents on the dibenzothiophene does not inhibit host-guest formation. Host-guest formation preferentially occurs at the narrow rim of the calix[4]arene host, which is the one having the greatest volume and conformational flexibility. However, the factors other than metal-sulfur interactions may also help in designing a host molecule for the removal of sulfur containing pollutants from oil based fuels. These results suggest that metallocalixarenes may be useful hosts for trapping dibenzothiophenes, even when complexation with the sulfur atom is sterically blocked. Acknowledgments We thank the Robert A. Welch Foundation (Grant number 1725) for support of this research. We thank Gregory Gellene and Fred Koch for many useful suggestions. We also thank the National Science Foundation International Programs for support. References 1. Presented in part in 2002 at the 223rd
National ACS Meeting in Orlando, Florida, USA, and at the 16th National Chemistry Conference at Selçuk University in Konya, Turkey.
2. M. V. Landau, D. Berger, M. Herskovitz, J. Catal., 159 (1996) 236.
3. D. A. Vicic, W. D. Jones, Organometallics, 17 (1998) 3411.
4. W. D. Jones, D. Vicic, R. Chin, J. H. Roache, A. Myers, Polyhedron, 16 (1997) 3115.
5. T. Onaka, M. Kobayashi, Y. Ishii, J. Konishi, K. Maruhashi, J. Biosci. Bioeng., 92 (2001) 80.
6. H. Zhao, S. Xia, P. Ma, J. Chem. Tech & Biotech., 80 (2005) 1089.
7. D. M. Roundhill, Extraction of Metals from Soils and Waters, Plenum Press, New York, (2001) Chapter 13.
8. F. Cadogan, K. Nolan, D. Diamond in Calixarenes 2001, Z. Asfari, V. Böhmer, J. McB. Harrowfield, J. Vicens: (eds.), Kluwer Academic, Dordrecht, (2001) Chapter 34.

Pak. J. Anal. Envir. Chem. Vol. 7, No. 1, (2006)
55
9. (a) C. D. Gutsche: Calixarenes Revisited, Royal Society of Chemistry: Cambridge, (1998). (b) M. Yilmaz, S. Memon, M. Tabakci, R.A. Bartsch. �Design of Polymer Appended Calixarenes as Ion Carriers�, in �New Frontiers in Polymer Research� pp-125-172, Nova Science Publishers, Hauppauge, NY (2006).
10. I. Thondorf, J. Brenn, J. Mol. Struct. (THEOCHEM), 398-399 (1997) 307.
11. T. Harada, F. Ohseto, S. Shinkai, Tetrahedron 50 (1994) 13377.
12. P. Kane, D. Fayne, D. Diamond, S. E. J. Bell, M. A. McKervey, J. Mol. Model. 4 (1998) 259.
13. T. Asao, S. Ito, N. Morito, Tetrahedron Lett., 29 (1988) 2839.
14. E. B. Brouwer, G. D. Enright, J. A. Ripmeister, Supramol. Chem. 7 (1996) 79.
15. M.Perrin, F. Gharmati, D. Oehler, R. Perrin, S. Lecocq, J. Incl. Phenom. Mol. Recogn. 14 (1992) 257.
16. M. Coruzzi, G. D. Andreetti, V. Bocchi, A. Pochini, R. Ungaro, JCS, Perkin Trans. 2, (1982) 1133.
17. S. Memon, M. Tabakci, D. M. Roundhill, M. Yilmaz, Polymer, 46 (2005) 1553.
18. H. F. Koch, D. M. Roundhill, Sep. Sci. Technol., 36 (2001) 137.
19. A. T. Yordanov, B. R. Whittlesey, D. M. Roundhill, Inorg. Chem., 37 (1998) 3526.
20. A. T. Yordanov, B. R. Whittlesey, D. M. Roundhill, Supramol. Chem., 9 (1998) 13.
21. A. T. Yordanov, O. M. Falana, H. F. Koch, D. M. Roundhill, Inorg. Chem., 36 (1997) 6468.
22. S. Knoblauch, O. M. Falana, J. Nam, D. M. Roundhill, H. Hennig, K. Zeckert, Inorg. Chim. Acta, 300-302 (2000) 328.
23. S. Knoblauch, H. F. Koch, C. Polydore, D. M. Roundhill, Canad. J. Chem., 79 (2001) 977
24. D. M. Roundhill, Prog. Inorg. Chem., 43 (1995) 533.
25. T. B. Rauchfuss, Prog. Inorg. Chem., 39 (1991) 259.
26. M.-G. Choi, R. J. Angelici, J. Am. Chem. Soc., 111 (1989) 8753.
27. SPARTAN, 5.0, Wavefunction Inc., Irvine, CA.

ISSN-1680-9955
Pak. J. Anal. Envir. Chem. Vol. 7, No. 1, (2006) 56 � 61
A Preliminary Study of Levels of Selected Nutrients for Neonates Born to Diabetic and Non-Diabetic Mothers in Bangladesh
SHAHANA AFROSE CHOWDHURY1, MOHAMMAD ARIFUR RAHMAN1
,
A. M. SHAFIQUL ALAM*1, SHAH MOHAMMAD KERAMAT ALI2 AND SYED NAZMUL HUDA2
*1 Department of Chemistry, University of Dhaka, Dhaka-1000, Bangladesh. 2Institute of Nutrition and Food Science, University of Dhaka, Dhaka-1000, Bangladesh. Abstract
To investigate some selected nutrients status in the neonates born to diabetic and non-diabetic mothers a prospective study was carried out. From the Obstetric Unit of Bangladesh Institute of Rehabilitation in Diabetes, Endocrine and Metabolic disorder (BIRDEM) Hospital, Dhaka, Bangladesh, 236 newborns were recruited; 74 from diabetic, 59 from gestational diabetic and 103 from non-diabetic mothers group for this study. Cord-serum levels of Cu, Zn, Fe, Mg, Ca and ascorbic acid were investigated, and some anthropometric measurements were recorded to correlate with the nutrient levels. Fe was found significantly higher (p<0.05) whereas, ascorbic acid was found significantly lower (p<0.05) in diabetic group compared with other two groups. However, Mg and Ca levels were found significantly higher (p<0.05) in non-diabetic group. There was no significant difference observed in Cu, Zn levels for the 3 groups. Ca level was significantly correlated with birth weight and length of the neonates. These data suggests that diabetes has some effects on fetal growth and its nutritional status that also reflect the socio-economical status of the families of the neonates.
Introduction Human development starts from conception; therefore, in all respects, fetal life is very important. The fetus is a separate physiological entity, relying on the mother to supply nutritional requirements even at the cost of reducing resources of the mother [1]. In the tissues of living organisms a number of inorganic nutrients are present in very small amounts and these are referred to as trace elements [2]. Those which are essential for life act as cofactors of enzymes and organizers of the structures of the cells (for example, mitochondria) and their membranes [3]. Certain trace elements, including zinc (Zn), copper (Cu), iron (Fe), magnesium (Mg) are known to play key physiological roles [2-5].
Ascorbic acid (Vitamin C) serves as a
reducing agent in a number of important
hydroxylation reactions in the human body [6]. However, it appears to have additional metabolic roles [7]. Ascorbic acid participates in the synthesis of adrenal hormones and vasoactive amines. It is also involved in microsomal drug metabolism, wound healing, leukocyte functions, tyrosine and folate metabolism [8-11] and may have cancer-prevention properties [12]. It is oxidized readily and the presence of Fe, Zn and Cu enhances the reaction rate [13].
Diabetes Mellitus (DM) is a chronic metabolic disorder, which has a profound effect on different metabolic processes. DM is caused by the inability of the pancreatic beta cells to produce sufficient insulin to utilize and store body glucose [14]. A decrease in insulin alters the nutritional status of the individual for both macro and micro-nutrients [15]. When associated with pregnancy, *1Author for Correspondence

Pak. J. Anal. Envir. Chem. Vol. 7, No. 1, (2006)
57
diabetes places the mother at an increased risk for hypoglycemia, hypocalcemia, hyperbilirubinemia, polycythemia and hyperinsulinemia [16,17]. Long-standing and severe diabetes associated with vasculopathy is responsible for retardation of intrauterine growth [18]. During pregnancy various minerals including calcium (Ca), Mg, Zn, Cu, are essential for fetal growth [19]. Diabetic subjects were reported to have elevated serum levels of dehydroascorbic acid [20].
The present study was designed to measure
the levels of Cu, Zn, Fe, Ca, Mg and ascorbic acid in the cord-serum of neonates from diabetic, Gestational Diabetes Mellitus (GDM) and non-diabetic (ND) mothers in Bangladesh. The purpose has been to investigate the nutrient levels among the groups and to determine the relationship of the anthropometric measurements of neonates with the nutrient levels in cord-serum. Subjects and methods
The neonates studied here were born in the Obstetric Unit of Bangladesh Institute of Rehabilitation in Diabetes, Endocrine and Metabolic disorder (BIRDEM) Hospital, Dhaka, Bangladesh. Consent from the hospital authority was provided prior to the commencement of the study. The mothers (n=236) were categorized into three groups:
Group I: pre-existing diabetic (n=74); including type 1 and 2 both [WHO criteria] [21] Group II: gestational diabetic (n=59); [WHO criteria] [21] Group III: non-diabetic (n=103) or the control group selected from babies born to mothers without diabetes at the same hospital and at the same time.
Gestational diabetic mothers were diagnosed for gestational diabetes mallitus (GDM) at 24-28 weeks of their gestational period. Blood and urine samples were collected and analysed to detect GDM at the diabetic center. 87% of the diabetic mothers were insulin dependent and the rest were non-insulin dependent. In this project,
both of the diabetes types were considered as one group.
All neonates were full-term, of normal
birth weight and were taken randomly during 1998-9. No other selection criteria were applied. Basic data obtained for the mothers of three groups included age, body mass index (BMI), recent blood pressure (BP) both systolic and diastolic, hemoglobin alpha 1 (HbA1c), after 8-10hours of overnight fasting blood was collected for the measurement of fasting blood glucose (FBG), and gestational age. At birth, the weight and height of the neonate were recorded. Information was obtained by reviewing medical records and direct interview with the mother�s consent. During the visit to the medical center, blood was collected from the mothers. HbA1c was done by high performance liquid chromatography (HPLC) using Shimadzu (Japan) instrument model LC-10AD and reversed-phase C18 column (Merck, Germany). Mixed venous-arterial blood (about 10mL) from the clamped umbilical cord (placental line) was collected immediately after the delivery (prior to expulsion of the placenta). Before hemolysis, all blood samples were centrifuged at 2,000 revolutions per minute (rpm) for 10-15 minutes. The clear serum was separated immediately and stored below � 40C.
The concentrations of Zn, Cu, Fe, Ca and Mg in cord-serum samples were determined by Atomic Absorption/ Flame Emission Spectrophotometry, using a Shimadzu (Japan) instrument model AA- 680. The levels of ascorbic acid were estimated by UV-visible spectroph-otometry using dinitrophenyl hydrazine and the method of Washko et al (20) with a Shimadzu instrument, model 160-A. Standard Reference Materials (SRM) for Cu, Zn, Ca and Mg were analyzed for testing the accuracy of the method. These were Trace Elements Serum, from Nycomed Pharma AS, Oslo, Norway. Statistical analysis
Student�s t-test was used to compare mean values. Values were expressed as mean ± SD or mean (95% Confidence Intervale), for all evaluations, p 0.05 was considered significant.
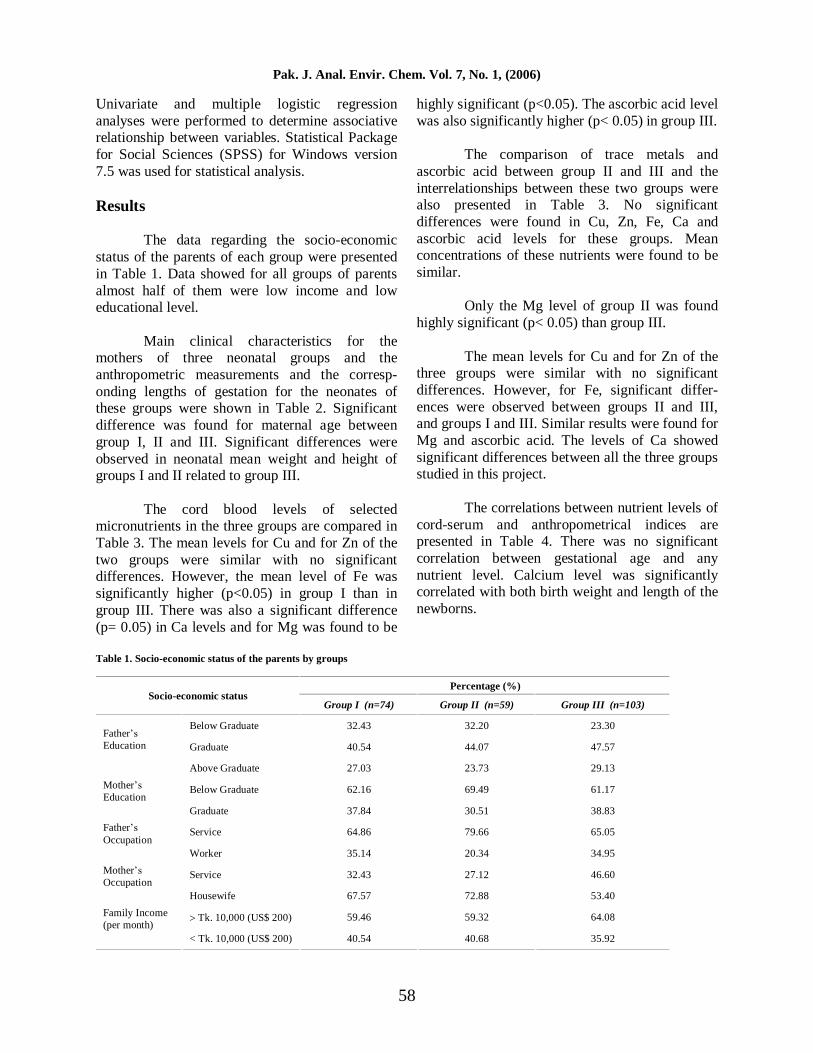
Pak. J. Anal. Envir. Chem. Vol. 7, No. 1, (2006)
58
Univariate and multiple logistic regression analyses were performed to determine associative relationship between variables. Statistical Package for Social Sciences (SPSS) for Windows version 7.5 was used for statistical analysis. Results
The data regarding the socio-economic status of the parents of each group were presented in Table 1. Data showed for all groups of parents almost half of them were low income and low educational level.
Main clinical characteristics for the mothers of three neonatal groups and the anthropometric measurements and the corresp-onding lengths of gestation for the neonates of these groups were shown in Table 2. Significant difference was found for maternal age between group I, II and III. Significant differences were observed in neonatal mean weight and height of groups I and II related to group III.
The cord blood levels of selected micronutrients in the three groups are compared in Table 3. The mean levels for Cu and for Zn of the two groups were similar with no significant differences. However, the mean level of Fe was significantly higher (p<0.05) in group I than in group III. There was also a significant difference (p= 0.05) in Ca levels and for Mg was found to be
highly significant (p<0.05). The ascorbic acid level was also significantly higher (p< 0.05) in group III.
The comparison of trace metals and
ascorbic acid between group II and III and the interrelationships between these two groups were also presented in Table 3. No significant differences were found in Cu, Zn, Fe, Ca and ascorbic acid levels for these groups. Mean concentrations of these nutrients were found to be similar.
Only the Mg level of group II was found highly significant (p< 0.05) than group III.
The mean levels for Cu and for Zn of the three groups were similar with no significant differences. However, for Fe, significant differ-ences were observed between groups II and III, and groups I and III. Similar results were found for Mg and ascorbic acid. The levels of Ca showed significant differences between all the three groups studied in this project.
The correlations between nutrient levels of
cord-serum and anthropometrical indices are presented in Table 4. There was no significant correlation between gestational age and any nutrient level. Calcium level was significantly correlated with both birth weight and length of the newborns.
Table 1. Socio-economic status of the parents by groups
Percentage (%) Socio-economic status
Group I (n=74) Group II (n=59) Group III (n=103)
Below Graduate 32.43 32.20 23.30
Graduate 40.54 44.07 47.57
Father�s Education
Above Graduate 27.03 23.73 29.13
Below Graduate 62.16 69.49 61.17 Mother�s Education
Graduate 37.84 30.51 38.83
Service 64.86 79.66 65.05 Father�s Occupation
Worker 35.14 20.34 34.95
Service 32.43 27.12 46.60 Mother�s Occupation
Housewife 67.57 72.88 53.40
Tk. 10,000 (US$ 200) 59.46 59.32 64.08 Family Income (per month)
< Tk. 10,000 (US$ 200) 40.54 40.68 35.92

Pak. J. Anal. Envir. Chem. Vol. 7, No. 1, (2006)
59
Table 2. Main maternal and neonatal characteristics in the three different groups
Characteristics Group I (n=74) Group II (n=59) Group III (n=103) p- value
Maternal:
Age (years) 29.47 ± 4.08 28.52 ± 4.26 25.41 ± 4.16 <0.002
Weight (kg) 65.36 ± 5.92 64.87 ± 6.18 64.58 ± 5.23 NS
Pregnancy BMI (kg/m2) 24.87 ± 3.73 24.76 ± 3.87 24.21 ± 3.18 NS
Blood Pressure (mmHg) 140/90 130/90 140/90 NS
Duration of diabetes (years) ≥ 10 - - -
Gestation (weeks) 38.42 ± 0.76 38.91 ± 0.82 38.84 ± 0.75 NS
Neonatal:
Birth Weight (kg) 3.45 ± 0.67 3.38 ± 0.63 3.06 ± 0.58 <0.001
Height (cm) 47.53 ± 2.88 48.00 ±2.37 46.82 ± 2.42 <0.001
Sex:
Male 39 28 50 NS
Female 35 31 53 NS
*Values are presented as mean ± SD, NS, indicates not significant for p < 0.05
Table 3. Comparison of the micronutrient levels for the neonate group
Cu Zn Fe Mg Ca Ascorbic acid
Group I (n=47) 65.7 12.6 124.8 43.7 581 175 8.1 1.4 1.4 0.3 0.2 0.1
Group II (n=54) 64.8 12.5 143.1 38.9 393 200 8.7 1.2 1.5 0.3 0.4 0.2
Group III (n=52) 65.8 17.3 132.3 44.4 423 175 9.2 1.4 1.7 0.2 0.4 0.1
p- value 0.5 0.4 0.001 0.000 0.000 0.000
95% confidence intervals for the differences
Group I-Group II (-5.4,11.0) (-37.8,12.0) (18.2,205.0) (-1.4,-0.1) (-0.3,0.0) (-0.3,-0.2)
NS NS S S S S
Group I-Group III (-9.1,7.5) (-35.7,14.6) (50.6,239.1) (-1.9,-0.7) (-0.4,-0.2) (-0.2,-0.1)
NS NS S S S S
Group II-Group III (-11.6,4.4) (-21.9,26.6) (-57.8,124.2) (-1.2,0.0) (-0.3,0.0) (0.0,0.1)
NS NS NS NS S NS
*Units for Cu, Zn, Fe are are g/dL and for Mg, Ca and ascorbic acid mg/dL. NS, not significant and S, significant for p < 0.05.

Pak. J. Anal. Envir. Chem. Vol. 7, No. 1, (2006)
60
Table 4. Correlation coefficients (r) between anthropometric measurements and nutrient levels of neonates
Anthropometric measurement Cu Zn Fe Mg Ca Ascorbic acid
Birth weight r= 0.1 p= NS
r= 0.1 p= NS
r= 0.2 p= NS
r= 0.1 p= NS
r= 0.6* p= 0.00
r= 0.1 p= NS
Height r= 0.1 p= NS
r= 0.2 p= NS
r= 0.0 p= NS
r= 0.1 p= NS
r= 0.4* p= 0.00
r= 0.1 p= NS
Gestational age r= 0.0 p= NS
r= 0.2 p= NS
r= 0.0 p= NS
r= 0.2 p= NS
r= 0.1 p= NS
r= 0.0 p= NS
*p- value is significant when r > 0.25 and NS, not significant.
Discussion
To the best of our knowledge this study is the first of its kind in Bangladesh, where newborns of three groups of mothers were investigated for selected nutrients and relationships of the nutrient levels with neonatal characteristics were examined and also parental socio-economic status were evaluated. As their level of income was low (Table 1), most of the pregnant mothers did not get sufficient nutrition and medical care during their pregnancy. Furthermore, their knowledge about diabetes related complications during gestation and its effects on the neonates were comparably very low. Most of them were not aware of the consequences of the disease. The results of this study (Tables 2 and 3) have been compared with data from some other countries and the neonates of Bangladesh studied here had lower nutrient levels and mean birth weights [22-24].
The cord- blood situation is known to
reflect the status of the micro and macro nutrients including Cu, Zn, Fe, Ca, Mg and ascorbic acid [24]. In the current study, no significant difference in Cu and Zn levels were found for the three groups. The concentration for Fe was found higher whereas for ascorbic acid, it was lower in the diabetic group than the other two groups. It is unlikely that this increase is due to possible oral iron supplementation during pregnancy. The modest decrease in ascorbic acid in diabetic group does not allow any conclusion about the biologic significance, remains unclear. As we know, no sound results have been produced in previous studies about this issue. It has also been reported that the fetal content of Ca is directly related to the
fetal weight, but is unaffected by the length of gestation [23]. The data obtained here showed a similar result with a significant correlation between Ca level, birth weight and length of the newborn. In a study undertaken in India, neonates of diabetic mothers were reportedly of greater length and weight [22, 24]. The lack of confirmation of this trend in the current study may reflect socioeconomic factors and their effect on maternal nutrition and hence on neonatal nutrition. Enhanced dietary status of mothers during gestation might help to improve the levels of minerals and vitamins potentially benefiting the development of the unborn child, particularly for chronic diabetic mothers.
In conclusion, it is necessary to pay prior
attention to the future development of children born to mothers with diabetes. Our findings justify further studies to investigate the biologic significance of the relationship between the nutrient status of neonates and diabetic condition of their mothers. References 1. D. C. Dutta The fetus. Text book of
obstetrics. 2nd Edn. Mahalaya, Calcutta: New Central Book Agency, (1986).
2. J. M Orten, O. W. Neuhaus Nutrition: normal or clinical inorganic elements. In: Human biochemistry. 10th Edn. New Delhi: B. I. Publications, (1982) 707.
3. C. T. Jones Disorders of trace mineral metabolism. In: Cecil text book of medicine. J. B. Wyngarden, L. H. Smith, J. C. Bennett,
Pak. J. Anal. Envir. Chem. Vol. 7, No. 1, (2006)
61
eds. 19th Edn. Philadelphia: W.B. Saunders, (1992) 1183.
4. P. A. Mayes Nutrition. In: Harper�s biochemistry, R. K. Murry, D. K. Granner, P. A. Mayes, V. W. Rodwell eds. 23rd Edn. C. T. Norwalk: Appleton and Lange, (1993) 599.
5. A. D. Mooradian, J. E. Morley Micronutrient status in diabetes mellitus. Am J Clin Nutr., 45 (1987) 877.
6. M. Levine. New concepts in the biology and biochemistry of ascorbic acid. N Eng J Med., 314 (1986) 892.
7. H. E. Sauberlich. Ascorbic acid: present knowledge in nutrition. 6th Edn. Washington DC: Int Life Sci Inst. National Foundation, (1990) 132.
8. V. G. Zannoni, E. G. Holsztynska, S. S. Lau. Biochemical functions of ascorbic acid in drug metabolism. In: Ascorbic acid: advances in chemistry, metabolism and uses. Advances in chemistry. P. A. Seib, B. M. Tolbert, eds. Series number 200. Washington DC: American Chemical Society. (1982) 349.
9. P. L. Schwart. Ascorbic acid in wound healing � a review. J Am Diet Assoc., 56 (1970) 497.
10. C. M. Lewis, E. L. McGown, M.G. Rusnak, H. E. Sauberlich. J. Nutr., 112 (1982) 673.
11. M. Levine, K. Morita. Vitam Horm., 42 (1985) 01.
12. A. B. Hanck. Vitamin C and cancer. Prog Clin Biol Res., 259 (1987) 307.
13. D. B. Milne, S. T. Omaye. Int. J. Vitam Nutr Res., (50) (1980) 301.
14. R. A. Kreislerg. Diabetic keratosis. In:
Diabetes mellitus � theory and practice H. Rifkin, D. Porte eds. 4th Edn. New York: Elsevier, (1990) 595.
15. R. Bruce, J. C. Stevenson. Bone and mineral metabolism in diabetes. In: Textbook of diabetes, J. Pickup, G. Williums eds. 1st Edn. Oxford, Blackwell Scientific Publications. (1991) 771.
16. R. G. Smith, C. C. Heise, J. C. King, F. M. Costa, J. L. Kitzmiller. J. Trace Elem Electrolytes Health Dis., 2 (1988) 239.
17. M. Granic, Z. Skrabalo, B. Moclovic. Biol Trace Elem Res., 32 (1992) 325.
18. L. Hallberg. In: Vitamins and Minerals in pregnancy and lactation, H. Beyer ed. Nestle nutrition workshop series, Vol. 16. New York, Rouen Press. (1988) 115.
19. J. Lesage, D. Hahn, M . Leonhardt, B. Blondeau, B. Breant, J. P. Dupouy. J. endocrin., 174 (2002) 37.
20. P. W. Washko, R. W. Welch, K. R. Dhariwal. Anal Biochem., 204 (1992) 01.
21. World Health Organization. Definition, diagnosis and classification of diabetes mellitus and its complications; Part 1: diagnosis and classification of diabetes mellitus. WHO department of noncommu-nicable disease surveillance. Geneva, (1999).
22. A. P. Gupta, B. Bhandary, A. Gupta. Indian Pediatrics., 21 (1984) 469.
23. S. Michelle, B. Bernard, L. A. Jean, G. Simone, L. Olivier. Clin Chem., 38 (1992) 141.
24. R. H. Merchanc, R. Dalvi, A. Vidwans. Indian Pediatrics., 27 (1990) 373.

Pak. J. Anal. Envir. Chem. Vol. 7, No. 1, (2006)
62
62
ISSN-1680-9955
Pak. J. Anal. Envir. Chem. Vol. 7, No. 1, (2006) 62 � 67
Lewis Acid Nature of SnCl4 and n-Bu2SnCl2 Determined by Adduct Formation with 3-Methyl-1-Indanone
MUHAMMAD DANISH1*, C.M. ASHRAF2, ALI MOHAMMAD3 AND FAIZ-UR-REHMAN3
1*Department of Chemistry, University of Sargodha, Sargodha, Pakistan 2Department of Chemistry, F.C. College University, Lahore, Pakistan 3Department of Chemistry, University of the Punjab, Lahore, Pakistan
Abstract Lewis acid nature of SnCl4 and n-Bu2SnCl2 has been studied using 3-methyl-1-indanone. The equilibrium constant has been calculated for both the tin moieties. It has been found that Lewis acid character of SnCl4 is fourteen times greater than that of n-Bu2SnCl2. Key words: Lewis Acid Nature, Adduct Formation, 3-Methyl-1-Indanone
Introduction Tin is inert and does not react with air or water at room temperature. However, at elevated temperatures, it forms a very thin oxide layer on the surface. Tin behaves in an amphoteric way and this nature depends upon concentration and temperature of the medium [1,2]. There are numerous reports on synthesis and applications of organotin compounds [3-8]; however, study of Lewis acid nature of tin halides and organotin halides covers the academic interest. In tin halides, organotin halides and most of organotin compounds, the tin center behaves as Lewis acid. Crystallographic data show, that tin center may show coordination number up to seven [10]. If a donor atom is much away from tin, it does not affect the coordination number and this state is also retained in non coordinating solvents [7,8,12]. Due to Lewis acid character of tin center, it can be used to study basic properties of compounds containing donor atoms. Compounds containing carbonyl group fit in this category as they act as Lewis bases.
In the present work, 3-methyl-1-indanone has been selected to study acidic properties of SnCl4 and n-Bu2SnCl2. Furthermore, it is an important ligand in the synthesis of various tricarbonyl chromium complexes [13-15].
Experimental All the chemicals were of analytical reagent grade (purchased from Merck) and used without further purification. Fresh distilled benzene was used whenever required.
Preparation of 3-methyl-1-indanone Dry benzene (50 cm3) [16] was taken in a two-necked round bottom flask equipped with a water condenser and magnetic stirrer. Crotonic acid (6.5 g) was then added followed by portionwise addition of anhydrous AlCl3 (31.8 g), under inert atmosphere. The reaction being exothermic started without heating. Afterwards, the reaction mixture was refluxed for five hours. The reaction mixture was cooled, extracted in dry benzene, washed with distilled water to remove un-reacted AICl3. The organic layer was separated and treated with an aqueous solution of sodium *Author for Correspondence

Pak. J. Anal. Envir. Chem. Vol. 7, No. 1, (2006)
63
63
bicarbonate to remove un-reacted crotonic acid and -phenyl butyric acid (by product). The organic layer was separated and washed twice with distilled water. The benzene extract was dried over MgSO4 for several hours and filtered. Benzene was removed under reduced pressure. The residue was dissolved in dry. ether (100 cm3), stirred with activated charcoal for several hours and filtered through alumina. The filtrate was concentrated to half of its volume and kept overnight. The 3-Methyl-1-indanone was obtained as a crude mass, which was purified by distillation under reduced pressure [17]. Measurement of absorption and equilibrium constant A stock solution of indanone (3.8x10⁻³ M) was prepared. Its molar concentration was kept constant throughout the experiment with both tin halides. The molar concentration of tin halides was varied for each determination. Stoichiometric
amounts of indanone and tin halide were mixed and absorption was measured at various wavelengths using UV-6000 UV-Vis-spectropho-tometer, R&M Marketing, England. The absorbance was calculated using Beer-Lambert law. Discussion
ortho-Dichlorobenzene was chosen as the solvent for studying the basicity of the ketone towards tin halides. Concentration of ketone was maintained constant while the concentration of SnC14 or n-Bu2SnCl2 was varied as far as experimentally possible.
The absorption data are given in Tables 1
and 2. The absorption spectra of neat of 3-methyl-1-indanone and with tin moieties are shown in Figs. 1 and 2. On adding SnC14 or n-Bu2SnC12 (as solution in ortho-dichlorobenzene),
Table 1. Absorption data for 3-methyl-1-indanone* with SnCl4.
Concentration of SnC14 (M) S. No.
Wave Length (nm) 0 1.86×10⁻³ 3.73×10⁻³ 7.45×10⁻³ 14.91×10⁻³
1 380 0.065 0.252 0.264 .285 0.325
2 390 0.048 0.237 0.252 0.276 0.320
3 400 0.044 0.235 0.247 0.284 0.336
4 410 0.032 0.223 0.250 0.293 0.354
5 420 0.022 0.210 0.256 0.302 0.376
6 430 0.017 0.202 0.260 0.310 0.392
7 440 0.013 0.190 0.230 0.304 0.380
8 450 0.010 0.174 0.202 0.285 0.356
9 460 0.008 0.163 0.177 0.250 0.315
10 470 0.007 0.149 0.156 0.190 0.248
11 480 0.006 0.133 0.140 0.150 0.192
12 490 0.004 0.116 0.124 0.130 0.162
13 500 0.002 0.103 0.114 0.122 0.146
14 510 0.000 0.096 0.107 0.114 0.130
15 520 0.000 0.089 0.101 0.106 0.118
16 530 0.000 0.087 0.098 0.104 0.109
17 540 0.000 0.084 0.086 0.102 0.104
* Concentration of 3-methyl-1-indanone taken each time is 3.84 × 10⁻³M
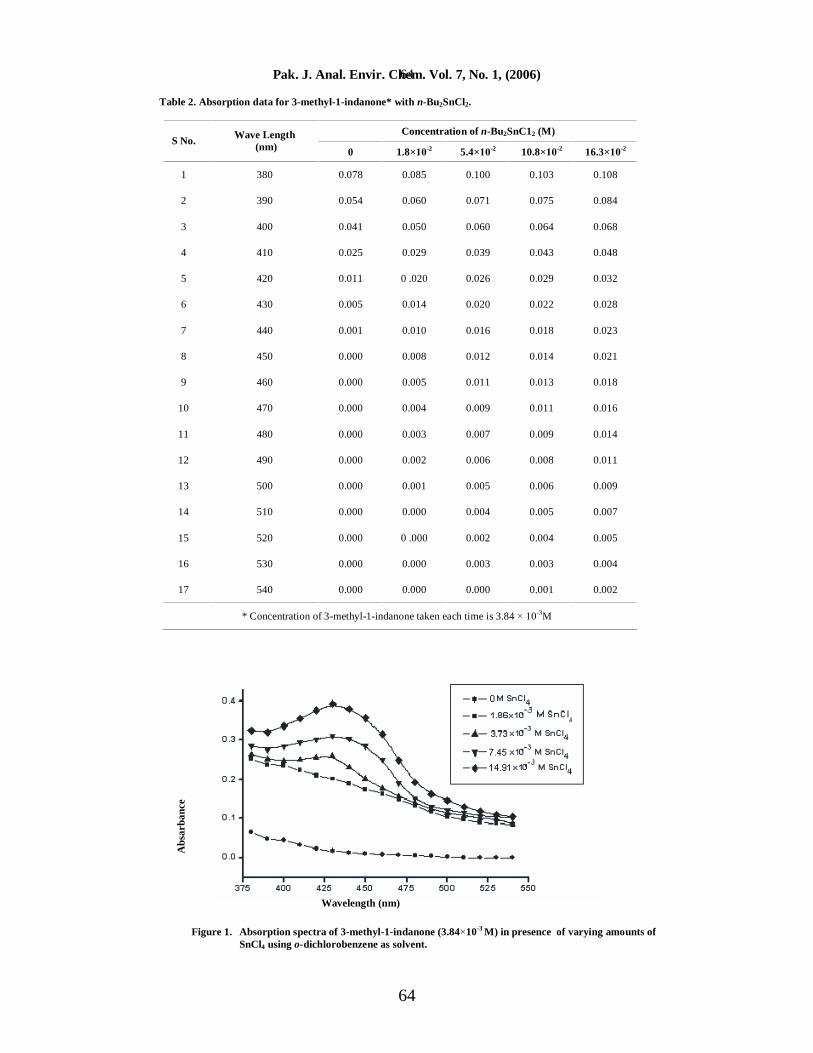
Pak. J. Anal. Envir. Chem. Vol. 7, No. 1, (2006)
64
64
Table 2. Absorption data for 3-methyl-1-indanone* with n-Bu2SnCl2.
Concentration of n-Bu2SnC12 (M) S No. Wave Length
(nm) 0 1.8×10⁻² 5.4×10⁻² 10.8×10⁻² 16.3×10⁻²
1 380 0.078 0.085 0.100 0.103 0.108
2 390 0.054 0.060 0.071 0.075 0.084
3 400 0.041 0.050 0.060 0.064 0.068
4 410 0.025 0.029 0.039 0.043 0.048
5 420 0.011 0 .020 0.026 0.029 0.032
6 430 0.005 0.014 0.020 0.022 0.028
7 440 0.001 0.010 0.016 0.018 0.023
8 450 0.000 0.008 0.012 0.014 0.021
9 460 0.000 0.005 0.011 0.013 0.018
10 470 0.000 0.004 0.009 0.011 0.016
11 480 0.000 0.003 0.007 0.009 0.014
12 490 0.000 0.002 0.006 0.008 0.011
13 500 0.000 0.001 0.005 0.006 0.009
14 510 0.000 0.000 0.004 0.005 0.007
15 520 0.000 0 .000 0.002 0.004 0.005
16 530 0.000 0.000 0.003 0.003 0.004
17 540 0.000 0.000 0.000 0.001 0.002
* Concentration of 3-methyl-1-indanone taken each time is 3.84 × 10⁻³M
Figure 1. Absorption spectra of 3-methyl-1-indanone (3.84×10⁻³ M) in presence of varying amounts of SnCl4 using o-dichlorobenzene as solvent.
Abs
arba
nce
Wavelength (nm)
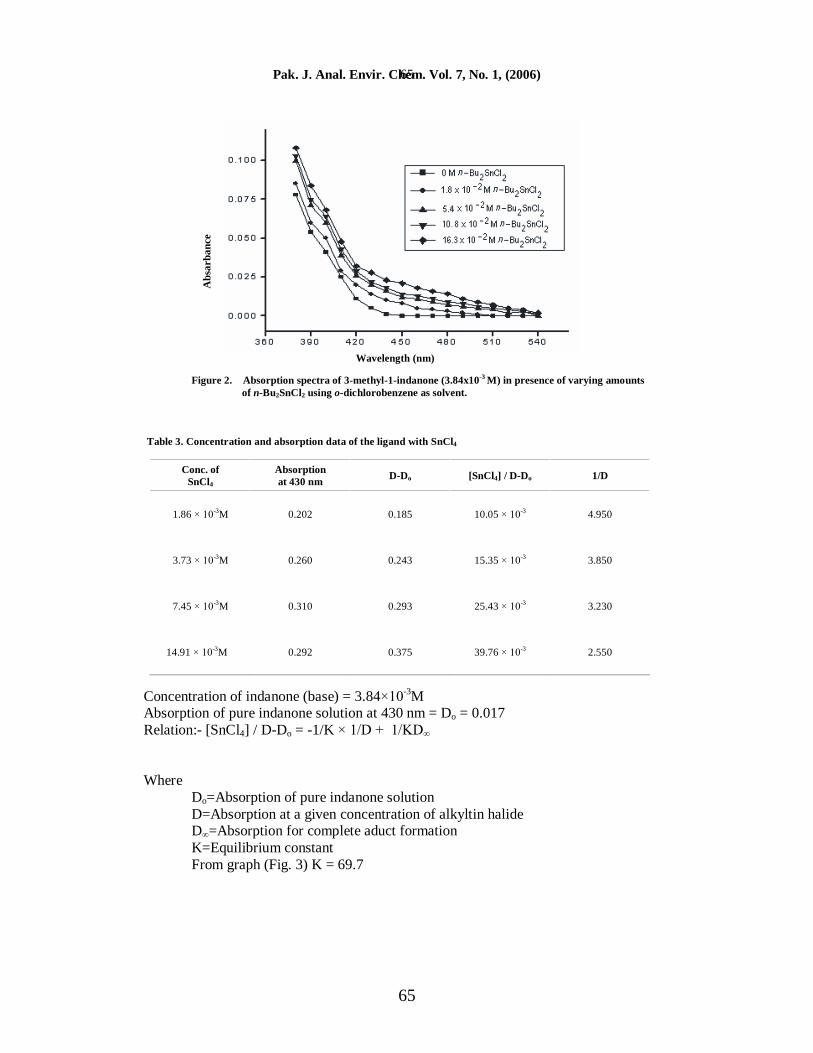
Pak. J. Anal. Envir. Chem. Vol. 7, No. 1, (2006)
65
65
Figure 2. Absorption spectra of 3-methyl-1-indanone (3.84x10⁻³ M) in presence of varying amounts of n-Bu2SnCl2 using o-dichlorobenzene as solvent.
Table 3. Concentration and absorption data of the ligand with SnCl4
Conc. of SnCl4
Absorption at 430 nm D-Do [SnCl4] / D-Do 1/D
1.86 × 10⁻³M 0.202 0.185 10.05 × 10⁻³ 4.950
3.73 × 10⁻³M 0.260 0.243 15.35 × 10⁻³ 3.850
7.45 × 10⁻³M 0.310 0.293 25.43 × 10⁻³ 3.230
14.91 × 10⁻³M 0.292 0.375 39.76 × 10⁻³ 2.550
Concentration of indanone (base) = 3.84×10⁻³M Absorption of pure indanone solution at 430 nm = Do = 0.017 Relation:- [SnCl4] / D-Do = -1/K × 1/D + 1/KD∞ Where Do=Absorption of pure indanone solution D=Absorption at a given concentration of alkyltin halide D∞=Absorption for complete aduct formation K=Equilibrium constant From graph (Fig. 3) K = 69.7
Abs
arba
nce
Wavelength (nm)

Pak. J. Anal. Envir. Chem. Vol. 7, No. 1, (2006)
66
66
Table 4. Concentration and absorption data of the ligand with n-Bu2SnCl2.
Conc. of Bu2SnCl2 Absorption at 420 nm D-Do [Bu2SnCl2] / D-Do 1/D
1.81 × 10⁻²M 0.020 0.009 2.640 50.00
5.44 × 10⁻²M 0.026 0.015 3.630 38.46
10.87 × 10⁻²M 0.029 0.018 5.040 34.48
16.31 × 10⁻²M 0.033 0.022 7.410 30.30
Concentration of indanone (base) = 3.84×10⁻³M Absorption of pure indanone solution at 420 nm = Do = 0.011 Relation:- [n-Bu2SnCl2] / D-Do = -1/K × 1/D + 1/KD∞ From graph (Fig. 4) K = 4.6
Figure 3. Plot of [SnCl4]/D-Do Vs 1/D for the interaction of 3-methyl-1- indanone with SnCl4.
Figure 4. Plot of [n-Bu2SnCl2]/D-Do Vs 1/D for the interaction of 3-methyl-1-indanone with n-Bu2SnCl2.
[SnC
l 4]/
D-D
0
1/D
[n-B
u 2Sn
Cl 2
]/D
-D
1/D
Pak. J. Anal. Envir. Chem. Vol. 7, No. 1, (2006)
67
67
the absorption increased. Absorption maxima were observed at 430 and 380 nm for SnC14 and n-Bu2SnCl2 respectively. Further increase in SnC14 or n-Bu2SnCl2 concentration was not possible experimentally because of weaker interaction between ketone and tin moieties. Attempts are made to calculate the equilibrium constant for the aduct formation between SnC14 or Bu2SnCl2 with 3-methyl-1-indanone and the results are shown in Tables 3 and 4. A plot of [SnC14]/D-Do and n-Bu2SnC12/D-Do against 1/D gave a straight line (Fig. 3 and 4).
The equilibrium constant K found from the plot shown in Figs. 3 and 4 is 69.7 for SnC14 and 4.6 for n-Bu2SnC12. These results show that 3-methyl-1-indanone interacts with SnCl4 or n-Bu2SnC12 in the aprotic medium and the interaction is reversible. The compound formed in solution has a l:l stoichiometry. The equilibrium constant values show that SnCl4 is about fourteen time stronger acid than n-Bu2SnCl2. It can be explained on the bases of replacement of two chloro- groups by butyl groups. This dictates that presence of highly electronegative group on tin increases its Lewis acidity. References 1. Mc Graw Hill Encyclopedia of Science and
Technology, Mc Graw Hill, New York 18 (1987) 367-369.
2. William Benton, Encyclopedia Britannica, London, 9 (1997) 1019-1021.
3. S. Tsunoi, H. Shioji and M. Tanika, Analytical Sciences, 20 (2004)101.
4. P. Novak, I. Gisurora, R. Jamber, A. Ruzicka & J. Holecek, Appl. Organometal. Chem.,18 (2004) 241.
5. W. Rehman, M.K. Baloch, B. Muhammad, A. Badshah and K. M. Khan, Chinese Sci. Bull., 49 (2004) 119.
6. I. Din, M. Mazhar, K. M. Khan, M.F Mohan, K.C. Molloy, J. Organomet. Chem., 689 (2004) 899.
7. M. Danish, H. G. Alt, A. Badhah, S. Ali, M. Mazhar and N. Islam, J. Organomet. Chem., 486 (1995) 51.
8. M. Danish, S. Ali, M. Mazhar, A. Badshah, M. I. Chaudhry, H.G. Alt and G. Kehr, Polyhedron, 14 (1995) 3115.
9. M. Danish, S. Ali, M. Mazhar, and A. Badshah, Main Group Metal Chem., 19 (1996) 121.
10. M. Danish, S. Ali, M. Mazhar, A. Badshah and E.R.T. Tiekink, Main Group Metal Chem., 18 (1995) 617.
11. M. Danish, S. Ali, M. Mazhar, T. Masood and E.R.T. Tiekink, Main Group Metal Chem., 18 (1995) 27.
12. M. Danish, S. Ali, and M. Mazhar, Heteroatom Chem., 7 (1996) 233.
13. C. M. Ashraf, W.R. Jackson and D. Rosh, Aust. J. Chem., 28 (1975) 197.
14. C. M. Ashraf and W. R. Jackson, Aust. J. Chem., 31 (1978) 1845.
15. C. M. Ashraf, Arab Gulf J. Scient. Res. Math. Phys. Sci., A5 (1987) 11.
16. D. D. Perrin and W. L. F. Armergo, �Purification of Laboratory Chemicals� ed 3rd, Pergamon, Oxford, (1987).
17. F. Koelsch. H. Hockmann and C.D. Claire, J. Am. Chem. Soc., 65 (1943) 59.