primary research future educators’ perceptions on...
TRANSCRIPT
TAF Journal of Advances in Humanities and Social Sciences
2016, 2(2): 85-97 JAHSS 1
13
Content from this work is copyrighted by TAF Publishing, which permits restricted commercial use, distribution and reproduction in any medium under a written permission. Users may print articles for educational and research uses only, provided the original author and source are credited. Any further utilization of this work must maintain attribution to the author(s), the title of the work and journal citation in the form of a proper scientific referencing.
Primary Research Future educators’ perceptions on technology and livelihood education status and development of work skills Rovelina B. Jacolbia 1, *
Polytechnic University of the Philippines, Manila, Philippines
Abstract. This study aimed to determine the Technology and Livelihood Education
Program status and the development of students’ work skills. The study made use of
descriptive type of research. It involved 125 randomly selected second year and third year
Bachelor in Business Teacher Education students of the Polytechnic University of the
Philippines using the survey questionnaire as the major instrument in gathering the data.
The mean average was used to describe the status of the TLE program in terms of
curriculum content, instructional methods, faculty competence, and adequacy of facilities
as well as the development of work skills and work attitudes of students. The Pearson
Product Moment Correlation was used to determine the relationship of the TLE program
with the development of students’ work skills. The study revealed that the Status of
Technology and Livelihood Education Program has a positively strong relationship with
the Development of Work Skills.
© 2016 TAF Publishing. All rights reserved.
INTRODUCTION
Among the learning areas, the Technology and Livelihood Education subject is
the most experiential, interactive, interdisciplinary and value-laden (cultural,
aesthetic, vocational, political-economic and moral values). It is in this learning
area that provides the Filipino learners the quality time to demonstrate
practical knowledge and life’s skills that have been gained, especially the skills
of vocational efficiency and empathy (De Alca, 2008).
Technology and livelihood education is vital to becoming a productive
member of the modern workforce. Choosing a career path and then learning the
technology related to that field or industry can be an excellent way to improve
the chances of succeeding in a career endeavor. Technology education is widely
* Corresponding author: Rovelina B. Jacolbia
E-mail: [email protected]
Keywords: Status Technology Livelihood education Work skills
Received: 7 March 2016 Accepted: 10 March 2016 Published: 26 April 2016
86 R. B. Jacolbia - Future educators’ perceptions on technology ... 2016
ISSN: 2414-3103 DOI: 10.20474/jahss-2.2.3 TAF
Publishing
available but it is not always free. Typically, students will attend vocational
schools, technical colleges and universities to learn technology, including
computer programming.
Technology and Livelihood Education intends to develop knowledge, skills,
values and attitudes that will prepare the students for entry into the world of
work. This will enable the students to gain understanding and acquire
competencies in various activities as they relate to Home Economics,
Agriculture Arts, Industrial Arts and Entrepreneurship (Calmorin, 1994).
The study of Technology and Livelihood Education needs redirection to suit
the conditions in today’s society and to promote advancement in knowledge
and respond to the needs of individuals, families and the community (Sizoo,
2005).
In this light, the acquisition of knowledge and skills as well as values and
attitudes necessary to help the learners enter the world of work should be given
emphasis.
Schools have the responsibility to uplift every student’s academic and
lifelong learning. In due time, these students are expected to contribute
significantly to the development of dynamic and self-sustaining economy, the
pursuit of a better quality of life and the attainment of global competitiveness.
With the present economic conditions, the kind of education that the
students should acquire must be within the mainstream of workforce which can
provide benefits to improve their lives. The Technology and Livelihood
Education is one of the subjects in the BBTE curriculum, which offers
opportunity to prepare students in the world of work which trains the students
to apply basic concepts and imbibe values related to practical work experiences.
First, the study aimed to determine the Technology and Livelihood
Education program in terms of curriculum content, instructional methods,
faculty competence, and adequacy of facilities.
Second, the study also looked at the development of the students’ work
skills.
Finally, the study wants to look at the relationship between the Technology
and Livelihood Education status and development of students’ work skills.
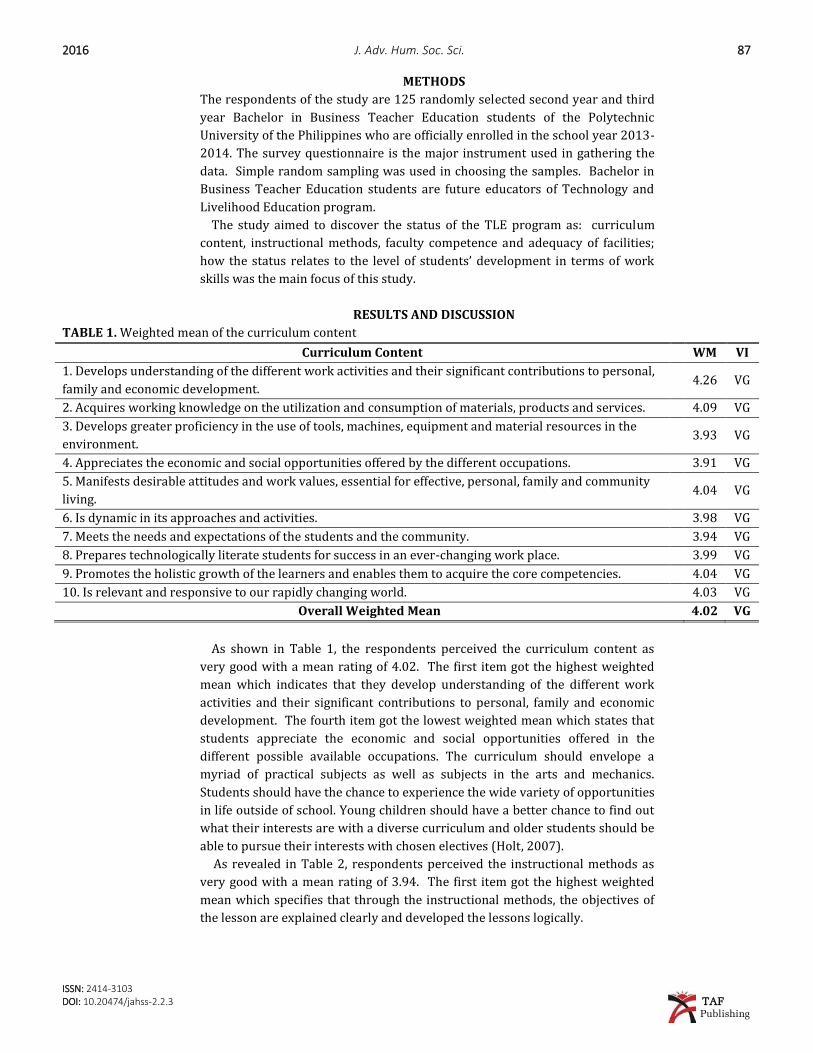
FIGURE 1. Research model
The Technology and Livelihood program status in terms of curriculum
content, instructional methods, faculty competence, and adequacy of facilities
are the independent variables. The dependent variable is the development of
students’ work skills.
2016 J. Adv. Hum. Soc. Sci. 87
ISSN: 2414-3103 DOI: 10.20474/jahss-2.2.3 TAF Publishing
METHODS
The respondents of the study are 125 randomly selected second year and third
year Bachelor in Business Teacher Education students of the Polytechnic
University of the Philippines who are officially enrolled in the school year 2013-
2014. The survey questionnaire is the major instrument used in gathering the
data. Simple random sampling was used in choosing the samples. Bachelor in
Business Teacher Education students are future educators of Technology and
Livelihood Education program.
The study aimed to discover the status of the TLE program as: curriculum
content, instructional methods, faculty competence and adequacy of facilities;
how the status relates to the level of students’ development in terms of work
skills was the main focus of this study.
RESULTS AND DISCUSSION
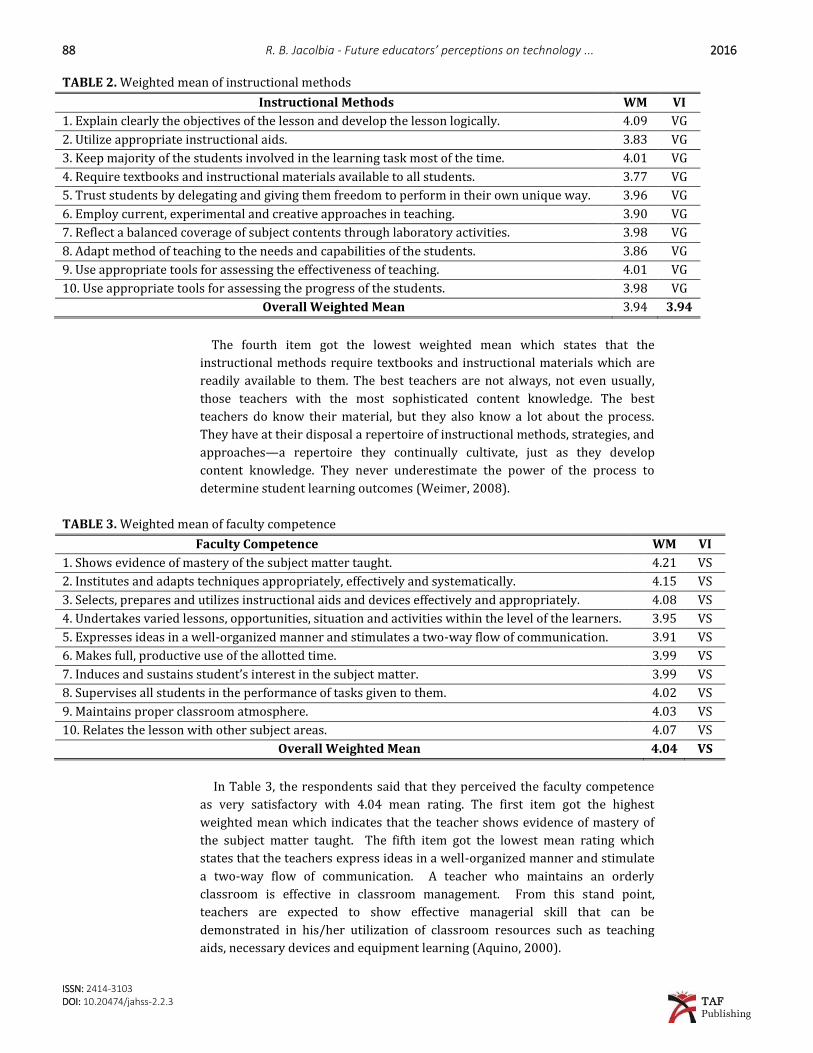
TABLE 1. Weighted mean of the curriculum content
Curriculum Content WM VI
1. Develops understanding of the different work activities and their significant contributions to personal,
family and economic development.
4.26 VG
2. Acquires working knowledge on the utilization and consumption of materials, products and services. 4.09 VG
3. Develops greater proficiency in the use of tools, machines, equipment and material resources in the
environment.
3.93 VG
4. Appreciates the economic and social opportunities offered by the different occupations. 3.91 VG
5. Manifests desirable attitudes and work values, essential for effective, personal, family and community
living.
4.04 VG
6. Is dynamic in its approaches and activities. 3.98 VG
7. Meets the needs and expectations of the students and the community. 3.94 VG
8. Prepares technologically literate students for success in an ever-changing work place. 3.99 VG
9. Promotes the holistic growth of the learners and enables them to acquire the core competencies. 4.04 VG
10. Is relevant and responsive to our rapidly changing world. 4.03 VG
Overall Weighted Mean 4.02 VG
As shown in Table 1, the respondents perceived the curriculum content as
very good with a mean rating of 4.02. The first item got the highest weighted
mean which indicates that they develop understanding of the different work
activities and their significant contributions to personal, family and economic
development. The fourth item got the lowest weighted mean which states that
students appreciate the economic and social opportunities offered in the
different possible available occupations. The curriculum should envelope a
myriad of practical subjects as well as subjects in the arts and mechanics.
Students should have the chance to experience the wide variety of opportunities
in life outside of school. Young children should have a better chance to find out
what their interests are with a diverse curriculum and older students should be
able to pursue their interests with chosen electives (Holt, 2007).
As revealed in Table 2, respondents perceived the instructional methods as
very good with a mean rating of 3.94. The first item got the highest weighted
mean which specifies that through the instructional methods, the objectives of
the lesson are explained clearly and developed the lessons logically.
88 R. B. Jacolbia - Future educators’ perceptions on technology ... 2016
ISSN: 2414-3103 DOI: 10.20474/jahss-2.2.3 TAF
Publishing
TABLE 2. Weighted mean of instructional methods
Instructional Methods WM VI
1. Explain clearly the objectives of the lesson and develop the lesson logically. 4.09 VG
2. Utilize appropriate instructional aids. 3.83 VG
3. Keep majority of the students involved in the learning task most of the time. 4.01 VG
4. Require textbooks and instructional materials available to all students. 3.77 VG
5. Trust students by delegating and giving them freedom to perform in their own unique way. 3.96 VG
6. Employ current, experimental and creative approaches in teaching. 3.90 VG
7. Reflect a balanced coverage of subject contents through laboratory activities. 3.98 VG
8. Adapt method of teaching to the needs and capabilities of the students. 3.86 VG
9. Use appropriate tools for assessing the effectiveness of teaching. 4.01 VG
10. Use appropriate tools for assessing the progress of the students. 3.98 VG
Overall Weighted Mean 3.94 3.94
The fourth item got the lowest weighted mean which states that the
instructional methods require textbooks and instructional materials which are
readily available to them. The best teachers are not always, not even usually,
those teachers with the most sophisticated content knowledge. The best
teachers do know their material, but they also know a lot about the process.
They have at their disposal a repertoire of instructional methods, strategies, and
approaches—a repertoire they continually cultivate, just as they develop
content knowledge. They never underestimate the power of the process to
determine student learning outcomes (Weimer, 2008).
TABLE 3. Weighted mean of faculty competence
Faculty Competence WM VI
1. Shows evidence of mastery of the subject matter taught. 4.21 VS
2. Institutes and adapts techniques appropriately, effectively and systematically. 4.15 VS
3. Selects, prepares and utilizes instructional aids and devices effectively and appropriately. 4.08 VS
4. Undertakes varied lessons, opportunities, situation and activities within the level of the learners. 3.95 VS
5. Expresses ideas in a well-organized manner and stimulates a two-way flow of communication. 3.91 VS
6. Makes full, productive use of the allotted time. 3.99 VS
7. Induces and sustains student’s interest in the subject matter. 3.99 VS
8. Supervises all students in the performance of tasks given to them. 4.02 VS
9. Maintains proper classroom atmosphere. 4.03 VS
10. Relates the lesson with other subject areas. 4.07 VS
Overall Weighted Mean 4.04 VS
In Table 3, the respondents said that they perceived the faculty competence
as very satisfactory with 4.04 mean rating. The first item got the highest
weighted mean which indicates that the teacher shows evidence of mastery of
the subject matter taught. The fifth item got the lowest mean rating which
states that the teachers express ideas in a well-organized manner and stimulate
a two-way flow of communication. A teacher who maintains an orderly
classroom is effective in classroom management. From this stand point,
teachers are expected to show effective managerial skill that can be
demonstrated in his/her utilization of classroom resources such as teaching
aids, necessary devices and equipment learning (Aquino, 2000).
2016 J. Adv. Hum. Soc. Sci. 89
ISSN: 2414-3103 DOI: 10.20474/jahss-2.2.3 TAF Publishing
TABLE 4. Weighted mean of adequacy of facilities
Adequacy of Facilities WM VI
1. Laboratory rooms are made available for the different TLE courses 3.77 VA
2. Laboratory rooms’ size is enough for the number of students per class. 3.64 VA
3. The laboratories are strategically located. 3.64 VA
4. The laboratories are equipped with demonstration areas, appropriate furniture, fixtures and
equipment.
3.54 VA
5. The laboratories are well lighted and well ventilated. 3.66 VA
6. The laboratories enable the students to do varied learning activities. 3.63 VA
7. The laboratories are provided with fire extinguishers and other safety devices. 3.59 VA
8. Procurement of equipment, supplies and software supplies is made periodically to upgrade and
update existing units and holdings.
3.68 VA
9. Books, journals and magazines for lectures are made available to students. 3.65 VA
10. There are adequate instructional materials to facilitate learning. 3.75 VA
Overall Weighted Mean 3.66 VA
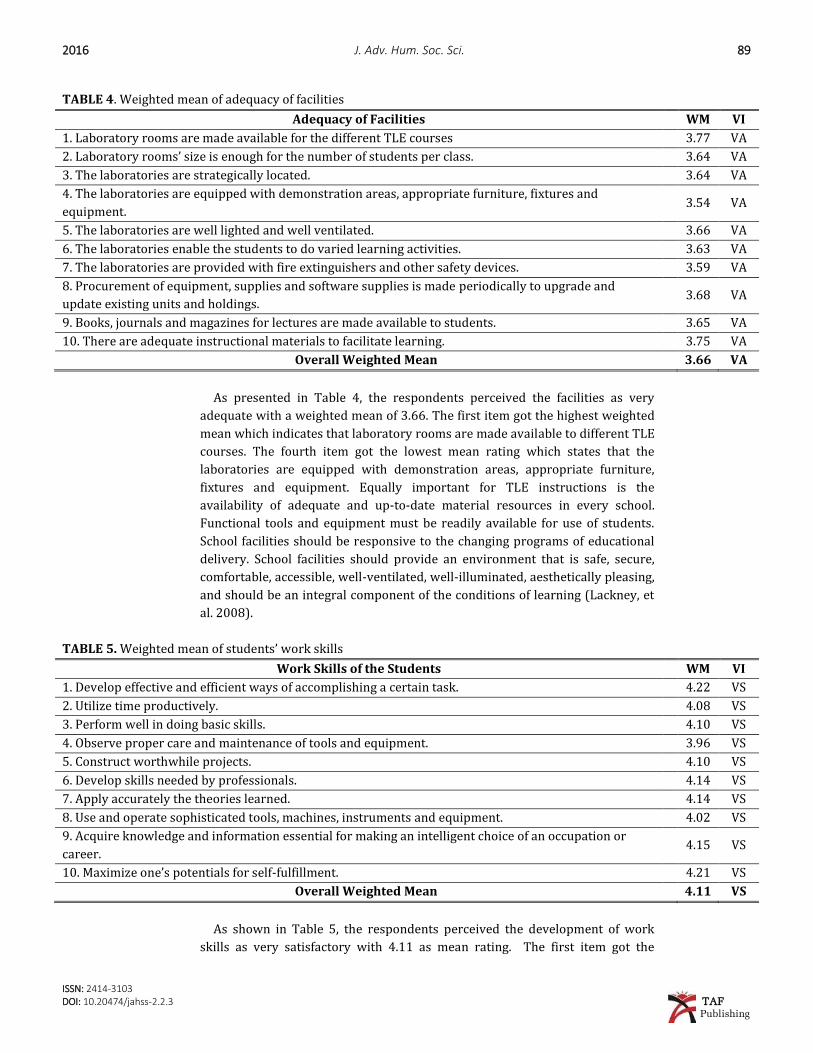
As presented in Table 4, the respondents perceived the facilities as very
adequate with a weighted mean of 3.66. The first item got the highest weighted
mean which indicates that laboratory rooms are made available to different TLE
courses. The fourth item got the lowest mean rating which states that the
laboratories are equipped with demonstration areas, appropriate furniture,
fixtures and equipment. Equally important for TLE instructions is the
availability of adequate and up-to-date material resources in every school.
Functional tools and equipment must be readily available for use of students.
School facilities should be responsive to the changing programs of educational
delivery. School facilities should provide an environment that is safe, secure,
comfortable, accessible, well-ventilated, well-illuminated, aesthetically pleasing,
and should be an integral component of the conditions of learning (Lackney, et
al. 2008).
TABLE 5. Weighted mean of students’ work skills
Work Skills of the Students WM VI
1. Develop effective and efficient ways of accomplishing a certain task. 4.22 VS
2. Utilize time productively. 4.08 VS
3. Perform well in doing basic skills. 4.10 VS
4. Observe proper care and maintenance of tools and equipment. 3.96 VS
5. Construct worthwhile projects. 4.10 VS
6. Develop skills needed by professionals. 4.14 VS
7. Apply accurately the theories learned. 4.14 VS
8. Use and operate sophisticated tools, machines, instruments and equipment. 4.02 VS
9. Acquire knowledge and information essential for making an intelligent choice of an occupation or
career.
4.15 VS
10. Maximize one’s potentials for self-fulfillment. 4.21 VS
Overall Weighted Mean 4.11 VS
As shown in Table 5, the respondents perceived the development of work
skills as very satisfactory with 4.11 as mean rating. The first item got the
90 R. B. Jacolbia - Future educators’ perceptions on technology ... 2016
ISSN: 2414-3103 DOI: 10.20474/jahss-2.2.3 TAF
Publishing
highest mean rating which indicates that they were able to develop effective
and efficient ways of accomplishing a certain task. The fourth item got the
lowest mean rating which states that the students observed proper care and
maintenance of tools and equipment. The development of psychomotor skills
through project making is considered as one of the expressive ways that
provide the start of the development of basic skills in arts and crafts.
The activity enhances the students’ opportunity to express themselves in
constructing projects. They find project making very appealing for they like to
manipulate, explore and create. The finding also implies that the development
of work skills maximizes the students’ potentials for self-fulfillment, develops
effective and efficient ways of accomplishing tasks and enables them to observe
proper care and maintenance of tools and equipment.
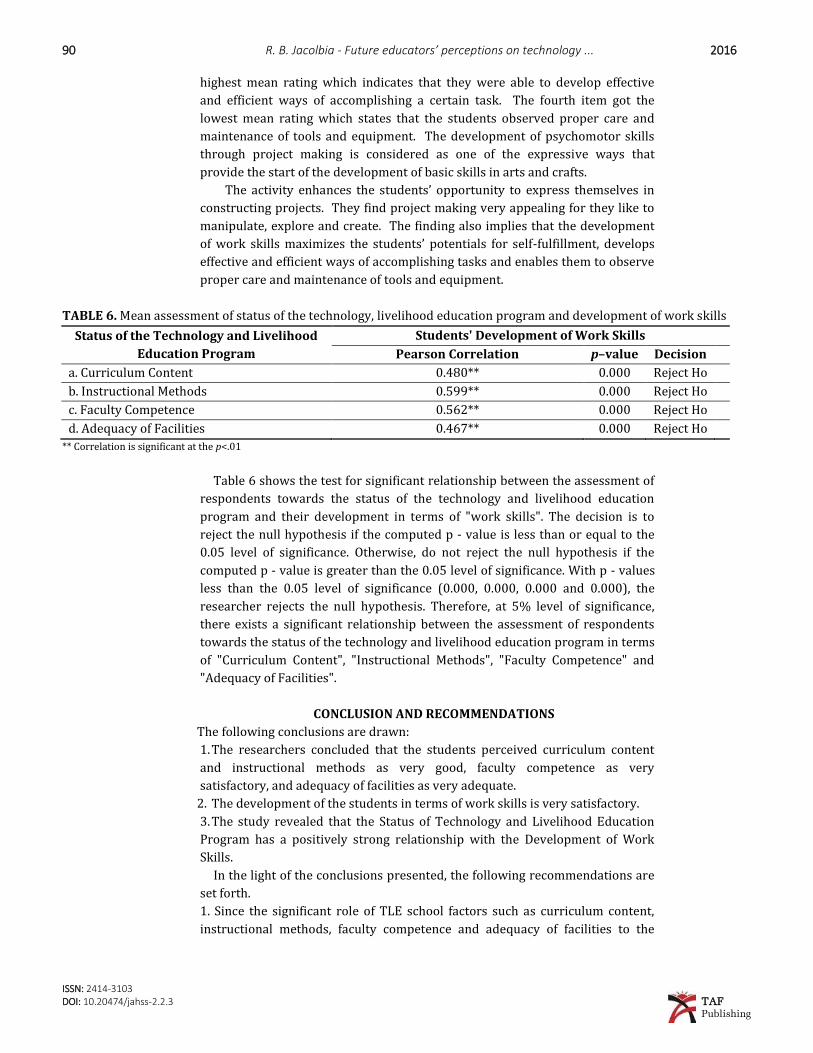
TABLE 6. Mean assessment of status of the technology, livelihood education program and development of work skills
Status of the Technology and Livelihood
Education Program
Students' Development of Work Skills
Pearson Correlation p–value Decision
a. Curriculum Content 0.480** 0.000 Reject Ho
b. Instructional Methods 0.599** 0.000 Reject Ho
c. Faculty Competence 0.562** 0.000 Reject Ho
d. Adequacy of Facilities 0.467** 0.000 Reject Ho
** Correlation is significant at the p<.01
Table 6 shows the test for significant relationship between the assessment of
respondents towards the status of the technology and livelihood education
program and their development in terms of "work skills". The decision is to
reject the null hypothesis if the computed p - value is less than or equal to the
0.05 level of significance. Otherwise, do not reject the null hypothesis if the
computed p - value is greater than the 0.05 level of significance. With p - values
less than the 0.05 level of significance (0.000, 0.000, 0.000 and 0.000), the
researcher rejects the null hypothesis. Therefore, at 5% level of significance,
there exists a significant relationship between the assessment of respondents
towards the status of the technology and livelihood education program in terms
of "Curriculum Content", "Instructional Methods", "Faculty Competence" and
"Adequacy of Facilities".
CONCLUSION AND RECOMMENDATIONS
The following conclusions are drawn:
1. The researchers concluded that the students perceived curriculum content
and instructional methods as very good, faculty competence as very
satisfactory, and adequacy of facilities as very adequate.
2. The development of the students in terms of work skills is very satisfactory.
3. The study revealed that the Status of Technology and Livelihood Education
Program has a positively strong relationship with the Development of Work
Skills.
In the light of the conclusions presented, the following recommendations are
set forth.
1. Since the significant role of TLE school factors such as curriculum content,
instructional methods, faculty competence and adequacy of facilities to the
2016 J. Adv. Hum. Soc. Sci. 91
ISSN: 2414-3103 DOI: 10.20474/jahss-2.2.3 TAF Publishing
development of the students’ work skills was confirmed in the study, the school
administration must undertake the following:
• Provide more up-to-date instructional facilities for TLE;
• Assure full utilization of the instructional facilities;
• Settle the idea that facilities provide an environment that is safe, secured,
comfortable, accessible, well-ventilated, well-illuminated, aesthetically pleasing,
and should be an integral component of the conditions of learning;
• Undertake periodic review, evaluation and enrichment of curriculum content
to strengthen life-long learning skills and work attitudes of students;
• Make improvement in the curriculum in such a way that the students can have
a better chance to find out what their interests are;
• Find ways to increase funds for the improvement of the schools’ facilities such
as buildings, equipment and tools, and learning resources;
• Provide incentives and scholarships to teachers and facilitators in the form of
seminars and the like to provide them the skills they need to succeed in a
rapidly changing environment;
2. Teachers should have a wide variety of instructional methods, strategies, and
approaches that they used during teaching-learning process.
3. Assessments on the teaching performance of teachers must be done on a
regular basis because these will ensure quality output for both teachers and
students.
Teachers who are described as autocratic with regard to classroom
management keep their students at a distance. They make educational decisions
on their own, state them to the students and expect students to obey them. It is
important to retain authority. The teacher determines the classroom rules to
explain to the students what they may face if they do not obey the rules.
Behavior is controlled by rewards and punishments. The educational process is
based on theory. The teacher does not care about the students’ interests, needs,
opinions or suggestions. The teacher is the only person responsible for planning
and running the lesson (Glasser, 1999; Robbins and David, 1998). Democratic
teachers, on the other hand, try to understand their students and try to address
their needs. They establish the classroom rules together with the students and
explain the reasoning behind them. Sharing the authority, encouraging
participation, and interaction are very important. They care about how students
learn and they are open to communication. They encourage students to express
their emotions and thoughts (Chambers and Hardy, 2005; Martin et al, 1998).
Teachers with laissez-faire behaviors usually have as less as possible points of
contact. Their expectations and classroom rules are not very clear. These
teachers, who do not take good care of lesson preparations, are more interested
in their own needs. Since they are not consistent and employ the classroom
rules very rarely, discipline problems rather than learning stand out in their
classrooms (Good and Jere, 2007; Santrock, 1996).
Teachers have various classroom management styles and they can employ
different management styles at the same time. However, only one of these can
be superior to the others (Alexander-Rami, 2011). It is important to detect how
teachers manage their classrooms and which behavior they mostly exhibit there
in order for trainings about developing classroom management skills to become
more effective. Ways to organize and manage educational processes are very
important on every single level of education. However, younger students are
92 R. B. Jacolbia - Future educators’ perceptions on technology ... 2016
ISSN: 2414-3103 DOI: 10.20474/jahss-2.2.3 TAF
Publishing
much more affected by their teachers’ behavior and teachers then become the
main model for their academic, social, and emotional development (Gordon,
1996). In this respect, primary school teachers’ views about classroom
management were investigated in this study in terms of different variables and
their autocratic, democratic and laissez-faire behavior in their classrooms.
METHOD
This is a descriptive survey model study. Primary school teachers working at
schools in the city of Adana formed the focus group of the study. To detect the
study sample, 30 primary schools were randomly chosen and 304 teachers from
those schools, 157 female and 147 male teachers, participated on a voluntary
basis. The data were collected through the “Teachers’ Perception of Classroom
Management Scale” (TPCMS), developed by Terzi (2001). The scale consists of
the three sub-dimensions; autocratic (A), democratic (D) and Laissez-faire (L)
and 34 items (behaviors). Since the 16th and 33rd items of the scale are the
control items, they were not evaluated. It has a 5-point Likert Scale (5-always,
4-mostly, 3-sometimes, 2-rarely, 1-never). The data were collected by school
visits during the 2014/2015 spring semester. The questionnaire usually took
about 20-25 minutes to be completed and there were no problems reported.
Besides the descriptive analysis, the data were also analyzed by Mann-Whitney
U and Kruskall Wallis tests and the significance level was determined to be 0.5.
The average scores of the teachers 1.00-1.80 were classified as “never”; 1.81-
2.6. as “rarely”; 2.61-3.40 as “sometimes”; “3.41-4.20 as “often” and 4.21-5.00 as
“always”.
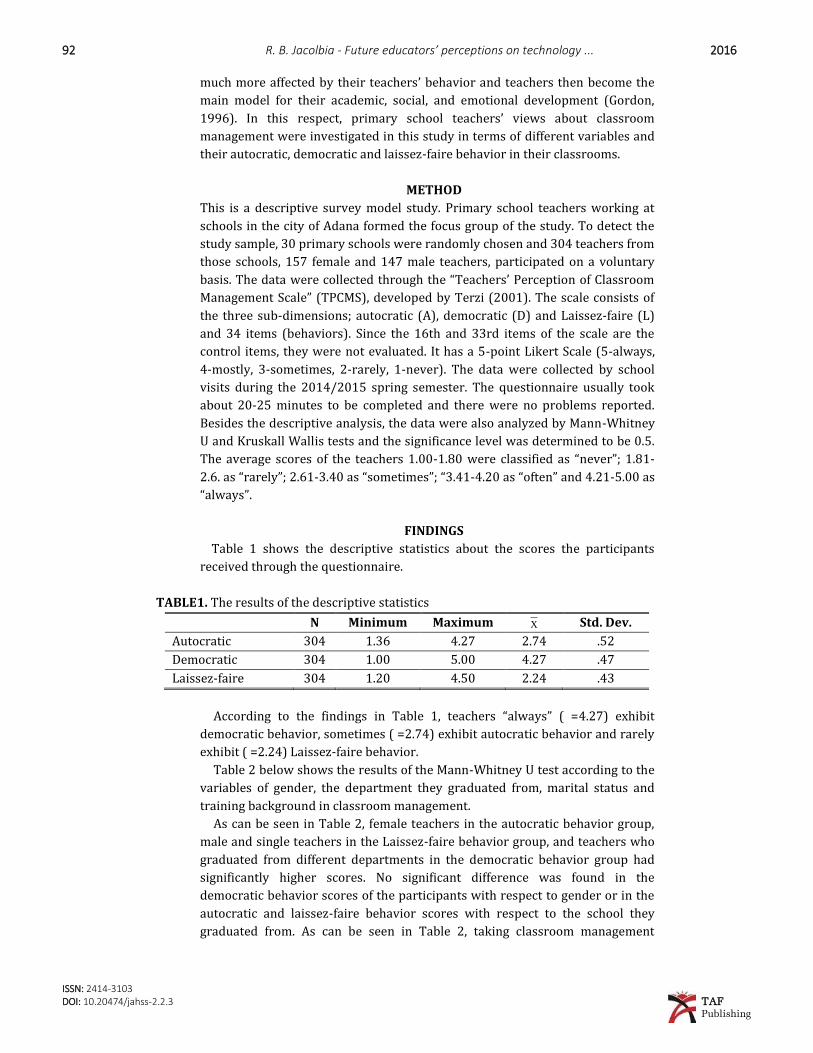
FINDINGS
Table 1 shows the descriptive statistics about the scores the participants
received through the questionnaire.
TABLE1. The results of the descriptive statistics
N Minimum Maximum X Std. Dev.
Autocratic 304 1.36 4.27 2.74 .52
Democratic 304 1.00 5.00 4.27 .47
Laissez-faire 304 1.20 4.50 2.24 .43
According to the findings in Table 1, teachers “always” ( =4.27) exhibit
democratic behavior, sometimes ( =2.74) exhibit autocratic behavior and rarely
exhibit ( =2.24) Laissez-faire behavior.
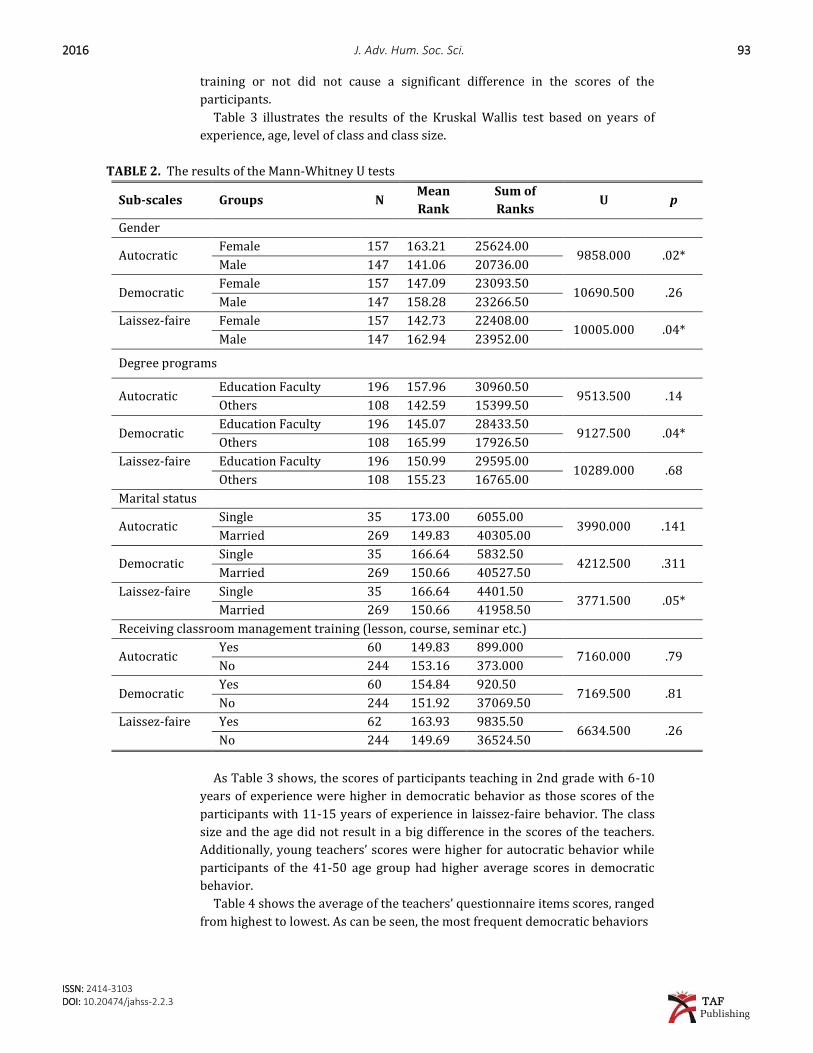
Table 2 below shows the results of the Mann-Whitney U test according to the
variables of gender, the department they graduated from, marital status and
training background in classroom management.
As can be seen in Table 2, female teachers in the autocratic behavior group,
male and single teachers in the Laissez-faire behavior group, and teachers who
graduated from different departments in the democratic behavior group had
significantly higher scores. No significant difference was found in the
democratic behavior scores of the participants with respect to gender or in the
autocratic and laissez-faire behavior scores with respect to the school they
graduated from. As can be seen in Table 2, taking classroom management
2016 J. Adv. Hum. Soc. Sci. 93
ISSN: 2414-3103 DOI: 10.20474/jahss-2.2.3 TAF Publishing
training or not did not cause a significant difference in the scores of the
participants.
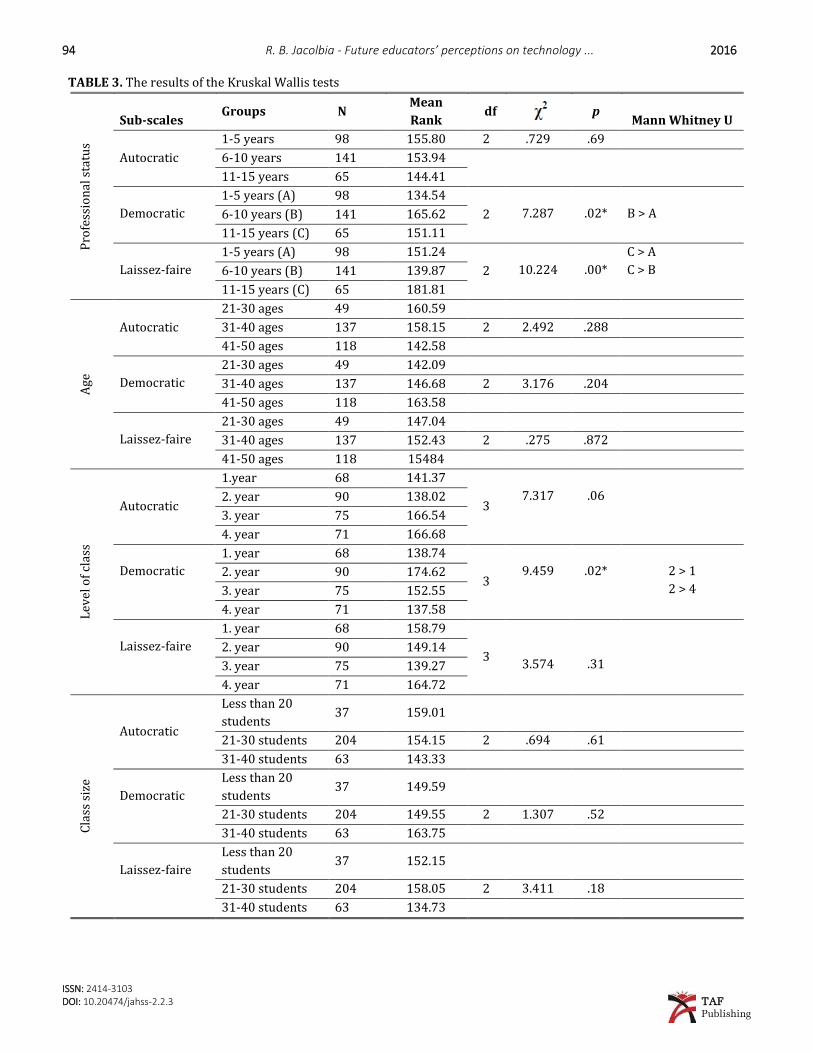
Table 3 illustrates the results of the Kruskal Wallis test based on years of
experience, age, level of class and class size.
TABLE 2. The results of the Mann-Whitney U tests
Sub-scales Groups N Mean
Rank
Sum of
Ranks U p
Gender
Autocratic Female 157 163.21 25624.00
9858.000 .02* Male 147 141.06 20736.00
Democratic Female 157 147.09 23093.50
10690.500 .26 Male 147 158.28 23266.50
Laissez-faire Female 157 142.73 22408.00 10005.000 .04*
Male 147 162.94 23952.00
Degree programs
Autocratic Education Faculty 196 157.96 30960.50
9513.500 .14 Others 108 142.59 15399.50
Democratic Education Faculty 196 145.07 28433.50
9127.500 .04* Others 108 165.99 17926.50
Laissez-faire Education Faculty 196 150.99 29595.00 10289.000 .68
Others 108 155.23 16765.00
Marital status
Autocratic Single 35 173.00 6055.00
3990.000 .141 Married 269 149.83 40305.00
Democratic Single 35 166.64 5832.50
4212.500 .311 Married 269 150.66 40527.50
Laissez-faire Single 35 166.64 4401.50 3771.500 .05*
Married 269 150.66 41958.50
Receiving classroom management training (lesson, course, seminar etc.)
Autocratic Yes 60 149.83 899.000
7160.000 .79 No 244 153.16 373.000
Democratic Yes 60 154.84 920.50
7169.500 .81 No 244 151.92 37069.50
Laissez-faire Yes 62 163.93 9835.50 6634.500 .26
No 244 149.69 36524.50
As Table 3 shows, the scores of participants teaching in 2nd grade with 6-10
years of experience were higher in democratic behavior as those scores of the
participants with 11-15 years of experience in laissez-faire behavior. The class
size and the age did not result in a big difference in the scores of the teachers.
Additionally, young teachers’ scores were higher for autocratic behavior while
participants of the 41-50 age group had higher average scores in democratic
behavior.
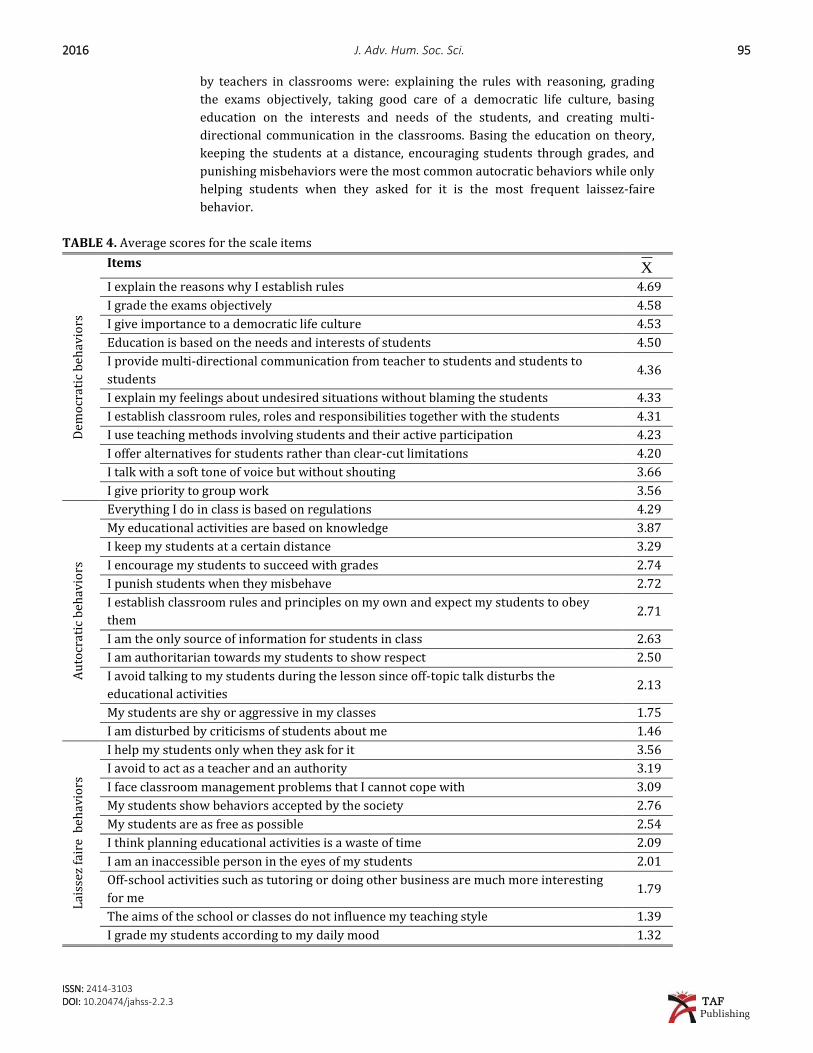
Table 4 shows the average of the teachers’ questionnaire items scores, ranged
from highest to lowest. As can be seen, the most frequent democratic behaviors
94 R. B. Jacolbia - Future educators’ perceptions on technology ... 2016
ISSN: 2414-3103 DOI: 10.20474/jahss-2.2.3 TAF
Publishing
TABLE 3. The results of the Kruskal Wallis tests P
rofe
ssio
nal
sta
tus
Sub-scales Groups N
Mean
Rank df p
Mann Whitney U
Autocratic
1-5 years 98 155.80 2 .729 .69
6-10 years 141 153.94
11-15 years 65 144.41
Democratic
1-5 years (A) 98 134.54
2
7.287
.02*
B > A 6-10 years (B) 141 165.62
11-15 years (C) 65 151.11
Laissez-faire
1-5 years (A) 98 151.24
2
10.224
.00*
C > A
C > B 6-10 years (B) 141 139.87
11-15 years (C) 65 181.81
Age
Autocratic
21-30 ages 49 160.59
31-40 ages 137 158.15 2 2.492 .288
41-50 ages 118 142.58
Democratic
21-30 ages 49 142.09
31-40 ages 137 146.68 2 3.176 .204
41-50 ages 118 163.58
Laissez-faire
21-30 ages 49 147.04
31-40 ages 137 152.43 2 .275 .872
41-50 ages 118 15484
Lev
el o
f cl
ass
Autocratic
1.year 68 141.37
3
7.317
.06
2. year 90 138.02
3. year 75 166.54
4. year 71 166.68
Democratic
1. year 68 138.74
3
9.459
.02*
2 > 1
2 > 4
2. year 90 174.62
3. year 75 152.55
4. year 71 137.58
Laissez-faire
1. year 68 158.79
3
3.574
.31
2. year 90 149.14
3. year 75 139.27
4. year 71 164.72
Cla
ss s
ize
Autocratic
Less than 20
students 37 159.01
21-30 students 204 154.15 2 .694 .61
31-40 students 63 143.33
Democratic
Less than 20
students 37 149.59
21-30 students 204 149.55 2 1.307 .52
31-40 students 63 163.75
Laissez-faire
Less than 20
students 37 152.15
21-30 students 204 158.05 2 3.411 .18
31-40 students 63 134.73
2016 J. Adv. Hum. Soc. Sci. 95
ISSN: 2414-3103 DOI: 10.20474/jahss-2.2.3 TAF Publishing
by teachers in classrooms were: explaining the rules with reasoning, grading
the exams objectively, taking good care of a democratic life culture, basing
education on the interests and needs of the students, and creating multi-
directional communication in the classrooms. Basing the education on theory,
keeping the students at a distance, encouraging students through grades, and
punishing misbehaviors were the most common autocratic behaviors while only
helping students when they asked for it is the most frequent laissez-faire
behavior.
TABLE 4. Average scores for the scale items
Dem
ocr
atic
beh
avio
rs
Items X
I explain the reasons why I establish rules 4.69
I grade the exams objectively 4.58
I give importance to a democratic life culture 4.53
Education is based on the needs and interests of students 4.50
I provide multi-directional communication from teacher to students and students to
students 4.36
I explain my feelings about undesired situations without blaming the students 4.33
I establish classroom rules, roles and responsibilities together with the students 4.31
I use teaching methods involving students and their active participation 4.23
I offer alternatives for students rather than clear-cut limitations 4.20
I talk with a soft tone of voice but without shouting 3.66
I give priority to group work 3.56
Au
tocr
atic
beh
avio
rs
Everything I do in class is based on regulations 4.29
My educational activities are based on knowledge 3.87
I keep my students at a certain distance 3.29
I encourage my students to succeed with grades 2.74
I punish students when they misbehave 2.72
I establish classroom rules and principles on my own and expect my students to obey
them 2.71
I am the only source of information for students in class 2.63
I am authoritarian towards my students to show respect 2.50
I avoid talking to my students during the lesson since off-topic talk disturbs the
educational activities 2.13
My students are shy or aggressive in my classes 1.75
I am disturbed by criticisms of students about me 1.46
Lai
ssez
fai
re b
ehav
iors
I help my students only when they ask for it 3.56
I avoid to act as a teacher and an authority 3.19
I face classroom management problems that I cannot cope with 3.09
My students show behaviors accepted by the society 2.76
My students are as free as possible 2.54
I think planning educational activities is a waste of time 2.09
I am an inaccessible person in the eyes of my students 2.01
Off-school activities such as tutoring or doing other business are much more interesting
for me 1.79
The aims of the school or classes do not influence my teaching style 1.39
I grade my students according to my daily mood 1.32
96 R. B. Jacolbia - Future educators’ perceptions on technology ... 2016
ISSN: 2414-3103 DOI: 10.20474/jahss-2.2.3 TAF
Publishing
DISCUSSION AND SUGGESTIONS
That most teachers display democratic classroom management behavior is a
positive factor for the students, learning democratic values through self-
awareness and getting ready for a democratic life. The reason for that is what
teachers give importance to, what they perceive as bad and their behaviors
implicitly form a value education for students (Doğanay, 2009). Many research
studies show that students’ stress and anxious levels decrease in democratic
classrooms while compliance-based behavior such as self-control, self-
responsibility, collaborative work attitude, and discussion skills develop
(Anyon, 1983; Chambers and Hardy, 2005; Doğanay and Sarı, 2004; Hawley,
2000; Hemmings, 2000; Sarı, 2007). The findings of the study show parallel
results with the related literature and reveal that female teachers display
autocratic classroom behavior more often than male teachers (Kutlu, 2006;
Okut, 2011; Sadık and Sadık, 2014; Sadık and Türkoğlu, 2015; Yıldırım, 2012).
Traditional and social roles, social expectations, as well as barriers in the
professional and social life might be the reason for female teachers to show a
more dominant behavior.
The results of the study illustrate that teachers with 6-10 years of experience
exhibit democratic behavior while unmarried and male teachers with 11-15
years of experience show more laissez-faire behavior. Novice teachers’
alleviated display of democratic behavior, compared with the other participants,
might originate from their lack of professional experience and their
inexperience in communicating with their students. Related studies reveal that
novice teachers, who encounter misbehavior in classroom management,
increasingly focus on controlling the classroom (Alkan, 2007; Akın, 2006;
Çubukçu and Girmen, 2008; İlgar, 2007; Yıldırım, 2012). The fact that male and
single teachers with 11-15 years of experience show laissez-faire behavior more
often might originate from a burnout syndrome. Research shows that more
experienced teachers become more hard-hearted and a relation between the
marital status and burnout syndrome is supporting this view (Başol and
Mehmet, 2009; Cemaloğlu and Dilek, 2007; Girgin, 1995; Gündüz, 2006; Tuğrul
and Çelik, 2002; Torun, 1995; Tümkaya, 1996).
According to the findings of the study, teachers teaching in the 2nd grade
show democratic behavior more often than 1st and 4th grade teachers. This
might be caused by the differences in child development and the multiple-
choice test-based central exams employed to advance to higher level of
education in Turkey. It is very difficult for 1st grade students (6-7 years old) to
sit down at a specified seat during the lesson, to ask for permission to talk, to
focus on the activities and to move together (Geçtan, 1982). This might be an
explanation for 1st grade teachers to set stricter classroom rules, applying the
rules rigorously, and employing rewards and punishments to manage the
behavior more often. The central exams in our country force the teachers and
the parents to think exam-result-oriented and they charge all responsibility to
cover the exam topics on the teachers’ shoulders (Baran and Taner, 2014; Şirin,
2000). Therefore, 4th grade teachers might try to avoid troubles in the
education with their autocratic behavior but transfer information in full to
encourage academic success.
2016 J. Adv. Hum. Soc. Sci. 97
ISSN: 2414-3103 DOI: 10.20474/jahss-2.2.3 TAF Publishing
In this study, the teachers’ views about classroom management behavior
were investigated and the teachers were found to mostly show democratic
behavior, sometimes exhibit autocratic behaviors and rarely display laissez-
faire behavior. The teachers’ behavior and views have been compared through
observing their classrooms. At the end of this study, it was detected that
receiving classroom management training or not did not make a significant
difference in the teachers’ behavior. In subsequent studies, the content of the
courses and trainings in their educational background and in-service classroom
management trainings and their benefits could be investigated.
ACKNOWLEDGMENT
This research was supported by Cukurova University Department of Scientific
Research Project (Project Number: 5547).
REFERENCES
Aquino. 2000. Instructional proficiency of the home technology teachers in cluster IV, division of Pampanga.
Unpublished Master’s Thesis, Don Honorio Ventura College of Arts and Trades, Bacoor, Pampanga.
Calmorin, Laurentina P. 1994. Educational research, measurement, and evaluation. Quezon: Philippine. Rex Book Store
Inc.
Damian. 2012. Evaluation on the effectiveness of the polytechnic university of the Philippines business teacher education
faculty. Unpublished undergraduate thesis, Polytechnic University of the Philippines, Manila, Philippines.
De Alca, Jocelyn D. A. 2008. Factors related to the performance of secondary students in technology and livelihood
education at La Navas National High School. Unpublished Graduate thesis, Colegio de San Juan de Letran College,
Manila, Philippines.
Holt. 2007. The nature of learner and teacher and how it affects curriculum and business. URL:
https://sg.yahoo.com/?p=us (accessed on December 20, 2013).
Lackney and Picus. (2008) Impact of school facilities in the learning environment. URL: http://goo.gl/sKjdSR (accessed
on February 4, 2014).
Ordonia. 2002. Development of instructional models in technology and livelihood education in Las Pinas NHSCAA
Annex SY 2001-2002. Unpublished graduate thesis TUP, Manila, Philippines.
Sizoo, Steve L, Agrusa, Jerrome F, and Iskat Wilfried. 2005. Measuring and develop the learning strategies of adult
career and vocational education students.
Weimer. 2008. Effective teaching strategies: The importance of marrying content and process. http://goo.gl/u3Cuoi
(accessed on February 10, 2014).
— This article does not have any appendix. —