primary measures to reduce tar formation in fluidised-bed ... · 2 ecn-c--04-014 preface this...
TRANSCRIPT

March 2004
ECN-C--04-014
Primary measures to reduce tar formation in fluidised-bed biomass gasifiers
Final report SDE project P1999-012
J.H.A. Kiel (Ed.), S.V.B. van Paasen, J.P.A. Neeft (ECN) L. Devi, K.J. Ptasinski, F.J.J.G. Janssen (TUE)
R. Meijer (KEMA) R.H. Berends, H.M.G. Temmink, G. Brem (TNO-MEP)
N. Padban, E.A. Bramer (UT)
Revisions A B
Made by: J.H.A. Kiel
Checked by: J. Beesteheerde
Approved/Issued by: H.J. Veringa
ECN Biomass

2 ECN-C--04-014
Preface This report describes the results obtained in the project “Primary measures to reduce tar formation in fluidised-bed biomass gasification”, conducted by order of the Agency for Research in Sustainable Energy (Samenwerkingsverband Duurzame Energie, abbreviated as SDE) under contract number P1999-012. The project has been executed by the following group of five partners: 1. ECN Biomass, Energy research Centre of the Netherlands (ECN) 2. Environmental Technology Group, Department of Chemical Engineering and Chemistry,
Eindhoven University of Technology (TUE) 3. KEMA Power Generation & Sustainables (KEMA) 4. TNO Environment, Energy and Process Innovation (TNO-MEP) 5. Department of Thermal Engineering, University of Twente (UT) The project co-ordination was conducted by ECN Biomass and the SDE programme manager was C. Daey Ouwens. Industrial guidance to the project work was provided by A.C. van Dongen (Reliant Energy), H.P. Calis and H.J.P. Haan (Shell Global Solutions). Abstract The main objective of the work described in this report has been to advance the knowledge base on tar formation in air-blown, atmospheric-pressure fluidised-bed gasification of woody biomass, in particular with respect to: • the effect of various fuel properties and gasifier operating conditions, • the underlying mechanisms, and • the impact of the resulting tar concentration and composition on the performance of
downstream processes. With respect to the latter, water solubility and condensation behaviour, expressed in terms of the tar dewpoint, were identified as the most important tar properties. The work was focussed mainly on bubbling-fluidised-bed (BFB) gasification, but circulating-fluidised-bed (CFB) gasification was addressed as well. Furthermore, much attention was given to the definition, measurement and classification of tar. In this respect, tar was defined as "all organic compounds with a molecular weight larger than benzene (excluding soot and char)". Measurement of individual tar compounds was conducted using either the Solid Phase Adsorption method or the Guideline method. In an extensive experimental programme, the impact on tar formation of three fuel properties (ash content, moisture content and lignocellulose composition) and three operating conditions (gasification temperature, gas residence time and bed material/additives) was determined in lab-scale bubbling-fluidised-bed gasifiers. The results were found to be representative for circulating-fluidised-bed (CFB)-gasification as well, provided that differences in gasification temperature and gas residence time (distribution) are taken into account. The report contains data to account for these differences. In addition to the experimental work, attempts were made to model tar formation. Subsequently, the advanced knowledge base was applied to assess the practical and economic feasibility of identified, most promising primary measures. Keywords biomass, fluidised-bed gasification, tar, tar formation, tar classification, primary measures, decomposition, cracking, polymerisation, catalyst, dolomite, olivine

ECN-C--04-014 3
CONTENTS
LIST OF TABLES 5 LIST OF FIGURES 5 SUMMARY 9 1. INTRODUCTION 13 1.1 Inventory study 14 1.2 Project scope 14 1.3 Tar definition and tar formation in a fluidised-bed biomass gasifier 16 1.4 Tar classification and measurement 19 1.5 Impact of fuel properties and operating conditions - experimental programme 23 1.6 References 25 2. INITIAL EXPERIMENTAL INVESTIGATION INTO TAR FORMATION IN
FLUIDISED-BED BIOMASS GASIFICATION 29 2.1 Introduction 29 2.2 Experimental 29 2.2.1 Gasifier 29 2.2.2 Experimental conditions 30 2.2.3 Tar sampling and analysis 30 2.3 Results and discussion 32 2.3.1 Conversion of the fuel to permanent gases and light hydrocarbons 33 2.3.2 Class 1 tar: Gravimetric tars 35 2.3.3 Class 2 tar: Heterocyclic aromatic compounds 36 2.3.4 Class 3 tar, benzene and toluene 37 2.3.5 Class 4 tar 39 2.3.6 Class 5 tar 41 2.4 Concluding remarks 42 2.5 References 42 3. TAR FORMATION MODELLING AND LAB-SCALE GASIFICATION
EXPERIMENTS 43 3.1 Introduction and scope 43 3.2 Modelling 43 3.2.1 The black box model 43 3.2.2 The kinetic (continuous) model 46 3.2.3 Conclusions modelling 49 3.3 Lab-scale gasification experiments 50 3.4 References 52 4. IMPACT OF FUEL PROPERTIES AND GASIFIER OPERATING CONDITIONS
ON TAR FORMATION 53 4.1 Introduction 53 4.2 Experimental 53 4.3 Results and discussion 55 4.3.1 Biomass ash content / char addition 55 4.3.2 Biomass moisture content 56 4.3.3 Biomass lignocellulose composition 58 4.3.4 Gasifier operating conditions (temperature and gas residence time) 60 4.3.5 Tar production in BFB vs. CFB gasifiers 72 4.4 Conclusions 74 4.5 Acknowledgements 75 4.6 References 75 5. CATALYTIC DECOMPOSITION OF BIOMASS TARS 77

4 ECN-C--04-014
5.1 Introduction 77 5.1.1 In-bed catalysts for biomass gasifiers (literature review) 77 5.1.2 Objective 78 5.2 Catalytic decomposition of biomass tar: use of untreated olivine as catalyst 78 5.3 Pre-treated olivine as a prospective tar removal catalyst 82 5.3.1 Experimental 82 5.3.2 Results and discussion 83 5.3.3 Apparent activation energy 86 5.3.4 Catalyst characterisation 87 5.4 Concluding remarks 89 5.5 Nomenclature 90 5.6 Acknowledgements 90 5.7 References 90 6. ECONOMIC AND PRACTICAL FEASIBILITY 93 6.1 Introduction 93 6.1.1 Objective 93 6.1.2 Approach and work programme 93 6.2 Effect of primary tar reduction measures 95 6.3 Discussion and conclusions 97 6.3.1 Main technical implications 97 6.3.2 Economic implications 99 6.4 Conclusions 103 6.5 Recommendations 104 6.6 References 104 7. OVERALL PROJECT CONCLUSIONS 105
ECN-C--04-014 5
LIST OF TABLES
Table 1.1 The applied tar classification system....................................................................19 Table 1.2 Experimental matrix. ...........................................................................................24 Table 1.3 Biomass fuel properties. ......................................................................................25 Table 2.1 UT gasification experiments. ...............................................................................30 Table 2.2 Compounds used in the calibration of the GC-MS. ..............................................31 Table 3.1 ECN data used to derive a black box model. ........................................................44 Table 3.2 UT data used to derive a black box model............................................................45 Table 3.3 Values of the coefficients in the black box model based on experimental data
from ECN and UT. ..............................................................................................45 Table 3.4 Experiments with the TNO-MEP set-up...............................................................51 Table 4.1 Impact of ash content: experimental results..........................................................55 Table 4.2 Impact of biomass moisture content: experimental results....................................57 Table 4.3 Impact of lignocellulose composition: experimental results..................................58 Table 4.4 Impact of gas residence time: experimental results...............................................60 Table 4.5 Impact of gasification temperature: experimental results......................................62 Table 4.6 Impact of gasification temperature at varying ER: experimental results................63 Table 4.7 Ultimate analysis of gravimetric tars and the GC-undetectable fraction (class 1
tar), sampled just above the sand bed...................................................................71 Table 4.8 Ultimate analysis of gravimetric tars and the GC-undetectable fraction (class 1
tar), sampled after the cyclone. ............................................................................71 Table 5.1 Experimental conditions. .....................................................................................83 Table 5.2 Experimental results. ...........................................................................................85 Table 5.3 Catalyst properties...............................................................................................87 Table 6.1 Effect of primary tar reduction measures on tar production. .................................96 Table 6.2 Positive or negative effect of primary tar measures on tar dewpoint and water
solubility. ............................................................................................................97 Table 6.3 Main technical implications of implementing primary tar reduction measures......98 Table 6.4 Chosen parameter values in the sensitivity analyses. .......................................... 100 Table 6.5 Main parameters of the fifteen cases evaluated. ................................................. 102 Table 6.6 Expected technical and economic benefits of primary tar reduction measures for
different gasification systems. ........................................................................... 103
LIST OF FIGURES
Figure 1.1 Schematic representation of the four processes of drying, pyrolysis, oxidation and gas (phase) reactions in a bubbling-fluidised-bed biomass gasification process. ...............................................................................................................17
Figure 1.2 Conversion-temperature diagram of important tar compounds. ............................18 Figure 1.3 The Guideline sampling set-up. ...........................................................................21 Figure 1.4 Range of tar compounds covered by the applied tar analysis methods. .................21 Figure 1.5 Tar dewpoint at atmospheric pressure vs. tar concentration for different tar
classes. ................................................................................................................22 Figure 1.6 Tar dewpoint for a real tar composition as measured with the SPA method in the
BFB gasifier WOB at ECN..................................................................................23 Figure 2.1 10 kWth UT-gasifier.............................................................................................29 Figure 2.2 Schematic of the tar sampling system. .................................................................31 Figure 2.3 Response (expressed as peak area/concentration ratio) of the GC-MS vs.
molecular weight (MW). .....................................................................................32
6 ECN-C--04-014
Figure 2.4 Gas production at different reactor levels: t) top, m) middle and b) bottom. ......... 33 Figure 2.5 Formation of light hydrocarbons (expressed as methane equivalent) as a
function of different process parameters. ............................................................. 34 Figure 2.6 Conversion of fuel to class 1 tar. ......................................................................... 35 Figure 2.7 Conversion of fuel to class 2 tar. ......................................................................... 36 Figure 2.8 Conversion of fuel to class 3 tar. ......................................................................... 37 Figure 2.9 Conversion of fuel to benzene and toluene........................................................... 38 Figure 2.10 Conversion of fuel class 4 tar. ............................................................................. 40 Figure 2.11 Conversion of fuel class 5 tar. ............................................................................. 41 Figure 3.1 Black box model of a bubbling-fluidised-bed gasifier. ......................................... 43 Figure 3.2 ECN data used to derive a black box model: tar class concentrations at two
locations in the WOB gasifier vs. bed temperature............................................... 44 Figure 3.3 Black box model results vs. the original ECN data............................................... 46 Figure 3.4 Probability of breaking........................................................................................ 47 Figure 3.5 Tars released from the bed section of the WOB bubbling-fluidised-bed gasifier
at ECN. ............................................................................................................... 48 Figure 3.6 Tars at the end of the freeboard in the WOB bubbling-fluidised-bed gasifier at
ECN.................................................................................................................... 48 Figure 3.7 Ultimately remaining compounds........................................................................ 49 Figure 3.8 The TNO-MEP bubbling-fluidised-bed gasification set-up. ................................. 50 Figure 4.1 Schematic of the 1 kg/h bubbling-fluidised-bed gasifier (WOB) at ECN. ............. 54 Figure 4.2 Gas composition and gasifier operating temperatures during the experiments
with different char/biomass ratios, see Section 4.3.1. ........................................... 54 Figure 4.3 Impact of ash content: tar composition and dewpoint after the cyclone. ............... 56 Figure 4.4 Impact of biomass moisture content: tar composition and dewpoint after the
cyclone. .............................................................................................................. 57 Figure 4.5 Impact of gas residence time: tar concentration and dewpoint.............................. 61 Figure 4.6 Impact of gasification temperature: tar concentration and dewpoint. .................... 62 Figure 4.7 Impact of gasification temperature at varying ER: tar concentration and
dewpoint just above the sand bed. ....................................................................... 64 Figure 4.8 Impact of gasification temperature at varying ER: tar concentration and
dewpoint after the cyclone................................................................................... 64 Figure 4.9 Tar compounds with an alkyl-substituted group sampled just above the sand bed
at different gasification temperatures................................................................... 65 Figure 4.10 Tar compounds with an alkyl-substituted group sampled after the cyclone at
different gasification temperatures....................................................................... 66 Figure 4.11 Heterocyclic tar compounds sampled just above the sand bed at different
gasification temperatures..................................................................................... 66 Figure 4.12 Heterocyclic tar compounds sampled after the cyclone at different gasification
temperatures........................................................................................................ 67 Figure 4.13 PAH tar compounds without substituted groups sampled just above the sand bed
at different gasification temperatures................................................................... 68 Figure 4.14 PAH tar compounds without substituted groups sampled after the cyclone at
different gasification temperatures....................................................................... 68 Figure 4.15 HPLC analysis of gravimetric tar sampled just above the sand bed at different
gasification temperatures..................................................................................... 70 Figure 4.16 HPLC analysis of gravimetric tar sampled after the cyclone at different
gasification temperatures..................................................................................... 70 Figure 4.17 Tar composition vs. gasfication temperature for the BFB (WOB) and CFB
(BIVKIN) gasifiers at ECN. ................................................................................ 73 Figure 5.1 Conversion of tars with different additives (T rector = 900°C). ............................... 79 Figure 5.2 Conversion of total tar with addition of dolomite and olivine............................... 80 Figure 5.3 Total tar content and contribution of individual tar classes after catalytic
treatment. ............................................................................................................ 81
ECN-C--04-014 7
Figure 5.4 Class 4 tar and naphthalene concentrations after catalytic treatment with dolomite (left) and olivine (right).........................................................................81
Figure 5.5 Experimental set-up for decomposition of model biomass tar (naphthalene).........82 Figure 5.6 Effect of pre-treatment of olivine on naphthalene conversion...............................83 Figure 5.7 Effect of pre-treatment time on naphthalene conversion.......................................84 Figure 5.8 Distribution of different tar compounds with 10 hours pre-treated olivine. ...........85 Figure 5.9 Arrhenius plot for calculation of apparent activation energy.................................86 Figure 5.10 X-ray Photoelectron Spectroscopy (XPS) scan.....................................................88 Figure 5.11 Fluidised-bed attrition tester. ...............................................................................88 Figure 5.12 Elutriation propensity of olivine. .........................................................................89 Figure 6.1 CFB gasification system A. .................................................................................94 Figure 6.2 CFB gasification system B. .................................................................................94 Figure 6.3 CFB gasification system C. .................................................................................95 Figure 6.4 Effect of class 5 tar concentration variations on the dewpoint temperature. ..........96 Figure 6.5 Sensitivity analysis on net yearly revenues. ....................................................... 101 Figure 6.6 Net power production and E-revenues. .............................................................. 102

8 ECN-C--04-014

ECN-C--04-014 9
SUMMARY
Gasification technologies are expected to play a key role in expanding the use of biomass as a major renewable energy source. The conversion of the solid feedstock to a gaseous fuel (producer gas or synthesis gas) significantly increases its potential. The gas can be used for applications such as co-firing in coal- or natural gas-fired power plants, electricity generation in stand-alone conversion devices, and the production of gaseous/liquid fuels or chemicals. For all these applications, a more or less extensive cleaning of the product gas is required. In particular, proper control of the tar content (or the combination of tar and particulates) to avoid, e.g., fouling due to tar condensation or difficult to handle and hazardous tar-water mixtures, often is a major challenge. Basically, there are two main options for controlling the tar content in gasifier product gas, viz.: • by applying downstream cleaning processes (secondary measures) or, • by optimising biomass fuel properties and/or gasifier design and operating conditions
(primary measures). Generally, the latter should be considered first, because of their inherent potential of being more cost effective. Therefore, five R&D organisations in the Netherlands, viz. ECN, Eindhoven University of Technology (TUE), KEMA, TNO-MEP and University of Twente (UT), teamed to elucidate the possibilities of these primary measures. The project has been focussed on air-blown, atmospheric-pressure fluidised-bed gasification of woody biomass, being one of the major gasification technology applications. The main findings are described in this report. From an initial inventory study, it was concluded that: • In many studies, tar is considered as a lump-sum compound, while in downstream processes
only specific tar compounds may be problematic and others may be harmless or even beneficial.
• Many studies focus on tar formation, without paying attention to the impact of the tar concentration and composition on the performance of downstream processes.
• Only a limited number of studies have addressed the relation between tar concentration and/or composition and gasification conditions in a systematic way. The impact of biomass fuel properties on tar formation and downstream problems received even less attention.
Therefore, the project was focussed first of all on advancing the knowledge base, in particular with respect to: • the effect of various fuel properties and gasifier operating conditions, • the underlying mechanisms, and • the impact of the resulting tar concentration and composition on the performance of
downstream processes. With respect to the latter, water solubility and condensation behaviour, expressed in terms of the tar dewpoint, were identified as the most important tar properties. The work was focussed mainly on bubbling-fluidised-bed (BFB) gasification, but circulating-fluidised-bed (CFB) gasification was addressed as well. Furthermore, much attention was given to the definition, measurement and classification of tar. In this respect, tar was defined as "all organic compounds with a molecular weight larger than benzene (excluding soot and char)". Tar measurement comprised the determination of the tar content and composition by measuring individual tar compounds using either the Solid Phase Adsorption method or the Guideline method1. However, to allow a concise presentation of experimental results and obtaining mechanistic
1 The Guideline method resulted from a broad international effort to arrive at a widely-accepted, standard tar measurement method. Details can be found on the dedicated web-site www.tarweb.net.

10 ECN-C--04-014
insight, the individual tar compounds were grouped into the following five classes based on the behaviour of the tar compounds in downstream processes: Class 1: GC-undetectable tars (= tar compounds that cannot be detected with a GC-FID or GC-
MS, equipped with a non-polar capillary column). Class 2: Heterocyclic components (like phenol, pyridine, cresol) with a high water solubility. Class 3: Aromatic compounds (1-ring; e.g., xylene, styrene, toluene). Light hydrocarbons that
are not important in condensation and water solubility issues. Class 4: Light polyaromatic hydrocarbons (2-3 ring PAH compounds; e.g., naphtalene,
fluorene, phenanthrene). These components condense at relatively high concentrations and intermediate temperatures.
Class 5: Heavy polyaromatic hydrocarbons (4-7 ring PAH compounds; e.g., fluoranthene, pyrene, up to coronene). These compounds condense at relatively high temperature at low concentrations.
In an extensive experimental programme, the impact on tar formation of three fuel properties (ash content, moisture content and lignocellulose composition) and three operating conditions (gasification temperature, gas residence time and bed material/additives) was determined in lab-scale bubbling-fluidised-bed gasifiers. In general, these parameters were varied independently, i.e. while keeping the others constant. This was made possible by the trace heating on the wall of the lab-scale gasifiers. All experiments were conducted with feeding the air as primary air through the bottom plate of the bubbling fluidised bed only. Although it was realised that air staging, feeding part of the air as secondary air in the freeboard may have a large impact on tar formation, this was beyond the scope of the present study. In addition to the experimental work, attempts were made to model tar formation. Subsequently, this advanced knowledge base was applied to assess the practical and economic feasibility of identified, most promising primary measures. From the work, conducted by the five partners, the following overall conclusions can be drawn: • A proper design and representative operation of a lab-scale bubbling-fluidised-bed gasifier
certainly is not a simple, straightforward task. Especially a proper sizing and positioning of the biomass feeding system, and an adequate cooling of this system, appear to be essential. Part of the lab-scale experimental results was found to be of limited value, because of imperfections in this respect.
• The combination of accurate measurement of individual tar compounds and a tar
classification system with water solubility and condensation behaviour as the main criteria, has proven to be very effective for: − a concise presentation of the impact of process parameters on tar formation, − the elucidation of the underlying mechanisms, and − the evaluation of the impact of tar content and composition in the product gas on the
performance of downstream processes. • With respect to the parameter variations in the experimental programme, the following can
be concluded:
− Variation of the ash content in the bed, simulated by co-feeding high-ash char (approx. 40 wt% ash), has a negligible impact up to a maximum tested char/biomass ratio of 17 wt%.
− An increase in moisture content, simulated by mixing dry biomass off-line with water,
leads to a decrease in total tar content. Also all the individual tar classes show a clear decrease. However, the highly water-soluble heterocyclic compounds (class 2 tars)

ECN-C--04-014 11
could not be eliminated completely at the given gasification temperature of 800-825°C and approx. 4 s gas residence time, and the tar dewpoint only showed a slight decrease.
− The lignocellulose composition seems to have some effect on the total tar
concentration, while having no significant effect on the tar composition. Experiments with a fuel prepared from pure cellulose gave lower tar concentrations than experiments with willow and beech, which could be explained from differences between (hemi-)cellulose and lignin. However, despite the lower tar concentrations, the tar dewpoint remained nearly the same.
− Increasing the gasification temperature from 750 to 900°C at constant ER has a large
impact on tar formation, in particular on the tar composition. Class 2 tars are decomposed almost completely at 850°C and higher. On the other hand, the 2-3 ring PolyAromatic Hydrocarbon (PAH) compounds (class 4) and the 4-7 ring PAH compounds (class 5) concentration continuously increases with increasing temperature, leading to a continuous and substantial increase in tar dewpoint. The class 3 light aromatic compounds went through a maximum at 780-800°C, just as the total tar concentration.
− Realising that in an actual, industrial-scale gasifier, there is a coupling between the
gasification temperature and the equivalence ration ER, additional experiments were conducted with a simultaneous, coupled variation of the gasification temperature and ER (higher ER to get higher temperature). These experiments gave a strong decrease in total tar content. However, here again the tar dewpoint showed an increase due to an increase in heavy PAH compounds (class 5 tar), despite the diluting effect of a higher ER. A more detailed analysis, focussing on the heavy tar fraction in particular, revealed that the heavy PAH compounds are formed by dimerisation reactions of two PAH compounds or by cyclisation or polymerisation reactions of unsaturated C2-C4 hydrocarbons like acetylene and ethylene. These latter compounds are produced in the decomposition of aromatic as well as linear hydrocarbons.
− Increasing the gas residence time (in the freeboard of a BFB gasifier) was found to
have a similar, but much smaller, effect than increasing the gasification temperature. − In addition to (calcined) dolomite, highly attrition-resistant olivine has been identified,
and characterised in a (post-bed) fixed-bed reactor, as a prospective bed additive or bed material for tar reduction. Pre-treatment in air at 900°C improves the catalytic activity of olivine considerably. Up to 10 hours, the activity appears to increase with increasing pre-treatment time. The mechanism behind the catalytic activity of the non-porous olivine is not exactly understood yet, but it seems related to the presence of iron at the particle surface; pre-treatment leads to a segregation of iron at the outer surface. Further research is foreseen to elucidate the catalytic mechanisms and the in-bed performance of this relatively new bed additive / bed material.
• The reported results of lab-scale BFB gasification were found to be representative for CFB
gasification as well, provided that differences in gasification temperature and gas residence time (distribution) are taken into account. The report contains data to account for these differences.
• Some attempts were made to model tar formation applying two different modelling
approaches, viz. a black-box model and a continuous tar cracking model. Both models were not based on identified formation mechanisms and appeared to have some validity only for a limited set of (lab-scale) operating conditions.
12 ECN-C--04-014
• Based on the findings concerning the impact of fuel properties and gasifier operating conditions on tar content and composition, conclusions may be drawn concerning the possibilities of tar control by primary measures. To this purpose, a distinction should be made between firing the product gas in a coal-fired boiler (indirect co-firing) or in a stand-alone boiler on the one hand, and more advanced applications of the product gas on the other hand:
− In indirect co-firing, the product gas is used as a secondary fuel for the main (coal-fired)
boiler. Generally, the product gas temperature is kept as high as possible to prevent tar-induced problems. In that case, the gas will not be cooled to temperatures below the water dewpoint. Therefore, tars with a high water solubility (class 2) do not pose a problem. However, the gas cooling will require in most cases a mild control of the heavy PAH content in the product gas. Generally, primary measures in the form of a proper selection of fuel properties and gasifier design and/or operating conditions seem to offer enough possibilities to avoid severe tar-induced fouling problems. The same holds for the case, where the product gas is kept at high temperature and then fired in a stand-alone boiler.
− More advanced applications, such as firing the product gas in a gas engine or a gas
turbine, or using the product gas for the production of gaseous or liquid fuels, generally require a much cleaner product gas and often require the product gas to be cooled down to (near-)ambient temperature. In these cases, generally, primary measures will not suffice to meet the requirements concerning tar content and composition, and secondary tar removal will be necessary. However, primary measures may be applied then to optimise the tar composition for these secondary removal processes or for gas cooling and cleaning processes in general. For example, if water scrubbing is applied, primary measures may be used to fully decompose the highly water-soluble class 2 tars, leading to a considerable reduction in wastewater treatment cost.
• Of the different primary measures considered, increasing the gasification temperature can
be achieved with little to minor technical consequences. Increasing the gas residence time in the gasifier can be taken into consideration and implemented fairly easily in a new design, but will usually have extensive technical consequences in an existing installation. An increase in fuel moisture content and in-bed dolomite (or olivine) addition require extensive modifications to the installation or have to be taken into consideration in a new design. Furthermore, introduction of these latter measures will lead to additional constraints to downstream equipment and to input and by-product streams.
• The economic implications of increasing the gasification temperature and increasing the gas
residence time (in a new design) are expected to be limited. For increasing the fuel moisture content and dolomite (or olivine) addition, this is less obvious because both large positive and negative impact on the economics is foreseen and therefore implementation of these measures should be considered with care and only after more in depth analysis for each specific case.
• Given the clear potential of primary measures for reducing tar-related operational problems,
further R&D is recommended 1) to optimise the measures considered both individually and in combination, 2) to investigate the impact of air staging and 3) to further elucidate their potential in CFB gasification. Furthermore, given the important role of the class 1 tar fraction and its complex composition, it is recommended to put more effort in the determination of the composition of this tar class in future work.

ECN-C--04-014 13
1. INTRODUCTION
J.H.A. Kiel, ECN Biomass Gasification technologies are expected to play a key role in expanding the use of biomass as a major renewable energy source. The conversion of the solid feedstock to a gaseous fuel (producer gas or synthesis gas) significantly increases its potential. The gas can be used for applications such as: • Co-firing in coal- or natural gas-fired power plants, • Electricity generation in stand-alone conversion devices (gas engines, gas turbines, fuel
cells), • Production of gaseous/liquid fuels or chemicals. For all these applications, however, a more or less extensive cleaning of the product gas is required. And, although gasification of solid fuels is already an old technology and the specific volumes of gas to be treated are much smaller than after combustion, product gas cleaning appears to be a (and often the) major area of concern. This can be specified further in saying that, in particular, the reduction of the tar content (or the combination of tar and particulates) often is the major challenge. In many applications, the tar content in the product gas has to be controlled to prevent a range of possible problems in downstream equipment, such as: • Fouling and plugging due to tar condensation and soot formation, • Difficulties in handling tar-water mixtures, • Contamination of waste streams. As it has been quoted from Thomas Reed by Milne et al. [1]:
While a great deal of time and money has been spent on biomass gasification in the last two decades, there are very few truly commercial gasifiers, operating without government support or subsidies, day in, day out, generating useful gas from biomass. The typical project starts with new ideas, announcements at meetings, construction of the new gasifier. Then it is found that the gas contains 0.1-10% tars. The rest of the time and money is spent trying to solve this problem. Most of the gasifier projects then quietly disappear. …. Thus tars can be considered the Achilles heel of biomass gasification.
Basically, there are two main options for controlling the tar content in gasifier product gas, viz.: • by applying downstream cleaning processes (secondary measures) or, • by optimising biomass fuel properties and/or gasifier design and operating conditions
(primary measures). Generally, the latter should be considered first, because of their inherent potential of being more cost effective. Therefore, five organisations in the Netherlands teamed in a project, funded by the Agency for Research in Sustainable Energy (Samenwerkingsverband Duurzame Energie, abbreviated as SDE), to elucidate the possibilities of these primary measures. The five organisations are: ECN, Eindhoven University of Technology (TUE), KEMA, TNO-MEP and University of Twente (UT). The project has been focussed on air-blown, atmospheric-pressure fluidised-bed gasification, being one of the major gasification technologies for biomass. The main project results are described in this report.

14 ECN-C--04-014
1.1 Inventory study At the start of the project, an inventory study [2] was conducted to determine the international knowledge base on the potential of various primary measures and the underlying mechanisms. In general, this study revealed that considerable information was available already on tar formation and on the impact of various process parameters, but that major knowledge gaps still existed. The following limitations and major knowledge gaps were identified: • Many different tar definitions are applied, and even worse, in many publications tar is not
clearly defined at all. This leads to much confusion and makes it often difficult or even impossible to compare results obtained and reported by different researchers.
• The different definitions are often related to the application of different measurement techniques. Unlike for many other product gas contaminants, there are no well-developed and widely-accepted tar measurement techniques. Moreover, parallel measurements (applying different tar measurement methods at the same location) have revealed clearly, that efforts are needed to reduce confusion with respect to the characteristics of, and the large differences between various techniques [3].
• Many studies focus on tar formation, without paying attention to the impact of the tar concentration and composition on the performance of downstream processes. The grouping or classification of tar compounds is mostly based on the formation mechanisms and not on their impact in downstream processes (see, e.g., Evans and Milne [4]).
• In many studies, tar is considered as a lump-sum compound, while in downstream processes only specific tar compounds may be problematic and others may be beneficial.
• Only a limited number of studies have addressed the relation between tar concentration and/or composition and gasification conditions in a systematic way. The impact of biomass fuel properties on tar formation and downstream problems received even less attention.
1.2 Project scope Based on the outcome of the inventory study, the main objectives of the project were defined. In general, it was clear that much attention had to be given to the definition, measurement and classification of tar. Furthermore, it was decided to put the main focus in the project on a systematic and detailed determination of 1) the effect of various fuel properties and gasifier operating conditions on tar formation, 2) the underlying mechanisms and 3) the impact of the resulting tar concentration and composition on the performance of downstream processes. From this determination, a first assessment of the practical and economic feasibility of identified, most promising primary measures should then be possible. Thus, the main objectives have been: • To derive and develop proper methods for the measurement and classification of tar, based
on a clear definition and with a focus on the impact of tar in downstream processes. • To advance the knowledge base on tar formation in air-blown, atmospheric-pressure
fluidised-bed gasification, in particular with respect to: − the effect of various fuel properties and gasifier operating conditions, − the underlying mechanisms, and − the impact of the resulting tar concentration and composition on the performance of
downstream processes. • To conduct a first assessment of the practical and economic feasibility of identified, most
promising primary measures To meet these objectives, the following tasks were distinguished and distributed amongst the project partners: Task 1 - Literature survey (ECN, TNO-MEP, UT, TUE) Following the initial inventory study conducted by ECN and TNO-MEP, UT and TUE
performed a more detailed literature survey, focussing on tar formation, catalytic and
ECN-C--04-014 15
non-catalytic tar reduction and tar sampling. Furthermore, a firm knowledge base was built up for deriving a tar classification system primarily based on the impact of tar compounds in downstream processes [5].
Task 2 - Classification of tars and selection of model compounds (all partners) Following the initial work in Task 1, the classification system to be applied in the
project was defined and for each class typical/representative compounds were selected.
Task 3 - Selection (and development of) sampling and analysis procedures (ECN, TUE, UT, TNO-MEP)
Tar sampling and analysis methods to be used in the project were defined. In principle, existing methods were to be used, but some development work appeared to be necessary as well.
Task 4 - Formation of primary tars, development of models to describe tar formation and tar cracking (TNO-MEP)
Here, the focus was on the initial or primary tar compounds2 formed and their further fate in the gasifier.
Task 5 - Impact of fuel properties and operating conditions on tar formation (ECN, TNO-MEP, UT)
This constituted the major part of the project, with experimental work in three lab-scale (bubbling) fluidised-bed gasifiers at ECN, TNO-MEP and UT.
Task 6 - Mechanistic study into the impact of bed material on tar formation (TUE, ECN) This task, conducted mainly by TUE with some support from ECN, comprised both
separate bed material testing in a fixed-bed reactor as well as actual (bubbling) fluidised-bed gasifier tests with silica sand, dolomite and olivine as the main bed materials. Experiments were conducted with both actual gasifier product gas as well as with model tar compounds (e.g., naphthalene).
Task 7 - Practical and economic and practical feasibility of selected primary measures (KEMA)
First, most promising primary measures were selected based on the knowledge gained in the previous experimental tasks. Then, the practical and economic feasibility of these selected primary measures was assessed for three different gasification systems.
Task 8 - Fundamental study of tar formation parameters with model compounds (TUE) Finally, further fundamental work on the underlying mechanisms of tar formation was
planned in the framework of a PhD project at TUE. Although being part of the overall project plan, this work will be conducted after the end of the actual SDE project and be report later as part of the TUE PhD thesis.
The results of these eight tasks are summarised in this report, while more detailed information can be found in a series of underlying reports, conference papers and journal articles. These are listed in the reference list of this chapter [2, 5-22]. In the remaining part of this chapter, the results of the first 3 tasks, the work on primary tar formation (part of Task 4) and the set-up of Task 5 will be summarised. Then, in Chapter 2, initial experimental investigations into tar formation in bubbling fluidised-bed gasification are described, which have been conducted by the University of Twente. These experiments were used to gain experience in the operation of lab-scale (bubbling) fluidised-bed gasifiers and in tar measurement. Furthermore, first data were obtained on the impact of various gasifier operating conditions. In Chapter 3, efforts of TNO-MEP are described to model gas phase reactions with tar compounds in the freeboard of a bubbling fluidised-bed gasifier as well as experimental results of lab-scale bubbling fluidised-bed gasification tests.
2 Here, initial or primary tar means the tar compounds leaving the biomass particle. As discussed in Section 1.3, these tars mainly comprise primary and secondary tar compounds according to the classification of Evans and Milne [4].

16 ECN-C--04-014
Chapter 4 concerns a detailed experimental investigation of the impact of a broad range of biomass fuel properties and gasifier operating conditions, as conducted by ECN. It also contains a discussion on the relation between tar formation in a bubbling fluidised-bed gasifier and a circulating fluidised-bed gasifier. The study on the impact of bed material, as conducted by TUE, is reported in Chapter 5. In Chapter 6, the practical and economic feasibility assessment is described, while finally, the main conclusions of the overall project are summarised in Chapter 7.
1.3 Tar definition and tar formation in a fluidised-bed biomass gasifier The question “what are tars” is a controversial issue. Several definitions exist, see for example [1]. As it is discussed elsewhere [23], it is not very effective nor realistic to strive for a uniform definition of 'tar'. It appears better to accept that it is an ambiguous term, which is used in several contexts with at least slightly different meanings. Nevertheless, for biomass gasification, a practical and meaningful definition may be "all organic compounds with a molecular weight larger than benzene (excluding soot and char)". This definition has generally been applied in the current project. The composition of tar in the product gas is strongly dependent on the formation conditions. Evans and Milne proposed a tar classification system to characterise tar from different types of reactors used for the pyrolysis and gasification of biomass [4]. They identified four major tar product classes, viz.: • Primary tars • Secondary tars • Alkyl tertiary tars • Condensed tertiary tars. Primary tars are fragments originating directly from the cellulose, hemicellulose and lignin structures in the biomass. Secondary tars consist mainly of phenolics and olefins and are products from the conversion of primary tars. Alkyl tertiary products are characterised by methyl derivates of aromatics (e.g., styrene and xylene) and finally, the condensed tertiary tars are polyaromatic hydrocarbons (PAH) without substituents. The thermal conversion of biomass in a gasifier is accompanied by complex chemistry. In general, the conversion can be described with four different processes: drying, pyrolysis, combustion and gasification. In a fluidised-bed gasifier, these four conversion processes happen in the gasifier bed and are not clearly separated in distinct zones like in a fixed-bed gasifier. The products of all four processes will mix and interact; the gas phase reactions continuously changing the tar composition. In Task 4 of the project, it was intended by TNO-MEP to conduct an experimental investigation of the initial tar formation, i.e. excluding combustion and gasification reactions and further interaction between the tar compounds formed initially. This initial or primary tar formation was then to be modelled as well as the subsequent further conversion into secondary and tertiary tars. However, attempts to design a suitable experimental set-up failed. In the end, only models were derived for the gas phase reactions occurring in the freeboard of a bubbling fluidised-bed gasifier, based on experimental data on the tar composition just above the bubbling bed and at the end of the freeboard as described in Chapter 3. Instead of the planned work by TNO-MEP, ECN conducted a detailed literature study into the existing knowledge base on the mechanisms of tar formation in fluidised-bed gasifiers. This yielded the following generalised view. Upon the introduction of a biomass particle in the fluidised-bed, the particle will undergo rapid heating due to the interaction with the hot sand bed. This will initiate drying and pyrolysis. A structural de-polymerisation of the biomass building blocks cellulose, hemicellulose and lignin will occur and primary tars are being

ECN-C--04-014 17
formed. Further cracking and oligomerisation reactions of the primary tars inside the particle makes that the gases leaving the particle contain a mixture of mainly primary and secondary tars, together with permanent gases like CO, H2, H2O and CH4. Part of the biomass particle remains in the solid phase as char. Gases from outside hardly penetrate into the particle. Thus, the drying and pyrolysis process inside the particle is hardly influenced by the gas composition surrounding the particle. The composition of the pyrolysis products leaving the biomass particle is mainly dependent on particle heating rate, biomass composition, ash content and composition, moisture content and particle size. Outside the particle, the pyrolysis products are partly combusted with oxygen. After combustion, the remaining char may be further gasified, and several gas phase reactions, like water gas shift (WGS), reforming, polymerisation and cracking reactions, change the gas composition continuously inside the gasifier. For a bubbling fluidised-bed, the processes of drying, pyrolysis, combustion and gas phase reactions are shown schematically in Figure 1.1.
PRODUCTGAS
Drying/Pyroysis Oxidation Gas
reactions
FLUIDISED BED Air
BIOMASS
FREEBOARD
gasprimary tarssecondary tarschar
Figure 1.1 Schematic representation of the four processes of drying, pyrolysis, oxidation and gas (phase) reactions in a bubbling-fluidised-bed biomass gasification process.
The location of the steps is given for a bubbling fluidised-bed gasifier with a dense bed of sand and an empty freeboard. Air is used as the gasification as well as fluidisation medium. Actually, the gas (phase) reactions occur in the sand bed as well, but the gas residence time in the sand bed is only limited compared to in the freeboard.
The gas phase reactions lead to a decrease in the concentration of primary and secondary tar compounds with increasing residence time. With the decomposition of these tars, other (secondary and tertiary) tar compounds are formed as well as lighter compounds, like CH4, CO, H2, CH4 and unsaturated C2-C4 hydrocarbons. Although the total tar concentration in the product gas decreases with increasing gasifier temperature and residence time, the tar composition changes from mainly light tar compounds to a mixture of heavy and light tars. The heavy tar compounds are mainly polyaromatic hydrocarbon (PAH) compounds that can be produced by dimerisation reactions of two PAH compounds or by cyclisation or polymerisation reactions of unsaturated C2-C4 hydrocarbons like acetylene. At a temperature of 700-850°C, the PAH growth is most likely due to dimerisation of two PAH compounds in a radical-radical or radical-molecule reaction. Above a temperature of 850-900°C, the PAH growth can be a result of both dimerisation of two PAH compounds or the polymerisation of unsaturated C2-C4 hydrocarbons like acetylene and ethylene. The influence of gasification temperature on tar conversion is illustrated in Figure 1.2. In this figure, derived from various data reported in literature [25-33], conversion-temperature diagrams for primary tar mixtures and secondary and tertiary tar compounds are given. Updraft tar and pyrolysis oil can be considered representative for the conversion of primary tars. The conversion of updraft tar and pyrolysis oil starts at 500°C and is completed at 700°C. Phenol and cresol are secondary tar compounds that are produced from primary tars. These heterocyclic

18 ECN-C--04-014
tars are converted between a temperature of 750°C and 850°C. The tertiary tar compounds naphthalene, phenanthrene, and anthracene are thermally stable and are converted at relatively high temperature between 850-1100°C. Benzene is a thermally stable compound and is only converted between 1000°C and 1300°C at reasonable residence time.
0.0
0.2
0.4
0.6
0.8
1.0
500 700 900 1100 1300Temperature [°C]
Con
vers
ion
Boroson et al. - Pyrolysis oil from w ood Kaupp - Tar from úpdraft'gasifierBredael et al. - 2-Naphthol Bredael et al. - 1-NaphtholBredael et al. - Indene Cypres and Lejeune - m-CresolCypres and Lejeune - Phenol Cypres and Bettens - PhenolCypres and Bettens - Phenanthrene Bruinsma et al. - AnthraceneBruinsma et al. - Naphthalene Bruinsma et al. - BenzeneKabe et al. - Naphthalene Jess - NaphthaleneJess - Benzene
Figure 1.2 Conversion-temperature diagram of important tar compounds.
The diagram has been obtained from literature data [25-33] by translating these data to a fixed residence time of 2 s.
In general, the gas phase reactions are influenced by the gas composition, gasification temperature, equivalence ratio, type of bed material and the gas residence time inside the gasifier. Also, remaining char or ash can influence/catalyse the gas phase reactions. The tar concentration and composition in the product gas at the outlet of a fluidised-bed gasifier is the result of the drying/pyrolysis and the consecutive combustion and gas phase reactions. Therefore, all parameters that influence one of these processes logically do influence the final tar concentration and composition at the outlet of the gasifier. Beside biomass composition and gasifier operating conditions, also the type of fluidised-bed gasifier may influence the tar content and composition in the product gas. In a bubbling-fluidised-bed (BFB) gasifier, generally, the biomass particles stay in the bed and thus the drying and pyrolysis process as well as the oxidation mainly take place there. Gas escaping the bed remains several seconds in the freeboard before exiting the gasifier, allowing gas phase reactions to change the tar concentration and composition. In a circulating-fluidised-bed (CFB) gasifier the bed is circulating. Generally, the gasifier has been designed in such a way that,

ECN-C--04-014 19
theoretically, the large biomass particles remain in the bottom section of the gasifier, in order to avoid the presence of pyrolysis products in the product gas. In practice, however, part of the biomass particles may be carried over the top. Therefore, the pyrolysis process might practically proceed over the total height of the gasifier. Thus, the tar composition in the product gas of a CFB gasifier might be different from the composition in a BFB gasifier, even when the gas residence time and gasification temperature are similar.
1.4 Tar classification and measurement From the start of the project, it has been realised clearly, that the tar issue should be considered from the perspective of the impact of tar compounds in gasifier product gas on the performance of downstream equipment. Furthermore, it was realised that this impact on the performance of downstream processes mostly is not related to the lump-sum tar content (expressed, e.g., in g/mn
3 “tar”), but that problems are merely caused by specific tar fractions or tar compounds. Therefore, much emphasis has been given to the determination of the tar composition by measuring individual tar compounds. However, given the large amount of tar compounds in the product gas, the concise presentation of experimental results and obtaining mechanistic insight would highly benefit from a grouping or classification of these tar compounds. Clearly, this tar classification should then be based on the behaviour of the tar compounds in downstream processes. In this respect, the extensive literature survey by UT and TUE [5] revealed two major properties of tar compounds that are crucial, viz., condensation behaviour and water solubility. Condensation behaviour is important, e.g., with respect to fouling in gas cooling or gas cleaning equipment. On the other hand, oxygenated or heterocyclic tar compounds containing O and/or N atoms like phenol are highly water soluble due to their high polarity. They may lead to hazardous wastewater, resulting in high disposal/processing cost for low-temperature gas cleaning systems. Based on these considerations, the tar classification system containing five different tar classes was derived, as presented in Table 1.1. Subsequently, this classification system has been applied throughout the project.
Table 1.1 The applied tar classification system.
Description
Class 1 GC-undetectable tars. This class includes the heaviest tars that condense at high temperature even at very low concentrations.
Class 2 Heterocyclic compounds (e.g., phenol, pyridine, cresol). These are compounds that generally exhibit high water solubility, due to their polarity.
Class 3 Aromatic compounds (1-ring; e.g., xylene, styrene, toluene). Light hydrocarbons that are not important in condensation and water solubility issues.
Class 4 Light polyaromatic hydrocarbons (2-3 ring PAH compounds; e.g., naphtalene, fluorene, phenanthrene). These components condense at relatively high concentrations and intermediate temperatures.
Class 5 Heavy polyaromatic hydrocarbons (4-7 ring PAH compounds; e.g., fluoranthene, pyrene, up to coronene). These compounds condense at relatively high temperature at low concentrations.
GC-undetectable tars = tar compounds that cannot be detected with a GC-FID or GC-MS, equipped with a non-polar capillary column like the one prescribed in the Guideline (see below).

20 ECN-C--04-014
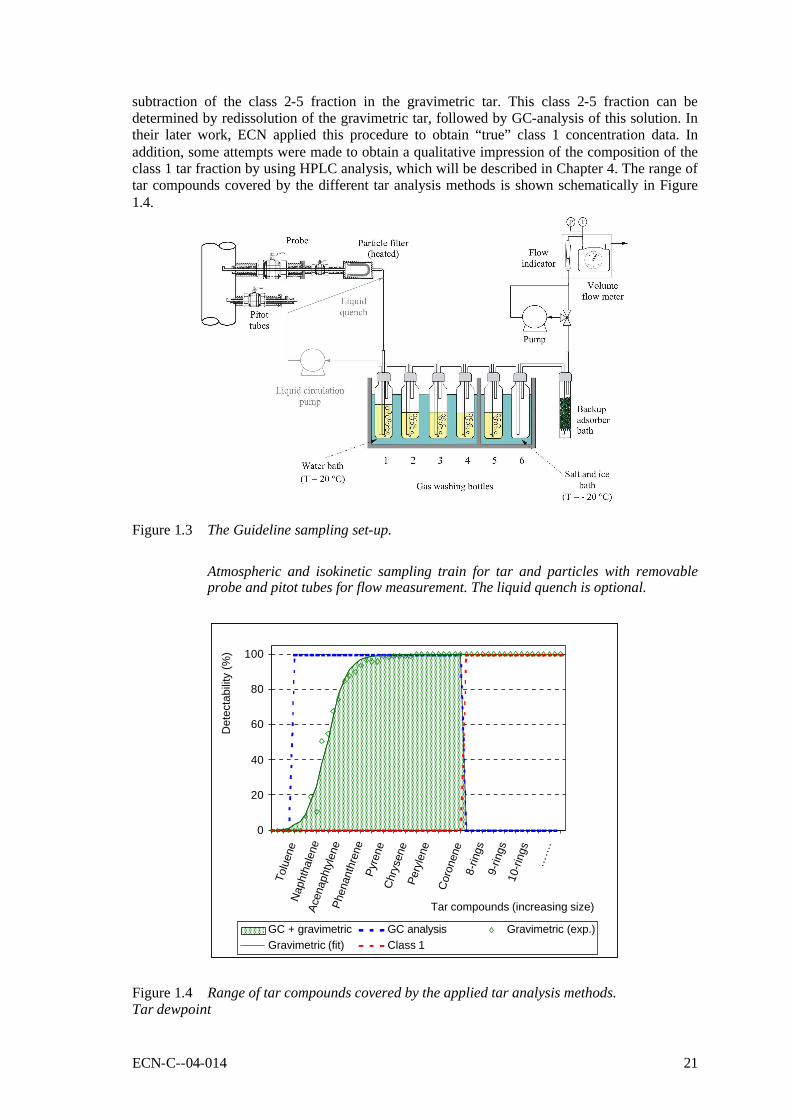
Tar measurement For the tar measurement, the project initially relied on three methods, viz.: 1. on-line GC-analysis, 2. Solid Phase Absorption (SPA) method, and 3. filter condensation method. On-line GC-FID analysis was applied by UT, ECN and TNO-MEP to determine the BTX-compounds, i.e. benzene, toluene and xylenes. TUE applied on-line GC-MS to determine tar compounds in a broad molecular weight range, using a non-polar capillary column and focussing on the analysis of typical tar compounds produced in fluidised-bed gasification (i.e., mainly PAH compounds and relatively low percentages of heterocyclic compounds). The SPA method has been developed by KTH in Sweden [24] to measure tar compounds ranging from benzene up to coronene. According to this method, tars are sampled by collection on a column with a small amount of amino-phase sorbent. For each sample, 100 ml of gas is withdrawn from a sampling line using a syringe through a septum. The sampling line is kept at 350°C to prevent/minimise tar condensation. Subsequently, the column is extracted using dichloromethane (DCM) and isopropanol, and the solution is then analysed by a gas chromatograph (GC). By the partners in the project, a non-polar capillary column was applied, focussing on the analysis of, mostly non-polar, fluidised-bed tars. The method was applied by UT, ECN, TNO-MEP and TUE as a fast, simple and reliable method to measure class 2-5 tars, i.e. from xylenes up to tar compounds with a molecular weight of 300 kg/kmol (up to coronene). Although this SPA method is quite versatile, it does not allow to determine the very heavy, class 1 tar fraction. To determine this fraction, the filter condensation method was applied initially. According to this method, a dedusted gas sample was passed through an aerosol filter (ECN) or a SiC filter (UT), which was kept at a temperature level of 125 and 110°C respectively. The collected tar sample on the filter was weighed and then dissolved in DCM to determine the content of class 2-4 tars by GC. The class 2-4 fraction was then subtracted from the total weight to obtain the class 1 fraction. During the project, it became more and more apparent, that both the mechanistic understanding of tar formation and the assessment of the potential of different primary measures to tar problems would benefit substantially from a more precise determination of the class 1 tar fraction. Since there is no absolute guarantee that with the filter condensation method all class 1 tars are captured, it was decided in the course of the project to apply an extended version of the Guideline method instead. This Guideline method resulted from a broad international effort co-ordinated by ECN to arrive at a widely-accepted, standard tar measurement method. The Guideline method allows for the sampling and analysis of tars (and particles) in biomass gasification gases. The tar and particle sampling system consists of a heated probe, a heated particle filter, a condenser and a series of impinger bottles containing isopropanol to dissolve the tars. The solvent containing bottles are placed in a warm (bottles 1-4) and a cold bath (bottles 5 and 6) so that the sampled gas is cooled in two steps, first to 20°C and finally to -20°C. The sampling train is shown schematically in Figure 1.3. The post-sampling involves Soxhlet extraction of the tars on the particle filter and the collection of all tars in one bulk solution. Finally, from analysing this bulk solution, two types of tar concentrations can be obtained, viz. the concentration of gravimetric tar and concentrations of individual organic compounds. Gravimetric tar is defined as the evaporation residue at given and standard conditions (temperature, pressure, duration). Concentrations of individual organic compounds are determined by GC-analysis of the bulk solution. The full version of the Guideline as well as a description of the further development into a CEN standard can be found on the dedicated web-site www.tarweb.net. The Guideline method itself does not allow the determination of the class 1 tar fraction yet. However, the class 1 tar fraction can be derived from the gravimetric tar concentration by
ECN-C--04-014 21
subtraction of the class 2-5 fraction in the gravimetric tar. This class 2-5 fraction can be determined by redissolution of the gravimetric tar, followed by GC-analysis of this solution. In their later work, ECN applied this procedure to obtain “true” class 1 concentration data. In addition, some attempts were made to obtain a qualitative impression of the composition of the class 1 tar fraction by using HPLC analysis, which will be described in Chapter 4. The range of tar compounds covered by the different tar analysis methods is shown schematically in Figure 1.4.
Figure 1.3 The Guideline sampling set-up.
Atmospheric and isokinetic sampling train for tar and particles with removable probe and pitot tubes for flow measurement. The liquid quench is optional.
0
20
40
60
80
100
Tolu
ene
Nap
htha
lene
Acen
apht
ylen
ePh
enan
thre
nePy
rene
Chr
ysen
ePe
ryle
neC
oron
ene
8-rin
gs9-
rings
10-ri
ngs
……
.
Tar compounds (increasing size)
Det
ecta
bilit
y (%
)
GC + gravimetric GC analysis Gravimetric (exp.)Gravimetric (fit) Class 1
Figure 1.4 Range of tar compounds covered by the applied tar analysis methods. Tar dewpoint

22 ECN-C--04-014
An important thermodynamic property for condensation is the tar dewpoint. The tar dewpoint is the temperature at which the real total partial pressure of tar equals the saturation pressure of tar. ECN developed a dewpoint model for the calculation of tar dewpoints from a given tar composition [34]. The model includes vapour/liquid equilibrium data for the tar compounds in the product gas from a downdraft or fluidised-bed gasifier. The calculation is based on ideal gas behaviour. Raoult’s law is applied for the calculation of a mixture of hydrocarbons, using the vapour pressure data of individual compounds. The tar dewpoint is calculated from the tar composition measured with the SPA or Guideline method, i.e.. tars with a molecular size between toluene and coronene. Heavier tars are not considered, but they may be expected to have a relatively high dewpoint at low concentration. Therefore, generally, the calculated tar dewpoint should be considered as an underestimate, the actual dewpoint probably being (somewhat) higher. In Figure 1.5, the dewpoint for the tar classes 2-5 is given at several concentrations. Even at a low class 5 tar concentration of circa 0.1 mg/mn
3, the corresponding dewpoint (120°C) exceeds the dewpoint valid for high concentrations of class 2, 3, and class 4 tars (e.g. 1000 mg/mn
3) at atmospheric pressure. The class 3 tar compounds do not condense at concentrations as high as 10,000 mg/mn
3.
-150
-100
-50
0
50
100
150
200
250
300
0.1 1 10 100 1000 10000
Tar-class concentration [mg/mn3]
Tem
pera
ture
[°C
]
Class 2 Class 3 Class 4 Class 5
Figure 1.5 Tar dewpoint at atmospheric pressure vs. tar concentration for different tar classes.
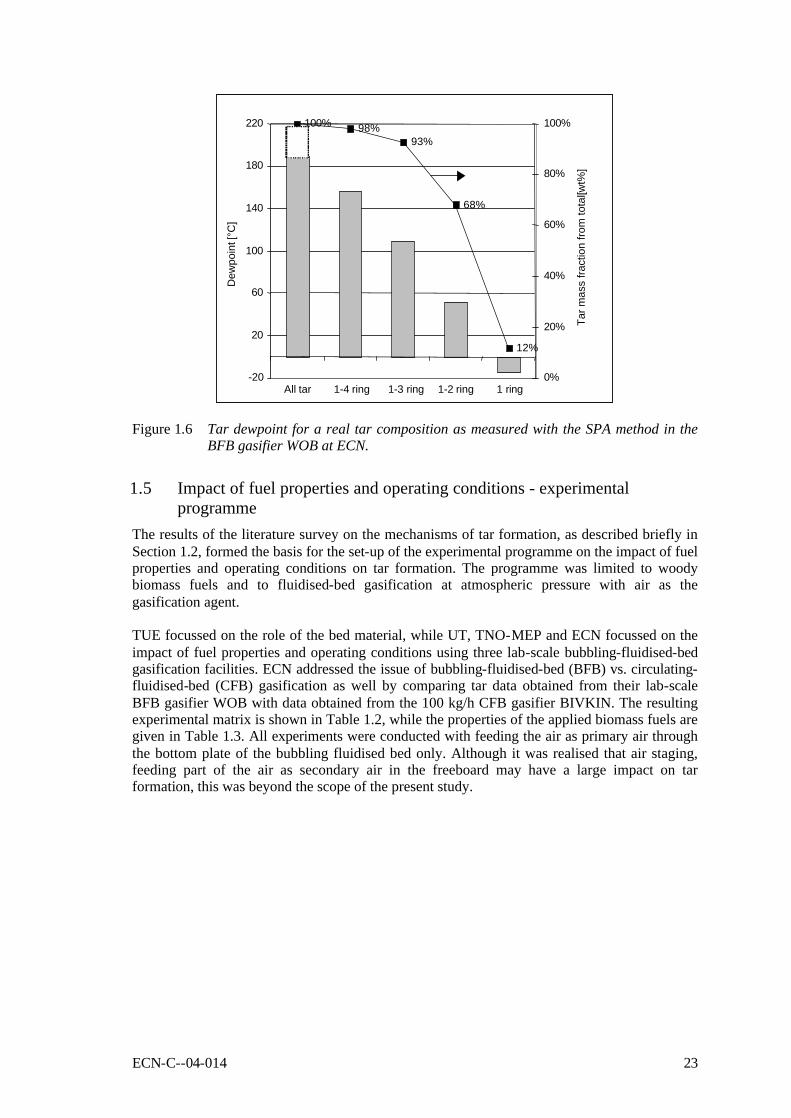
As an example, Figure 1.6 gives the tar dewpoint calculated from a real tar composition, measured with the SPA method in the product gas from the BFB gasifier WOB at ECN. The tar dewpoint decreases from ca 190°C to 150°C when tars with more than 4 aromatic rings are removed from the tar mixture, which corresponds with the removal of 2 wt% of the total tar amount. Further removal of tars with four aromatic rings lead to a dewpoint of 100°C. At this point 93 wt% of the total amount of tar is still left. From the tar mass fraction curve and the dewpoint curve in Figure 1.6, it can be concluded that the dewpoint is dominated by the molecular size and not by the tar concentration.
ECN-C--04-014 23
100% 98%93%
68%
12%
-20
20
60
100
140
180
220
All tar 1-4 ring 1-3 ring 1-2 ring 1 ring
Dew
poin
t [°C
]
0%
20%
40%
60%
80%
100%
Tar
mas
s fra
ctio
n fro
m to
tal [w
t%]
Figure 1.6 Tar dewpoint for a real tar composition as measured with the SPA method in the BFB gasifier WOB at ECN.
1.5 Impact of fuel properties and operating conditions - experimental programme
The results of the literature survey on the mechanisms of tar formation, as described briefly in Section 1.2, formed the basis for the set-up of the experimental programme on the impact of fuel properties and operating conditions on tar formation. The programme was limited to woody biomass fuels and to fluidised-bed gasification at atmospheric pressure with air as the gasification agent. TUE focussed on the role of the bed material, while UT, TNO-MEP and ECN focussed on the impact of fuel properties and operating conditions using three lab-scale bubbling-fluidised-bed gasification facilities. ECN addressed the issue of bubbling-fluidised-bed (BFB) vs. circulating-fluidised-bed (CFB) gasification as well by comparing tar data obtained from their lab-scale BFB gasifier WOB with data obtained from the 100 kg/h CFB gasifier BIVKIN. The resulting experimental matrix is shown in Table 1.2, while the properties of the applied biomass fuels are given in Table 1.3. All experiments were conducted with feeding the air as primary air through the bottom plate of the bubbling fluidised bed only. Although it was realised that air staging, feeding part of the air as secondary air in the freeboard may have a large impact on tar formation, this was beyond the scope of the present study.

24 ECN-C--04-014
Table 1.2 Experimental matrix. TNO-MEP ECN TUE UT
Fuel parameters Particle size (mm) <4, 4-6, 6-8
Moisture content (wt%) 10 and 50 10, 25, 45
Ash content (char/biomass feed ratio, wt%) 0, 3, 5, 17
Fuel type beech beech, willow,
cellulose (2) beech
Lignocellulose composition (wt% lignin) beech (24) willow (18) cellulose (0)
Operating conditions
Temperature (oC) (1) 750 - 900 750 - 950 750 - 900 750 - 950
Air-to-fuel ratio (Equivalence Ratio ER) (1) 0.20 - 0.40
Gas residence time (s)
fluidisation velocity: 3, 4 and 5*Umf
(3)
1 - 5 0.5 - 2.5
Bed material or bed additives silica sand, dolomite,
olivine
(1) In most experiments, gasifier temperature and ER were varied independently, which was made possible by the trace heating of the lab-scale gasifiers. However, knowing that these two parameters are coupled in full scale gasifiers, ECN conducted experiments with a coupled variation as well.
(2) Until now, TUE has only obtained results for bed materials tested in a separate, fixed-bed reactor. In these tests, both actual gasifier product gas and gas mixtures with model tar compounds (naphthalene) were applied.
(3) Umf = minimum fluidisation velocity. The willow was crushed and sieved to bring the fuel on specification with particle dimensions ranging from 0.7-2.0 mm. Beech chips were bought from J. Rettenmaier & Söhne (Räuchergold HBK 750/2000 and Räuchergold HBK 1500/3000) and could be used without further preparation. The cellulose was prepared from a super-refined (acid-washed) powder with an alfa-cellulose content of >95%, as supplied by Merck. Other properties of this cellulose powder are: maximum fibre length 20-150 µm, ether extract 0.25 %, 4 ppmw iron, 1 ppmw copper. In order to obtain a cellulose fuel with comparable dimensions as beech and willow, the cellulose powder was granulated with silica sand (approx. 14.7 wt%), identical to the bed material. The experimental work, being the main part of the project, is described in more detail in Chapters 2 (UT), 3 (TNO-MEP), 4 (ECN) and 5 (TUE).
ECN-C--04-014 25
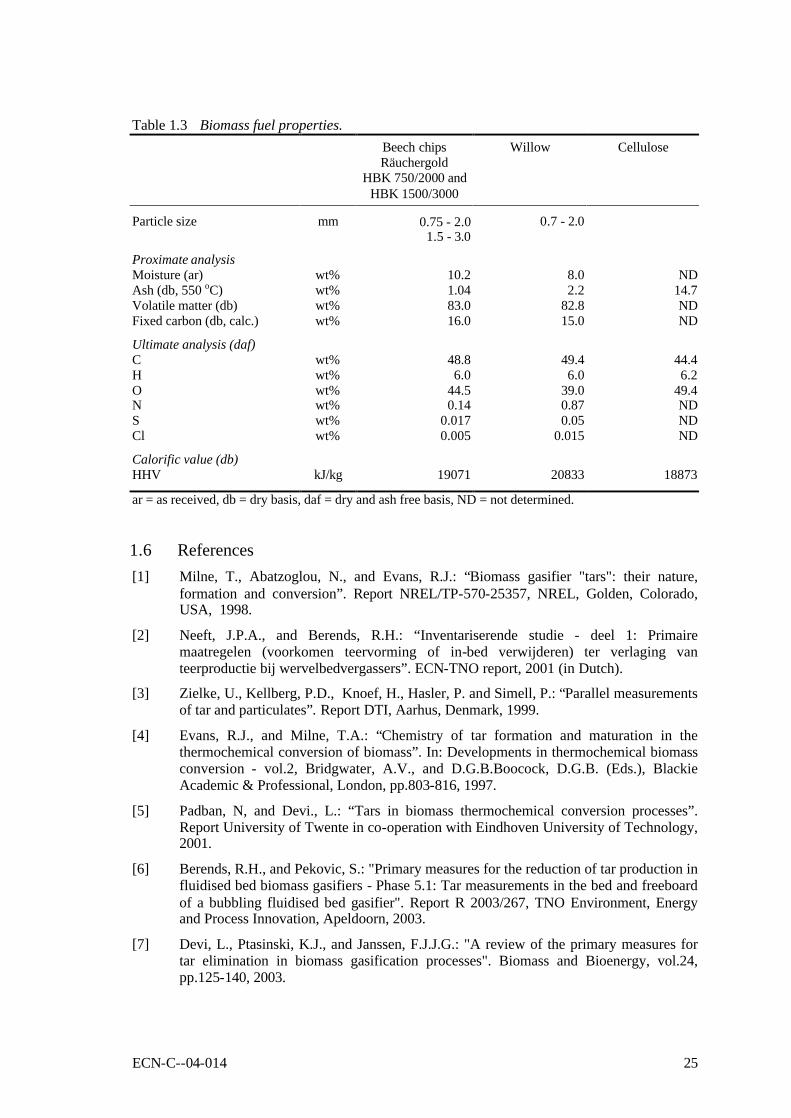
Table 1.3 Biomass fuel properties. Beech chips
Räuchergold HBK 750/2000 and
HBK 1500/3000
Willow Cellulose
Particle size mm 0.75 - 2.0 1.5 - 3.0
0.7 - 2.0
Proximate analysis Moisture (ar) Ash (db, 550 oC) Volatile matter (db) Fixed carbon (db, calc.)
wt% wt% wt% wt%
10.2 1.04 83.0 16.0
8.0 2.2
82.8 15.0
ND
14.7 ND ND
Ultimate analysis (daf) C H O N S Cl
wt% wt% wt% wt% wt% wt%
48.8 6.0
44.5 0.14
0.017 0.005
49.4 6.0
39.0 0.87 0.05
0.015
44.4 6.2
49.4 ND ND ND
Calorific value (db) HHV
kJ/kg
19071
20833
18873
ar = as received, db = dry basis, daf = dry and ash free basis, ND = not determined.
1.6 References [1] Milne, T., Abatzoglou, N., and Evans, R.J.: “Biomass gasifier "tars": their nature,
formation and conversion”. Report NREL/TP-570-25357, NREL, Golden, Colorado, USA, 1998.
[2] Neeft, J.P.A., and Berends, R.H.: “Inventariserende studie - deel 1: Primaire maatregelen (voorkomen teervorming of in-bed verwijderen) ter verlaging van teerproductie bij wervelbedvergassers”. ECN-TNO report, 2001 (in Dutch).
[3] Zielke, U., Kellberg, P.D., Knoef, H., Hasler, P. and Simell, P.: “Parallel measurements of tar and particulates”. Report DTI, Aarhus, Denmark, 1999.
[4] Evans, R.J., and Milne, T.A.: “Chemistry of tar formation and maturation in the thermochemical conversion of biomass”. In: Developments in thermochemical biomass conversion - vol.2, Bridgwater, A.V., and D.G.B.Boocock, D.G.B. (Eds.), Blackie Academic & Professional, London, pp.803-816, 1997.
[5] Padban, N, and Devi., L.: “Tars in biomass thermochemical conversion processes”. Report University of Twente in co-operation with Eindhoven University of Technology, 2001.
[6] Berends, R.H., and Pekovic, S.: "Primary measures for the reduction of tar production in fluidised bed biomass gasifiers - Phase 5.1: Tar measurements in the bed and freeboard of a bubbling fluidised bed gasifier". Report R 2003/267, TNO Environment, Energy and Process Innovation, Apeldoorn, 2003.
[7] Devi, L., Ptasinski, K.J., and Janssen, F.J.J.G.: "A review of the primary measures for tar elimination in biomass gasification processes". Biomass and Bioenergy, vol.24, pp.125-140, 2003.

26 ECN-C--04-014
[8] Devi, L., Smits, B.A., Ptasinski, K.J., Janssen, F.J.J.G., Bergman, P.C.A., and Kiel, J.H.A.: "Catalytic decomposition of tars from biomass gasifier". Proc. Int. Nordic Bioenergy Conf. and Exhibition, ISBN 952-5135-26-8, pp.418-420, 2003.
[9] Devi, L., Pol, W.L.C. van, Ptasinski, K.J., and Janssen, F.J.J.G.: "Catalytic decomposition of biomass tars; olivine as a prospective catalyst for biomass gasification processes". Proceedings of Topical Conference on Envisioning Biorefineries: Chemicals and Materials from Renewable Feedstocks. AIChE annual meeting, San Francisco, USA, pp 26-29, 2003.
[10] Devi, L., Ptasinski, K.J., Janssen, F.J.J.G., Paasen, S.V.B. van, Bergman, P.C.A., and Kiel, J.H.A.: "Catalytic decomposition of biomass tars: use of dolomite and untreated olivine". Paper submitted to Renewable Energy, 2003.
[11] Devi, L. Ptasinski, K.J. and Janssen F.J.J.G.: “Olivine as a tar temoval catalyst for biomass gasifiers”. Abstract submitted to 2nd World Conf. and Technol. Exhibition on Biomass for Energy, Industry and Climate Protection, Rome, Italy, 10-14 May, 2004.
[12] Meijer, R.: Primary measures for tar reduction in fluidised bed biomass gasifiers. Task 7 - Economic and practical feasibility, recommendations. Report 50071366-KPS/TPE 03-1115, KEMA, Arnhem, 2003.
[13] Paasen, S.V.B. van, Bergman, P.C.A., Neeft, J.P.A., and Kiel, J.H.A.: “Primary measures for tar reduction – reduce the problem at the source”. Proc. 12th European Conference and Technology Exhibition on Biomass for Energy, Industry and Climate Protection, Amsterdam, 17-21 June 2002, published by ETA-Florence and WIP-Munich, pp.597-599, 2002.
[14] Paasen, S.V.B. van, and Kiel, J.H.A.: “Tar formation in fluidised-bed gasification - impact of gasifier operating parameters”. Abstract submitted to 2nd World Conf. and Technol. Exhibition on Biomass for Energy, Industry and Climate Protection, Rome, Italy, 10-14 May, 2004.
[15] Paasen, S.V.B. van, and Kiel, J.H.A.: “Tar formation in fluidised-bed gasification - impact of fuel properties”. Abstract submitted to Int. Conf. on Science in Thermal and Chemical Biomass Conversion, Vancouver, Canada, 30 August - 2 September, 2004.
[16] Paasen, S.V.B. van, and Kiel, J.H.A.: “Tar formation in a fluidised-bed gasifier - impact of fuel properties and operating conditions”. Report ECN-C--04-013, ECN, Petten, 2004.
[17] Padban, N., and Bramer, E.A.: "Behavior of different tar classes during fluidized bed air gasification of biomass - Identification, characterization and quantification". Report Department of Thermal Engineering, University of Twente, 2003.
[18] Pol, W.L.C. van: "Decomposition of naphthalene as a model biomass tar compound using olivine". Graduation thesis Eindhoven University of Technology, May 2003.
[19] Riessen, G.J. van: "Reactions in continuous mixtures: modelling tar behaviour during biomass gasification". Report R 2001/130, TNO Environment, Energy and Process Innovation, Apeldoorn, 2001.
[20] Smits, B.A.: "Catalytic decomposition of tar present in biomass gasification gas". Graduation thesis Eindhoven University of Technology, 2002.
[21] Temmink, H.M.G.: "Primary measures for tar reduction / subproject modelling". Report R 2003/269, TNO Environment, Energy and Process Innovation, Apeldoorn, 2003.
[22] Wieland, A.M.H.: "Decomposition of tar compounds in a fixed bed reactor: Design of an experimental setup". Graduation thesis Eindhoven University of Technology, 2001.
[23] Neeft, J.P.A., et al.: “Tar guideline - a standard method for measurement of tars and particles in biomass producer gases”. Proc. 12th European Conference and Technology

ECN-C--04-014 27
Exhibition on Biomass for Energy, Industry and Climate Protection, Amsterdam, 17-21 June 2002, published by ETA-Florence and WIP-Munich, pp.469-472, 2002.
[24] Brage, C., Yu, Q., Chen, G., and Sjöström, K.: “Use of amino-phase adsorbent for biomass tar sampling and separation”. Fuel, vol.76, pp.137-142, 1997.
[25] Cypres, R., and Lejeune, C.: “Craque thermique de m-crésol, du bènzene, du toluène et du phénol entre 650 et 850°C”. Ann. Mines Belgique, vol.7-8, pp.1091-1109, 1965.
[26] Cypres, R., and Bettens, B.: “Mecanismes de fragmentation pyrolytique du phenol et des cresols”. Tetrahedon, vol.30, pp.1253-1260, 1974.
[27] Cypres, R., and Bettens, B.: “Study of the cracking mechanisms of phenanthrene and perhydrophenanthrene labelled in specific positions by 14C and 3H”. Fuel, vol.65(4), pp.507-514, 1986.
[28] Jess, A.: “Mechanisms and kinetics of thermal reactions of aromatic hydrocarbons from pyrolysis of solid fuels”. Fuel, vol.75(12), pp.1441-1448, 1996.
[29] Boroson, M.L., Howard, J.B., Longwell, J.P., and Peters, W.A.: Product yields and kinetics from the vapour phase cracking of wood pyrolysis tars. AIChEJ, vol.35(1), pp.120-128, 1989.
[30] Kaupp, A.: “Gasification of rice hulls - theory and praxis”. Vieweg, Braunsweig, Germany, 303 p., 1984.
[31] Bredael, P., Braekman-Danheux, C., and Vinh, T.H.: “Pyrolysis of naphthalenic detivatives 3. Pyrolysis of naphthols, hydronaphthols and perhydronaphthols”. Fuel, vol.62(10), pp.1193-1198, 1983.
[32] Bruinsma, O.S.L., and Moulijn, J.A.: “The pyrolytic formation of polycyclic aromatic hydrocarbons from benzene, toluene, ethylbenzene, styrene, phenylacetylene and n-decane in relation to fossil fuels utilisation”. Fuel Process. Technol., vol.18(3), pp.213-236, 1988.
[33] Kabe, T., Godo, M., Ishihara, A., Qian, W.H., Otsuki, S., and Mukai, K.: “Estimation of the behaviour of hydrogen in naphthalene in pyrolysis of coal tar using tritium tracer methods”. Fuel, vol.77(8), pp.815-820, 1998.
[34] Further information on the dewpoint calculation method, developed by ECN, can be obtained from the dedicated web-site www.thersites.nl.

28 ECN-C--04-014

ECN-C--04-014 29
2. INITIAL EXPERIMENTAL INVESTIGATION INTO TAR FORMATION IN FLUIDISED-BED BIOMASS GASIFICATION
N. Padban and E.A. Bramer, University of Twente (UT)
2.1 Introduction The main objective of the initial experimental work at the University of Twente was to study the formation of the different tar classes distinguished in the tar classification system during atmospheric-pressure, air-blown bubbling-fluidised-bed gasification of (woody) biomass. In particular, the influence of the three operating conditions gasification temperature, air to biomass or equivalence ratio (ER) and gas residence time in the reactor was to be determined.
2.2 Experimental
2.2.1 Gasifier Gasification experiments were carried out in a 10 kWth biomass gasifier at the Laboratory of Thermal Engineering, as shown schematically in Figure 2.1. This gasifier is a bubbling-fluidised-bed gasifier with an inner diameter of 0.12 m and a height of 1.2 m. The gasifier is surrounded by two electrically heated furnaces. Hence, the bed and freeboard temperature can be controlled separately between 700 and 950°C, independent of the ER. The fuel is continuously introduced into the gasifier by means of a screw feeder at a level of 30 cm above the gasifier bottom. The screw feeder is equipped with a cooling mantle for air or water. Air, which is used as both fluidisation and gasification medium, is introduced through a porous distribution nozzle located at the bottom of the gasifier. With this porous nozzle a uniform distribution over the whole bed area is achieved. This was checked by visual observation in cold mode.
Gas
ifier
Air inlet
Cooledscrew feeder
Flare
Bed section
Gas sample locations
Electricaloven
freeboard
Biomass
Electricaloven
bed section
Gas
ifier
Air inlet
Cooledscrew feeder
Flare
Bed section
Gas sample locations
Electricaloven
freeboard
Biomass
Electricaloven
bed section
Figure 2.1 10 kWth UT-gasifier.

30 ECN-C--04-014
2.2.2 Experimental conditions In the UT-gasifier, a total number of eight gasification experiments were conducted, with variation of the ER and the gasification temperature (Table 2.1).
Table 2.1 UT gasification experiments. Exp. nr. Temp bottom (°C) Temp top (°C) ER
1 760 850 0.4 2 760 870 0.4 3 790 900 0.4 4 830 950 0.4 5 880 900 0.3 6 930 950 0.3 7 870 900 0.2 8 930 940 0.2
During these experiments, the air flow to the reactor was kept constant at a flow rate of 2 mn
3/h and the changes in ER were made by varying the biomass flow rate to the gasifier in accordance with a previously made calibration of the feeding screw. The gasification temperature was adjusted by variations in the power to the furnaces surrounding the reactor. However, some difficulties were encountered, especially concerning the temperature levels in the lower part of the reactor. Initially, it was not possible to increase the temperature at the bottom to more than 750°C. The problem was solved by installing new and more powerful heating elements. However, these heating elements normally lasted only 1-2 experiments. Consequently, it was not possible to have a uniform axial temperature profile in the reactor during all experiments as it was planned (see Table 2.1 for the resulting temperature differences). Silica sand with a mean particle size of about 200 µm was used as the bed material. The dynamic bed height was approx. 30 cm, i.e. the biomass was fed in the splash zone of the bed. Proper bubbling fluidisation was observed at the given air flow rate of 2 mn
3/h (actual gas velocity •0.2 m/s, 8-10*Umf). The biomass used for the experiments was beech chips with a particle size between 1.5 and 3 mm (J. Rettenmaier & Sohne, Räuchergold HBK 1500/3000).
2.2.3 Tar sampling and analysis The gasifier is equipped with heated sampling lines at 10 different heights along the reactor. GC, IR, paramagnetic and FID measuring techniques were used to determine the concentrations of permanent gases (H2, CH4, CO, CO2, O2 and N2), and light hydrocarbons in the product gas. Three of the sampling points at the levels 25, 325 and 825 mm above the biomass feeder were used to collect the tars. Two different tar sampling methods were employed: GC-MS-undetectable tars (class 1) were measured by a gravimetric or filter condensation method, while Solid Phase Adsorption (SPA) in combination with GC-MS was used for the sampling and analysis of the compounds within the tar classes 2-5 (see Section 1.4 for more details). The tar sampling equipment is shown schematically in Figure 2.2.

ECN-C--04-014 31
ON LINEANALYSER
S.P.A.
ParticleFilter
GC
GASMETER
PUMP
ICEBATH
~300°C
~110°C
HEAVY TAR COLLECTOR
ON LINEANALYSER
S.P.A.
ParticleFilter
GC
Figure 2.2 Schematic of the tar sampling system.
Qualitative and quantitative analysis of different tar compounds were done with a GC-MS instrument. To calibrate the GC-MS, a standard solution consisting of 16 PAH compounds (Table 2.2) was used. The most diluted calibration solution contained •6.5 µg/ml of each compound. Study of the relationship between the peak area and the concentration showed that the response (expressed in peak area/concentration) of the GC-MS detector to the content of a compound in the calibration solution was dependent on the molecular weight of the compound. The response decreased with increasing the molecular weight. The expression from the mathematical fit of the response/molecular weight relationship (Figure 2.3) was later on used to quantify the contents of different tar compounds not calibrated.
Table 2.2 Compounds used in the calibration of the GC-MS. No. Compound Molecular weight
(kg/kmol)
1 Naphthalene 128 2 Acenaphthylene 152 3 Acenaphthene 154 4 fluorine 166 5 Phenanthrene 178 6 Anthracene 178 7 Fluoranthene 202 8 Pyrene 202 9 benz(a)anthracene 228 10 Chrysene 228 11 benzo(b)fluoranthene 252 12 benzo(k)fluoranthene 252 13 benzo(a)pyrene 252 14 indeno(1,2,3-cd)pyrene 276 15 dibenz(a,h)anthracene 276 16 benzo(g,h,i)perylene 276

32 ECN-C--04-014
0.0E+00
4.0E+04
8.0E+04
1.2E+05
120 170 220 270MW
y= a
vera
ge (p
eak
area
/con
cent
ratio
n)
measuredFit
fit: y=-4.1E+04+1.2E04*exp((MW-57)/134)
R2 = 0.957
Figure 2.3 Response (expressed as peak area/concentration ratio) of the GC-MS vs. molecular
weight (MW).
In the tar analyses with the GC-MS, a total number of 70 compounds were monitored. These compounds were grouped into tar classes according to the tar classification system developed in the project (see Chapter 1). The quantitative amount of each tar class was determined by using their own calibration curve or the fitted curve for the not calibrated ones as discussed above. This quantification procedure gives a more realistic value of the tar content in the gas compared to quantification based on only the calibrated compounds in the tars. For the compounds in class 4, the calibrated compounds comprise about 90 % of the total tars within this class. The corresponding value for classes 3 and 5 are 50 % and 70 % respectively.
2.3 Results and discussion The results in terms of the concentration of the five tar classes, permanent gases and light hydrocarbons at different axial positions are presented in Figures 2.4 - 2.11. When having a closer look at these figures, straightforward interpretation appeared to be difficult. It seemed that, in most cases, there was a net production of gaseous species in the freeboard. See, e.g., the top two figures of Figure 2.6 for class 1 tar. However, it is doubtful that this was actually the case. Elutriation of biomass/char particles from the bed, which would be the probable cause of this net production, is unlikely since 95 % of the initial biomass particles are larger than 1.5 mm and the particle filters in the sampling lines did not contain a significant amount of biomass or char particles. Instead, it is believed that feeding the (possibly partially pyrolysed) biomass through the reactor wall at the top of the bed, i.e. in the splash zone, leads to a non-uniform radial distribution of gaseous products in the freeboard. The gaseous products rise preferentially at the feeding side of the reactor and in the freeboard there is a limited radial mixing. Thus, with the gas/tar sampling points positioned at the centre line, the gas and tar concentrations will be underestimated and this effect will be stronger closer to the feeding point. This could easily be misinterpreted as a net production of gases and tar compounds in the freeboard.
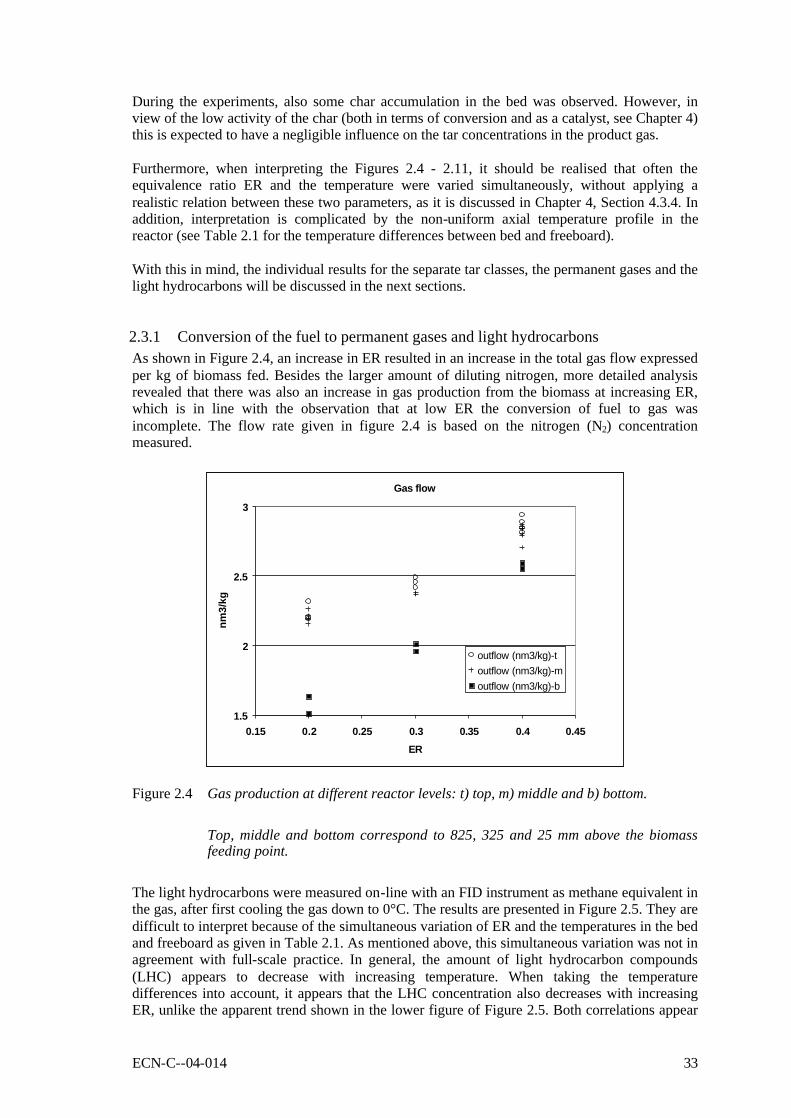
ECN-C--04-014 33
During the experiments, also some char accumulation in the bed was observed. However, in view of the low activity of the char (both in terms of conversion and as a catalyst, see Chapter 4) this is expected to have a negligible influence on the tar concentrations in the product gas. Furthermore, when interpreting the Figures 2.4 - 2.11, it should be realised that often the equivalence ratio ER and the temperature were varied simultaneously, without applying a realistic relation between these two parameters, as it is discussed in Chapter 4, Section 4.3.4. In addition, interpretation is complicated by the non-uniform axial temperature profile in the reactor (see Table 2.1 for the temperature differences between bed and freeboard). With this in mind, the individual results for the separate tar classes, the permanent gases and the light hydrocarbons will be discussed in the next sections.
2.3.1 Conversion of the fuel to permanent gases and light hydrocarbons As shown in Figure 2.4, an increase in ER resulted in an increase in the total gas flow expressed per kg of biomass fed. Besides the larger amount of diluting nitrogen, more detailed analysis revealed that there was also an increase in gas production from the biomass at increasing ER, which is in line with the observation that at low ER the conversion of fuel to gas was incomplete. The flow rate given in figure 2.4 is based on the nitrogen (N2) concentration measured.
Gas flow
1.5
2
2.5
3
0.15 0.2 0.25 0.3 0.35 0.4 0.45ER
nm3/
kg
outflow (nm3/kg)-toutflow (nm3/kg)-moutflow (nm3/kg)-b
Figure 2.4 Gas production at different reactor levels: t) top, m) middle and b) bottom.
Top, middle and bottom correspond to 825, 325 and 25 mm above the biomass feeding point.
The light hydrocarbons were measured on-line with an FID instrument as methane equivalent in the gas, after first cooling the gas down to 0°C. The results are presented in Figure 2.5. They are difficult to interpret because of the simultaneous variation of ER and the temperatures in the bed and freeboard as given in Table 2.1. As mentioned above, this simultaneous variation was not in agreement with full-scale practice. In general, the amount of light hydrocarbon compounds (LHC) appears to decrease with increasing temperature. When taking the temperature differences into account, it appears that the LHC concentration also decreases with increasing ER, unlike the apparent trend shown in the lower figure of Figure 2.5. Both correlations appear

34 ECN-C--04-014
to be in line with a generally observed trend of lower total tar levels at increasing temperature and ER. Furthermore, for the ranges investigated, the impact of the gasification temperature seems larger than the impact of ER.
LHC as a function of bed temperature
0
24
6
8
1012
14
700 750 800 850 900 950
Temperature (°C)
% V
ol.
LHC as a function of freeboard temperature
0
2468
1012
14
750 800 850 900 950Temperature (°C)
% V
ol.
LHC as a function of ER
02468
10
1214
0.15 0.25 0.35 0.45ER
% V
ol.
Figure 2.5 Formation of light hydrocarbons (expressed as methane equivalent) as a function of different process parameters.
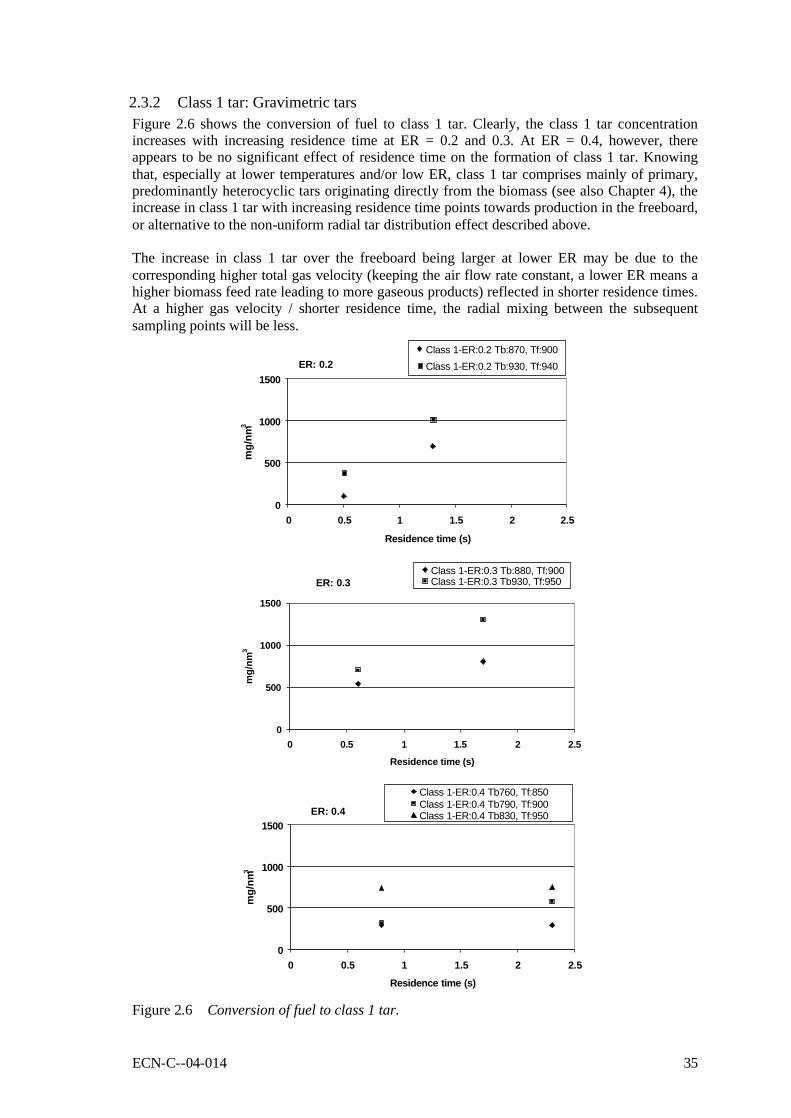
ECN-C--04-014 35
2.3.2 Class 1 tar: Gravimetric tars Figure 2.6 shows the conversion of fuel to class 1 tar. Clearly, the class 1 tar concentration increases with increasing residence time at ER = 0.2 and 0.3. At ER = 0.4, however, there appears to be no significant effect of residence time on the formation of class 1 tar. Knowing that, especially at lower temperatures and/or low ER, class 1 tar comprises mainly of primary, predominantly heterocyclic tars originating directly from the biomass (see also Chapter 4), the increase in class 1 tar with increasing residence time points towards production in the freeboard, or alternative to the non-uniform radial tar distribution effect described above. The increase in class 1 tar over the freeboard being larger at lower ER may be due to the corresponding higher total gas velocity (keeping the air flow rate constant, a lower ER means a higher biomass feed rate leading to more gaseous products) reflected in shorter residence times. At a higher gas velocity / shorter residence time, the radial mixing between the subsequent sampling points will be less.
ER: 0.2
0
500
1000
1500
0 0.5 1 1.5 2 2.5
Residence time (s)
mg/
nm3
Class 1-ER:0.2 Tb:870, Tf:900Class 1-ER:0.2 Tb:930, Tf:940
ER: 0.3
0
500
1000
1500
0 0.5 1 1.5 2 2.5
Residence time (s)
mg/
nm3
Class 1-ER:0.3 Tb:880, Tf:900Class 1-ER:0.3 Tb930, Tf:950
ER: 0.4
0
500
1000
1500
0 0.5 1 1.5 2 2.5
Residence time (s)
mg/
nm3
Class 1-ER:0.4 Tb760, Tf:850Class 1-ER:0.4 Tb790, Tf:900Class 1-ER:0.4 Tb830, Tf:950
Figure 2.6 Conversion of fuel to class 1 tar.
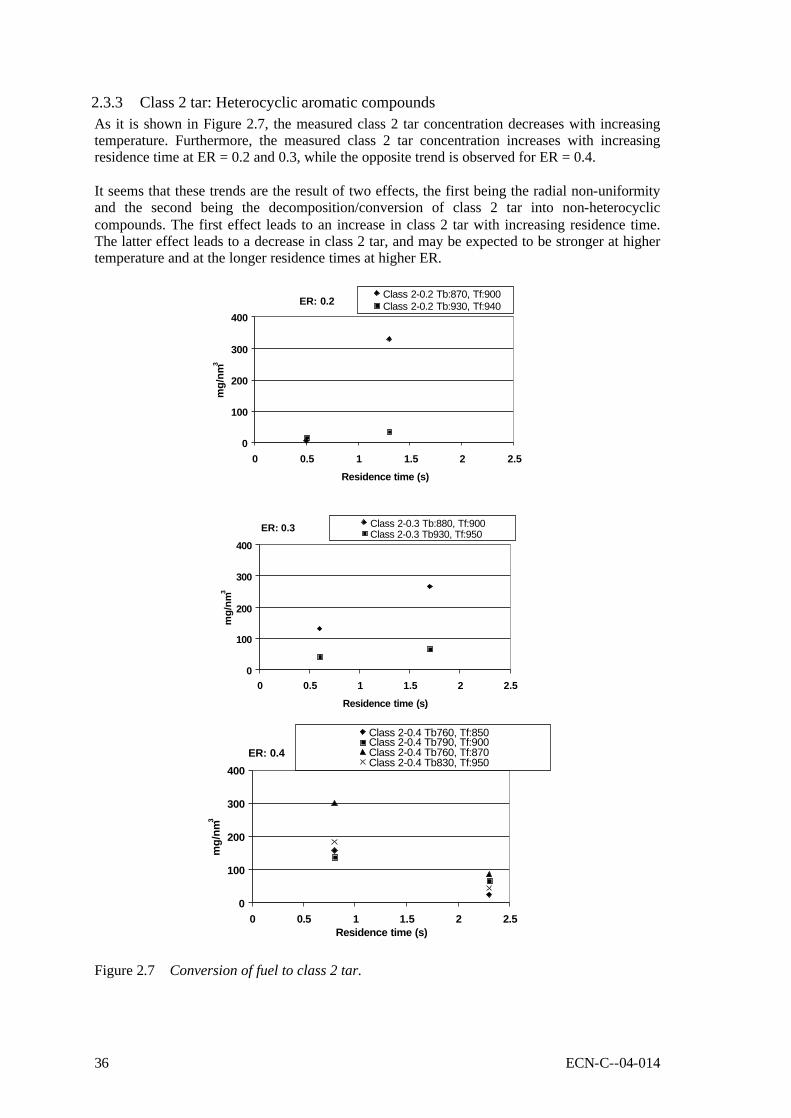
36 ECN-C--04-014
2.3.3 Class 2 tar: Heterocyclic aromatic compounds As it is shown in Figure 2.7, the measured class 2 tar concentration decreases with increasing temperature. Furthermore, the measured class 2 tar concentration increases with increasing residence time at ER = 0.2 and 0.3, while the opposite trend is observed for ER = 0.4. It seems that these trends are the result of two effects, the first being the radial non-uniformity and the second being the decomposition/conversion of class 2 tar into non-heterocyclic compounds. The first effect leads to an increase in class 2 tar with increasing residence time. The latter effect leads to a decrease in class 2 tar, and may be expected to be stronger at higher temperature and at the longer residence times at higher ER.
ER: 0.2
0
100
200
300
400
0 0.5 1 1.5 2 2.5Residence time (s)
mg/
nm3
Class 2-0.2 Tb:870, Tf:900Class 2-0.2 Tb:930, Tf:940
ER: 0.3
0
100
200
300
400
0 0.5 1 1.5 2 2.5
Residence time (s)
mg/
nm3
Class 2-0.3 Tb:880, Tf:900Class 2-0.3 Tb930, Tf:950
ER: 0.4
0
100
200
300
400
0 0.5 1 1.5 2 2.5Residence time (s)
mg/
nm3
Class 2-0.4 Tb760, Tf:850Class 2-0.4 Tb790, Tf:900Class 2-0.4 Tb760, Tf:870Class 2-0.4 Tb830, Tf:950
Figure 2.7 Conversion of fuel to class 2 tar.

ECN-C--04-014 37
2.3.4 Class 3 tar, benzene and toluene Figure 2.8 shows the formation of class 3 tar during the experiments. Partially, the trends are similar to the ones observed for class 2 tar. In most cases, the measured class 3 tar concentration decreases with increasing temperature and at ER = 0.2 (lower temperature case) and 0.3, the concentration increases with increasing residence time. At ER = 0.4, different trends appear for the different temperature cases, while for the higher temperature case at ER = 0.2, the trend is also not in agreement with the one observed for class 2 tar. It is anticipated that the complex behaviour observed for class 3 tar is due to a combination of three effects, being the radial non-uniformity as discussed before, production due to decomposition/conversion of other tar species and a conversion into other species, e.g., due to polymerisation.
ER: 0.2
0
1000
2000
3000
4000
0 0.5 1 1.5 2 2.5
Residense time (s)
mg/
nm3
Class 3-ER:0.2 Tb:870, Tf:900Class 3-ER:0.2 Tb:930, Tf:940
ER: 0.3
0
1000
2000
3000
4000
0 0.5 1 1.5 2 2.5
Residense time (s)
mg/
nm3
Class 3-ER:0.3 Tb:880, Tf:900
Class 3-ER:0.3 Tb930, Tf:950
ER: 0.4
0
1000
2000
3000
4000
0 0.5 1 1.5 2 2.5
Residense time (s)
mg/
nm3
Class 3-ER:0.4 Tb760, Tf:850Class 3-ER:0.4 Tb790, Tf:900Class 3-ER:0.4 Tb830, Tf:950
Figure 2.8 Conversion of fuel to class 3 tar.

38 ECN-C--04-014
The formation of benzene and toluene increased with increasing residence time of the gas in the gasifier (Figure 2.9). Generally, the measured conversions were lower than the values reported in literature [1, 2].
ER: 0.2
0
1000
2000
3000
4000
0 0.5 1 1.5 2 2.5Residence time (s)
mg/
nm3
Benzene and Toluene0.2 Tb:870, Tf:900Benzene and Toluene0.2 Tb:930, Tf:940
ER: 0.3
0
1000
2000
3000
4000
0 0.5 1 1.5 2 2.5Residence time (s)
mg/
nm3
Benzene and Toluene0.3 Tb:880, Tf:900Benzene and Toluene0.3 Tb930, Tf:950
ER: 0.4
0
1000
2000
3000
4000
0 0.5 1 1.5 2 2.5
Residence time (s)
mg/
nm3
Benzene and Toluene0.4 Tb760, Tf:850Benzene and Toluene0.4 Tb790, Tf:900Benzene and Toluene0.4 Tb760, Tf:870Benzene and Toluene0.4 Tb830, Tf:950
Figure 2.9 Conversion of fuel to benzene and toluene.
ECN-C--04-014 39
2.3.5 Class 4 tar As shown in Figure 2.10, the class 4 tar concentration appears to increase with increasing residence time in the gasifier. At ER = 0.2 and 0.3, the concentration decreased with increasing gasification temperature. At ER = 0.4, however, an opposite effect of temperature was observed. At this ER, the highest concentrations were measured during the experiment with the highest gasification temperature. During the experiments with the same freeboard temperatures (~900°C), the conversion to class 4 tar shows the lowest value at ER = 0.2. Increasing the ER to 0.3 increases the conversion, but this decreases again when the ER is increased to 0.4. The reason for this complex behaviour seems again the simultaneous occurrence of many effects, such as: • The radial non-uniformity effect, as discussed earlier. • An increase in ER is accomplished by applying a lower biomass feed rate; less biomass will
give a lower total tar concentration. • Biomass conversion increases with increasing ER leading to a higher total tar concentration. • A higher oxygen availability at increasing ER will lead to a lower total tar concentration. • A higher ER means larger residence times leaving more time for class 4 tar production and
conversion. • For class 4 tar, polymerisation reactions may become dominant over formation reactions at
higher ER (e.g., compare the impact of gasification temperature at constant ER and at varying ER in Tables 4.5 and 4.6 in Chapter 4). Here it has to be realised as well that class 4 tar comprises of a mixture of alkyl-substituted tars and poly-aromatic hydrocarbons, which show a different behaviour (see again Chapter 4).
In general, the number of simultaneous effects appears too numerous and the extent of the individual effects too unclear to allow a clear explanation of the observed trends for the gasification temperature and ER.
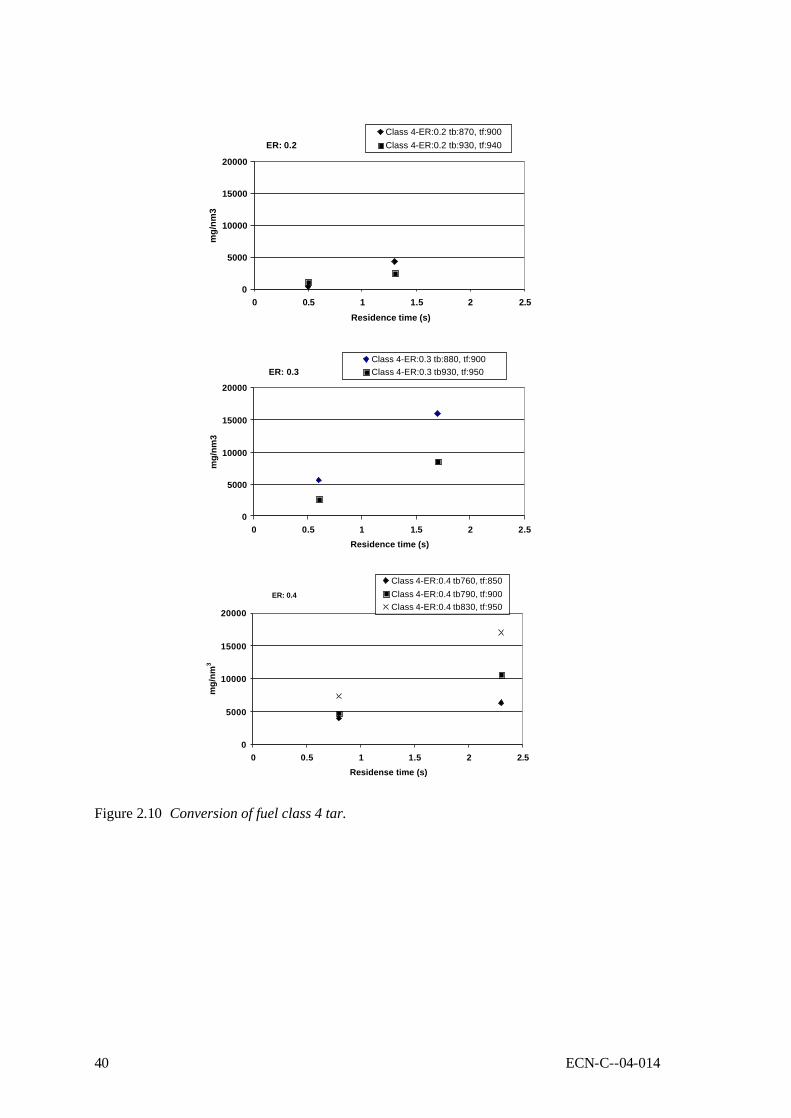
40 ECN-C--04-014
ER: 0.2
0
5000
10000
15000
20000
0 0.5 1 1.5 2 2.5Residence time (s)
mg/
nm3
Class 4-ER:0.2 tb:870, tf:900Class 4-ER:0.2 tb:930, tf:940
ER: 0.3
0
5000
10000
15000
20000
0 0.5 1 1.5 2 2.5Residence time (s)
mg/
nm3
Class 4-ER:0.3 tb:880, tf:900Class 4-ER:0.3 tb930, tf:950
ER: 0.4
0
5000
10000
15000
20000
0 0.5 1 1.5 2 2.5Residense time (s)
mg/
nm3
Class 4-ER:0.4 tb760, tf:850Class 4-ER:0.4 tb790, tf:900Class 4-ER:0.4 tb830, tf:950
Figure 2.10 Conversion of fuel class 4 tar.

ECN-C--04-014 41
2.3.6 Class 5 tar Figure 2.11 shows that for class 5 tar the trends are not so clear. As for class 4 tar, this seems largely due to the simultaneous occurrence of many effects.
0
1000
2000
3000
0 0.5 1 1.5 2 2.5residence time (s)
mg/
nm3
Class 5-ER:0.2 Tb:870, Tf:900 Class 5-ER:0.2 Tb:930, Tf:940
0
1000
2000
3000
0 0.5 1 1.5 2 2.5
Residence time
mg/
nm3
Class 5-ER:0.3 Tb:880, Tf:900 Class 5-ER:0.3 Tb930, Tf:950
0
1000
2000
3000
0 0.5 1 1.5 2 2.5
Residence time (s)
mg/
nm3
Class 5-ER:0.4 Tb760, Tf:850 Class 5-ER:0.4 Tb830, Tf:950Class 5-ER:0.4 Tb790, Tf:900
Figure 2.11 Conversion of fuel class 5 tar.

42 ECN-C--04-014
2.4 Concluding remarks Generally, it is difficult to draw clear conclusions from the experiments, because of the limited number of experiments, the difficulty to reach/maintain proper temperature levels in the bed, and the simultaneous variation of several operating parameters (temperature, ER, residence time). Furthermore, the feeding of the biomass through the reactor wall at the top of the bubbling bed (in the splash zone) seems to have complicated the interpretation of the experimental results. It is believed that feeding the (possibly partially pyrolysed) biomass at the top of the bed leads to a non-uniform radial distribution of gaseous products in the freeboard. The gaseous products rise preferentially at the feeding side of the reactor and in the freeboard there is a limited radial mixing. Thus, with the gas/tar sampling points positioned at the centre line, the gas and tar concentrations will be underestimated and this effect will be stronger closer to the feeding point. Nevertheless, the experiments have given valuable first impressions of the impact of different operating parameters and they have been of great value for the design of subsequent lab-scale experimental programmes, e.g. as described in Chapter 4.
2.5 References [1] Sjöström, K., Chen, G., and Yu, Q.: "Synergistic effect on tar formation in co-
gasification of energy crops and coal”. In: Biomass a Growth Opportunity In Green Energy And Value-Added Products, R.P. Overend and E. Chornet (Eds). Pergamon, Oxford, UK, 1999.
[2] Padban, N., Wang, W., Ye, Z., Bjerle, I., and Odenbrand, I. Energy & Fuels, vol.14, pp.603-611, 2000.

ECN-C--04-014 43
3. TAR FORMATION MODELLING AND LAB-SCALE GASIFICATION EXPERIMENTS
R.H. Berends, H.M.G. Temmink and G. Brem, TNO Environment, Energy and Process Innovation (TNO-MEP)
3.1 Introduction and scope In this chapter, work of TNO-MEP is described. In addition to more general aspects of the project (e.g., an initial literature survey [1] and the development of the classification system, as described in Chapter 1), the TNO-MEP contribution to the project has been focussed on the following two subjects:
1) Modelling: development of models to describe tar formation and tar cracking. 2) Experimental work: lab-scale investigation into the formation of (primary) tars in a
bubbling-fluidised-bed gasifier as a function of temperature, equivalence ratio (ER) and air distribution.
3.2 Modelling The objectives of the modelling work were twofold: 1) To develop a simple black box model. 2) To develop a kinetic model through reactions in continuous mixtures. With both models it should be possible to describe the formation and destruction of tars and from there calculate the possibility of tar condensation in a gas turbine. The models should provide (more) insight into the phenomena occurring in a (bubbling-)fluidised-bed gasifier. This improved insight in turn should lead to means and/or methods to influence the tar formation and cracking.
3.2.1 The black box model The black box model can be depicted as shown in Figure 3.1.
biomassTar formation/conversion
Tar formation/conversion/cracking
Bed section
Freeboard section
first sampling point
last sampling point
biomassTar formation/conversion
Tar formation/conversion/cracking
Bed section
Freeboard section
first sampling point
last sampling point
biomassTar formation/conversion
Tar formation/conversion/cracking
Bed section
Freeboard section
first sampling point
last sampling point
Figure 3.1 Black box model of a bubbling-fluidised-bed gasifier.
The parameters, that can be changed, are:

44 ECN-C--04-014
Tbed Bed temperature Tef Temperature at the end of the freeboard ∆τ Τhe gas residence time between the first sampling point above the bed and the one at the
end of the freeboard ER Equivalence ratio The black box model was derived from data available from experiments at ECN and UT. The ECN data are presented in Table 3.1 and Figure 3.2. The experimental conditions, for which these data have been obtained, are given in Chapter 4. In Figure 3.2, the tar concentrations of the 5 classes above the bed (ab) and at the end of the freeboard (ef) are shown. The line for class 1 is tentative, because only data for 730 and 801°C were available. It can be seen that depending on temperature there may be destruction or formation of tar compounds.
Table 3.1 ECN data used to derive a black box model. Bed temperature °C 730 754 801 853 896
Just above the bed Class 1* Class 2 Class 3 Class 4 Class 5
mg/mn
3 mg/mn
3 mg/mn
3 mg/mn
3 mg/mn
3
9110 3275 6060 1184
45
NA
4050 8385 1631
68
3008 2473 9376 2241 148
NA
1113 8645 3196 333
NA 288
7569 3360 498
End freeboard Class 1* Class 2 Class 3 Class 4 Class 5
mg/mn
3 mg/mn
3 mg/mn
3 mg/mn
3 mg/mn
3
NA
3476 7923 1739
89
NA
3403 9871 2522 127
NA
1651 10497 3967 409
NA 436
8539 4906 791
NA 157
5018 5842 1434
* The corresponding experimental conditions are given in Chapter 4. Class 1 tars as determined by condensation at 125°C on an aerosol filter (i.e., no true class 1 determination, see Chapter 4). NA = Not available.
0
2000
4000
6000
8000
10000
12000
700 750 800 850 900 950
bedtemp ( °C)
Tars
(mg/
nm3)
3ab3ef
1ab
4ab
4ef
5ef5ab
2ab
2ef
Figure 3.2 ECN data used to derive a black box model: tar class concentrations at two
locations in the WOB gasifier vs. bed temperature.
The number refers to the tar class, ab = just above the bubbling bed, ef = at the end of the freeboard section.
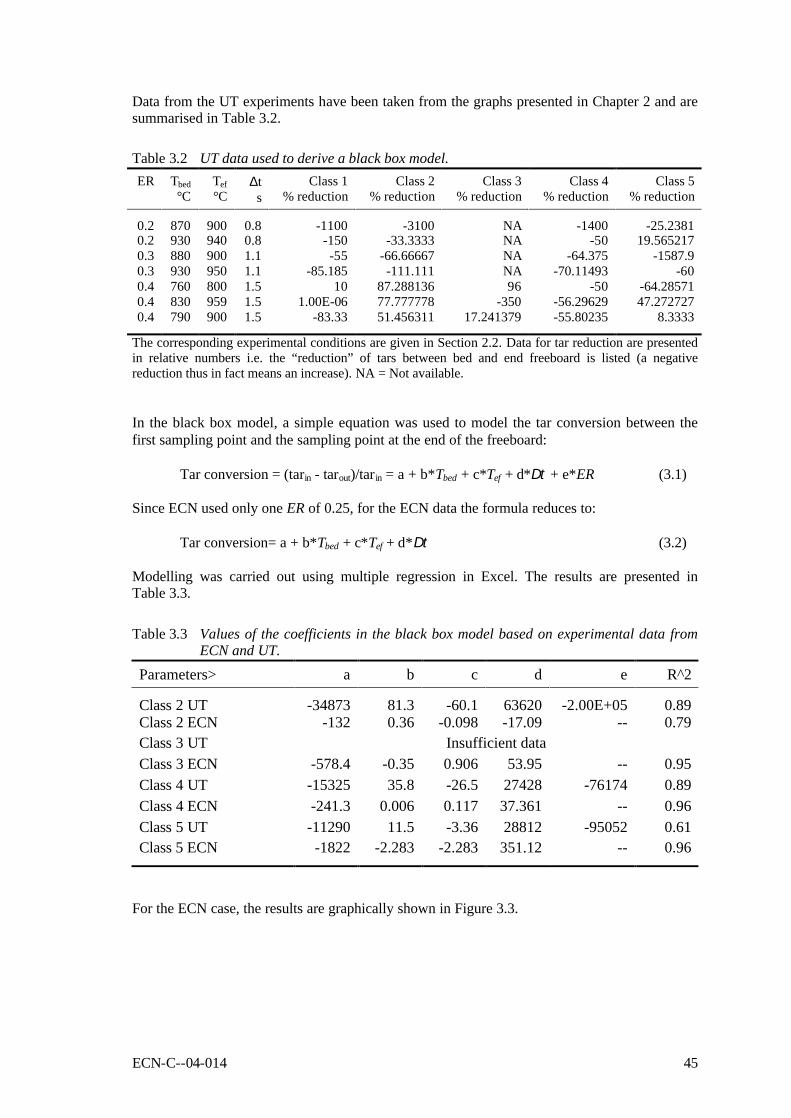
ECN-C--04-014 45
Data from the UT experiments have been taken from the graphs presented in Chapter 2 and are summarised in Table 3.2.
Table 3.2 UT data used to derive a black box model. ER Tbed
°C Tef °C
∆t s
Class 1 % reduction
Class 2 % reduction
Class 3 % reduction
Class 4 % reduction
Class 5 % reduction
0.2 870 900 0.8 -1100 -3100 NA -1400 -25.2381 0.2 930 940 0.8 -150 -33.3333 NA -50 19.565217 0.3 880 900 1.1 -55 -66.66667 NA -64.375 -1587.9 0.3 930 950 1.1 -85.185 -111.111 NA -70.11493 -60 0.4 760 800 1.5 10 87.288136 96 -50 -64.28571 0.4 830 959 1.5 1.00E-06 77.777778 -350 -56.29629 47.272727 0.4 790 900 1.5 -83.33 51.456311 17.241379 -55.80235 8.3333
The corresponding experimental conditions are given in Section 2.2. Data for tar reduction are presented in relative numbers i.e. the “reduction” of tars between bed and end freeboard is listed (a negative reduction thus in fact means an increase). NA = Not available. In the black box model, a simple equation was used to model the tar conversion between the first sampling point and the sampling point at the end of the freeboard:
Tar conversion = (tarin - tarout)/tar in = a + b*Tbed + c*Tef + d*∆τ + e*ER (3.1) Since ECN used only one ER of 0.25, for the ECN data the formula reduces to:
Tar conversion= a + b*Tbed + c*Tef + d*∆τ (3.2) Modelling was carried out using multiple regression in Excel. The results are presented in Table 3.3.
Table 3.3 Values of the coefficients in the black box model based on experimental data from ECN and UT.
Parameters> a b c d e R^2
Class 2 UT -34873 81.3 -60.1 63620 -2.00E+05 0.89 Class 2 ECN -132 0.36 -0.098 -17.09 -- 0.79 Class 3 UT Insufficient data Class 3 ECN -578.4 -0.35 0.906 53.95 -- 0.95 Class 4 UT -15325 35.8 -26.5 27428 -76174 0.89 Class 4 ECN -241.3 0.006 0.117 37.361 -- 0.96 Class 5 UT -11290 11.5 -3.36 28812 -95052 0.61 Class 5 ECN -1822 -2.283 -2.283 351.12 -- 0.96
For the ECN case, the results are graphically shown in Figure 3.3.
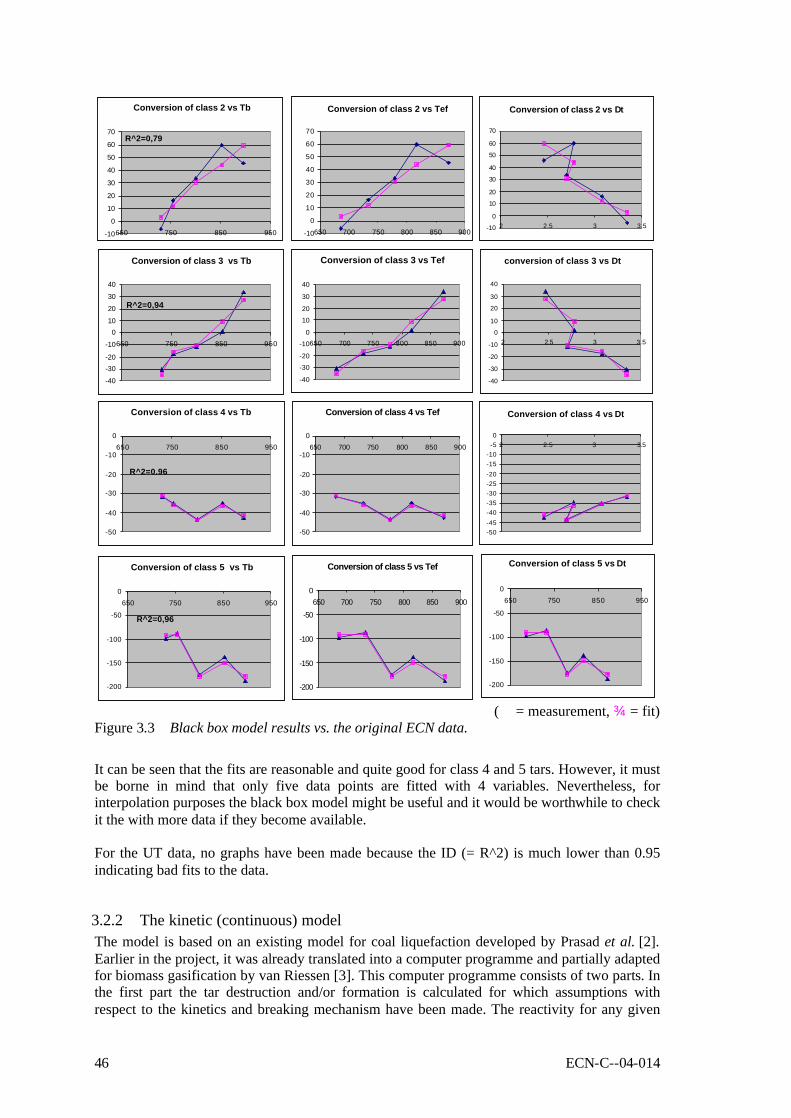
46 ECN-C--04-014
Conversion of class 2 vs Tb
-10
0
10
20
30
40
50
60
70
650 750 850 950
R^2=0,79
Conversion of class 2 vs Tef
-10
0
10
20
30
40
50
60
70
650 700 750 800 850 900
Conversion of class 2 vs ∆τ
-10
0
10
20
30
40
50
60
70
2 2.5 3 3.5
Conversion of class 3 vs Tb
-40
-30-20
-10
010
20
30
40
650 750 850 950
R^2=0,94
Conversion of class 3 vs Tef
-40
-30
-20
-10
0
10
20
30
40
650 700 750 800 850 900
conversion of class 3 vs ∆τ
-40
-30
-20
-10
0
10
20
30
40
2 2.5 3 3.5
Conversion of class 4 vs Tb
-50
-40
-30
-20
-10
0650 750 850 950
R^2=0,96
Conversion of class 4 vs Tef
-50
-40
-30
-20
-10
0650 700 750 800 850 900
Conversion of class 4 vs ∆τ
-50-45-40-35-30-25-20-15-10
-50
2 2.5 3 3.5
Conversion of class 5 vs Tb
-200
-150
-100
-50
0650 750 850 950
R^2=0,96
Conversion of class 5 vs Tef
-200
-150
-100
-50
0650 700 750 800 850 900
Conversion of class 5 vs ∆τ
-200
-150
-100
-50
0650 750 850 950
(Å = measurement, ¾ = fit)
Figure 3.3 Black box model results vs. the original ECN data.
It can be seen that the fits are reasonable and quite good for class 4 and 5 tars. However, it must be borne in mind that only five data points are fitted with 4 variables. Nevertheless, for interpolation purposes the black box model might be useful and it would be worthwhile to check it the with more data if they become available. For the UT data, no graphs have been made because the ID (= R^2) is much lower than 0.95 indicating bad fits to the data.
3.2.2 The kinetic (continuous) model The model is based on an existing model for coal liquefaction developed by Prasad et al. [2]. Earlier in the project, it was already translated into a computer programme and partially adapted for biomass gasification by van Riessen [3]. This computer programme consists of two parts. In the first part the tar destruction and/or formation is calculated for which assumptions with respect to the kinetics and breaking mechanism have been made. The reactivity for any given
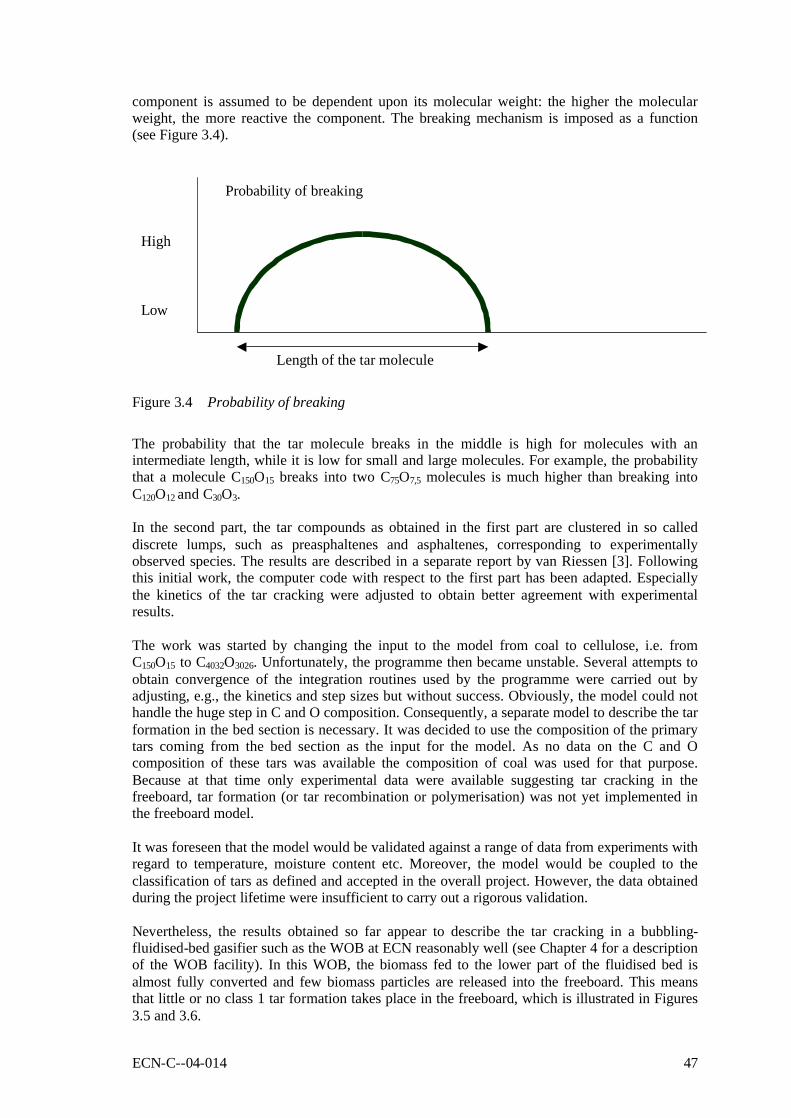
ECN-C--04-014 47
component is assumed to be dependent upon its molecular weight: the higher the molecular weight, the more reactive the component. The breaking mechanism is imposed as a function (see Figure 3.4).
Length of the tar molecule
High Low
Probability of breaking
Figure 3.4 Probability of breaking
The probability that the tar molecule breaks in the middle is high for molecules with an intermediate length, while it is low for small and large molecules. For example, the probability that a molecule C150O15 breaks into two C75O7,5 molecules is much higher than breaking into C120O12 and C30O3. In the second part, the tar compounds as obtained in the first part are clustered in so called discrete lumps, such as preasphaltenes and asphaltenes, corresponding to experimentally observed species. The results are described in a separate report by van Riessen [3]. Following this initial work, the computer code with respect to the first part has been adapted. Especially the kinetics of the tar cracking were adjusted to obtain better agreement with experimental results. The work was started by changing the input to the model from coal to cellulose, i.e. from C150O15 to C4032O3026. Unfortunately, the programme then became unstable. Several attempts to obtain convergence of the integration routines used by the programme were carried out by adjusting, e.g., the kinetics and step sizes but without success. Obviously, the model could not handle the huge step in C and O composition. Consequently, a separate model to describe the tar formation in the bed section is necessary. It was decided to use the composition of the primary tars coming from the bed section as the input for the model. As no data on the C and O composition of these tars was available the composition of coal was used for that purpose. Because at that time only experimental data were available suggesting tar cracking in the freeboard, tar formation (or tar recombination or polymerisation) was not yet implemented in the freeboard model. It was foreseen that the model would be validated against a range of data from experiments with regard to temperature, moisture content etc. Moreover, the model would be coupled to the classification of tars as defined and accepted in the overall project. However, the data obtained during the project lifetime were insufficient to carry out a rigorous validation. Nevertheless, the results obtained so far appear to describe the tar cracking in a bubbling-fluidised-bed gasifier such as the WOB at ECN reasonably well (see Chapter 4 for a description of the WOB facility). In this WOB, the biomass fed to the lower part of the fluidised bed is almost fully converted and few biomass particles are released into the freeboard. This means that little or no class 1 tar formation takes place in the freeboard, which is illustrated in Figures 3.5 and 3.6.
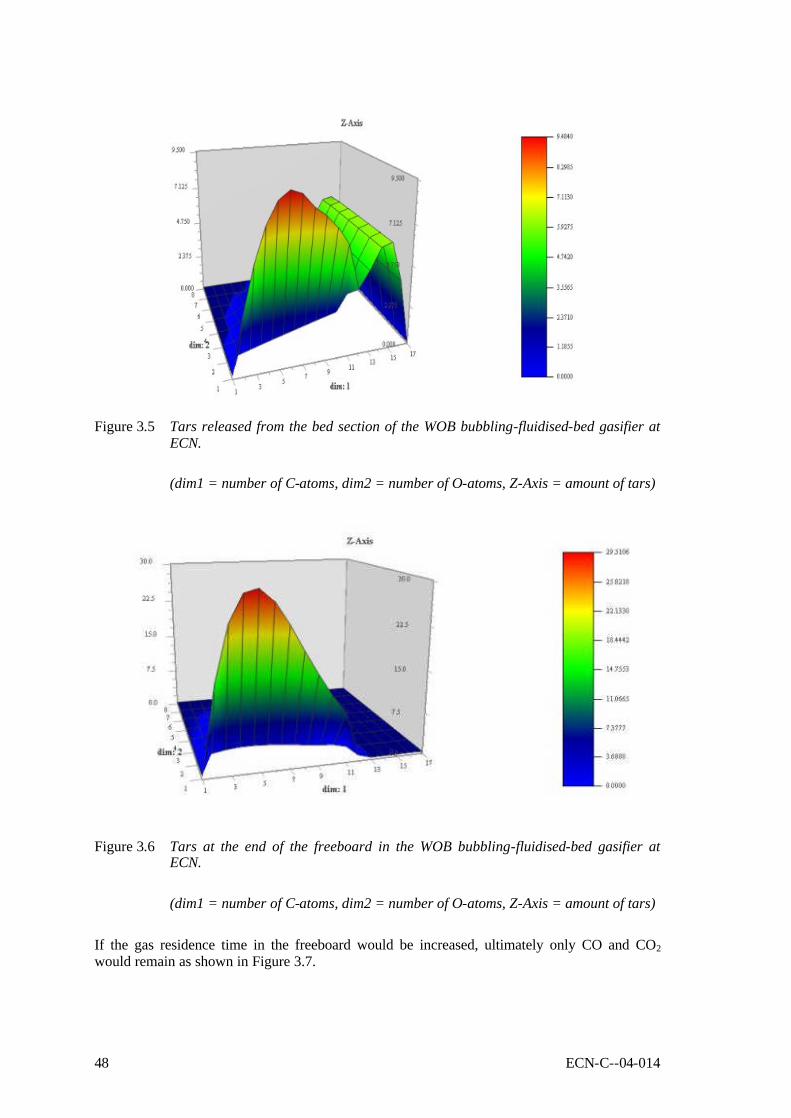
48 ECN-C--04-014
Figure 3.5 Tars released from the bed section of the WOB bubbling-fluidised-bed gasifier at
ECN.
(dim1 = number of C-atoms, dim2 = number of O-atoms, Z-Axis = amount of tars)
Figure 3.6 Tars at the end of the freeboard in the WOB bubbling-fluidised-bed gasifier at ECN.
(dim1 = number of C-atoms, dim2 = number of O-atoms, Z-Axis = amount of tars)
If the gas residence time in the freeboard would be increased, ultimately only CO and CO2 would remain as shown in Figure 3.7.
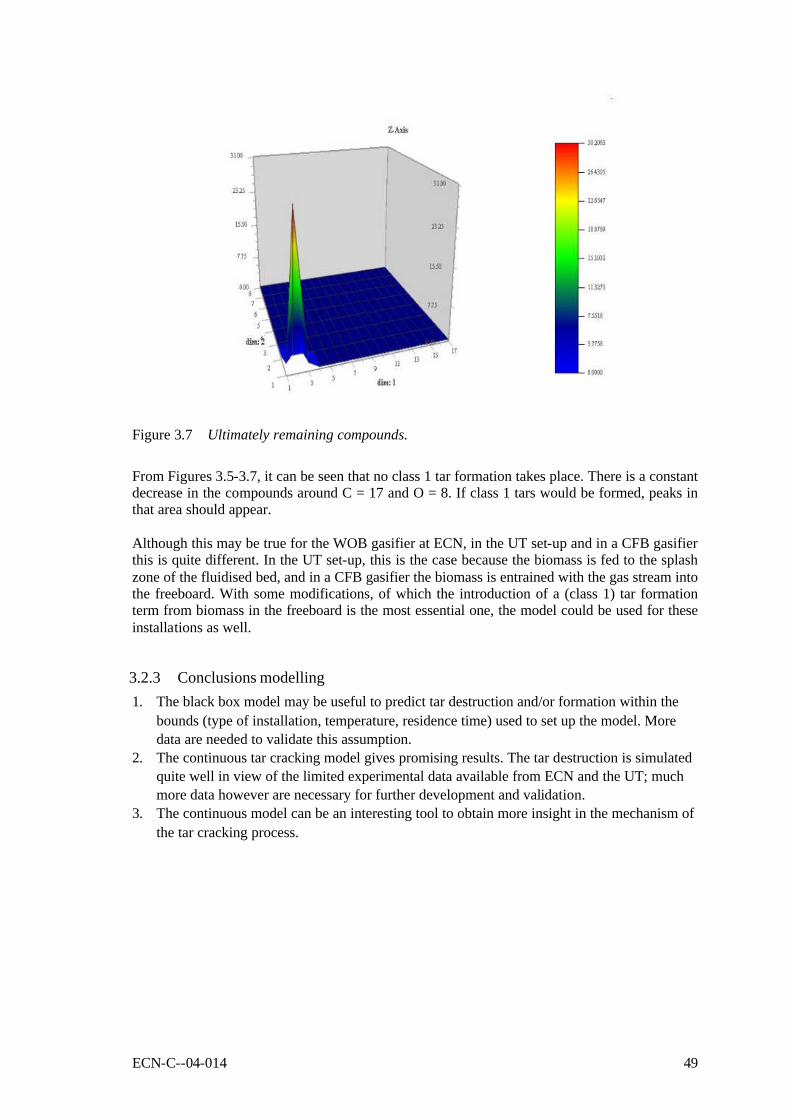
ECN-C--04-014 49
Figure 3.7 Ultimately remaining compounds.
From Figures 3.5-3.7, it can be seen that no class 1 tar formation takes place. There is a constant decrease in the compounds around C = 17 and O = 8. If class 1 tars would be formed, peaks in that area should appear. Although this may be true for the WOB gasifier at ECN, in the UT set-up and in a CFB gasifier this is quite different. In the UT set-up, this is the case because the biomass is fed to the splash zone of the fluidised bed, and in a CFB gasifier the biomass is entrained with the gas stream into the freeboard. With some modifications, of which the introduction of a (class 1) tar formation term from biomass in the freeboard is the most essential one, the model could be used for these installations as well.
3.2.3 Conclusions modelling 1. The black box model may be useful to predict tar destruction and/or formation within the
bounds (type of installation, temperature, residence time) used to set up the model. More data are needed to validate this assumption.
2. The continuous tar cracking model gives promising results. The tar destruction is simulated quite well in view of the limited experimental data available from ECN and the UT; much more data however are necessary for further development and validation.
3. The continuous model can be an interesting tool to obtain more insight in the mechanism of the tar cracking process.
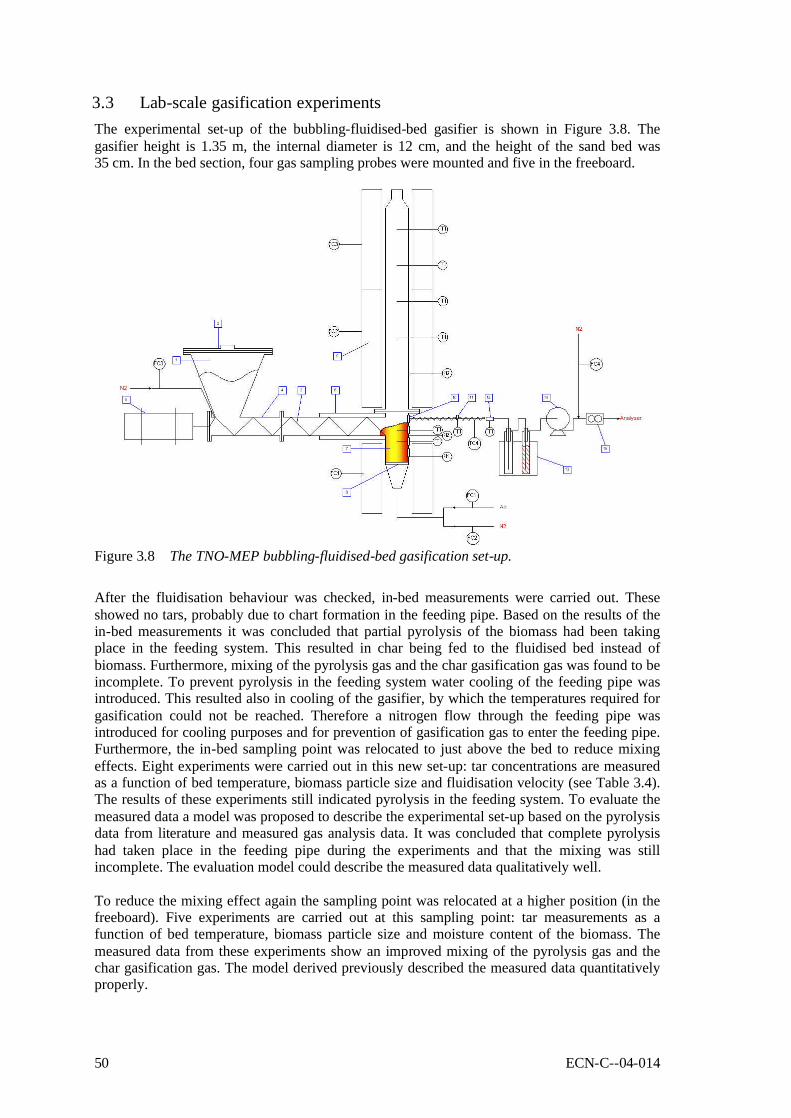
50 ECN-C--04-014
3.3 Lab-scale gasification experiments The experimental set-up of the bubbling-fluidised-bed gasifier is shown in Figure 3.8. The gasifier height is 1.35 m, the internal diameter is 12 cm, and the height of the sand bed was 35 cm. In the bed section, four gas sampling probes were mounted and five in the freeboard.
Figure 3.8 The TNO-MEP bubbling-fluidised-bed gasification set-up.
After the fluidisation behaviour was checked, in-bed measurements were carried out. These showed no tars, probably due to chart formation in the feeding pipe. Based on the results of the in-bed measurements it was concluded that partial pyrolysis of the biomass had been taking place in the feeding system. This resulted in char being fed to the fluidised bed instead of biomass. Furthermore, mixing of the pyrolysis gas and the char gasification gas was found to be incomplete. To prevent pyrolysis in the feeding system water cooling of the feeding pipe was introduced. This resulted also in cooling of the gasifier, by which the temperatures required for gasification could not be reached. Therefore a nitrogen flow through the feeding pipe was introduced for cooling purposes and for prevention of gasification gas to enter the feeding pipe. Furthermore, the in-bed sampling point was relocated to just above the bed to reduce mixing effects. Eight experiments were carried out in this new set-up: tar concentrations are measured as a function of bed temperature, biomass particle size and fluidisation velocity (see Table 3.4). The results of these experiments still indicated pyrolysis in the feeding system. To evaluate the measured data a model was proposed to describe the experimental set-up based on the pyrolysis data from literature and measured gas analysis data. It was concluded that complete pyrolysis had taken place in the feeding pipe during the experiments and that the mixing was still incomplete. The evaluation model could describe the measured data qualitatively well. To reduce the mixing effect again the sampling point was relocated at a higher position (in the freeboard). Five experiments are carried out at this sampling point: tar measurements as a function of bed temperature, biomass particle size and moisture content of the biomass. The measured data from these experiments show an improved mixing of the pyrolysis gas and the char gasification gas. The model derived previously described the measured data quantitatively properly.
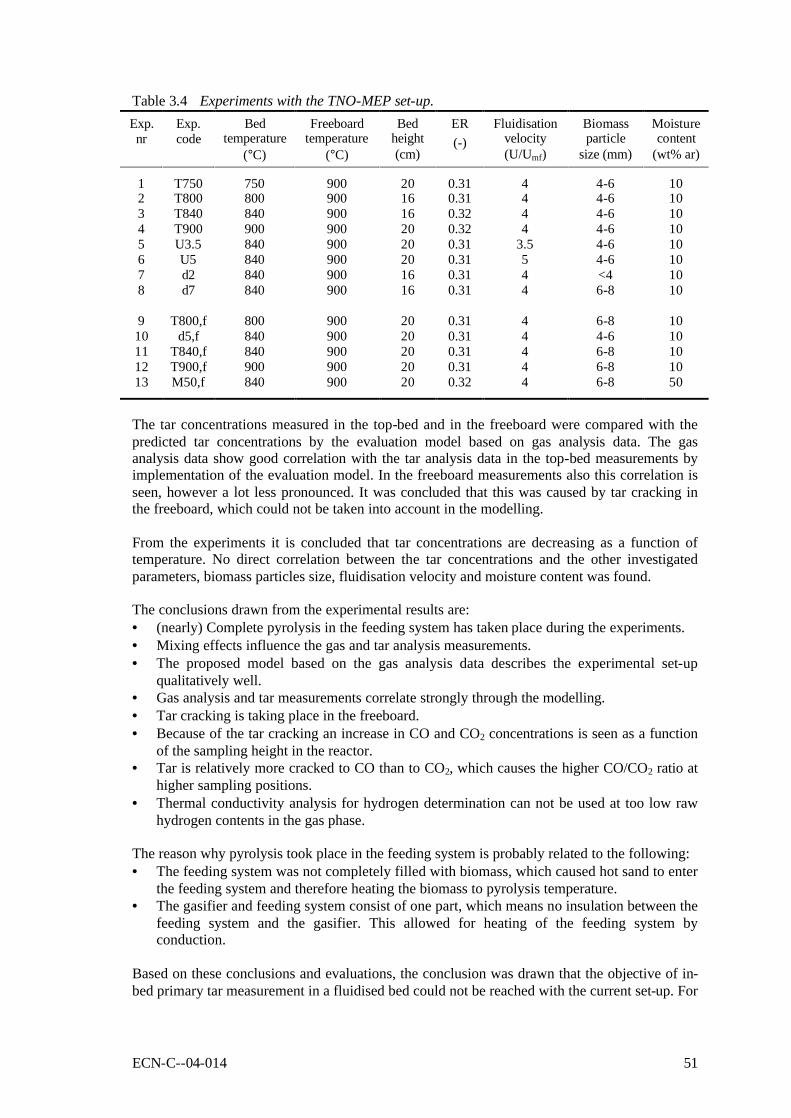
ECN-C--04-014 51
Table 3.4 Experiments with the TNO-MEP set-up. Exp. nr
Exp. code
Bed temperature
(°C)
Freeboard temperature
(°C)
Bed height (cm)
ER (-)
Fluidisation velocity (U/Umf)
Biomass particle
size (mm)
Moisture content
(wt% ar)
1 T750 750 900 20 0.31 4 4-6 10 2 T800 800 900 16 0.31 4 4-6 10 3 T840 840 900 16 0.32 4 4-6 10 4 T900 900 900 20 0.32 4 4-6 10 5 U3.5 840 900 20 0.31 3.5 4-6 10 6 U5 840 900 20 0.31 5 4-6 10 7 d2 840 900 16 0.31 4 <4 10 8 d7 840 900 16 0.31 4 6-8 10
9 T800,f 800 900 20 0.31 4 6-8 10 10 d5,f 840 900 20 0.31 4 4-6 10 11 T840,f 840 900 20 0.31 4 6-8 10 12 T900,f 900 900 20 0.31 4 6-8 10 13 M50,f 840 900 20 0.32 4 6-8 50
The tar concentrations measured in the top-bed and in the freeboard were compared with the predicted tar concentrations by the evaluation model based on gas analysis data. The gas analysis data show good correlation with the tar analysis data in the top-bed measurements by implementation of the evaluation model. In the freeboard measurements also this correlation is seen, however a lot less pronounced. It was concluded that this was caused by tar cracking in the freeboard, which could not be taken into account in the modelling. From the experiments it is concluded that tar concentrations are decreasing as a function of temperature. No direct correlation between the tar concentrations and the other investigated parameters, biomass particles size, fluidisation velocity and moisture content was found. The conclusions drawn from the experimental results are: • (nearly) Complete pyrolysis in the feeding system has taken place during the experiments. • Mixing effects influence the gas and tar analysis measurements. • The proposed model based on the gas analysis data describes the experimental set-up
qualitatively well. • Gas analysis and tar measurements correlate strongly through the modelling. • Tar cracking is taking place in the freeboard. • Because of the tar cracking an increase in CO and CO2 concentrations is seen as a function
of the sampling height in the reactor. • Tar is relatively more cracked to CO than to CO2, which causes the higher CO/CO2 ratio at
higher sampling positions. • Thermal conductivity analysis for hydrogen determination can not be used at too low raw
hydrogen contents in the gas phase. The reason why pyrolysis took place in the feeding system is probably related to the following: • The feeding system was not completely filled with biomass, which caused hot sand to enter
the feeding system and therefore heating the biomass to pyrolysis temperature. • The gasifier and feeding system consist of one part, which means no insulation between the
feeding system and the gasifier. This allowed for heating of the feeding system by conduction.
Based on these conclusions and evaluations, the conclusion was drawn that the objective of in-bed primary tar measurement in a fluidised bed could not be reached with the current set-up. For

52 ECN-C--04-014
future projects the following changes are recommended to prevent pyrolysis to take place in the feeding system: • Decrease the diameter of the feeding pipe to ensure complete filling of the feeding pipe,
which prevents sand and gasifier gas to enter the feeding system. • Insulate the feeding pipe to prevent conduction of heat from the gasifier to the feeding
system.
3.4 References [1] Neeft, J.P.A., and Berends, R.H.: “Inventariserende studie - deel 1: Primaire
maatregelen (voorkomen teervorming of in-bed verwijderen) ter verlaging van teerproductie bij wervelbedvergassers”. ECN-TNO report, 2001 (in Dutch).
[2] Prasad et al. AIChE Journal, vol.23(8), pp.1277-1287, 1986.
[3] Riessen, G.J. van: "Reactions in continuous mixtures: modelling tar behaviour during biomass gasification". Report R 2001/130, TNO Environment, Energy and Process Innovation, Apeldoorn, 2001.
[4] Temmink, H.M.G.: "Primary measures for tar reduction / subproject modelling". Report R 2003/269, TNO Environment, Energy and Process Innovation, Apeldoorn, 2003.
[5] Berends, R.H., and Pekovic, S.: "Primary measures for the reduction of tar production in fluidised bed biomass gasifiers - Phase 5.1: Tar measurements in the bed and freeboard of a bubbling fluidised bed gasifier". Report R 2003/267, TNO Environment, Energy and Process Innovation, Apeldoorn, 2003.

ECN-C--04-014 53
4. IMPACT OF FUEL PROPERTIES AND GASIFIER OPERATING CONDITIONS ON TAR FORMATION
S.V.B. van Paasen and J.H.A. Kiel, ECN Biomass
4.1 Introduction The experimental programme at ECN has been focussed on determining the impact of various fuel properties and gasifier operating conditions on tar formation and the resulting consequences for the performance of downstream processes. Emphasis was put on the gasification of woody biomass. Most of the experimental work was conducted in a 1 kg/h lab-scale bubbling-fluidised-bed gasifier, but the relation between tar formation in a bubbling-fluidised-bed and a circulating-fluidised-bed gasifier was addressed as well. Based on the results of the literature survey, described in Chapter 1 [1], the fuel/biomass properties and gasifier operating conditions considered are the following: Biomass properties • Ash content: Ash in biomass contains a considerable amount of alkali metals. In literature,
these metals are reported to be catalytically active in the decomposition of the structural elements of biomass, and thus influence tar formation. Besides alkali metals, biomass ash contains a wide spectrum of other elements that can be active in tar conversion.
• Moisture content: Water or steam can be reactive with carbon at high temperature and is applied as a gasification agent in several gasifiers, like the Güssing and Battelle gasifier.
• Lignocellulose composition: Also the lignocellulose composition of woody biomass can influence the tar concentration and composition in the producer gas at the outlet of the gasifier. The molecular structure of the biomass compound cellulose is comparable to hemicellulose, but the molecular structure of lignin is completely different. Since de-polymerisation is the first step in tar formation, the lignin content in the biomass seems an important parameter for tar formation.
Gasifier operating conditions • Gasification temperature: The gasification temperature influences the conversion rate of
tar, and influences the selectivity towards the formation of tar compounds. • Gas residence time: The gas residence time determines the time for a reaction to occur and
proceed. Since tar formation is a multi-step process comprising several consecutive reactions, the gas residence time will certainly influence tar content and composition.
4.2 Experimental The gasification experiments were conducted in the 1 kg/h bubbling-fluidised-bed biomass gasifier WOB3 at ECN. The gasifier is electrically heated and has an internal diameter of 74 mm (bottom section), increasing to 108 mm (freeboard) at a height of 500 mm. The total length is 1100 mm from the metal distributor plate to the fuel gas outlet. Bed temperatures are measured at four points in the bed. The applied bed material is 0.27 mm dia. silica sand. Typically, the total amount of bed material is 1 kg. The gasifier is shown schematically in Figure 4.1. Gas samples can be taken at four places in the freeboard, equally distributed over the height. The fifth sampling point is located after the cyclone. The corresponding gas residence times are indicated in Figure 4.1. The gas analysis comprises the measurement of permanent gases as well as tar compounds. The concentration of CO, CO2, CH4, H2, C2H4, C2H6, benzene and toluene is 3 See http://www.ecn.nl/biomass/wob/index.html

54 ECN-C--04-014
measured on-line every minute with gas monitors and/or a micro-GC. The concentration of tar compounds is determined with the SPA or the Guideline method, as described in Section 1.4.
freeboard
bed
Cyclone4321
Biomass
5
Air
Figure 4.1 Schematic of the 1 kg/h bubbling-fluidised-bed gasifier (WOB) at ECN.
For standard conditions, i.e. a biomass feeding rate of 1 kg/h, an air flow rate of 16 ln/min and a gasifier temperature of 850°C, the corresponding gas residence times for the five sampling points are: point 1 - 1.3 s, point 2 - 2.0 s, point 3 - 2.8 s, point 4 -3.6 s, point 5 - 4.0 s.
For the experiments, three types of fuel were selected: willow, beech, and cellulose/sand granulates. Details of these fuels are given in Section 1.5 and more details including the bulk ash composition can be found in the separate report on the ECN work [2]. Typically, the feeding system of the lab-scale gasifier enabled a very stable operation, as is illustrated in Figure 4.2.
0
10
20
30
40
50
8:00 10:00 12:00 14:00 16:00
Con
cent
ratio
n [v
ol%
]
500
600
700
800
900Te
mpe
ratu
re [°
C]
WOB_O2 WOB_H2 WOB_CO WOB_CO2WOB_CH4 WOB_TI_3_4 WOB_TI_3_7 WOB_TI_3_8
Figure 4.2 Gas composition and gasifier operating temperatures during the experiments with different char/biomass ratios, see Section 4.3.1.
WOB TI_3_4 = bed temperature; WOB_TI_3_7 = freeboard temperature bottom; WOB_TI_3_8 = freeboard temperature top.
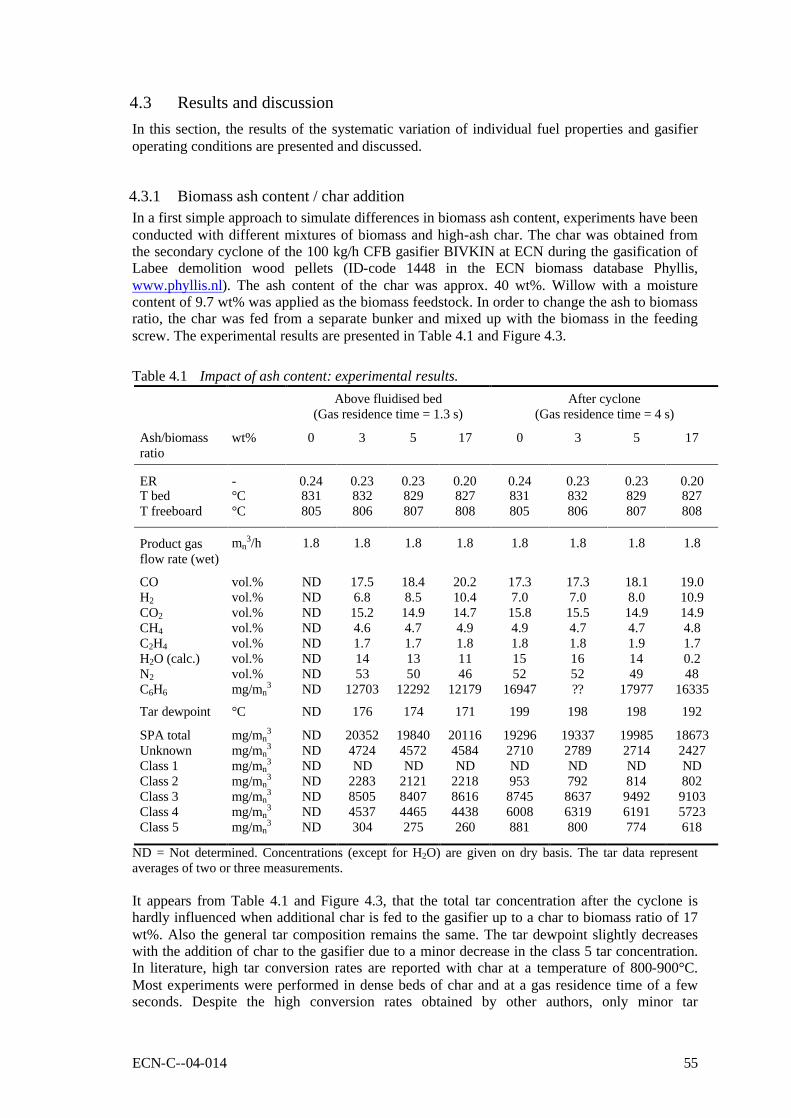
ECN-C--04-014 55
4.3 Results and discussion In this section, the results of the systematic variation of individual fuel properties and gasifier operating conditions are presented and discussed.
4.3.1 Biomass ash content / char addition In a first simple approach to simulate differences in biomass ash content, experiments have been conducted with different mixtures of biomass and high-ash char. The char was obtained from the secondary cyclone of the 100 kg/h CFB gasifier BIVKIN at ECN during the gasification of Labee demolition wood pellets (ID-code 1448 in the ECN biomass database Phyllis, www.phyllis.nl). The ash content of the char was approx. 40 wt%. Willow with a moisture content of 9.7 wt% was applied as the biomass feedstock. In order to change the ash to biomass ratio, the char was fed from a separate bunker and mixed up with the biomass in the feeding screw. The experimental results are presented in Table 4.1 and Figure 4.3.
Table 4.1 Impact of ash content: experimental results. Above fluidised bed
(Gas residence time = 1.3 s) After cyclone
(Gas residence time = 4 s)
Ash/biomass ratio
wt% 0 3 5 17 0 3 5 17
ER - 0.24 0.23 0.23 0.20 0.24 0.23 0.23 0.20 T bed °C 831 832 829 827 831 832 829 827 T freeboard °C 805 806 807 808 805 806 807 808
Product gas flow rate (wet)
mn3/h 1.8 1.8 1.8 1.8 1.8 1.8 1.8 1.8
CO vol.% ND 17.5 18.4 20.2 17.3 17.3 18.1 19.0 H2 vol.% ND 6.8 8.5 10.4 7.0 7.0 8.0 10.9 CO2 vol.% ND 15.2 14.9 14.7 15.8 15.5 14.9 14.9 CH4 vol.% ND 4.6 4.7 4.9 4.9 4.7 4.7 4.8 C2H4 vol.% ND 1.7 1.7 1.8 1.8 1.8 1.9 1.7 H2O (calc.) vol.% ND 14 13 11 15 16 14 0.2 N2 vol.% ND 53 50 46 52 52 49 48 C6H6 mg/mn
3 ND 12703 12292 12179 16947 ?? 17977 16335
Tar dewpoint °C ND 176 174 171 199 198 198 192
SPA total mg/mn3 ND 20352 19840 20116 19296 19337 19985 18673
Unknown mg/mn3 ND 4724 4572 4584 2710 2789 2714 2427
Class 1 mg/mn3 ND ND ND ND ND ND ND ND
Class 2 mg/mn3 ND 2283 2121 2218 953 792 814 802
Class 3 mg/mn3 ND 8505 8407 8616 8745 8637 9492 9103
Class 4 mg/mn3 ND 4537 4465 4438 6008 6319 6191 5723
Class 5 mg/mn3 ND 304 275 260 881 800 774 618
ND = Not determined. Concentrations (except for H2O) are given on dry basis. The tar data represent averages of two or three measurements. It appears from Table 4.1 and Figure 4.3, that the total tar concentration after the cyclone is hardly influenced when additional char is fed to the gasifier up to a char to biomass ratio of 17 wt%. Also the general tar composition remains the same. The tar dewpoint slightly decreases with the addition of char to the gasifier due to a minor decrease in the class 5 tar concentration. In literature, high tar conversion rates are reported with char at a temperature of 800-900°C. Most experiments were performed in dense beds of char and at a gas residence time of a few seconds. Despite the high conversion rates obtained by other authors, only minor tar

56 ECN-C--04-014
decomposition was obtained in the fluidised-bed experiments. Apparently, the char hold-up in the gasifier or the char activity was too low to obtain substantial tar conversion.
0
4000
8000
12000
16000
20000
24000
0 5 10 15 20Char/biomass ratio [wt%]
Con
cent
ratio
n [m
g/mn
3 ]
100
120
140
160
180
200
Dew
poin
t [°C
]
Class 2 Class 3 Class 4 Class 5 SPA total dewpoint
Figure 4.3 Impact of ash content: tar composition and dewpoint after the cyclone.
4.3.2 Biomass moisture content The moisture content of the biomass can vary significantly and is dependent on the pre-treatment of the biomass. The moisture content of fresh biomass from the forest is relatively high with a typical value of 55 wt%. When a trunk is stored in the forest, the moisture content can decrease to approx. 25 wt%. Additional drying of (chipped) biomass in a biomass dryer can lower the moisture content further. In this section, the influence of the biomass moisture content on tar formation is discussed. To simulate different moisture contents, dry biomass (willow) has been mixed off-line with water to obtain a biomass moisture content of 10-45 wt%. The extra heat necessary in the gasifier to evaporate the moisture was supplied by the trace heating of the gasifier. This made it possible to perform the experiments with different biomass moisture contents at a constant gasification temperature and a constant equivalence ratio. The experimental results are presented in Table 4.2 and Figure 4.4. Significant variations in product gas composition can be observed from Table 4.2 and Figure 4.4. The H2O, CO2, and H2 concentration increases and the CO concentration decreases with increasing moisture content (and increasing gas residence time). This is likely to be the result of the water gas shift reaction in which H2 and CO2 is produced by the conversion of CO with H2O. In the product gas after the cyclone, the total tar concentration decreases from 14 to 8 g/mn
3 when the fuel moisture content increases from 10 to 45 wt%. Also the individual tar classes decrease in concentration with increasing moisture content. Although the class 2 tar concentration decreases, complete elimination of class 2 tars was not obtained at the given gasification temperature of 800-825°C. The formation of heavy class 5 tar is suppressed and the tar dewpoint slightly drops when the fuel moisture content exceeds 30 wt%. Over the freeboard, the class 5 tar concentration increases leading to an increasing tar dewpoint.
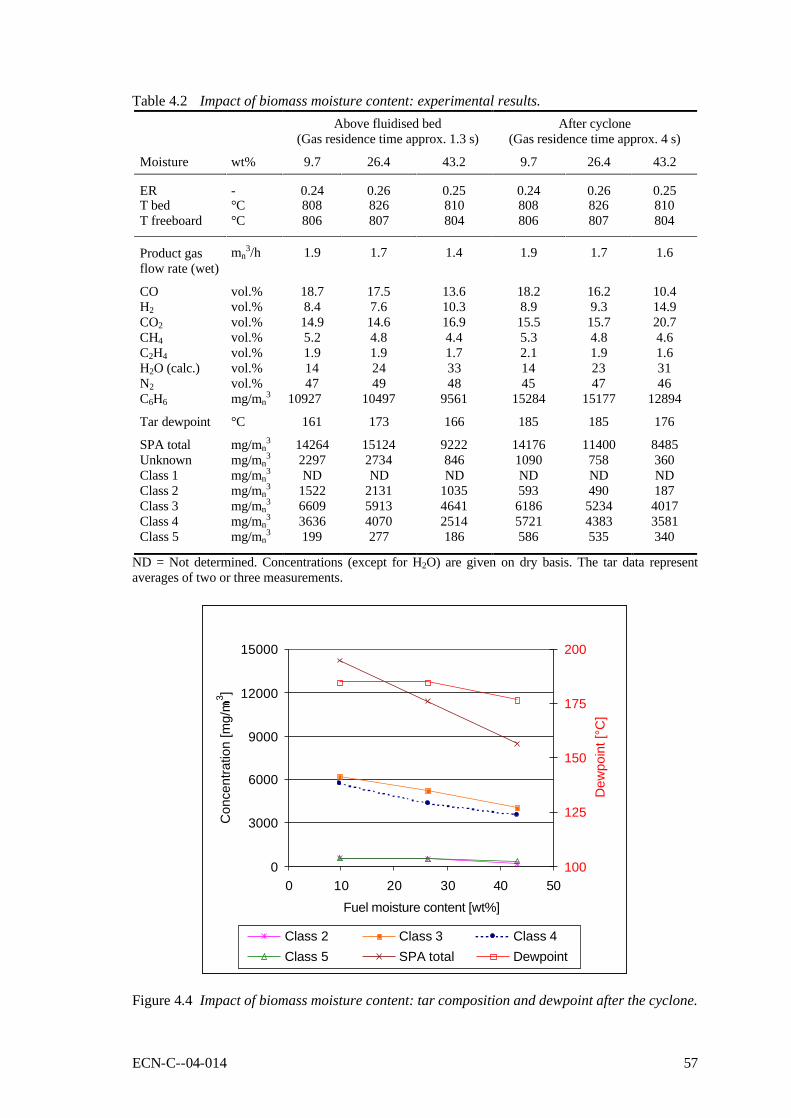
ECN-C--04-014 57
Table 4.2 Impact of biomass moisture content: experimental results. Above fluidised bed
(Gas residence time approx. 1.3 s) After cyclone
(Gas residence time approx. 4 s)
Moisture wt% 9.7 26.4 43.2 9.7 26.4 43.2
ER - 0.24 0.26 0.25 0.24 0.26 0.25 T bed °C 808 826 810 808 826 810 T freeboard °C 806 807 804 806 807 804
Product gas flow rate (wet)
mn3/h 1.9 1.7 1.4 1.9 1.7 1.6
CO vol.% 18.7 17.5 13.6 18.2 16.2 10.4 H2 vol.% 8.4 7.6 10.3 8.9 9.3 14.9 CO2 vol.% 14.9 14.6 16.9 15.5 15.7 20.7 CH4 vol.% 5.2 4.8 4.4 5.3 4.8 4.6 C2H4 vol.% 1.9 1.9 1.7 2.1 1.9 1.6 H2O (calc.) vol.% 14 24 33 14 23 31 N2 vol.% 47 49 48 45 47 46 C6H6 mg/mn
3 10927 10497 9561 15284 15177 12894
Tar dewpoint °C 161 173 166 185 185 176
SPA total mg/mn3 14264 15124 9222 14176 11400 8485
Unknown mg/mn3 2297 2734 846 1090 758 360
Class 1 mg/mn3 ND ND ND ND ND ND
Class 2 mg/mn3 1522 2131 1035 593 490 187
Class 3 mg/mn3 6609 5913 4641 6186 5234 4017
Class 4 mg/mn3 3636 4070 2514 5721 4383 3581
Class 5 mg/mn3 199 277 186 586 535 340
ND = Not determined. Concentrations (except for H2O) are given on dry basis. The tar data represent averages of two or three measurements.
0
3000
6000
9000
12000
15000
0 10 20 30 40 50Fuel moisture content [wt%]
Con
cent
ratio
n [m
g/mn
3 ]
100
125
150
175
200
Dew
poin
t [°C
]
Class 2 Class 3 Class 4Class 5 SPA total Dewpoint
Figure 4.4 Impact of biomass moisture content: tar composition and dewpoint after the cyclone.

58 ECN-C--04-014
Fuel with high moisture content needs extra energy for the evaporation of water and heating of the water vapour. In a large-scale gasifier, the extra heat can/will be generated by increasing the ER in the gasifier. This will lead to even lower tar concentrations. However, this may result also in a decrease in cold gas efficiency, and a drop in energy efficiency. Also the gas volume flow will increase due to both the increasing fuel moisture content and the increasing ER. This results in an increase in the size of unit operations downstream the gasifier. For many applications, the loss in energy efficiency and the increasing size of unit operations will probably outweigh the advantage of lower class 2 and class 5 tar concentrations. However, this might not be the case for indirect biomass co-combustion.
4.3.3 Biomass lignocellulose composition De-polymerisation of the three lignocellulose components of biomass is an important reaction step in the conversion of biomass. Since the monomer structures of lignin and cellulose or hemicellulose differ significantly, the final tar composition is expected to depend on the lignocellulose composition of the biomass. To investigate the influence of the lignocellulose composition, beech, willow and cellulose were used as feedstock for the gasifier. Fuel specifications are given in Section 1.5. The experimental results are presented in Table 4.3.
Table 4.3 Impact of lignocellulose composition: experimental results. Beech
24 wt% lignin Willow
18 wt% lignin Cellulose
0 wt% lignin
ER - 0.25 0.26 0.25 0.24 0.27 0.32 0.32 T bed °C 806 830*1 902 801*1 898 827 900 T freeboard °C 776 800 873 776 875 796 863
CO vol.% 16.7 16.8 16.8 16.3 16.0 15.4 15.3 H2 vol.% 8.5 8.4 11.2 8.0 11.4 8.9 11.7 CH4 vol.% 5.0 5.0 4.6 4.8 4.1 3.9 3,7 CO2 vol.% 15.7 15.6 15.4 16.3 15.8 15.7 15.7 N2 vol.% 51*2 52*2 49*2 53.7 52.8 52.0 49.9 H2O (calculated) vol% 15.6 15.5 12.9 16.2 11.7 10.8 8.8
Tar dewpoint °C 178 179 198 172 203 168 180
SPA total tar g/mn3 10.0 7.6 8.1 10.2 9.6 3.2 2.7
Unknown 1702 963 671 1941 1134 465 257 Class 1 mg/mn
3 ND ND ND ND ND ND ND Class 2 mg/mn
3 1089 471 27 1511 41 125 10 Phenol mg/mn
3 1015 425 12 1245 2 112 10 Class 3 (excl. toluene)
mg/mn3 1359 756 336 2369 562 430 145
Class 4 mg/mn3 5495 5024 6310 3967 6231 2011 1991
Class 5 mg/mn3 311 352 762 409 1070 213 333
ND = Not determined. Gas samples were taken after the cyclone. Concentrations (except for H2O) are given on dry basis. *1: carbon mass balance is for 92-93 % complete instead of 97-99 %. *2: estimated concentration based on mass balance. The composition of the permanent gases is comparable for the three fuels, except for the water concentration. For cellulose, the low water concentration is a result of the low moisture content of the feedstock. The total tar concentration for beech and willow is substantially higher (2-4 times) than for cellulose. The tar composition, however, seems to be comparable and only dependent on the gasification temperature. Despite the factor two or three difference in tar concentration, the tar dewpoint is only slightly lower for cellulose than for willow or beech.

ECN-C--04-014 59
The ER in the cellulose experiments is relatively high in comparison with the beech and willow experiments. For an appropriate evaluation and interpretation of the tar results, the influence of the ER on the total tar concentration should be explained first. Kinosha et al. [3] and Narvaez et al. [4] both investigated the influence of the ER on the total tar concentration in a fluidised-bed gasifier. According to Kinosha et al., the tar concentration decreases with 30 % when the ER increases from 0.22 to 0.32 at a bed temperature of 700°C. An increasing availability of oxygen, which reacts with volatiles in the oxidation zone (Figure 2.1) zone, is mentioned as the main reason for a decreasing tar concentration. Narvaez et al. reported a decrease in tar concentration of approximately a factor 2, when the ER increases from 0.25 to 0.32 at a bed temperature of 800°C. Based on these literature data, the high ER of 0.32 in the cellulose experiments cannot completely explain the difference in tar concentration between the cellulose, and willow or beech experiments. Based on the results obtained by Narvaez et al. and Kinosha et al. a factor 1.5 or 2 lower tar concentration would be expected due to the difference in ER. The factor 3 difference in tar concentration is therefore probably not only determined by the difference in ER. For the class 2 concentration, a difference would be expected based on the thermal conversion characteristics of the lignocellulose components. When lignin and cellulose, present in willow and beech, degrade by structural de-polymerisation, than the primary tars will have a molecular structure with similar functional groups as the monomer (as has been shown by Milne and Evans [5]). The molecular structure of a lignin monomer contains a hydroxide, alkyl and sometimes a methoxy group attached to a phenyl group. This molecular structure is a logical precursor for phenol. The monomer of cellulose is glucose and does not contain a phenyl group. The primary tars from cellulose and hemicellulose are furfural derivates and anhydrosugars like levoglucosan. The furfural and anhydrosugars decompose at a temperature of 800°C and form compounds that hardly contain oxygen resulting in a low class 2 tar concentration. Therefore, the difference in monomer structure between cellulose and lignin largely contributes to the explanation for the difference in class 2 concentration between willow or beech and cellulose. At 900°C, the decomposition rate of phenol (see Figure 3.2) is fast, which explains the low concentration of phenol at 900°C in all cases. Also differences in class 4 and 5 tar concentration between willow or beech and cellulose might be attributed to differences in lignocellulose composition of the feedstock. The class 4 and 5 tars are mostly PAH compounds. The molecular structure of lignin in beech or willow contains an aromatic functional group. Therefore, products from the thermal conversion of the lignin are logical precursors for the formation of these PAH compounds. On the other hand, cellulose does not contain these aromatic functional groups. However, it has been proven by several authors that PAH compounds may be formed from cellulose through other mechanisms, viz. via intermediates such as reduced sugars (e.g., levoglucosan [6]), unsaturated hydrocarbons [7], and furfural derivates together with acetaldehyde [8]). Nevertheless, the production of class 4 and 5 tars via these formation reactions is less pronounced. The alkyl substituted, class 3 tar concentration is for willow and beech a factor 3 higher than for cellulose. Since these tar compounds are only slightly contributing to the tar problems of wastewater production and do not cause problems of fouling, an extensive literature survey for the formation of alkyl substituted compounds has not been made. The alkyl-substituted compounds may directly be formed from primary or secondary tars but might also be formed by the attachment of alkyl groups to benzene. At a temperature of 900°C, the alkyl-substituted tars are thermally unstable and decompose, which explains the low class 3 tar concentration at 900°C.

60 ECN-C--04-014
Generally, the heavy PAH compounds in the product gas determine the dewpoint. Although the concentrations of the class 4 and 5 tars are a factor three lower for cellulose, the dewpoint is only 10-20°C lower. That means that fouling due to tar condensation will happen at similar process conditions. However, due to the lower tar concentrations, the amount of condensed tar species will be substantially lower for the cellulose case.
4.3.4 Gasifier operating conditions (temperature and gas residence time) Both the temperature as well as the gas residence time in a gasifier strongly influences the tar composition and concentration in the product gas. The tar composition is a result of multiple consecutive reactions. Each reaction has a certain reaction time for completion. The gas residence time determines how many, and to what extent, consecutive reactions can take place at a certain temperature. In this section, tar formation in relation to the gasification temperature and gas residence time is evaluated. Gas residence time To determine the relation between tar formation and gas residence time, gas sampling has been performed at different heights in the freeboard of the gasifier. By this sampling at different freeboard heights (as well as sampling after the cyclone), the gas residence time could be varied between 1.2 and 5.4 s. Experiments were done in two days with willow (moisture content 9.7 wt%) as the biomass feedstock. The experimental results presented in Table 4.4 and Figure 4.5.
Table 4.4 Impact of gas residence time: experimental results. Gas residence time s 1.2 2.0 3.7 4.1 4.9 5.4
ER - 0.22 0.22 0.22 0.22 0.23 0.23 T bed °C 827 828 828 828 828 828 T freeboard °C 808 812 810 809 805 805
CO vol.% 19.2 19.5 18.9 18.9 18.1 18.1 H2 vol.% 8.2 8.8 9.1 9.0 7.3 7.8 CO2 vol.% 14.7 14.5 14.8 15.0 14.6 15.4 CH4 vol.% 4.9 5.1 5.2 5.3 4.8 4.8 C2H4 vol.% 1.9 1.9 2.0 2.0 1.9 1.9 H2O (calc.) vol.% 14 13 14 13 13 13 N2 vol.% 49 49 49 49 51 51 C6H6 mg/mn
3 13754 15049 17317 18619 16829 18719
Tar dewpoint °C 177 187 195 198 193 198
SPA total mg/mn3 22629 20691 20854 18623 17524 17845
Unknown mg/mn3 4970 4073 3329 2292 2296 1920
Class 1 mg/mn3 ND ND ND ND ND ND
Class 2 mg/mn3 2589 1687 1026 865 872 739
Class 3 mg/mn3 9842 9137 9092 8646 7813 8198
Class 4 mg/mn3 4926 5344 6710 6018 5882 6120
Class 5 mg/mn3 303 449 697 803 661 869
ND = Not determined. Concentrations (except for H2O) are given on dry basis.

ECN-C--04-014 61
0
5000
10000
15000
20000
25000
1 2 3 4 5Gas residence time [s]
Con
cent
ratio
n [m
g/mn
3 ]
100
120
140
160
180
200
220
Dew
poin
t [°C
]
Class 2 Class 3 Class 4 Class 5SPA total dewpoint
Figure 4.5 Impact of gas residence time: tar concentration and dewpoint.
It appears that the gas residence time has a significant impact and that this impact is in general agreement with the trends derived from literature and described in Chapter 1. Due to combination of several gas phase reactions, like water gas shift (WGS), reforming, polymerisation and cracking reactions, the total tar concentration in the product gas decreases with increasing gas residence time. With respect to the individual tar classes, the class 4 and heavy class 5 tar concentration increase, while the class 2 and 3 tar concentrations decrease with increasing gas residence time. The tar dewpoint increases with increasing gas residence time, which is due mainly to the increase in class 5 tar concentration. However, the tar dewpoint seems to level off at a residence time longer than 3 s. Gasification temperature To determine the influence of the gasification temperature on tar formation, the gasification temperature has been increased from 750°C to 900°C with steps of 50°C. The equivalence ratio, ER, was kept constant. Willow with a moisture content of 7.8 wt% was used as the biomass feedstock The experimental results are presented in Table 4.5 and Figure 4.8. The gasification temperature appears to have a large impact, in particular on the tar composition. The class 2 tars are almost decomposed at a gasification temperature of 850°C. On the other hand, the class 4 and heavy class 5 tar concentration continuously increases with increasing temperature, leading to a continuous increase in tar dewpoint from 145°C at 730°C to 203°C at 900°C. The class 3 (light) tar compounds go through a maximum at 780-800°C, just as the total tar concentration. The mechanisms for the formation of heavy, class 5 tars are not fully understood. Two opposite mechanisms can determine the production of heavy tars with increasing temperature. On the one hand, class 5 tar compounds might be produced from the decomposition (cracking) of heavy/large class 1 tar. On the other hand, the class 5 tars can be a product from lighter (class 2, 3 and 4) tar compounds, due to PAH growth reactions. Both mechanisms will increase the class 5 tar concentration with increasing temperature. Since heavy, class 5 tar compounds dominate the tar dewpoint, which means that even at low concentrations these compounds start to condense at relatively high temperature, it is important to aim at a better understanding of the mechanisms of class 5 tar formation.

62 ECN-C--04-014
Table 4.5 Impact of gasification temperature: experimental results. Bed temperature °C 732 758 801 853 899
ER - 0.26 0.26 0.25 0.25 0.25 Freeboard temp. °C 686 728 776 823 878
CO vol.% 15.5 16.4 18.7 17.5 19.0 H2 vol.% 5.4 7.2 9.2 7.4 10.7 CO2 vol.% 16.3 16.4 15.6 15.3 15.0 CH4 vol.% 4.1 4.8 5.4 4.9 5.2 C2H4 vol.% 1.4 1.6 2.0 2.0 1.8 H2O (calc.) vol.% 13 13 11 12 10 N2 vol.% 58 58 55 53 50 C6H6 mg/mn
3 5884 8072 11746 14322 19005
Tar dewpoint °C 145 139 172 190 203
SPA total mg/mn3 16977 18303 18325 16041 13456
Unknown mg/mn3 3749 2380 1801 1369 1004
Class 1 mg/mn3 ND ND ND ND ND
Class 2 mg/mn3 3476 3403 1651 436 157
Class 3 mg/mn3 7923 9871 10497 8539 5018
Class 4 mg/mn3 1739 2522 3967 4906 5842
Class 5 mg/mn3 89 127 409 791 1434
ND = Not determined. Gas samples were taken after the cyclone. Concentrations (except for H2O) are given on dry basis. The tar data represent averages of two or three measurements.
0
4000
8000
12000
16000
20000
700 750 800 850 900
Temperature [°C]
Con
cent
ratio
n [m
g/mn
3 ]
100
150
200
250D
ewpo
int [
°C]
Class 2 Class 3 Class 4 Class 5SPA total Dewpoint
Figure 4.6 Impact of gasification temperature: tar concentration and dewpoint.
The concentration and composition of class 1 tar has not been considered thus far. However, the GC-undetectable class 1 tar may contain very heavy tar compounds (larger than coronene) with a high dewpoint. In that case, not to include these compounds in the dewpoint calculation leads to an underestimation of the tar dewpoint. Therefore, it was decided to repeat the gasification temperature variation experiments, now paying specific attention to the formation and fate of

ECN-C--04-014 63
class 1 tars. To this purpose, tar measurement was conducted with the “advanced” Guideline method, meaning that the gravimetric tar fraction was redissolved and analysed for class 2-5 tars to obtain the “true” class 1 tar fraction. In addition, some attempts were made to obtain a qualitative impression of the composition of the class 1 tar fraction by using HPLC analysis. Furthermore, it was decided to conduct the experiments in a more realistic manner by simultaneously changing the gasification temperature and the equivalence ratio (ER) in agreement with full-scale gasifier operating practice. Gasification temperature with variation in ER On industrial scale, the gasification temperature is determined by the equivalence ratio (ER) in the gasifier. The air inlet temperature, heat losses in the gasifier, the carbon conversion and the biomass moisture content determine the ER - temperature relation for a gasifier. On laboratory scale, the high heat losses would result in an unrealistic high ER. To compensate for the heat losses, lab-scale gasifiers are electrically heated with trace heating, which allows decoupling of ER and gasification temperature. In order to obtain results that are more representative for gasifiers at commercial scale, the ER - temperature relation for a 50 MWth atmospheric, air-blown fluidised-bed gasifier, operated on woody biomass, has been determined and was used for the experiments. This means that the airflow was increased according to this relation when the gasification temperature was increased. The following assumptions were made for the calculation of the ER - temperature relation: • Commercial scale: 50 MWth • Carbon conversion = 93 % • Air pre-heating = 100°C • Heat loss = 2.7 % (LHV basis) • Biomass moisture content = 9.5 wt% • Gas composition calculated with an in-house, semi-empirical gasification model.
Table 4.6 Impact of gasification temperature at varying ER: experimental results. Bed temperature °C 759 807 854 906 955
ER - 0.23 0.24 0.26 0.27 0.29 Freeboard temp. °C 721 770 823 874 924
CO vol.% 16.5 16.3 15.2 16.0 17.0 H2 vol.% 6.9 8.0 10.4 11.4 12.3 CO2 vol.% 16.2 16.3 16.6 15.8 14.8 CH4 vol.% 4.9 4.8 4.5 4.1 3.8 C2H4 vol.% 1.7 1.9 1.7 1.3 0.7 N2 vol.% 55 54 53 53 53 C6H6 mg/mn
3 6890 8979 10897 12338 12276
Tar dewpoint °C 194 188 195 207 220
Guideline total mg/mn3 54058 26205 19613 14398 11843
Unknown mg/mn3 14527 6951 5063 3177 2452
Class 1 mg/mn3 17504 6367 4173 2152 1865
Class 2 mg/mn3 7301 1579 186 41 17
Class 3 mg/mn3 7015 4967 3314 1596 541
Class 4 mg/mn3 6900 5413 5912 6231 5401
Class 5 mg/mn3 466 492 753 1070 1522
Gas samples were taken after the cyclone. Concentrations are given on dry basis. The tar data correspond to a single measurement.

64 ECN-C--04-014
During the fluidised-bed gasification experiments, gas analysis and sampling were performed just above the sand bed and after the cyclone. The tar dewpoint was calculated from the GC-detectable tar fraction and, therefore, may be an underestimate of the actual tar dewpoint. The experimental results are presented in Table 4.6 and Figures 4.7 and 4.8.
0
10000
20000
30000
40000
50000
60000
750 800 850 900 950
Temperature [°C]
Tar
con
cent
ratio
n [m
g/mn3 ]
100
120
140
160
180
200
220
Dew
poin
t [°C
]
Total tar Total GC detectable Total class 1 Tar dew point [°C]
Figure 4.7 Impact of gasification temperature at varying ER: tar concentration and dewpoint just above the sand bed.
0
10000
20000
30000
40000
50000
60000
750 800 850 900 950Temperature [°C]
Tar
con
cent
ratio
n [m
g/mn3 ]
100
120
140
160
180
200
220
240
Dew
poin
t [°C
]
Total tar Total GC detectable Total class 1 Tar dew point [°C]
Figure 4.8 Impact of gasification temperature at varying ER: tar concentration and dewpoint
after the cyclone.
Figure 4.8 reveals a decrease in total tar concentration in the product gas after the cyclone by a factor of five, when the gasification temperature is increased from 750 to 950°C. Both the class 1 tar concentration as well as the GC-detectable tar concentration (tar with a molecular mass between toluene and coronene) decreases in concentration with increasing gasification
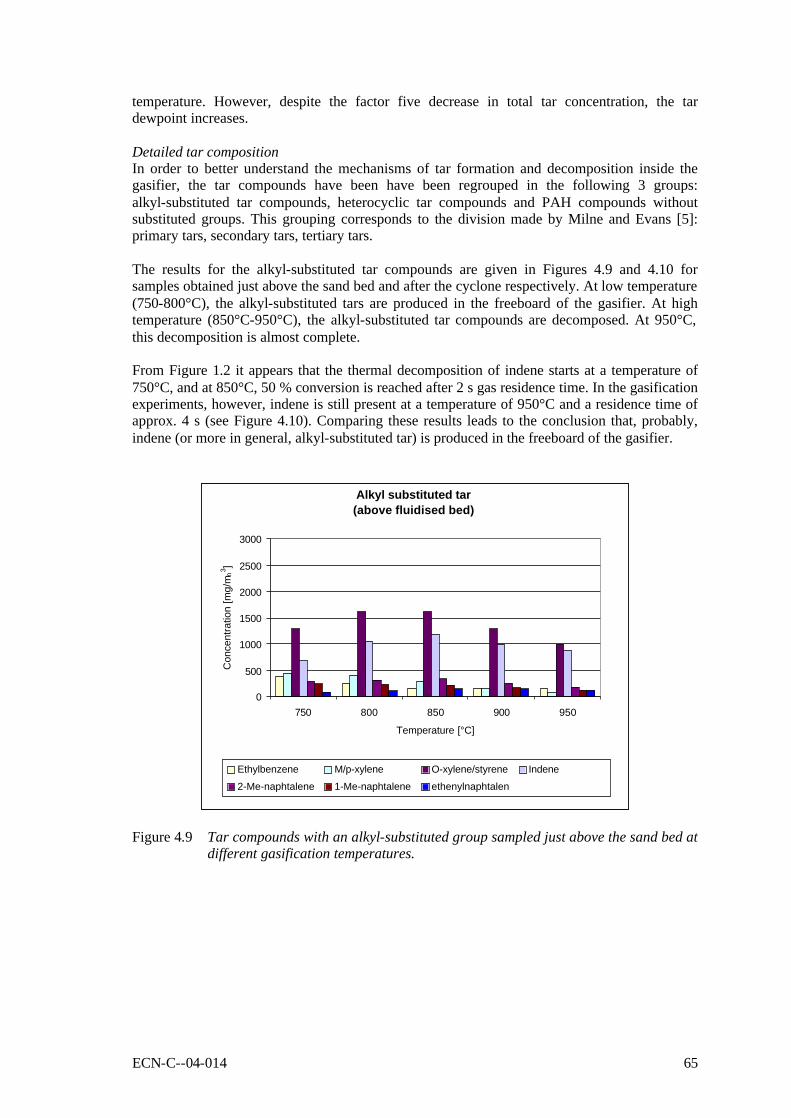
ECN-C--04-014 65
temperature. However, despite the factor five decrease in total tar concentration, the tar dewpoint increases. Detailed tar composition In order to better understand the mechanisms of tar formation and decomposition inside the gasifier, the tar compounds have been have been regrouped in the following 3 groups: alkyl-substituted tar compounds, heterocyclic tar compounds and PAH compounds without substituted groups. This grouping corresponds to the division made by Milne and Evans [5]: primary tars, secondary tars, tertiary tars. The results for the alkyl-substituted tar compounds are given in Figures 4.9 and 4.10 for samples obtained just above the sand bed and after the cyclone respectively. At low temperature (750-800°C), the alkyl-substituted tars are produced in the freeboard of the gasifier. At high temperature (850°C-950°C), the alkyl-substituted tar compounds are decomposed. At 950°C, this decomposition is almost complete. From Figure 1.2 it appears that the thermal decomposition of indene starts at a temperature of 750°C, and at 850°C, 50 % conversion is reached after 2 s gas residence time. In the gasification experiments, however, indene is still present at a temperature of 950°C and a residence time of approx. 4 s (see Figure 4.10). Comparing these results leads to the conclusion that, probably, indene (or more in general, alkyl-substituted tar) is produced in the freeboard of the gasifier.
Alkyl substituted tar (above fluidised bed)
0
500
1000
1500
2000
2500
3000
750 800 850 900 950
Temperature [°C]
Con
cent
ratio
n [m
g/m
n3 ]
Ethylbenzene M/p-xylene O-xylene/styrene Indene
2-Me-naphtalene 1-Me-naphtalene ethenylnaphtalen
Figure 4.9 Tar compounds with an alkyl-substituted group sampled just above the sand bed at different gasification temperatures.
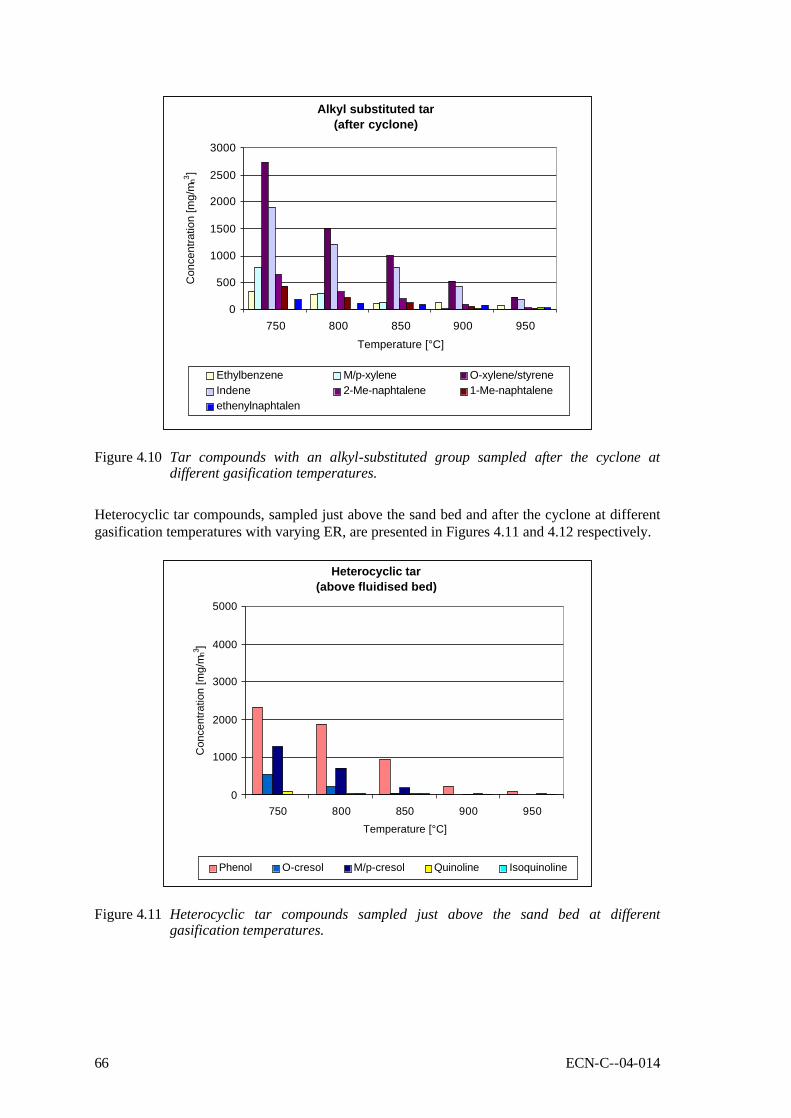
66 ECN-C--04-014
Alkyl substituted tar (after cyclone)
0
500
1000
1500
2000
2500
3000
750 800 850 900 950Temperature [°C]
Con
cent
ratio
n [m
g/m
n3 ]
Ethylbenzene M/p-xylene O-xylene/styreneIndene 2-Me-naphtalene 1-Me-naphtaleneethenylnaphtalen
Figure 4.10 Tar compounds with an alkyl-substituted group sampled after the cyclone at different gasification temperatures.
Heterocyclic tar compounds, sampled just above the sand bed and after the cyclone at different gasification temperatures with varying ER, are presented in Figures 4.11 and 4.12 respectively.
Heterocyclic tar(above fluidised bed)
0
1000
2000
3000
4000
5000
750 800 850 900 950Temperature [°C]
Con
cent
ratio
n [m
g/m
n3 ]
Phenol O-cresol M/p-cresol Quinoline Isoquinoline
Figure 4.11 Heterocyclic tar compounds sampled just above the sand bed at different
gasification temperatures.

ECN-C--04-014 67
Heterocyclic tar (after cyclone)
0
1000
2000
3000
4000
5000
750 800 850 900 950Temperature [°C]
Con
cent
ratio
n [m
g/m n
3 ]
Phenol O-cresol M/p-cresol Quinoline Isoquinoline
Figure 4.12 Heterocyclic tar compounds sampled after the cyclone at different gasification temperatures.
At a temperature of 750°C, heterocyclic tars are produced in the freeboard of the gasifier. At 800°C, the conversion rate becomes appreciable, resulting in a decrease in heterocyclic tar concentrations in the freeboard. Already at a temperature of 850°C and a gas residence time of approx. 4 s (sampling after the cyclone), the heterocyclic tars are completely decomposed. At a residence time of approx. 1.3 s (sampling just above the bed), the temperature should be increased to 950°C to obtain the same effect. Figures 4.13 and 4.14 show the formation of PAH compounds without substituted groups as a function of gasification temperature. It appears that most PAH compounds are formed in the freeboard at a temperature of 750-900°C. Above a temperature of 900°C, the concentration of large PAH compounds (pyrene-coronene) further increases, but the concentration of small PAH compounds like biphenyl and phenanthrene levels off or starts to decrease. Similar effects can be observed with increasing residence time. The naphthalene concentration (not shown because of its high values) continuously increases from 0.5 to 3.5 g/mn
3 with increasing temperature at a residence time of 1.3 s. At a residence time of 4 s, the naphthalene concentration increases from 2 g/mn
3 at 750°C to 3.5 g/mn3 at 900°C, and levels of to 3 g/mn
3 at 950°C.
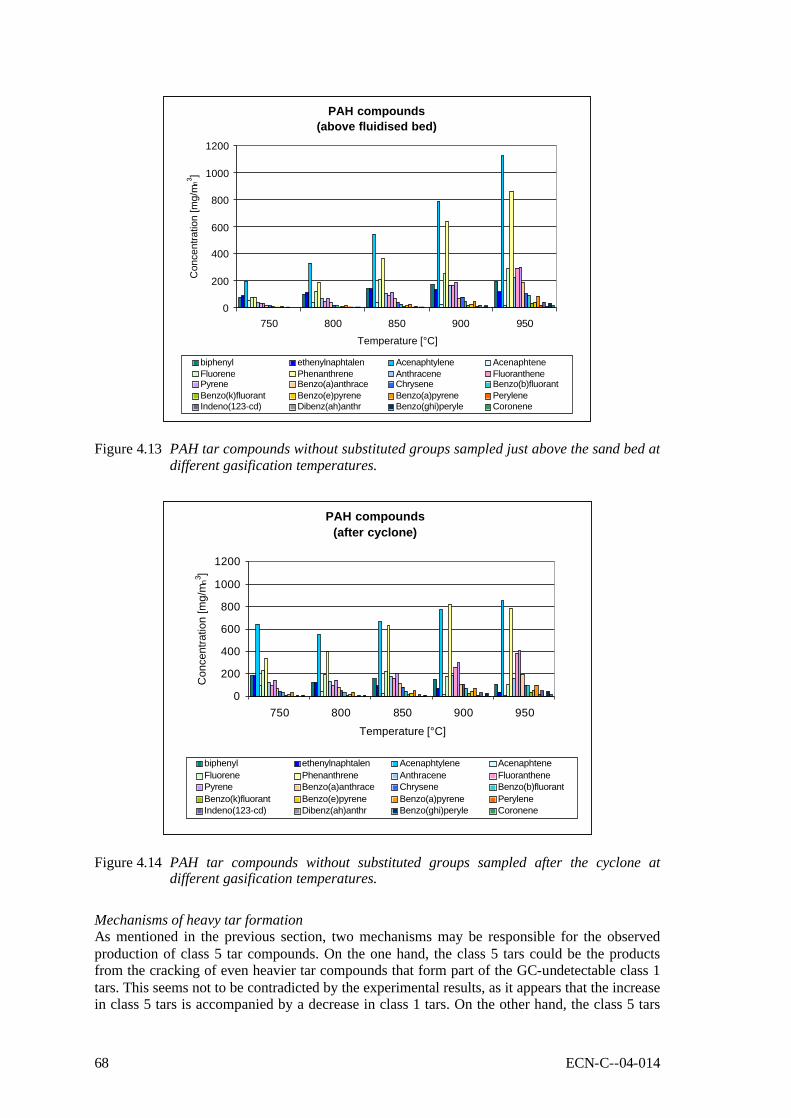
68 ECN-C--04-014
PAH compounds (above fluidised bed)
0
200
400
600
800
1000
1200
750 800 850 900 950Temperature [°C]
Con
cent
ratio
n [m
g/m
n3 ]
biphenyl ethenylnaphtalen Acenaphtylene AcenaphteneFluorene Phenanthrene Anthracene FluoranthenePyrene Benzo(a)anthrace Chrysene Benzo(b)fluorantBenzo(k)fluorant Benzo(e)pyrene Benzo(a)pyrene PeryleneIndeno(123-cd) Dibenz(ah)anthr Benzo(ghi)peryle Coronene
Figure 4.13 PAH tar compounds without substituted groups sampled just above the sand bed at different gasification temperatures.
PAH compounds(after cyclone)
0
200
400
600
800
1000
1200
750 800 850 900 950Temperature [°C]
Con
cent
ratio
n [m
g/m
n3 ]
biphenyl ethenylnaphtalen Acenaphtylene AcenaphteneFluorene Phenanthrene Anthracene FluoranthenePyrene Benzo(a)anthrace Chrysene Benzo(b)fluorantBenzo(k)fluorant Benzo(e)pyrene Benzo(a)pyrene PeryleneIndeno(123-cd) Dibenz(ah)anthr Benzo(ghi)peryle Coronene
Figure 4.14 PAH tar compounds without substituted groups sampled after the cyclone at different gasification temperatures.
Mechanisms of heavy tar formation As mentioned in the previous section, two mechanisms may be responsible for the observed production of class 5 tar compounds. On the one hand, the class 5 tars could be the products from the cracking of even heavier tar compounds that form part of the GC-undetectable class 1 tars. This seems not to be contradicted by the experimental results, as it appears that the increase in class 5 tars is accompanied by a decrease in class 1 tars. On the other hand, the class 5 tars

ECN-C--04-014 69
could also be the products of PAH growth reactions involving small PAH compounds or unsaturated hydrocarbons. The PAH growth reactions have been studied extensively with respect to soot formation in flames. Light (class 4) PAH compounds can recombine to produce one larger PAH compound. Biphenyl is a clear example of this growth mechanism, being the result of the recombination of two phenyl (benzene) radicals. Unsaturated C2-C4 hydrocarbons can also form PAH compounds in isomerisation reactions. Isomerisation reactions yield PAH compounds without single C-C-bonds between the phenyl groups. Pyrene, benzoghi)perylene and coronene are examples of isomerisation products. Ethylene and acetylene are examples of unsaturated hydrocarbons, which are present at low concentration in fluidised-bed gasifier product gas. In order to verify the occurrence and importance of class 5 tar formation through the decomposition of class 1 tars, a HPLC analysis of the gravimetric tar fraction has been performed. This HPLC analysis allowed a qualitative analysis of PAH compounds with a molecular mass larger than coronene (i.e., tars heavier than class 5 tars). Figures 4.15 and 4.16 give the response of the UV detector of the HPLC analyser as function of the retention time, starting after the elution of coronene at a retention time of 10 minutes. The retention time of a certain tar compound in the HPLC diagram is dependent on its polarity. A compound with high polarity, like phenol, will have a short retention time, while a compounds with a low polarity, like coronene, will have a long retention time. The polarity of aromatic compounds decreases with increasing number of aromatic rings. The response signal of the detector is linear dependent on the concentration of the compound in the gravimetric tar sample, according to the law of Lambert Beer. When the concentration of the compound increases the peak area will also increase, generally resulting in higher peaks. The response is also dependent on the molecular structure of a compound. The response factor as well as the retention time for each compound must be determined by calibration. In this limited, first effort, this calibration has not been performed yet. However, the HPLC analysis results can still be used to obtain qualitative results. The ‘hill’ in the HPLC diagrams of Figures 4.15 and 4.16 is due to the presence of a fairly high concentration of light hydrocarbons in the gravimetric tar sample. Generally, these hydrocarbons have a lower retention time than coronene. Due to the high concentration, however, the hydrocarbons elute also at higher retention time, disturbing the diagram. The peaks on the ‘hills’ are of most interest, since they indicate the presence of hydrocarbons with a lower polarity than coronene. The absence of these peaks in the HPLC diagrams for the gravimetric tar samples taken at 750-800°C is an indication that at low temperature, large PAH compounds are hardly present in the tar sample. Above 850°C, the peaks increase considerably in height with increasing gasifier temperature as well as gas residence time. Apparently, above 850°C large PAH compounds (larger than coronene) are produced by the PAH growth reaction mechanism. The HPLC analysis results provide evidence that the PAH growth mechanism mainly determines the production of class 5 tars. This mechanism is consistent with the mentioned PAH growth mechanism published by Bruinsma and Moulijn [19]. The class 4 tars are intermediate compounds in this mechanism. That means that large compounds, which exhibit a high dewpoint at relatively low concentration, will be produced to a larger extent with increasing temperature.
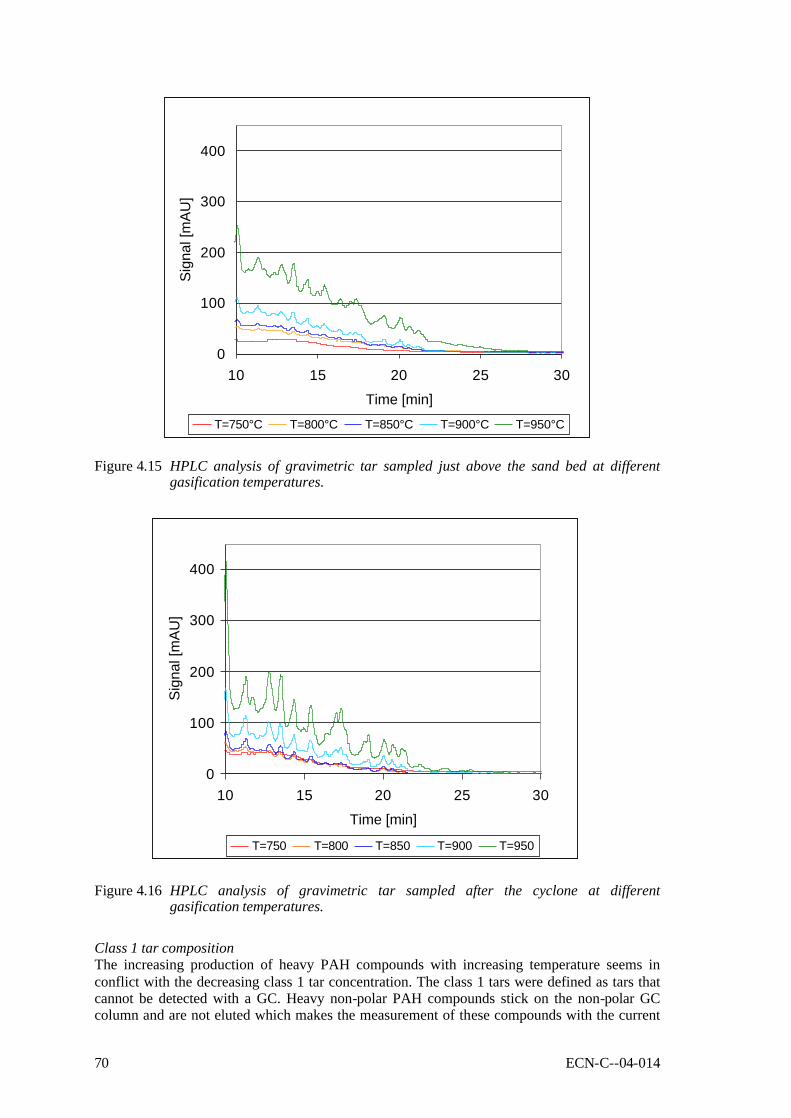
70 ECN-C--04-014
0
100
200
300
400
10 15 20 25 30
Time [min]
Sig
nal [
mA
U]
T=750°C T=800°C T=850°C T=900°C T=950°C
Figure 4.15 HPLC analysis of gravimetric tar sampled just above the sand bed at different
gasification temperatures.
0
100
200
300
400
10 15 20 25 30
Time [min]
Sig
nal [
mA
U]
T=750 T=800 T=850 T=900 T=950
Figure 4.16 HPLC analysis of gravimetric tar sampled after the cyclone at different
gasification temperatures.
Class 1 tar composition The increasing production of heavy PAH compounds with increasing temperature seems in conflict with the decreasing class 1 tar concentration. The class 1 tars were defined as tars that cannot be detected with a GC. Heavy non-polar PAH compounds stick on the non-polar GC column and are not eluted which makes the measurement of these compounds with the current

ECN-C--04-014 71
GC method not possible. It was expected that these non-polar heavy PAH compounds would dominate the class 1 tar composition. However, the high concentration of class 1 tars at low gasification temperatures seems not in agreement with the low concentration of heavy PAH compounds at these temperatures. It appears that the class 1 tar comprises a second group of tar compounds. It is postulated that this second group consists of primary and secondary tars according to the classification of Evans and Milne (see Chapter 1). The composition of primary tars is close to the composition of the biomass itself, and is determined by the monomer structures of the lignocellulose components in the biomass. Secondary tars are decomposition products of primary tars. Due to the high oxygen (and nitrogen) content of woody biomass, the primary and secondary tars will both have a relatively high oxygen (and nitrogen) content as well. Furthermore, the primary and secondary tars, containing hetero-elements, generally have a high polarity, which makes them difficult to analyse with both GC-FID equipped with a non-polar column and with the applied HPLC method. To verify this hypothesis, the gravimetric tars have been subjected to an ultimate analysis. The results are presented in Tables 4.7 and 4.8 for tar samples taken just above the sand bed and after the cyclone respectively. The element composition of the class 1 tar fraction has been obtained by subtracting the element composition of the GC-detectable tar fraction in the gravimetric tars from the element composition of the gravimetric tars.
Table 4.7 Ultimate analysis of gravimetric tars and the GC-undetectable fraction (class 1 tar), sampled just above the sand bed.
Bed temperature (°C)
O grav.
O class 1
C grav.
C class 1
H grav.
H class 1
N grav.
N class 1
759 15 24 56 62 5 6 4 4 807 12 21 70 58 6 7 6 7 854 11 22 70 54 7 9 5 7 906 8 22 68 59 5 6 4 7 955 4 13 73 74 5 6 2 3
Element concentrations in wt%.
Table 4.8 Ultimate analysis of gravimetric tars and the GC-undetectable fraction (class 1 tar), sampled after the cyclone.
Bed temperature (°C)
O grav.
O class 1
C grav.
C class 1
H grav.
H class 1
N grav.
N class 1
759 12 21 68 59 6 7 5 13 807 11 27 68 50 6 7 4 16 854 8 28 71 51 6 8 4 13 906 6 35 75 45 5 6 2 14 955 4 29 78 38 5 8 3 25
Element concentrations in wt%. The results should be interpreted with precautions, because the element weight fractions total between 80 and 95 wt%. In order to find the missing 5-20 wt%, the ash concentration in the gravimetric tar sample was determined from the 759°C gravimetric tar sample. However, the ash content appeared to be very low (0.25 wt%) and cannot explain the missing 5-20 wt%.

72 ECN-C--04-014
Nevertheless, the tables show that the oxygen content of the gravimetric tars decreases with increasing temperature and with increasing gas residence time. At a gasifier bed temperature of 955°C the oxygen content has almost disappeared. The decrease in oxygen content for the GC-detectable tars is even more pronounced, as can be seen from Figures 5.13 and 5.14. After the cyclone, the class 2 tars have disappeared almost completely at a temperature of 850°C. The oxygen content in the class 1 tars is higher than in the gravimetric tars in all cases, and remains constant or even increases with increasing bed temperature. Apparently, the oxygen content in the GC-detectable tar fraction of the gravimetric tars is considerably lower than in the class 1 tars. The increase in oxygen content in the freeboard is not well understood. In conclusion, class 1 tar indeed appears to contain a substantial fraction of hetero-elements containing compounds, which are likely to be primary or secondary tars. This also implies that the water solubility of tars may be underestimated considerably when the evaluation is based on the class 2 tar content only.
4.3.5 Tar production in BFB vs. CFB gasifiers In this section, the influence of the fluidisation regime on the tar composition will be evaluated. The experiments in the previous sections were all conducted in a bubbling-fluidised-bed gasifier. For the gasification of biomass on commercial scale, both bubbling-fluidised-bed (BFB) and circulating-fluidised-bed (CFB) gasifiers can be selected. Knowledge about the influence of the type of fluidised-bed gasifier on the tar composition is essential for the translation of the experimental results presented in this report to commercial-scale installations. The difference between a BFB and CFB gasifier lies mainly in the gas velocity and the resulting axial solids distribution. The BFB gasifier is characterised by a dense bed with an “empty” freeboard. A CFB gasifier is characterised by a dense and a lean bed, and does not have a distinct solids separation between the freeboard and the bed. The solids promote a uniform axial temperature distribution. With the absence of solids in the freeboard of the BFB gasifier, the temperature in the freeboard can drop due to endothermic reactions. The tar composition in the product gas strongly depends on the axial temperature profile, but may also depend on the hydrodynamics in the gasifier in a different way. In a CFB gasifier, biomass particles can be carried over the top. This can result in pyrolysis products at the exit of the gasifier, which experienced a shorter residence time than would be expected based on the average gas residence time in the gasifier. In a BFB gasifier, biomass particles cannot reach the exit of the gasifier due to the presence of a freeboard. Although the biomass particles are mixed up in the bed, the long residence time in the freeboard equilibrates the differences in residence time of the pyrolysis gas in the fluidised bed itself. To get an impression of the relation between tar production in BFB and CFB gasifiers, the experimental data obtained from the 1 kg/h BFB gasifier WOB have been compared to data obtained from the 100 kg/h CFB gasifier BIVKIN at ECN. Details of this gasifier can be found elsewhere [9]. In the CFB gasifier, Labee demolition wood pellets (ID-code 1448 in the ECN biomass database Phyllis, www.phyllis.nl) were used as feedstock. In Figure 4.17, tar class concentrations in both gasifiers are presented as fractions of the total tar concentration. The data from both gasifiers show a similar temperature dependency. The class 4 and class 5 fractions increase, and the class 2 tar fraction decreases with increasing temperature. The contribution of the remaining tars (class 3 and unknowns, not shown) decreases from approx. 50 wt% to 20 wt%, when the gasification temperature increases from 750°C to 950°C. When the BFB (WOB) data are analysed in more detail, than three different curves can actually be distinguished for the class 4 fraction. The large closed triangles belong to samples taken just above the bed with willow as feedstock. The upper small closed triangles belong to samples

ECN-C--04-014 73
taken after the cyclone with beech as feedstock. The small closed triangles in between belong to samples taken after the cyclone with willow as feedstock. For the class 2 and 5 tars the subdivision can only be made for samples taken above the bed and after the cyclone. It appears that the tar composition of samples taken at the outlet of the CFB gasifier is more comparable to samples taken after the cyclone of the BFB gasifier than to samples taken just above the sand bed. The gas residence time, on the other hand, is in the CFB gasifier with approximately 1 s comparable to the gas residence time just above the bed of the BFB gasifier. From this, it would be expected that the composition at the outlet of the CFB-gasifier would match with the composition just above the sand bed in the BFB-gasifier.
0
20
40
60
80
100
700 800 900 1000Temperature [°C]
Frac
tion
of to
tal t
ar [%
]
Class 2 WOB Class 4 WOB Class 5 WOBClass 2 BIVKIN Class 4 BIVKIN Class 5 BIVKIN
Figure 4.17 Tar composition vs. gasification temperature for the BFB (WOB) and CFB (BIVKIN) gasifiers at ECN.
The gasifiers were operated on woody biomass. WOB data were obtained just above the sand bed (large closed symbols) and after the cyclone (small closed symbols).
This apparent contradiction may be due to a temperature drop in the freeboard of the BFB gasifier and/or differences in feedstock. The temperature drop in the freeboard can be as high as 30°C. Such a temperature drop can significantly influence the tar composition, as has been discussed extensively in the previous Section. The impact of the temperature drop on the tar composition is similar to the impact of a longer gas residence time. Evidence of a larger (pyrolysis) gas residence time distribution in the CFB gasifier cannot be found in Figure 5.17. A larger residence time distribution would result in a larger class 2 contribution and a smaller class 4 and 5 contribution, but the opposite has been observed. However, this was probably also not to be expected for the rather large Labee fuel pellets. It is most likely that they stay in the bottom section of the CFB-gasifier during the main part of the pyrolysis phase. In conclusion, it appears that the tar data obtained in the lab-scale BFB-gasifier are quite representative for a CFB-gasifier, provided that differences in gasification temperature and gas

74 ECN-C--04-014
residence time are taken into account, and provided that the CFB-gasifier is operated on relatively large/heavy fuel particles. The previous sections in this report provide data to account for the differences in gasification temperature and gas residence time. Furthermore, it is indicated qualitatively how the tar composition in the product gas of a CFB-gasifier may change, when smaller, lighter fuel particles are fed that do not stay in the bottom section during the pyrolysis phase.
4.4 Conclusions The overall objective of the project has been to assist designers and operators of fluidised-bed biomass gasification based systems by providing detailed data concerning the impact of fuel properties and gasifier operating conditions on the resulting tar content and composition, and concerning the underlying mechanisms. The tar content and composition have been interpreted in terms of their impact on the performance of downstream equipment using a dedicated tar classification system. In this respect, water solubility and condensation behaviour, expressed in terms of the tar dewpoint, were identified as the most important tar properties. Attention has been paid mostly to atmospheric-pressure, air-blown bubbling-fluidised-bed (BFB) gasification of woody biomass, but circulating-fluidised-bed (CFB) gasification was addressed as well. In the experimental programme, the impact of three fuel properties (ash content, moisture content and lignocellulose composition) and two operating conditions (gasification temperature and gas residence time) has been determined. In general, these parameters were varied independently, i.e. while keeping the others constant. Also the equivalence ratio ER was mostly kept constant, which was made possible by the trace heating on the wall of the lab-scale gasifier. Variation of the ash content in the bed, simulated by co-feeding high-ash char (approx. 40 wt% ash), had a negligible impact up to the maximum tested char/biomass ratio of 17 wt%. An increase in moisture content from 10 to 45 wt%, simulated by mixing dry biomass off-line with water, led to a decrease in total tar content from 14 to 8 g/mn
3. Also all the individual tar classes showed a clear decrease. However, the highly water-soluble heterocyclic compounds (class 2 tars) could not be eliminated completely at the given gasification temperature of 800-825°C and approx. 4 s gas residence time, and the tar dewpoint only showed a slight decrease. The lignocellulose composition seems to have some effect on the total tar concentration, while having no significant effect on the tar composition. Experiments with a fuel prepared from pure cellulose gave lower tar concentrations than experiments with willow and beech. Despite the lower tar concentrations, the tar dewpoint remained nearly the same. Increasing the gasification temperature from 750 to 900°C at constant ER appeared to have a large impact on tar formation, in particular on the tar composition. The class 2 tars were decomposed almost completely at 850°C and higher. On the other hand, the 2-3 ring PolyAromatic Hydrocarbon (PAH) compounds (class 4) and the 4-7 ring PAH compounds (class 5) concentration continuously increased with increasing temperature, leading to a continuous and substantial increase in tar dewpoint. The class 3 light aromatic compounds went through a maximum at 780-800°C, just as the total tar concentration. Since it was realised that in an actual, industrial-scale gasifier, there is a coupling between the gasification temperature and the equivalence ration ER, additional experiments were conducted with a simultaneous, coupled variation of the gasification temperature and ER (higher ER to get higher temperature). These experiments gave a strong decrease in total tar over the temperature range of 750-950°C. However, here again the tar dewpoint showed an increase due to an increase in heavy PAH compounds (class 5 tar), despite the diluting effect of a higher ER. A more detailed analysis, focussing on the heavy tar fraction in particular, revealed that the heavy

ECN-C--04-014 75
PAH compounds are formed by dimerisation reactions of two PAH compounds or by cyclisation or polymerisation reactions of unsaturated C2-C4 hydrocarbons like acetylene and ethylene. These latter compounds are produced in the decomposition of aromatic as well as linear hydrocarbons. Finally, increasing the gas residence time (in the freeboard of a BFB gasifier) was found to have a similar, but much smaller, effect than increasing the gasification temperature. The reported results of lab-scale BFB gasification were found to be representative for CFB gasification as well, provided that differences in gasification temperature and gas residence time (distribution) are taken into account. The report contains data to account for these differences. Given the important role of the class 1 tar fraction and its complex composition, it is recommended to put more effort in the determination of the composition of this tar class in future work.
4.5 Acknowledgements The work presented in this report would not have been possible without the enthusiastic and skilful contributions of personnel from the units ECN Biomass and ECN Clean Fossil Fuels. In particular, we would like to acknowledge our former colleague, John Neeft, who is now with the Netherlands Agency for Energy and the Environment Novem. He played a crucial role in the initiation of the tar-related activities at ECN, the development and application of tar measurement procedures, and in the design of the experimental programme. Furthermore, we would like to thank Herman Bodenstaff and Ruud Wilberink for their skilful operation of the WOB gasifier, and Johan Kuipers and Ben van Egmond for performing most of the tar analyses. Patrick Bergman made valuable contributions to the design of the experimental programme and the evaluation of the results.
4.6 References [1] Neeft, J.P.A., and Berends, R.H.: “Inventariserende studie - deel 1: Primaire maatregelen
(voorkomen teervorming of in-bed verwijderen) ter verlaging van teerproductie bij wervelbedvergassers”. ECN-TNO report, 2001 (in Dutch).
[2] Paasen, S.V.B. van, and Kiel, J.H.A.: “Tar formation in a fluidised-bed gasifier - impact of fuel properties and operating conditions”. Report ECN-C--04-013, ECN, Petten, 2004.
[3] Kinoshita, C.M., Wang, Y., and Zhou, J.: “Tar formation under different biomass gasification conditions”. J. Anal. Appl. Pyrolysis, vol.29(2), pp.169-181, 1994.
[4] Narváez, I., Orío, A., Corella, J., and Aznar, M.P.: “Biomass gasification with air in an atmospheric bubbling fluidized bed. Effect of six operational variables on the quality of the produced raw gas”. Ind.Eng.Chem.Res., vol.35(7), pp.2110-2120, 1996.
[5] Evans, R.J., and Milne, T.A.: “Molecular characterization of the pyrolysis of biomass. 2. Applications”. Energy Fuels, vol.1(4), pp.311-319, 1987.
[6] Shafizadeh, F.: “Thermal Conversion of cellulosic Materials to Fuels and Chemicals”. Wood and Agriculture Residues, pp.415-438, 1983.
[7] Bruinsma, O.S.L., and Moulijn, J.A.: “The pyrolytic formation of polycyclic aromatic hydrocarbons from benzene, toluene, ethylbenzene, styrene, phenylacetylene and n-decane in relation to fossil fuels utilisation”. Fuel Process. Technol., vol.18(3), pp.213-236, 1988.

76 ECN-C--04-014
[8] Pastorova, I., Botto, R.E., Arisz, P.W., and Boon, J.J.: “Cellulose char structure: a combined analytical Py-GC-MS, FTIR and NMR study”. Carbohydrate Research, vol.262, pp.27-47, 1994.
[9] Drift, A. van der, Doorn, J. van, and Vermeulen, J.W.: “Ten residual biomass fuels for circulating fluidized-bed gasification”. Biomass and Bioenergy, vol.20(1), pp.45-56, 2001.

ECN-C--04-014 77
5. CATALYTIC DECOMPOSIT ION OF BIOMASS TARS
L. Devi, K.J. Ptasinski and F.J.J.G. Janssen, Eindhoven University of Technology (TUE).
5.1 Introduction One of the major issues in biomass gasification is to deal with the tar formed during the process. Tar is a complex mixture of condensable hydrocarbons, which includes single ring to multiple ring aromatic compounds along with other oxygen containing hydrocarbons and complex PAH compounds. Considerable efforts have been directed on tar removal from fuel gas. Tar removal technologies can broadly be divided into two approaches: gas cleaning after the gasifier (secondary methods), and treatments inside the gasifier (primary methods) [1]. Primary measures are gaining much attention as these may eliminate the need for downstream cleanup. Primary methods can be defined as all the measures taken in the gasification step itself to prevent tar formation or convert tar formed in the gasifier. This includes: 1) the selection of favourable fuel properties (e.g., moisture content, particle size), 2) a proper gasifier design, 3) the proper selection of the operating conditions, 4) the use of a proper bed additive or a catalyst during gasification. In this chapter, the emphasis is on the latter option, that is to find an appropriate in-bed catalyst for biomass gasifiers. An overview of the developments in the area of primary measures is given by Devi et al. [1].
5.1.1 In-bed catalysts for biomass gasifiers (literature review) Catalytic tar reduction has been extensively reported in the literature [2]. Investigated catalysts include Ni-based catalysts, calcined dolomites and magnesites, zeolites, and iron catalysts. Among all these, only few have been tried as active bed additive inside the gasifier itself. There is a great potential of in-bed additives in terms of tar reduction, avoiding complex downstream tar removal methods. These bed additives act as in-situ catalysts promoting several chemical reactions in the same gasifier. The use of catalytically active materials during biomass gasification may promote the char gasification, change the product gas composition and reduce the tar yield. Limestone was one of the first additives used in the gasifier to improve the gasification. Walawender et al. [3, 4] performed series of experiments using limestone as bed additive in a fluidised-bed gasifier. Among all the active materials, dolomite has been the most popular and mostly studied in-bed additive. Karlsson et al. [5] reported the successful demonstration of a biomass IGCC process (VEGA Gasification with combined cycle) which involved dolomite as bed material. The tar content observed was about 1-2 g/mn
3 of light tars (excluding benzene) and 100-300 mg/mn
3 of heavy tars. Corella et al. [6] reported that the use of calcined dolomite inside the gasifier could decrease the tar amount from 6.5 wt% (without dolomite) to 1.3 wt%. Narváez et al. [7] suggested that addition of calcined dolomite (1-5 wt% of the biomass feed) improves the quality of the product gas. Their experiments resulted in a tar reduction of about 40 % with addition of 3 wt% calcined dolomite to biomass feed. 10 wt% of calcined dolomite has been reported to be sufficient by Olivares et al. [8] for significant improvement of the gas quality as well as tar reduction. Also Ni-based catalysts have been found to be very active in terms of tar removal. Mudge et al. [9] studied the catalytic steam gasification of biomass using alkali carbonate and Ni-based catalysts at the Pacific Northwest Laboratory (PNL). Supported Ni catalysts were found to be very effective in producing high yields of synthesis gas [9, 10]. Baker et al. [11] studied a

78 ECN-C--04-014
number of catalysts (Ni/Al2O3, K2O3, NiCuMo/SiO2-Al2O3) for pressurised steam gasification of bagasse and wood to produce synthesis gas for methanol and ammonia production in a laboratory-scale gasifier. The catalytic gasification resulted in an increase in the gas yield at the expense of tar and char. A number of other catalysts such as V2O5, Cr2O3, Mn2O3, Fe2O3, CoO, NiO, CuO, MoO3 on Al2O3, and used FCC have been reported for wood gasification [1]. But none of these catalysts were found to be suitable as a commercial in-bed material for biomass gasifiers. Although dolomites and Ni-based catalysts are observed to have high catalytic activity towards tar, they are not suitable as an in-bed material. Calcined dolomite is a soft material and hence gets easily eroded, thus producing problems of carry over of fines. Due to the lower attrition resistance of dolomite, it cannot be used inside a fluidised-bed gasifier, but it is suitable in a secondary treatment step. The major problem with Ni-based catalysts is fast deactivation due to carbon deposition on the catalyst and poisoning due to the presence of H2S. In view of the experiences of PNL, in-bed use of Ni catalyst is not an attractive option. Baker et al. [12] and Mudge et al. [13] reported that the lifetime of a Ni catalysts could be extended by placing it in a secondary bed instead of using it in the gasifier. Placing the NiCuMo on Si-Al2O3 and Ni on α-alumina catalysts in a secondary fluidised-bed reactor downstream the gasifier, they observed no deactivation for 30-40 h testing. An alternative for these catalysts could be naturally occurring olivine, which is a mineral containing magnesium, iron oxide and silica. Olivine seems advantageous in terms of its attrition resistance over that of dolomite. Rapagnà et al. [14] investigated the catalytic activity of olivine and observed that it has a good performance in terms of tar reduction and the activity was comparable to calcined dolomite. They reported more than 90 % reduction in average tar content (2.4 g/mn
3 compared to 43 g/mn3 with only sand). The same authors also performed
experiments with olivine as the bed material and a La-Ni-Fe tri-metallic perovskite catalyst in a secondary reactor. The combined action of the materials was very promising; a gas with around 0.3 g/mn
3 of tar was produced [15]. However, there is still ambiguity on the prospective use of olivine as a tar decomposing catalyst. It is not yet well enough established how tars behave in the presence of olivine and to what extent olivine is active towards tar destruction.
5.1.2 Objective The general objective of the present research has been to find an appropriate catalyst that can be used as an active in-bed material for fluidised-bed biomass gasification. An experimental set-up was designed and installed for decomposition studies. Olivine has been considered as prospective in-bed additive and catalytic activity of olivine has been investigated. The study includes fundamental aspects of the catalytic behaviour, viz. the detailed tar decomposition behaviour and kinetic data. Several techniques have been used for catalyst characterization as well. Besides the catalytic activity towards tar removal, the catalyst must be strong enough to be used as an in-bed material for biomass gasifiers. Hence, relative attrition resistance of different catalysts have also been measured with respect to that of sand.
5.2 Catalytic decomposition of biomass tar: use of untreated olivine as catalyst To investigate whether olivine has any activity for tar removal, preliminary experiments are performed in a secondary fixed-bed reactor. This preliminary investigation also involves a comparison between olivine and dolomite. These experiments are performed in co-operation with the Energy research Centre of the Netherlands (ECN). The experiments are done at the facility of ECN. Part of the biomass gasification gas from the lab-scale atmospheric bubbling fluidised bed gasifier (WOB) is passed through a secondary fixed-bed reactor where the additives are placed. The gasifier operates with a capacity of 1 kg/h (see Chapter 4). A detailed description of the experimental set-up and the conditions can be found elsewhere [16, 17].
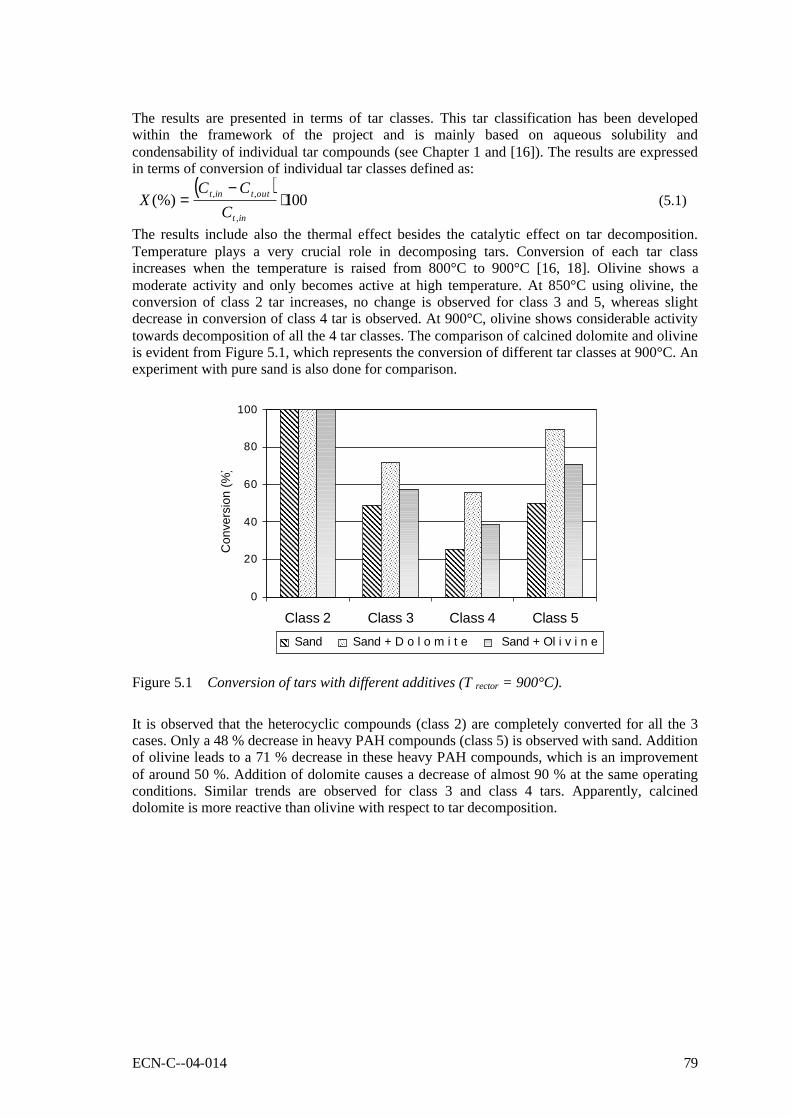
ECN-C--04-014 79
The results are presented in terms of tar classes. This tar classification has been developed within the framework of the project and is mainly based on aqueous solubility and condensability of individual tar compounds (see Chapter 1 and [16]). The results are expressed in terms of conversion of individual tar classes defined as:
( )
100(%),
,, ⋅−
=int
outtint
CCC
X (5.1)
The results include also the thermal effect besides the catalytic effect on tar decomposition. Temperature plays a very crucial role in decomposing tars. Conversion of each tar class increases when the temperature is raised from 800°C to 900°C [16, 18]. Olivine shows a moderate activity and only becomes active at high temperature. At 850°C using olivine, the conversion of class 2 tar increases, no change is observed for class 3 and 5, whereas slight decrease in conversion of class 4 tar is observed. At 900°C, olivine shows considerable activity towards decomposition of all the 4 tar classes. The comparison of calcined dolomite and olivine is evident from Figure 5.1, which represents the conversion of different tar classes at 900°C. An experiment with pure sand is also done for comparison.
0
20
40
60
80
100
Class 2 Class 3 Class 4 Class 5 Sand Sand + D o l o m i t e Sand + Ol i v i n e
Con
vers
ion
(%)
Figure 5.1 Conversion of tars with different additives (T rector = 900°C).
It is observed that the heterocyclic compounds (class 2) are completely converted for all the 3 cases. Only a 48 % decrease in heavy PAH compounds (class 5) is observed with sand. Addition of olivine leads to a 71 % decrease in these heavy PAH compounds, which is an improvement of around 50 %. Addition of dolomite causes a decrease of almost 90 % at the same operating conditions. Similar trends are observed for class 3 and class 4 tars. Apparently, calcined dolomite is more reactive than olivine with respect to tar decomposition.

80 ECN-C--04-014
0
20
40
60
80
100
775 800 825 850 875 900 925
Con
vers
ion
(%)
Dolomite Olivine
Temperature (OC)
Figure 5.2 Conversion of total tar with addition of dolomite and olivine.
Adding up the concentration of the different classes gives the amount of total considered tar and with it the total conversion. Figure 5.2 shows the conversion for the bulk tar. It can be concluded that dolomite is the more active additive. At 850°C the conversion for dolomite amounts to 56 %, whereas olivine shows a conversion of about 16 %. When the temperature is raised to 900°C, a slight increase of total tar conversion is observed for dolomite. But for olivine, this increase in temperature shows a bigger effect; a total tar conversion of 46 % is observed, which is a sharp increment. The entering tar concentrations for the dolomite and olivine experiment are approximately 4.0 g/mn
3 at 900°C. After catalytic treatment with dolomite, the total tar concentration dropped to 1.5 g/mo
3, and with olivine the concentration dropped to 2.2 g/mn
3. It has to be kept in mind that this is only a part of the tar present in the system. The unidentified heavy and very light tars are not included, because they cannot be captured by the SPA analysis method. Rapagna et al. [14] observed a much lower tar concentration of around 2.4 g/mn
3 at the exit of the gasifier, even at a temperature of 770°C using olivine as bed material. It must be made clear, however, that Rapagna and his co-workers used olivine inside the gasifier and used steam as a gasifier medium which favours more steam reforming reactions in the gasifier, thus less tar in the exiting gas. Figure 5.3 gives the concentration of total considered tars remaining after catalytic treatment along with the individual contribution of each tar class. At lower temperature, the total amount of considered tar is lower for olivine than for dolomite. This can be due to the fact that naphthalene concentration is much higher in case of dolomite. It is obvious from Figure 5.3, that class 4 contributes the major part of the total tar for both catalysts investigated. As the temperature of the catalytic reactor was increased, although the amount of class 4 tar decreases, its percentage in the remaining tar increases. At the lower temperature range investigated, class 4 tar contributes around 80 % of the total tar, whereas with increasing temperature the contribution of class 4 tar becomes around 90 %. Simell and his co-workers [19] also reported the effect of temperature on tar removal using dolomite as catalyst. They reported similar values for the total tar content in the investigated temperature range except for 900°C, where they found less than 100 mg/mn
3 of tars. It should be kept in mind, however, that the properties of the dolomite investigated by these authors are quite different from that used by Simell et al. [19]. For example, the surface area of the dolomite used during this study is lower than that investigated by Simell et al.
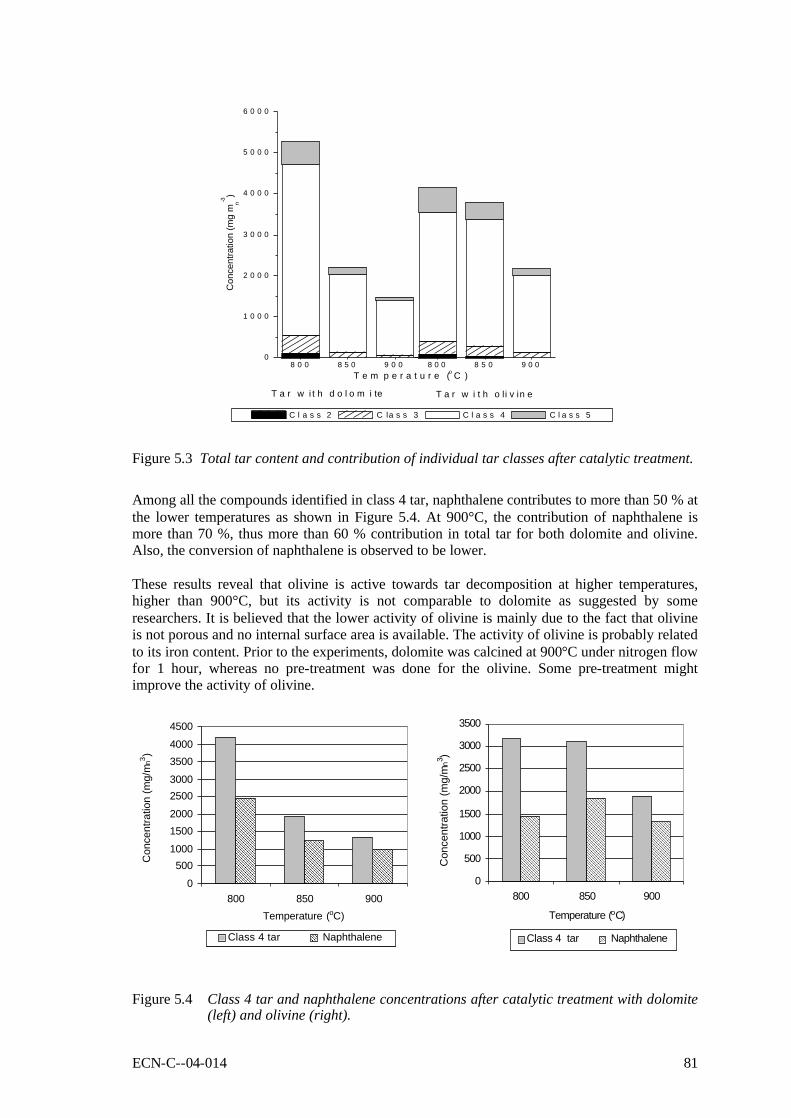
ECN-C--04-014 81
8 0 0 8 5 0 9 0 00
1 0 0 0
2 0 0 0
3 0 0 0
4 0 0 0
5 0 0 0
6 0 0 0
T a r w i t h o li v in e T a r w i t h d o l o m i te
Con
cent
ratio
n (m
g m
n-3)
T e m p e r a t u r e (o C )
C l a s s 2 C la s s 3 C l a s s 4 C l a s s 5
8 0 0 8 5 0 9 0 0
Figure 5.3 Total tar content and contribution of individual tar classes after catalytic treatment.
Among all the compounds identified in class 4 tar, naphthalene contributes to more than 50 % at the lower temperatures as shown in Figure 5.4. At 900°C, the contribution of naphthalene is more than 70 %, thus more than 60 % contribution in total tar for both dolomite and olivine. Also, the conversion of naphthalene is observed to be lower. These results reveal that olivine is active towards tar decomposition at higher temperatures, higher than 900°C, but its activity is not comparable to dolomite as suggested by some researchers. It is believed that the lower activity of olivine is mainly due to the fact that olivine is not porous and no internal surface area is available. The activity of olivine is probably related to its iron content. Prior to the experiments, dolomite was calcined at 900°C under nitrogen flow for 1 hour, whereas no pre-treatment was done for the olivine. Some pre-treatment might improve the activity of olivine.
0
5001000
15002000
25003000
35004000
4500
800 850 900
Class 4 tar Naphthalene
Temperature (oC)
Con
cent
ratio
n (m
g/m
n3 )
0
500
1000
1500
2000
2500
3000
3500
800 850 900
Class 4 tar Naphthalene
Temperature (oC)
Con
cent
ratio
n (m
g/m
n3 )
0
5001000
15002000
25003000
35004000
4500
800 850 900
Class 4 tar Naphthalene
Temperature (oC)
Con
cent
ratio
n (m
g/m
n3 )
0
500
1000
1500
2000
2500
3000
3500
800 850 900
Class 4 tar Naphthalene
Temperature (oC)
Con
cent
ratio
n (m
g/m
n3 )
Figure 5.4 Class 4 tar and naphthalene concentrations after catalytic treatment with dolomite (left) and olivine (right).
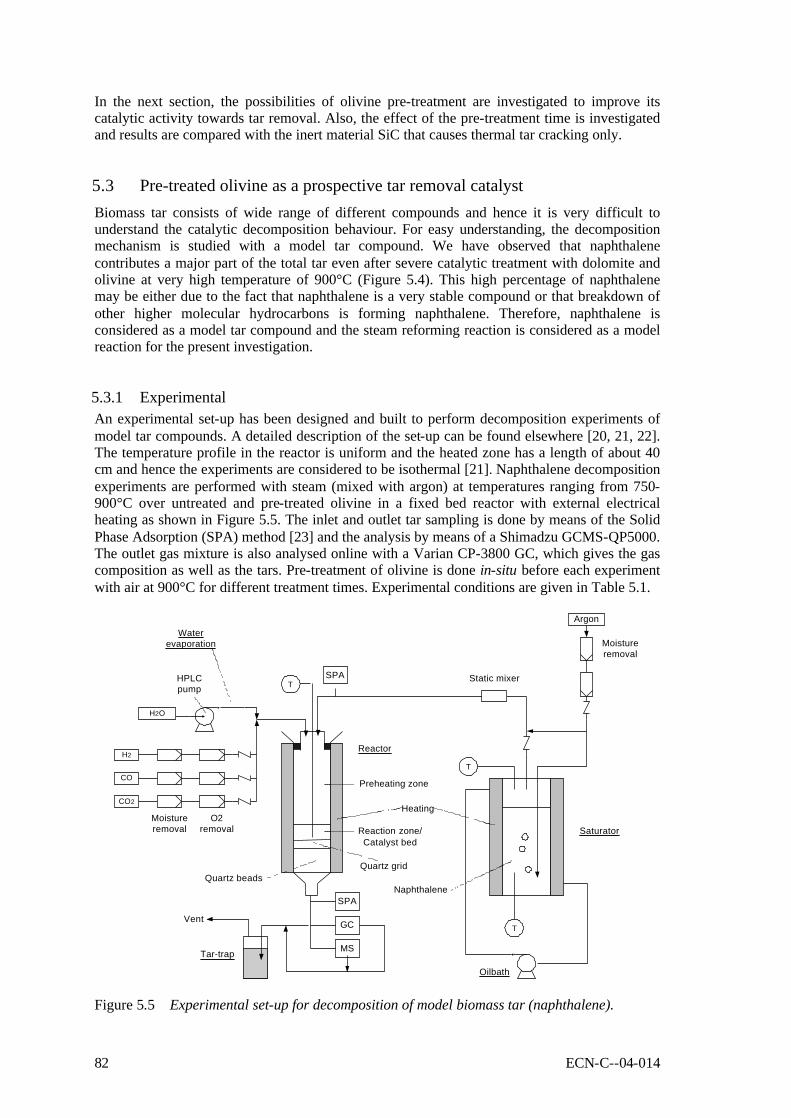
82 ECN-C--04-014
In the next section, the possibilities of olivine pre-treatment are investigated to improve its catalytic activity towards tar removal. Also, the effect of the pre-treatment time is investigated and results are compared with the inert material SiC that causes thermal tar cracking only.
5.3 Pre-treated olivine as a prospective tar removal catalyst Biomass tar consists of wide range of different compounds and hence it is very difficult to understand the catalytic decomposition behaviour. For easy understanding, the decomposition mechanism is studied with a model tar compound. We have observed that naphthalene contributes a major part of the total tar even after severe catalytic treatment with dolomite and olivine at very high temperature of 900°C (Figure 5.4). This high percentage of naphthalene may be either due to the fact that naphthalene is a very stable compound or that breakdown of other higher molecular hydrocarbons is forming naphthalene. Therefore, naphthalene is considered as a model tar compound and the steam reforming reaction is considered as a model reaction for the present investigation.
5.3.1 Experimental An experimental set-up has been designed and built to perform decomposition experiments of model tar compounds. A detailed description of the set-up can be found elsewhere [20, 21, 22]. The temperature profile in the reactor is uniform and the heated zone has a length of about 40 cm and hence the experiments are considered to be isothermal [21]. Naphthalene decomposition experiments are performed with steam (mixed with argon) at temperatures ranging from 750-900°C over untreated and pre-treated olivine in a fixed bed reactor with external electrical heating as shown in Figure 5.5. The inlet and outlet tar sampling is done by means of the Solid Phase Adsorption (SPA) method [23] and the analysis by means of a Shimadzu GCMS-QP5000. The outlet gas mixture is also analysed online with a Varian CP-3800 GC, which gives the gas composition as well as the tars. Pre-treatment of olivine is done in-situ before each experiment with air at 900°C for different treatment times. Experimental conditions are given in Table 5.1.
T
T
Oilbath
Saturator
T
Preheating zone
Reaction zone/Catalyst bed
Tar-trap
Vent
HPLCpump
H2O
H2
CO
CO2
O2removal
Moistureremoval
Naphthalene
Quartz gridQuartz beads
Argon
Moistureremoval
Waterevaporation
SPA
SPA
Reactor
Heating
MS
GC
Static mixer
Figure 5.5 Experimental set-up for decomposition of model biomass tar (naphthalene).

ECN-C--04-014 83
Table 5.1 Experimental conditions.
5.3.2 Results and discussion The results are expressed in terms of conversion of naphthalene as given by Equation 5.1. The effect on naphthalene conversion of 1 hour pre-treatment of olivine is evident from Figure 5.6, which shows conversion of naphthalene with 10 vol.% of steam, as a function of temperature. SiC is considered as inert material and the corresponding conversion represents the thermal effect. The catalytic activity of olivine is directly related to the operating temperature. At 850°C, both untreated and pre-treated olivine shows similar conversion of about 45 %. When the temperature is raised to 900°C, still similar naphthalene conversion is observed for untreated olivine. But for pre-treated olivine, this increase in temperature shows a bigger effect; a conversion of 62 % is observed.
0
10
20
30
40
50
60
70
80
750 800 850 900
SiC Untreated Oliv ine Pre-treated Olivine (1 hr)
Temperature (OC)
Con
vers
ion
(%)
Figure 5.6 Effect of pre-treatment of olivine on naphthalene conversion.
Parameter Value
Naphthalene concentration 4.5-9 g/mn3
Temperature 750-900°C Pressure Atmospheric Bed additives SiC, Untreated olivine, Pre-treated olivine Particle size catalysts 212-300 •m Residence time 0.3 s Space time (at 900°C) 0.147 kg cat•h/mT
3 Pre-treatment method 900°C, air, 1, 5 or 10 hours treatment time Total gas flow rate 625 mln/min
Gas composition (vol.%) Steam reforming Dry reforming Gas mixture H2O 10 - 10 H2 - - 10 CO - - 12 CO2 - 12 12 Ar 90 88 56

84 ECN-C--04-014
0
20
40
60
80
100
SiC Untreated olivine
1 hr treatment 5 hr treatment 10 hr treatment
Con
vers
ion
(%)
Figure 5.7 Effect of pre-treatment time on naphthalene conversion.
To find the effect of the olivine pre-treatment time on naphthalene conversion, steam reforming experiments over olivine catalyst with different pre-treatment times are performed at a fixed temperature of 900°C. Clearly it can be concluded from Figure 5.7, that a longer pre-treatment time gives a higher conversion. With 10 hours of pre-treatment, a conversion of more than 81% is observed, which is a significant improvement. It is also observed that the reaction environment has a significant effect on naphthalene conversion as well as the product distribution. Besides steam reforming, dry reforming is performed to get to control of the hydrogen balance. Also an experiment is performed in a syngas medium to simulate the biomass gasification environment. All these experiments are performed at 900°C with 10 hours pre-treated olivine. Besides the permanent gases, cracking reactions lead to formation of other hydrocarbons with lower carbon number than naphthalene. Hydrocarbons with higher carbon number than naphthalene are forming as well via polymerisation reactions. The tar distribution is slightly different for all the 3 gaseous mediums as indicated in Figure 5.8. The formation of benzene is highest for the syngas medium. Styrene is formed in a very small amount only with steam. The amount of 1,2-binaphthalene is higher for both steam as well as dry reforming. Dry reforming produces the highest amount of phenanthrene. Further condensation of these higher hydrocarbons lead to soot formation. The amount of soot/carbon deposition is estimated from the carbon and hydrogen balance for steam and dry reforming respectively. Severe soot/carbon formation is observed in case of steam and dry reforming. Equilibrium gas phase reactions, such as water gas shift, boudouard and methanation reactions are simultaneously taking place. Naphthalene conversion under syngas medium is somewhat lower than that of only in steam and CO2. This decrease in conversion is due to the fact that H2 and CO are reported to be inhibitors for the dry and steam reforming reactions of tar. During the experiment with syngas mixture, the percentages of the different gas components are sufficiently in excess with respect to added naphthalene; hence the change in the outlet gas composition is very minute to be detected by the GC. So the formation of carbonaceous residue/soot could not be quantified by mass balance. Detailed experimental results are tabulated in Table 5.2.
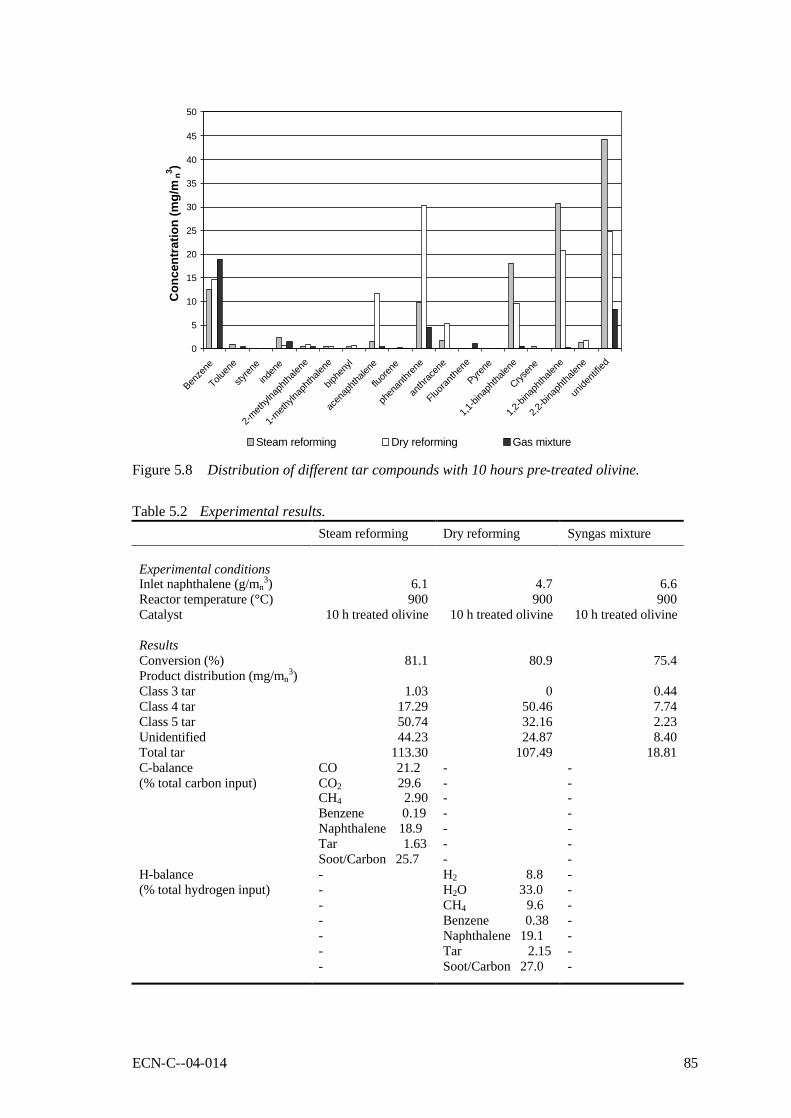
ECN-C--04-014 85
0
5
10
15
20
25
30
35
40
45
50
Benze
ne
Toluen
e
styren
e
inden
e
2-meth
ylnap
hthale
ne
1-meth
ylnap
hthale
ne
biphe
nyl
acen
aphth
alene
fluore
ne
phen
anthr
ene
anthr
acen
e
Fluoran
thene
Pyrene
1,1-bi
naph
thalen
e
Crysen
e
1,2-bi
naph
thalen
e
2,2-bi
naph
thalen
e
unide
ntifie
d
Con
cent
ratio
n (m
g/m
n3 )
Steam reforming Dry reforming Gas mixture
Figure 5.8 Distribution of different tar compounds with 10 hours pre-treated olivine.
Table 5.2 Experimental results. Steam reforming Dry reforming Syngas mixture Experimental conditions
Inlet naphthalene (g/mn3)
Reactor temperature (°C) Catalyst
6.1 900
10 h treated olivine
4.7 900
10 h treated olivine
6.6 900
10 h treated olivine Results
Conversion (%) 81.1 80.9 75.4 Product distribution (mg/mn
3) Class 3 tar Class 4 tar Class 5 tar Unidentified Total tar
1.03
17.29 50.74 44.23
113.30
0
50.46 32.16 24.87
107.49
0.44 7.74 2.23 8.40
18.81 C-balance (% total carbon input)
CO 21.2 CO2 29.6 CH4 2.90 Benzene 0.19 Naphthalene 18.9 Tar 1.63 Soot/Carbon 25.7
- - - - - - -
- - - - - - -
H-balance (% total hydrogen input)
- - - - - - -
H2 8.8 H2O 33.0 CH4 9.6 Benzene 0.38 Naphthalene 19.1 Tar 2.15 Soot/Carbon 27.0
- - - - - - -

86 ECN-C--04-014
5.3.3 Apparent activation energy The apparent rate constant and the apparent activation energy for naphthalene decomposition are calculated assuming a 1st order reaction with respect to naphthalene. A major advantage of having a first order reaction is that it is easy for evaluation and comparison with other experiments. The overall rate can be described with the following equation, assuming a 1st order reaction in tar:
tarapptar Ckr ⋅=− (5.2) Under plug flow conditions, the apparent rate constant can be calculated as:
[ ]τ
)1ln(,
nnapp
Xk
−−= (5.3)
0vW
=τ (5.4)
The temperature dependency according to Arrhenius’ Law can be represented as:
RTEapp
appnapp ekk−
⋅= ,0, (5.5) To find the activation energy, experiments are performed in a temperature range of 825-900°C, with mixed gas environment (gas composition as given in Table 5.1) over 10 h pre-treated olivine catalyst. The inlet concentration of naphthalene was kept at around 4.5 g/mn
3. The apparent activation energy for naphthalene conversion over 10 h pre-treated olivine calculated from Figure 5.9 is 187 kJ/mol with frequency factor of 2.06x10⁹. Depner et al. [24] reported much lower Eapp of 149 kJ/mol for naphthalene using Ni-MgO catalyst.
0
0.5
1
1.5
2
2.5
8.4 8.5 8.6 8.7 8.8 8.9 9 9.1 9.2
1/T x 10-4
ln K
app
Figure 5.9 Arrhenius plot for calculation of apparent activation energy.

ECN-C--04-014 87
5.3.4 Catalyst characterisation Pre-treatment of olivine as described earlier improves the catalytic activity of olivine. Visually the typical pale green colour of the olivine disappears after treatment and olivine becomes brown-reddish [21]. With increasing pre-treatment time, the colour darkens. Olivine used in this study is a mineral from Norway supplied by OLIVIN, containing oxides of Mg, Si, Fe and traces of Cr, Al and Ni. Physical properties of olivine are given in Table 5.3. The colour change due to pre-treatment indicates that probably oxidation of iron takes place while treating with air. The BET-surface of olivine determined by means of N2 chemisorption (Micromeretics ASAP-2000) is very low (<0.5 m2/g) and hence olivine can be regarded as non-porous. Thus, the activity of olivine is probably due to specific elements present in it.
Table 5.3 Catalyst properties. Chemical composition (wt%) a
MgO 49 SiO2 41 Fe2O3 7 Cr2O3 0.3 Al2O3 0.5 NiO 0.3 MnO 0.1 CaO 0.05
Physical properties
Colour Greenish grey Structure b Orthorhombic Density a 3.3 g/cm3 Hardness a 6.5-7.0 Moh’s scale Melting point a Approx. 1760°C Thermal expansion a Linear; approx. 1.1% upto 1200°C BET surface area c 0.42 (m2/g) State of mineral Ferroan-forsterite (Mg,Fe)2SiO4
b Syn-forsterite (Mg2SiO4) a, b
Fayalite (Fe2SiO4) a a as indicated by the supplier b determined by X-ray diffraction (XRD) with Rigaku Geigerflex D/MAX-B c determined by Micromeretics ASAP-2000 X-ray Photoelectron Spectroscopy (XSP) measurements are done for the untreated and pre-treated (1 hour) olivine by means of a VG-Escalab 200 spectrometer using an aluminium anode (Al K• = 1486.3 eV) operating at 510 W with a background pressure of 2x10⁻⁹ mbar. In Figure 5.10 the wide scan of the XPS is shown and two important fragments are highlighted. For a good comparison of the data, the intensities of the peaks are normalized to the total Si-2p peak area for all samples. The XPS scan immediately reveals a significant difference between pre-treated and untreated olivine. After treatment, severe segregation of Fe on the surface is observed. The peaks of Fe-2p (710 eV) and Fe-3p (55 eV) appear with significant intensity for pre-treated olivine. No change is observed for Mg and Si features. This indicates that the increased activity of the pre-treated olivine is due to the fact that more iron is present at the surface of the catalyst. However, at this moment it is not possible to establish the oxidation state of iron present at the surface.

88 ECN-C--04-014
Wide scan Scan for fragmentsWide scan Scan for fragments
Figure 5.10 X-ray Photoelectron Spectroscopy (XPS) scan.
Elementary analysis is performed by means of Energy Dispersive Spectrometry (EDS) attached to the JEOL Superprobe JXA-8600SX. It is observed that the segregation of iron is highly inhomogeneous. Due to the inhomogeneous nature of the samples, EDS does not give an exact percentage of the present elements, but gives an indication of the elements present in specific spots. EDS for untreated olivine shows that the elemental distribution is more or less uniform; but for pre-treated olivine the distribution of elements in the surface is non-uniform. Elemental analysis of few randomly selected spots of pre-treated olivine reveals that there are iron rich spots where the iron content is as high as 70 wt% [22]. Besides the catalytic activity towards tar reduction, olivine must be strong enough to be used as an additive for biomass gasifiers. Relative attrition resistance of olivine is measured with respect to that of sand. A standard ASTM D-4058 fluidised-bed attrition tester based on the design of Gwyn [25] as shown in Figure 5.11 is used for this purpose. The test is carried out with 50 g of olivine at room temperature with an air flow of 26 l/min.
Figure 5.11 Fluidised-bed attrition tester.
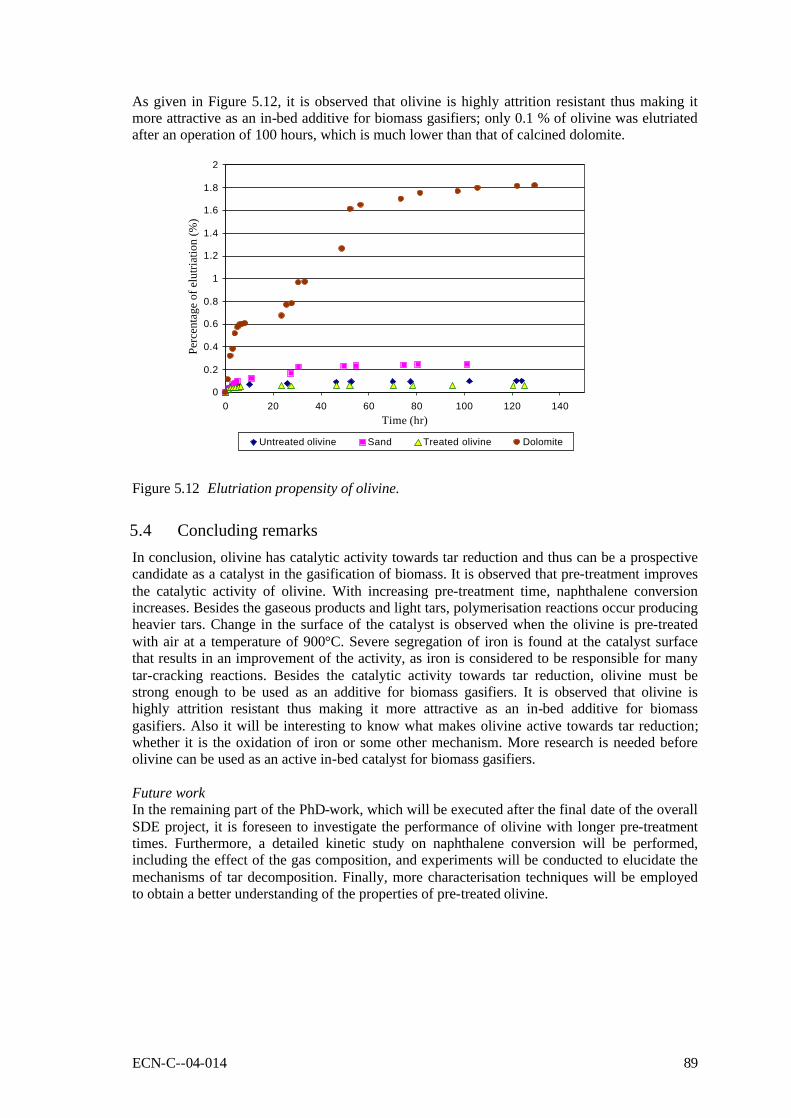
ECN-C--04-014 89
As given in Figure 5.12, it is observed that olivine is highly attrition resistant thus making it more attractive as an in-bed additive for biomass gasifiers; only 0.1 % of olivine was elutriated after an operation of 100 hours, which is much lower than that of calcined dolomite.
0
0.2
0.4
0.6
0.8
1
1.2
1.4
1.6
1.8
2
0 20 40 60 80 100 120 140Time (hr)
Perc
enta
ge o
f elu
triat
ion
(%)
Untreated olivine Sand Treated olivine Dolomite
Figure 5.12 Elutriation propensity of olivine.
5.4 Concluding remarks In conclusion, olivine has catalytic activity towards tar reduction and thus can be a prospective candidate as a catalyst in the gasification of biomass. It is observed that pre-treatment improves the catalytic activity of olivine. With increasing pre-treatment time, naphthalene conversion increases. Besides the gaseous products and light tars, polymerisation reactions occur producing heavier tars. Change in the surface of the catalyst is observed when the olivine is pre-treated with air at a temperature of 900°C. Severe segregation of iron is found at the catalyst surface that results in an improvement of the activity, as iron is considered to be responsible for many tar-cracking reactions. Besides the catalytic activity towards tar reduction, olivine must be strong enough to be used as an additive for biomass gasifiers. It is observed that olivine is highly attrition resistant thus making it more attractive as an in-bed additive for biomass gasifiers. Also it will be interesting to know what makes olivine active towards tar reduction; whether it is the oxidation of iron or some other mechanism. More research is needed before olivine can be used as an active in-bed catalyst for biomass gasifiers. Future work In the remaining part of the PhD-work, which will be executed after the final date of the overall SDE project, it is foreseen to investigate the performance of olivine with longer pre-treatment times. Furthermore, a detailed kinetic study on naphthalene conversion will be performed, including the effect of the gas composition, and experiments will be conducted to elucidate the mechanisms of tar decomposition. Finally, more characterisation techniques will be employed to obtain a better understanding of the properties of pre-treated olivine.
90 ECN-C--04-014
5.5 Nomenclature Ct,in Inlet concentration of tar (naphthalene) or tar class (mg/mn
3) Ct,out Outlet concentration of tar (naphthalene) or tar class (mg/mn
3) Ctar Tar concentration (mol/mn
3) Eapp Apparent activation energy (kJ/mol) k0,app Apparent pre exponential factor (mT
3/kg•h) kapp Apparent rate constant (mT
3/kg•h) mn
3 Normal cubic meter mT
3 Cubic meter at reaction temperature PAH : Polycyclic aromatic hydrocarbon R : Universal gas constant (J/mol•K) rtar : Overall rate of decomposition (mol/s) T : Temperature (K) W : Catalyst mass (kg) X : Conversion (%) • : Space time (kg·h/mT
3)
0v : Volumetric flow rate (mT3/h)
5.6 Acknowledgements We are thankful to OLIVIN, Norway for supplying the catalyst. Our sincere gratitude goes to Dr. Peter Thüne of the catalysis group of Eindhoven University of Technology for his comments and suggestions regarding catalyst characterisation. We also want to thank our graduate students, Bart Wieland, Bart Smits, Willem van Pol and Wouter Habraken for participating in this project.
5.7 References [1] Devi, L., Ptasinski, K.J., and Janssen, F.J.J.G.: "A review of the primary measures for
tar elimination in biomass gasification processes". Biomass and Bioenergy, vol.24, pp.125-140, 2003.
[2] Sutton, D., Kelleher, B., and Ross, J.R.H.: “Review of literature on catalysts for biomass gasification”. Fuel Processing Technology, vol.73, pp.155-173, 2001.
[3] Walawender, W.P., Hoveland, D.A., and Fan, L.T.: “Steam gasification of alpha cellulose in a fluid bed reactor”. In: Fundamentals of Thermochemical Biomass Conversion, Overend, R.P., Milne, T.A., and Mudge, L.K. (Eds). Elsevier Applied Science, London, pp.897-910, 1985.
[4] Walawender, W.P., Ganesan, S., and Fan, L.T.: “Steam gasification of manuare in a fluid bed Influence of limestone as a bed additive”. In: Symposium papers on Energy from Biomass and Wastes. IGT, Chicago, pp.517-527, 1981.
[5] Karlsson, G., Ekström, C., and Liinaki, L.: “The development of a Biomass IGCC process for power and heat production”. In: Proc. 8th European Conf. on Biomass for Energy, Environment, Agriculture and Industry. Chartier P. H (Eds). Vienna, Austria, pp.1538-1549, 1994.
[6] Corella J, Herguido J, Gonzalez-Saiz J, Alday JF, Rodriguez-Trujillo JL.: “Fluidized bed steam gasification of biomass with dolomite and with a commercial FCC catalyst”. In: Research in thermochemical biomass conversion, Bridgwater, A.V., and Kuester, J.L. (Eds). Elsevier Applied Science, London, pp.754-765, 1988.
ECN-C--04-014 91
[7] Narváez, I., Orío, A., Aznar, M.P., and Corella, J.: “Biomass Gasification with Air in an Atmospheric Bubbling Fluidized Bed. Effect of Six Operational Variables on the Quality of the Produced Raw Gas”. Industrial & Engineering Chemistry Research, vol.35, pp.2110-2120, 1996.
[8] Olivares, A., Aznar, M.P., Caballero, M.A., Gil, J., Francés, E., and Corella, J.: “Biomass Gasification: Produced Gas Upgrading by In-Bed Use of Dolomite”. Industrial & Engineering Chemistry Research, vol.36, pp.5220-5226, 1997.
[9] Mudge, L.K., Weber, S.L., Mitchell, D.H., Sealock, L.J. Jr., and Robertus, R.J.: “Investigation on catalysed steam gasification of biomass”. Report PNL-3695. Pacific Northwest Laboratory, Richland, 1981.
[10] Mitchell, D.H., Mudge, L.K., Robertus, R.J., Weber, S.L., and Sealock, L.J. Jr.: “Methane/methanol by catalytic gasification of biomass”. Chemical Engineering Progress, vol.76(9), pp.53-57, 1980.
[11] Baker, E.G., Mudge, L.K., and Brown, M.D.: “Methanol and ammonia from biomass”. Chemical Engineering Progress, vol.80(12), pp.43-46, 1984.
[12] Baker, E.G., Mudge, L.K., and Brown, M.D.: “Steam gasification of biomass with nickel secondary catalysts”. Industrial & Engineering Chemistry Research, vol.26, pp.1335-1339, 1987.
[13] Mudge, L.K., Baker, E.G., Brown, M.D., and Wilcox, W.A.: “Catalysts for gasification of biomass”. In: Symposium papers on Energy from Biomass and Wastes. IGT, Washington DC, pp.1639-1640, 1987.
[14] Rapagnà, S., Jand, N., Kiennemann, A., and Foscolo, P.U.: “Steam-gasification of biomass in a fluidised-bed of olivine particles”. Biomass and Bioenergy, vol.19, pp.187-197, 2000.
[15] Rapagnà, S., Jand, N., and Foscolo, P.U.: “Utilisation of suitable catalysts for the gasification of biomass”. In: Proc. 10th European Conf. and Technol. Exhibition on Biomass for Energy and Industry, Kopetz, H., Weber, T., Palz, W., Chartier, P., Ferrero, G.L. (Eds). Wuerzburg, Germany, pp.1720-1723, 1998.
[16] Devi, L., Smits, B.A., Ptasinski, K.J., Janssen, F.J.J.G., Bergman, P.C.A., and Kiel, J.H.A.: "Catalytic decomposition of tars from biomass gasifier". Proc. Int. Nordic Bioenergy Conf. and Exhibition, ISBN 952-5135-26-8, pp.418-420, 2003.
[17] Smits, B.A.: "Catalytic decomposition of tar present in biomass gasification gas". Graduation thesis Eindhoven University of Technology, 2002.
[18] Devi, L., Ptasinski, K.J., Janssen, F.J.J.G., Paasen, S.V.B. van, Bergman, P.C.A., and Kiel, J.H.A.: "Catalytic decomposition of biomass tars: use of dolomite and untreated olivine". Paper submitted to Renewable Energy, 2003.
[19] Simell, P.A.: “Catalytic purification of tarry fuel gas with carbonate rocks and ferrous materials”. Fuel, vol.71, pp.211-218, 1992.
[20] Wieland, A.M.H.: "Decomposition of tar compounds in a fixed bed reactor: Design of an experimental setup". Graduation thesis Eindhoven University of Technology, 2001.
[21] Pol, W.L.C. van: "Decomposition of naphthalene as a model biomass tar compound using olivine". Graduation thesis Eindhoven University of Technology, May 2003.
[22] Devi, L., Pol, W.L.C. van, Ptasinski, K.J., and Janssen, F.J.J.G.: "Catalytic decomposition of biomass tars; olivine as a prospective catalyst for biomass gasification processes". Proceedings of Topical Conference on Envisioning Biorefineries: Chemicals and Materials from Renewable Feedstocks. AIChE annual meeting, San Francisco, USA, pp 26-29, 2003.

92 ECN-C--04-014
[23] Brage, C., Yu, Q., Chen, G., and Sjöström, K.: “Use of amino phase adsorbent for biomass tar sampling and separation”. Fuel, vol.76, pp.137-142, 1997.
[24] Depner, H., and Jess, A.: “Kinetics of nickel-catalyzed purification of tarry fuel gases from gasification and pyrolysis of solid fuels”. Fuel, vol.78, pp.1369-1377, 1999.
[25] Gwyn, J.E.: “On the particle size distribution function and the attrition of cracking catalysts ”. AIChE Journal, vol.15(1), pp.35-39, 1969.

ECN-C--04-014 93
6. ECONOMIC AND PRACTICAL FEASIBILITY
R. Meijer, KEMA Power Generation & Sustainables
6.1 Introduction
6.1.1 Objective A (largely) qualitative techno-economic evaluation has been performed on the implementation and practical feasibility of primary tar reduction measures in circulating-fluidised-bed (CFB) biomass gasification systems. The results of the analyses have been translated into recommendations for primary tar reduction systems in gasification processes.
6.1.2 Approach and work programme Three basic CFB gasification systems have been selected by the project team for the evaluation of the impact and effect of selected primary tar reduction measures. These systems are: A CFB gasification equipped with a gas cleaning concept as applied in the ARBRE plant in
the UK, with the use of the fuel gas in a stand-alone gas turbine at a scale of 30 and 100 MWth fuel input. The gas cleaning/cooling consists of a CFB tar cracker with a primary cyclone, gas cooling to 230°C, a bag filter for dedusting, gas cooling to 100°C, an and acid scrubber system.
B CFB gasification with gas cooling to 500°C, followed by dedusting using a high-
temperature cyclone, and combustion of the fuel gas in a coal-fired boiler at a scale of 100 MWth fuel input (Amer wood gasifier concept).
C CFB gasification with fuel gas cleaning and combustion of the fuel gas in a stand-alone
gas-engine or small gas turbine at a scale of 10 and 30 MWth fuel input. The gas cleaning/cooling consists of a secondary high temperature cyclone for partial dedusting, syngas cooling to 240°C, complete dedusting in a bag filter, further gas cooling and a multi-stage wet scrubber section, including a wet ESP.
The three systems are shown schematically in Figures 6.1-6.3. Within the framework of this project ECN and TNO have reviewed the many primary tar reduction measures that can be applied within biomass gasification systems in order to reduce the tar produced from fluid bed gasifiers. It was agreed upon to focus on the following four primary tar reduction measures: 1. gasification temperature (i.e., equivalence ratio ER) 2. fuel moisture content 3. the addition of catalyst inside the gasifier 4. variation of the gas residence time in the gasifier. Furthermore, it was agreed that the techno-, economic evaluation would have to be of a qualitative nature, due to the fact that: • For most primary tar reduction measures no data on class 1 tar is available. Therefore, all
conclusions drawn in this report have been done in the absence of these data. • Detailed information on the effects of tar reduction measures on the complete gasification
process and set-up (e.g. tar class removal efficiencies) could not be supplied. • Due to the limited budget available for the evaluation, it should be avoided that too much
resources are spent on the integral process.

94 ECN-C--04-014
For assessing the impact of primary tar reduction measures, the biomass gasification chain has been divided into separate sections for which an inventory has been made on aspects considered to be relevant and related, also with respect to the three basic gasification systems. These findings have been translated into a technical assessment of the selected primary tar reduction measures with respect to its effect (either resolving or inflicting) on critical aspects or parts within the selected gasification systems. Subsequently, the (largely qualitative and to some extend quantitative) impact on the economics of the selected gasification systems has been analysed. From the outcome of this analysis conclusions are drawn and recommendations made.
0
200
400
600
800
1000
1200
1400
1600
-1,5 3,5 8,5 13,5 18,5
Temperature (°C)
Tar cracker(dolomite)
(optional)
CFBGasifier
Bagfilter
Multi -stagescrubber
G
Comb .
Air Gasturbine
Fuel gascompressor
Figure 6.1 CFB gasification system A.
0
200
400
600
800
1000
1200
1400
-1,5 3,5 8,5 13,5 18,5
Temperature (°C)
secondarycyclone
CFBGasifier
Co-combustion
T range boiler in500 C
350 C
Figure 6.2 CFB gasification system B.

ECN-C--04-014 95
0
200
400
600
800
1000
1200
1400
-1,5 3,5 8,5 13,5 18,5
Temperature (°C)
Bagfilter
G
Comb.
Air Gasturbine
CFBGasifier
Multi-stagescrubber
Fuel gascompressor
Gas engine
HV
Wet ESP
Figure 6.3 CFB gasification system C.
6.2 Effect of primary tar reduction measures A decrease in the total tar production is seen with all applied primary measures. A summary of the results is given in Table 6.1. It should be noticed that data on class 1 tar formation were not available for most of the primary measures. Therefore, the conclusions drawn in this chapter are subject to this limitation. However, a rough impression of the impact of the class 1 tar fraction on the evaluation of the primary measures may be obtained from the qualitative analysis given in Section 4.3.4 (which was not available at the time of the technical and economic assessment described in this chapter). The increase seen in class 4 and 5 tars upon increasing the gasification temperature and - although to a lesser extent - the residence time in the gasifier may lead to an - undesired - increase of the temperature at which tar condensation in the fuel gas will start to take place. Figure 6.4 shows the global effect of the measured variations in the class 5 tar concentrations (lowest 34 and highest 1434 mg/mn
3) on the dewpoint in the fuel gas. This shows that the dewpoint temperature of the fuel gas produced with primary measures lies within the range of 180 tot 250°C, with dolomite addition providing the lowest dewpoint temperature of 180°C. A dewpoint temperature below 200°C might be advantageous as it prevents or minimises tar condensation in a particulate filter such as a bag filter. A combination of class 2 and 4 tar concentration ranges give rise to a dewpoint temperature in the range of 100 to 150°C. This is significantly lower than for class 5 tars, but is of significance in low temperature gas cleaning systems such as applied in gasification systems A and C. In all cases a small to significant decrease of class 3 tars is envisaged. However, these tars are recognised as less significant with respect to tar condensation or solubility problems. As it is further shown, an increasing gasification temperature and residence time will lead to a growth in molecular size of the produced tars (increase in class 4 and 5 tars, due to decrease (?) in class 1) leading to increased tar problems with respect to soot formation, condensation (higher dewpoint) and possibly aerosol formation and a decrease in heterocyclic and substituted aromatics which will lead to decreased problems with respect to water pollution.
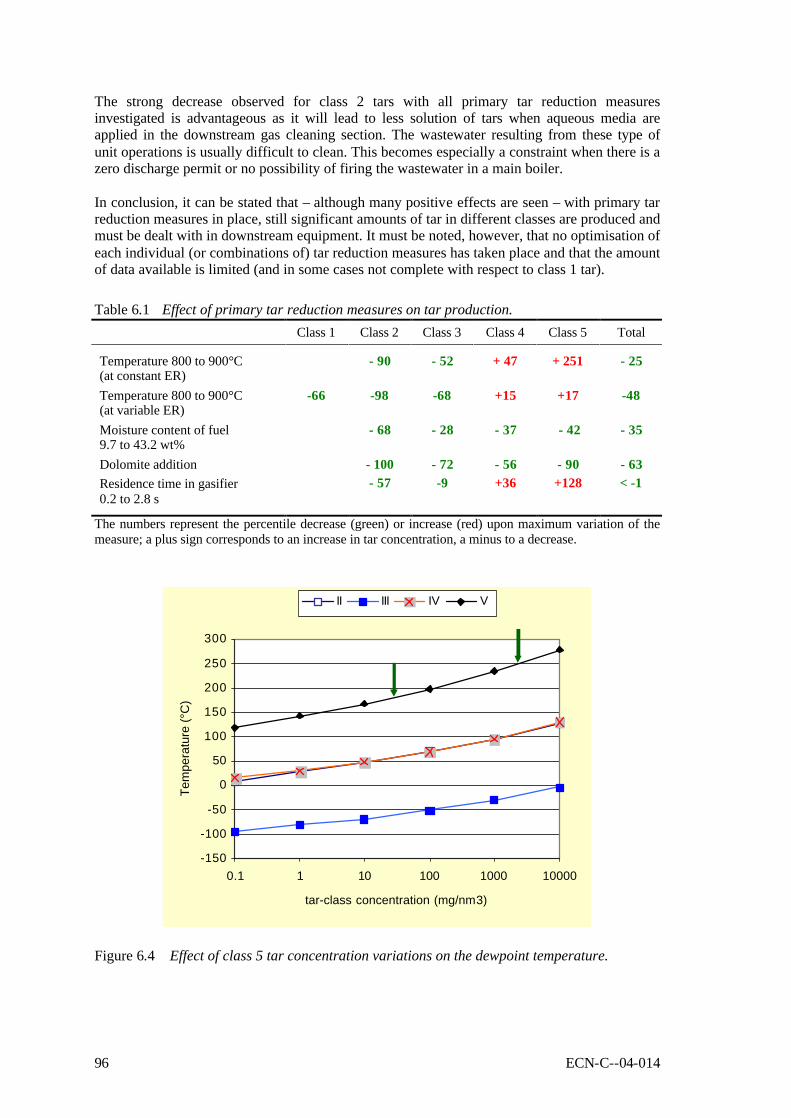
96 ECN-C--04-014
The strong decrease observed for class 2 tars with all primary tar reduction measures investigated is advantageous as it will lead to less solution of tars when aqueous media are applied in the downstream gas cleaning section. The wastewater resulting from these type of unit operations is usually difficult to clean. This becomes especially a constraint when there is a zero discharge permit or no possibility of firing the wastewater in a main boiler. In conclusion, it can be stated that – although many positive effects are seen – with primary tar reduction measures in place, still significant amounts of tar in different classes are produced and must be dealt with in downstream equipment. It must be noted, however, that no optimisation of each individual (or combinations of) tar reduction measures has taken place and that the amount of data available is limited (and in some cases not complete with respect to class 1 tar).
Table 6.1 Effect of primary tar reduction measures on tar production. Class 1 Class 2 Class 3 Class 4 Class 5 Total
Temperature 800 to 900°C (at constant ER)
- 90 - 52 + 47 + 251 - 25
Temperature 800 to 900°C (at variable ER)
-66 -98 -68 +15 +17 -48
Moisture content of fuel 9.7 to 43.2 wt%
- 68 - 28 - 37 - 42 - 35
Dolomite addition - 100 - 72 - 56 - 90 - 63 Residence time in gasifier 0.2 to 2.8 s
- 57 -9 +36 +128 < -1
The numbers represent the percentile decrease (green) or increase (red) upon maximum variation of the measure; a plus sign corresponds to an increase in tar concentration, a minus to a decrease.
-150
-100
-50
0
50
100
150
200
250
300
0.1 1 10 100 1000 10000
tar-class concentration (mg/nm3)
Tem
pera
ture
(°C
)
II III IV V
Figure 6.4 Effect of class 5 tar concentration variations on the dewpoint temperature.

ECN-C--04-014 97
6.3 Discussion and conclusions The main technical and economical implications associated with the implementation of primary tar reduction measures are discussed. More details can be found in the individual partner report by Meijer [1].
6.3.1 Main technical implications It is clear that the primary tar reduction measures have a significant impact on the tar production from the gasifier. Although not yet optimised the results clearly show the potential of the applied tar reduction methods. The two main quantifiable parameters are the effect of the primary measures on the tar dewpoint in the fuel gas and the amount of water-soluble tars in the fuel gas. In Table 6.2, the positive or negative effect of the primary measures on these parameters is indicated. It is assumed that class 1, 4 and 5 tars are most relevant with respect to the tar dewpoint, whereas class 2 tars contribute most to pollution of the water in wet scrubbing systems.
Table 6.2 Positive or negative effect of primary tar measures on tar dewpoint and water solubility.
Primary tar reduction method Effect on dew point temperature
Effect on water solubility
Increased gasification temperature neg pos Increased moisture content fuel pos pos Dolomite addition pos pos Increased residence time in gasifier neg pos
pos = lower dewpoint temperature or lower water solubility; neg = higher dewpoint temperature or higher water solubility The most important technical consequences of implementing the selected primary tar reduction methods in biomass gasification processes are listed in Table 6.3. This shows that careful consideration must be taken before implementing primary tar reduction methods within biomass gasification systems. The final conclusions from this technical assessment are that: • an increased gasification temperature can be achieved with little to minor technical
consequences, • an increased residence time in the gasifier can be taken into consideration and implemented
fairly easily in a new design, but will usually have extensive technical consequences in an existing installation, and
• an increased moisture content of the fuel and in-bed dolomite (or olivine) addition require extensive modifications to the installation or have to be taken into consideration in a new design. Furthermore, introduction of these tar reduction measures will lead to additional constraints to downstream equipment and to input and by-product streams.

98 ECN-C--04-014
Table 6.3 Main technical implications of implementing primary tar reduction measures. Benefits / cost savings Disadvantages / extra costs Higher gasification temperature • Less water-soluble tars • Higher output temperature from gasifier • Less water treatment requirements • Lower C-content of ashes
• Agglomeration risk • More condensable tars (class 1 tars ?!) and higher
propensity for aerosol and condensate formation • Increased internal energy use • Decrease in thermal efficiency, LHV and total
thermal capacity of fuel gas • More sticky fly-ash (?) • Lower net power output
Higher fuel moisture content • Less water-soluble tars • Less condensable tars • Less drying needed • Wider fuel range • Lower C-content of ashes • Higher heat transfer propensity in fuel gas • Lower propensity for aerosol and
condensate formation • Less water treatment requirements
• Significantly less net power output • Higher fuel throughput required • Extra fuel storage requirements • Significantly increased fuel gas flow, internal
energy use and size of gas cleaning equipment • Decrease in thermal efficiency, LHV and total
thermal capacity of fuel gas • Increased condensate amount from wet fuel gas
cleaning
Dolomite addition • Only few water soluble tars • Less condensable tars • Less contaminants in fuel gas • Lower propensity for aerosol and
condensate formation • Less water treatment requirements • Lower C-content of ashes
• Dolomite storage, dosing equipment • Quality requirements and costs of dolomite
addition • Increased ash production • Quality and saleability of the ashes • Extra CO2 emission
Longer residence time in gasifier • Less water-soluble tars • Less water treatment requirements • Lower C-content of ashes
• Effect on size of gasifier • More condensable tars and higher propensity for
aerosol and condensate formation
ECN-C--04-014 99
6.3.2 Economic implications The effect of these technical implications on the economics of the biomass gasification system have been assessed in a sensitivity analysis for three cases: 1. 30 MWth Arbre concept (system A) 2. 100 MWth co-firing in PC-boiler (system B) 3. 10 MWth stand-alone with gas engine (system C). For this matter the specific investment costs for these systems where determined from commercially realised gasification systems (Arbre, Amer, Lahti) and communications with several manufacturers. In the applied sensitivity analysis, several parameters associated with implementing primary tar reduction measures were varied in a low, base and high case. Parameters that have been varied in the sensitivity analysis are: Total Investment costs With dolomite addition and especially a higher moisture content in
the fuel the investment costs will increase Full load hours per year This reflect any changes in availability and reliability when
implementing primary measures Depreciation period No direct influence of primary measures but known to be important
parameter, therefore included Maintenance costs Reflects the effect of complexity of the system Operating costs Idem and the amount of personnel needed to operate the plant Biomass costs Reflects the range of fuel that can be applied, e.g. wetter cheaper
fuels with less pre-treatment costs E-revenues incl. MEP E revenues for selected systems are different depending on scale
and type of system (co-firing/stand-alone) Ash disposal costs Reflects the effect of producing more or less ash with different
quality Net efficiency Of the prime mover, this reflects the effect of scale size.
Additionally also the effect of the primary measures on the total heat capacity in the fuel gas is included in the analysis.
The effect of this parameter sensitivity analysis is expressed in the effect on the net yearly revenue from this project (under the applied assumptions), where the base case is taken as a reference situation (zero revenues). It must be stated that not the absolute net yearly revenue presented is the key value (this will be different for each project and is subject to many assumptions) but the effect of variation of the parameters on this value. Subsequently their connection to specific primary tar reduction measures shows which method - when implemented - can prove to be beneficial and which not. Hereby the distinction is made between retrofitting existing and newly-built installations. Figure 6.5 shows the outcome of the sensitivity analysis on the net yearly revenues (MEUR/y) for the three analysed systems in a Tornado diagram.
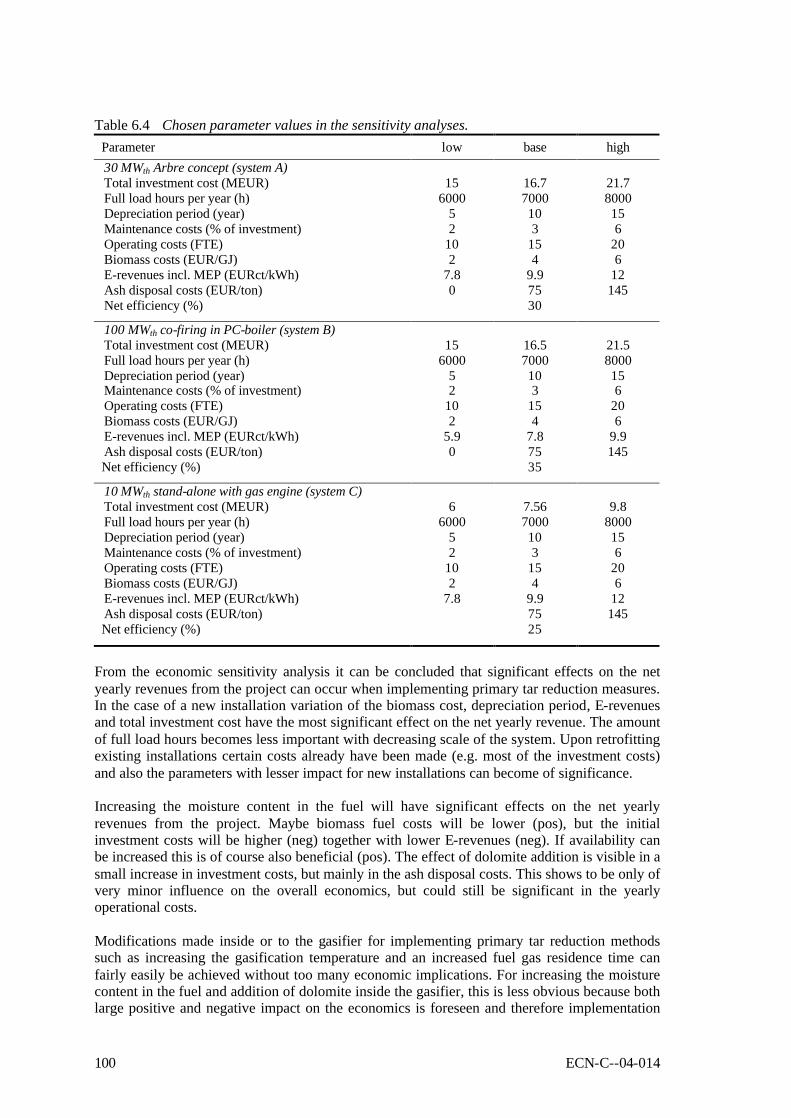
100 ECN-C--04-014
Table 6.4 Chosen parameter values in the sensitivity analyses. Parameter low base high 30 MWth Arbre concept (system A) Total investment cost (MEUR) Full load hours per year (h) Depreciation period (year) Maintenance costs (% of investment) Operating costs (FTE) Biomass costs (EUR/GJ) E-revenues incl. MEP (EURct/kWh) Ash disposal costs (EUR/ton) Net efficiency (%)
15
6000 5 2
10 2
7.8 0
16.7 7000 10 3
15 4
9.9 75 30
21.7 8000 15 6
20 6
12 145
100 MWth co-firing in PC-boiler (system B) Total investment cost (MEUR) Full load hours per year (h) Depreciation period (year) Maintenance costs (% of investment) Operating costs (FTE) Biomass costs (EUR/GJ) E-revenues incl. MEP (EURct/kWh) Ash disposal costs (EUR/ton) Net efficiency (%)
15
6000 5 2
10 2
5.9 0
16.5 7000 10 3
15 4
7.8 75 35
21.5 8000 15 6
20 6
9.9 145
10 MWth stand-alone with gas engine (system C) Total investment cost (MEUR) Full load hours per year (h) Depreciation period (year) Maintenance costs (% of investment) Operating costs (FTE) Biomass costs (EUR/GJ) E-revenues incl. MEP (EURct/kWh) Ash disposal costs (EUR/ton) Net efficiency (%)
6
6000 5 2
10 2
7.8
7.56 7000 10 3
15 4
9.9 75 25
9.8
8000 15 6
20 6
12 145
From the economic sensitivity analysis it can be concluded that significant effects on the net yearly revenues from the project can occur when implementing primary tar reduction measures. In the case of a new installation variation of the biomass cost, depreciation period, E-revenues and total investment cost have the most significant effect on the net yearly revenue. The amount of full load hours becomes less important with decreasing scale of the system. Upon retrofitting existing installations certain costs already have been made (e.g. most of the investment costs) and also the parameters with lesser impact for new installations can become of significance. Increasing the moisture content in the fuel will have significant effects on the net yearly revenues from the project. Maybe biomass fuel costs will be lower (pos), but the initial investment costs will be higher (neg) together with lower E-revenues (neg). If availability can be increased this is of course also beneficial (pos). The effect of dolomite addition is visible in a small increase in investment costs, but mainly in the ash disposal costs. This shows to be only of very minor influence on the overall economics, but could still be significant in the yearly operational costs. Modifications made inside or to the gasifier for implementing primary tar reduction methods such as increasing the gasification temperature and an increased fuel gas residence time can fairly easily be achieved without too many economic implications. For increasing the moisture content in the fuel and addition of dolomite inside the gasifier, this is less obvious because both large positive and negative impact on the economics is foreseen and therefore implementation
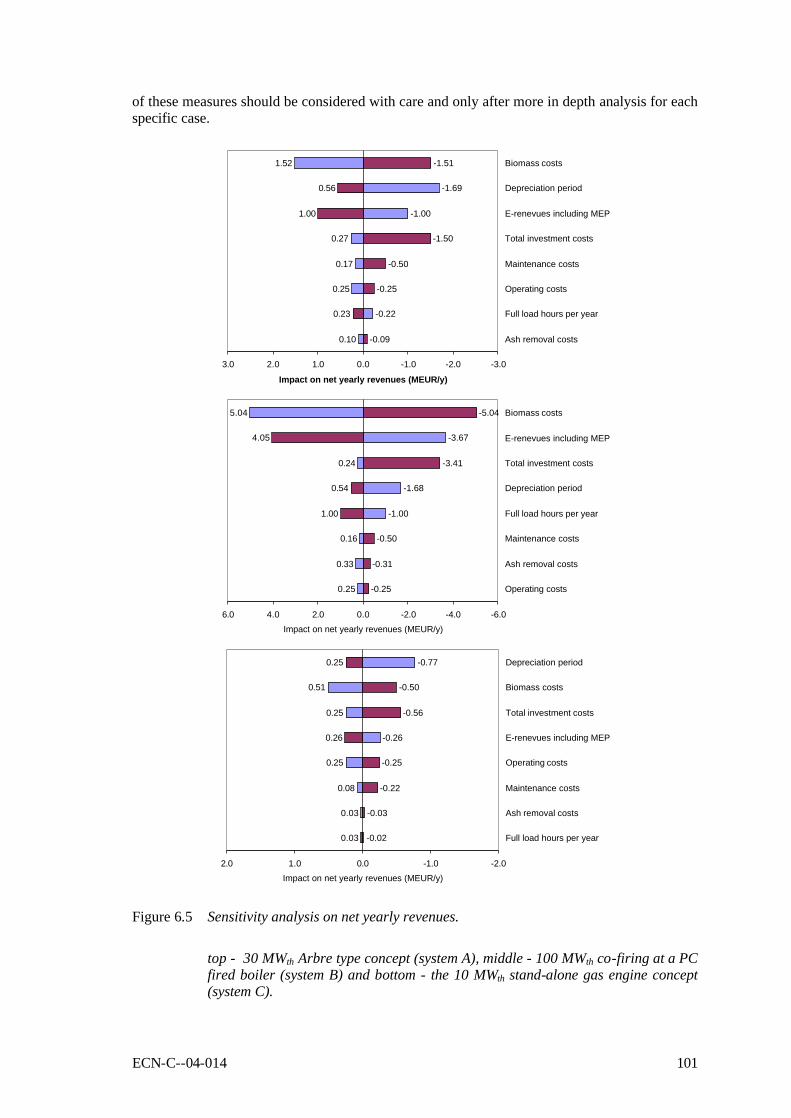
ECN-C--04-014 101
of these measures should be considered with care and only after more in depth analysis for each specific case.
0.10
-0.22
0.25
0.17
0.27
-1.00
-1.69
1.52
-0.09
0.23
-0.25
-0.50
-1.50
1.00
0.56
-1.51
-3.0-2.0-1.00.01.02.03.0
Ash removal costs
Full load hours per year
Operating costs
Maintenance costs
Total investment costs
E-renevues including MEP
Depreciation period
Biomass costs
Impact on net yearly revenues (MEUR/y)
0.25
0.33
0.16
-1.00
-1.68
0.24
-3.67
5.04
-0.25
-0.31
-0.50
1.00
0.54
-3.41
4.05
-5.04
-6.0-4.0-2.00.02.04.06.0
Operating costs
Ash removal costs
Maintenance costs
Full load hours per year
Depreciation period
Total investment costs
E-renevues including MEP
Biomass costs
Impact on net yearly revenues (MEUR/y)
-0.02
0.03
0.08
0.25
-0.26
0.25
0.51
-0.77
0.03
-0.03
-0.22
-0.25
0.26
-0.56
-0.50
0.25
-2.0-1.00.01.02.0
Full load hours per year
Ash removal costs
Maintenance costs
Operating costs
E-renevues including MEP
Total investment costs
Biomass costs
Depreciation period
Impact on net yearly revenues (MEUR/y)
Figure 6.5 Sensitivity analysis on net yearly revenues.
top - 30 MWth Arbre type concept (system A), middle - 100 MWth co-firing at a PC fired boiler (system B) and bottom - the 10 MWth stand-alone gas engine concept (system C).

102 ECN-C--04-014
0
40
80
120
160
200
1 2 3 4 5 6 7 8 9 10 11 12 13 14 15Case nr
Net
pow
er p
rodu
ctio
n (G
Wh/
y)
0
5
10
15
20
25
E re
venu
es (M
EU
R/y
)
E-production (GWh/y)
E-revenues MEUR/y)
Figure 6.6 Net power production and E-revenues.
(for a description of the cases, see Table 6.5)
The total thermal capacity of the fuel gas will vary depending on the scale of the gasifier. This is also influenced by the moisture content of the fuel. Figure 6.6 shows the effect on the net power output and associated revenues. It clearly points out that with increased gasification temperature (case 1-3, 4-6 and 7-9) and with increased moisture content in the fuel (case 10-12 and 13-15) the net power output and E-revenues, especially in the latter case, decrease significantly.
Table 6.5 Main parameters of the fifteen cases evaluated. System Case
Nr Gasification temperature
(°C)
Size (MWth)
Fuel moisture content (vol.%)
B 1 2 3
800 850 900
100 100 100
10 10 10
A 4 5 6
800 850 900
30 30 30
10 10 10
C 7 8 9
800 850 900
10 10 10
10 10 10
B 10 11 12
850 850 850
100 100 100
10 26 43
C 13 14 15
850 850 850
10 10 10
10 26 43

ECN-C--04-014 103
6.4 Conclusions For three basic gasification systems the technical and economic implications of implementing various tar reduction measures have been evaluated. For this purpose the complete gasification chain - from fuel to emissions from the prime mover - was considered. Focus has been put on the following primary tar reduction measures: higher gasification temperature, higher fuel moisture content, addition of dolomite into the gasifier and variation of the gas residence time in the gasifier. At present, tar related problems are the main drawback for the commercial breakthrough and success of large-scale biomass gasification systems. Many manufacturers are currently still developing gasification systems in which less tars are produced or better clean-up methods are applied. This in order to avoid problems in the first heat exchanger, the fuel gas cleaning system and the prime mover combustion device. This is emphasized, e.g., by the fact that this was regarded as the most interesting session topic on a combined IEA biomass gasification and Gasnet meeting in Strassbourg, France in October 2002. Decreasing, or even better still, solving these operational problems with the implementation of primary tar reduction measures would significantly stimulate the commercial breakthrough of biomass gasification systems. The results and analyses presented in this Chapter lead to an overall opinion on the technical and economic impact of each of the described primary tar reduction measures on the specified gasification systems is given in Table 6.6.
Table 6.6 Expected technical and economic benefits of primary tar reduction measures for different gasification systems.
System A Arbre
System B Co-firing
System C Stand-alone gas
engine
Gasification temperature • Technical • Economic
- +
+/- +
+ +
Moisture content fuel • Technical • Economic
+/- -
+
+/-
+/- -
Dolomite addition • Technical • Economic
(+) (+)
-
(+)
+ +
Increased residence time • Technical • Economic
+/- 0
+/- 0
+/- 0
For the Arbre system - which already contains a secondary dolomite addition step - no primary tar reduction method with both clear technical and economic benefits can be identified at this time. When co-firing the fuel gas in a pulverised-coal-fired boiler, several primary tar reduction methods are identified as being both technically and economically beneficial. This holds especially for a higher gasification temperature and a higher fuel moisture content. For a stand-alone biomass gasification system equipped with a wet scrubbing system (including a wet ESP), a higher gasification temperature and dolomite addition can be beneficial. In conclusion, it can be stated that primary tar reduction measures can be sufficient (if needed) for tar control in co-firing systems. Other applications will always need additional secondary tar
104 ECN-C--04-014
removal methods to fully control the tars produced in a biomass gasification system and enable the use of the produced fuel gas in a prime mover.
6.5 Recommendations The primary tar methods under investigation in this project clearly show potential for reducing the operational problems related to the presence of tars. However, further optimisation of tar reduction measures and more specific know-how on the behaviour of specific tar compounds is needed. Especially, more detailed information on the production of class 1 tars is required. In order to fully assess the technical and economic implications of primary tar reduction measures, clear concentration targets for each specific tar class and its most dominant individual components at the outlet of the gasifier are needed with respect to the requirements and demands and its behaviour in downstream equipment and the foreseen application.
6.6 References [1] Meijer, R.: Primary measures for tar reduction in fluidised bed biomass gasifiers. Task 7
- Economic and practical feasibility, recommendations. Report 50071366-KPS/TPE 03-1115, KEMA, Arnhem, 2003.

ECN-C--04-014 105
7. OVERALL PROJECT CONCLUSIONS
Following the initial inventory study, it has been decided to focus the project on advancing the knowledge base on tar formation in air-blown, atmospheric-pressure fluidised-bed gasification of woody biomass, in particular with respect to: • the effect of various fuel properties and gasifier operating conditions, • the underlying mechanisms, and • the impact of the resulting tar concentration and composition on the performance of
downstream processes. With respect to the latter, water solubility and condensation behaviour, expressed in terms of the tar dewpoint, were identified as the most important tar properties. In addition, a first assessment has been made of the practical and economic feasibility of identified, most promising primary measures. The work was focussed mainly on bubbling-fluidised-bed (BFB) gasification, but circulating-fluidised-bed (CFB) gasification was addressed as well. Furthermore, much attention was given to the definition, measurement and classification of tar. In this respect, tar was defined as "all organic compounds with a molecular weight larger than benzene (excluding soot and char)". From the work, conducted by the five partners in the project, the following overall conclusions can be drawn: • A proper design and representative operation of a lab-scale bubbling-fluidised-bed gasifier
certainly is not a simple, straightforward task. Especially a proper sizing and positioning of the biomass feeding system, and an adequate cooling of this system, appear to be essential. Part of the lab-scale experimental results was found to be of limited value, because of imperfections in this respect.
• The combination of accurate measurement of individual tar compounds and a tar
classification system with water solubility and condensation behaviour as the main criteria, has proven to be very effective for: − a concise presentation of the impact of process parameters on tar formation, − the elucidation of the underlying mechanisms, and − the evaluation of the impact of tar content and composition in the product gas on the
performance of downstream processes. • In the experimental programme, the impact of three fuel properties (ash content, moisture
content and lignocellulose composition) and three operating conditions (gasification temperature, gas residence time, and bed material/additives) has been determined. In general, these parameters were varied independently, i.e. while keeping the others constant. This was made possible by the trace heating on the wall of the lab-scale gasifiers. With respect to these parameter variations, the following can be concluded:
− Variation of the ash content in the bed, simulated by co-feeding high-ash char (approx.
40 wt% ash), has a negligible impact up to the maximum tested char/biomass ratio of 17 wt%.
− An increase in moisture content, simulated by mixing dry biomass off-line with water,
leads to a decrease in total tar content. Also all the individual tar classes show a clear decrease. However, the highly water-soluble heterocyclic compounds (class 2 tars) could not be eliminated completely at the given gasification temperature of 800-825°C and approx. 4 s gas residence time, and the tar dewpoint only showed a slight decrease.

106 ECN-C--04-014
− The lignocellulose composition seems to have some effect on the total tar concentration, while having no significant effect on the tar composition. Experiments with a fuel prepared from pure cellulose gave lower tar concentrations than experiments with willow and beech, which could be explained from differences between (hemi-)cellulose and lignin. However, despite the lower tar concentrations, the tar dewpoint remained nearly the same.
− Increasing the gasification temperature from 750 to 900°C at constant ER has a large
impact on tar formation, in particular on the tar composition. Class 2 tars are decomposed almost completely at 850°C and higher. On the other hand, the 2-3 ring PolyAromatic Hydrocarbon (PAH) compounds (class 4) and the 4-7 ring PAH compounds (class 5) concentration continuously increases with increasing temperature, leading to a continuous and substantial increase in tar dewpoint. The class 3 light aromatic compounds went through a maximum at 780-800°C, just as the total tar concentration.
− Realising that in an actual, industrial-scale gasifier, there is a coupling between the
gasification temperature and the equivalence ration ER, additional experiments were conducted with a simultaneous, coupled variation of the gasification temperature and ER (higher ER to get higher temperature). These experiments gave a strong decrease in total tar content. However, here again the tar dewpoint showed an increase due to an increase in heavy PAH compounds (class 5 tar), despite the diluting effect of a higher ER. A more detailed analysis, focussing on the heavy tar fraction in particular, revealed that the heavy PAH compounds are formed by dimerisation reactions of two PAH compounds or by cyclisation or polymerisation reactions of unsaturated C2-C4 hydrocarbons like acetylene and ethylene. These latter compounds are produced in the decomposition of aromatic as well as linear hydrocarbons.
− Increasing the gas residence time (in the freeboard of a BFB gasifier) was found to
have a similar, but much smaller, effect than increasing the gasification temperature. − In addition to (calcined) dolomite, highly attrition-resistant olivine has been identified,
and characterised in a (post-bed) fixed-bed reactor, as a prospective bed additive or bed material for tar reduction. Pre-treatment in air at 900°C improves the catalytic activity of olivine considerably. Up to 10 hours, the activity appears to increase with increasing pre-treatment time. The mechanism behind the catalytic activity of the non-porous olivine is not exactly understood yet, but it seems related to the presence of iron at the particle surface; pre-treatment leads to a segregation of iron at the outer surface. Further research is foreseen to elucidate the catalytic mechanisms and the in-bed performance of this relatively new bed additive / bed material.
• The reported results of lab-scale BFB gasification were found to be representative for CFB
gasification as well, provided that differences in gasification temperature and gas residence time (distribution) are taken into account. The report contains data to account for these differences.
• Some attempts were made to model tar formation applying two different modelling
approaches, viz. a black-box model and a continuous tar cracking model. Both models were not based on identified formation mechanisms and appeared to have some validity only for a limited set of (lab-scale) operating conditions.
• Based on the findings concerning the impact of fuel properties and gasifier operating
conditions on tar content and composition, conclusions may be drawn concerning the possibilities of tar control by primary measures. To this purpose, a distinction should be
ECN-C--04-014 107
made between firing the product gas in a coal-fired boiler (indirect co-firing) or in a stand-alone boiler on the one hand, and more advanced applications of the product gas on the other hand:
− In indirect co-firing, the product gas is used as a secondary fuel for the main (coal-fired)
boiler. Generally, the product gas temperature is kept as high as possible to prevent tar-induced problems. In that case, the gas will not be cooled to temperatures below the water dewpoint. Therefore, tars with a high water solubility (class 2) do not pose a problem. However, the gas cooling will require in most cases a mild control of the heavy PAH content in the product gas. Generally, primary measures in the form of a proper selection of fuel properties and gasifier design and/or operating conditions seem to offer enough possibilities to avoid severe tar-induced fouling problems. The same holds for the case, where the product gas is kept at high temperature and then fired in a stand-alone boiler.
− More advanced applications, such as firing the product gas in a gas engine or a gas
turbine, or using the product gas for the production of gaseous or liquid fuels, generally require a much cleaner product gas and often require the product gas to be cooled down to (near-)ambient temperature. In these cases, generally, primary measures will not suffice to meet the requirements concerning tar content and composition, and secondary tar removal will be necessary. However, primary measures may be applied then to optimise the tar composition for these secondary removal processes or for gas cooling and cleaning processes in general. For example, if water scrubbing is applied, primary measures may be used to fully decompose the highly water-soluble class 2 tars, leading to a considerable reduction in wastewater treatment cost.
• Of the different primary measures considered, increasing the gasification temperature can
be achieved with little to minor technical consequences. Increasing the gas residence time in the gasifier can be taken into consideration and implemented fairly easily in a new design, but will usually have extensive technical consequences in an existing installation. An increase in fuel moisture content and in-bed dolomite (or olivine) addition require extensive modifications to the installation or have to be taken into consideration in a new design. Furthermore, introduction of these latter measures will lead to additional constraints to downstream equipment and to input and by-product streams.
• The economic implications of increasing the gasification temperature and increasing the gas
residence time (in a new design) are expected to be limited. For increasing the fuel moisture content and dolomite (or olivine) addition, this is less obvious because both large positive and negative impact on the economics is foreseen and therefore implementation of these measures should be considered with care and only after more in depth analysis for each specific case.
• Given the clear potential of primary measures for reducing tar-related operational problems,
further R&D is recommended 1) to optimise the measures considered both individually and in combination, 2) to investigate the impact of air staging and 3) to further elucidate their potential in CFB gasification. Furthermore, given the important role of the class 1 tar fraction and its complex composition, it is recommended to put more effort in the determination of the composition of this tar class in future work.

108 ECN-C--04-014