primary education in remote indonesia...vi. table 7 village leadership characteristics 12 table 8...
TRANSCRIPT
Primary Education in Remote Indonesia:Survey Results from West Kalimantan and East Nusa Tenggara
D e c e m b e r 2 0 1 9
Pub
lic D
iscl
osur
e A
utho
rized
Pub
lic D
iscl
osur
e A
utho
rized
Pub
lic D
iscl
osur
e A
utho
rized
Pub
lic D
iscl
osur
e A
utho
rized

© 2019 The World Bank
1818 H Street NW, Washington DC 20433 Telephone: 202-473-1000; Internet: www.worldbank.org
Some rights reserved.
This work is a product of the staff of The World Bank. The findings, interpretations, and conclusions expressed in this work do not necessarily reflect the views of the Executive Directors of The World Bank or the governments they represent. The World Bank does not guarantee the accuracy of the data included in this work. The boundaries, colors, denominations, and other information shown on any map in this work do not imply any judgment on the part of The World Bank concerning the legal status of any territory or the endorsement or acceptance of such boundaries.
Rights and Permissions
The material in this work is subject to copyright. Because The World Bank encourages dissemination of its knowledge, this work may be reproduced, in whole or in part, for noncommercial purposes as long as full attribution to this work is given.
Attribution—World Bank. 2019. Primary Education in Remote Indonesia: Survey Results from West Kalimantan and East Nusa Tenggara.© World Bank.”
All queries on rights and licenses, including subsidiary rights, should be addressed to World Bank Publications, The World Bank Group, 1818 H Street NW, Washington, DC 20433, USA; fax: 202-522-2625; e-mail: [email protected].
Primary Education in Remote Indonesia:
Survey Results from West Kalimantan and East Nusa Tenggara
SOCIAL DEVELOPMENT UNIT
THE WORLD BANK – INDONESIA
DECEMBER 2019


i i i .
Table of ContentsAcknowledgments ixAbbreviations xiExecutive Summary xiii
01 Introduction
02 Scope of the Study: Locations, Instruments and Sample
03 Schooling Context
1
5
13
Selection of Study Areas 5
Survey Instruments 7
Study Participants and Respondents 9
Description of Study Villages 9
School Characteristics 13
School Availability 13
Student Distribution 13
School Facilities 14
School Budget 15
Language and Curriculum Utilized in Sample Schools 16
Teaching and Learning Time in Academic Year 2015/16 17
School Supervision and Meetings in Academic Year 2015/16 18
Teachers and Principals 19
Characteristics of Principals and Teachers in Study Schools 19
Living Conditions 22
Activities at School and Outside School 23
Incentives and Motivations of Principals and Teachers 29
Salaries and Allowances 29
Perceptions, Challenges, and Satisfaction of Principals and Teachers 32
TABLE OF CONTENTS

i v .
04 Parent and Community Involvement in Education
05 Teacher Absence
06 Student Absence and Learning Outcomes
07 Conclusion
37
47
55
61
Parents 37
Parent Background 37
Child Support and Activities at Home 38
Parents’ Expectations for Their Children 38
School Committees 41
Committee Background and Establishment 41
Committee Management 41
Involvement of Parents and Committees at School 43
Parental and Committee Involvement at School 43
Parent Satisfaction 44
Committee Satisfaction 45
Definitions and Statistics 47
Definition and Measurement 47
Class Absence, or Classes Observed without Teachers 47
Teacher Absence from School 48
Teacher Absence from Teaching 50
Determinants of Teacher Absence 50
Student Absence 55
Outcome Levels 55
Determinants of Student Learning 59
Annex A. Primary School Availability, Student Test Scores, and Student Absence 65
Annex B. Student Competency Classifications 83
Reference 85

Table of Figures, Maps and Tables
v .
Figure 1 School Meetings with External Stakeholders, 2015/16 18
Figure 2 Topics Covered During Internal Meetings 19
Figure 3 Principal and Teacher Education Levels 21
Figure 4 Principal and Teacher Longevity at Current School 22
Figure 5 Median Monthly Total Income 27
Figure 6 Median Monthly Base Salary 27
Figure 7 Median Monthly Total Allowances 28
Figure 8 Parent Satisfaction with Education Quality and Child Learning Outcomes 46
Figure 9 School Committee Satisfaction with Education and School Quality 46
Map 1 Participating Districts and Number of Schools in Each District 5
Table 1 Characteristics of the Study Districts Compared with Provincial and National Averages 6
Table 2 Student Learning Assessment: Sample Description 7
Table 3 Study Participants and Respondents 8
Table 4 Characteristics of Study Villages 10
Table 5 Distance and Travel Time From School to Key Institutions 11
Table 6 Distance and Travel Time from The Village Hall to Administrative and Financial Institutions 65
TABLE of CONTENTS
Figures
Map
Tables

v i .
Table 7 Village Leadership Characteristics 12
Table 8 Availability of Education Facilities in the Villages 14
Table 9 Characteristics of Student Population in the Sample Schools 15
Table 10 Gender Distribution of Students, by Grade 65
Table 11 Availability of Key School Facilities 66
Table 12 Funding Sources for Sample Schools, Academic Year 2015/16 16
Table 13 Fees Charged to Parents, Academic Year 2015/16 17
Table 14 Instructional Language, Curriculum, and Teaching Load, Academic Year 2015/16 64
Table 15 Instructional Time, Academic Year 2015/16 65
Table 16 School Supervision and Meetings, Academic Year 2015/16 18
Table 17 Principal and Teacher Demographics 20
Table 18 Teacher Certification Status 21
Table 19 Principal and Teacher Work Experience 22
Table 20 Principals’ Characteristics 23
Table 21 Teachers’ Characteristics 24
Table 22 Principals’ Living Conditions: Median Distance, Travel Time, and Transportation Cost from Home o School 67
Table 23 Teachers’ Living Conditions: Median Distance, Travel Time, and Transportation Cost From Home to School 68
Table 24 Teachers’ Activities at School, Academic Year 2015/16 25
Table 25 Principals’ Additional Activities: Trainings, Other Jobs, and Involvement in Local Organizations 26
Table 26 Teachers’ Additional Activities: Trainings, Other Jobs, and Involvement in Local Organizations 27
Table 27 Evaluation of Teachers by Principal Academic Year 2015/16 28
Table 28 Principals’ Salary Delivery Mode 29
Table 29 Teachers’ Salary Delivery Mode 29
Table 30 Average Amount of Principals’ Allowances 68
Table 31 Average Amount of Teachers’ Allowances 69
Table 32 Principals’ and Teachers’ Allowance Delivery 70
Table 33 Principals’ Opinions of Teachers and Students 32
Table 34 Challenges Experienced by Teachers 33
TABLE of CONTENTS
v i i .
Table 35 Teachers’ Reported Satisfaction with Education Stakeholders 72
Table 36 Teachers’ Reported Satisfaction with Their Salary (Percentage of Teachers) 73
Table 37 Parents’ Background Information (% Parents) 39
Table 38 Child’s Education and Parent Involvement 40
Table 39 Child Participation in Paid, Unpaid, and Household Works 41
Table 40 Parents’ Expectations of Child’s Education 41
Table 41 School Committee Characteristics 74
Table 42 School Committee Respondent Characteristics, Selection Process, and Funding Sources 43
Table 43 Parents’ Involvement in School, Academic Year 2015/16 45
Table 44 School Committee Activities, Academic Year 2015/16 75
Table 45 Teacher Presence and Students’ Activities in Classrooms 48
Table 46 Teacher Absence from School 49
Table 47 Teacher Absence from Teaching 51
Table 48 OLS Regressions of Teacher Absence on Selected Teacher and School Characteristics 52
Table 49 Student Absence and Reasons, by Grade 76
Table 50 Student Test Scores: Descriptive Statistics 56
Table 51 Student Test Scores in Indonesian and Math, by Parent Education 53
Table 52 Classification of Student Competency in Indonesian, by Grade 75
Table 53 Classification of Student Competency in Math, by Grade 78
Table 54 OLS Regressions of Student Test Scores on Selected Student and School Characteristics 60
Table 55 Primary School Availability at The Subdistrict Level 79
Table 56 Mean Student Test Scores, by Grade and Gender 80
Table 57 Student Absence, by Grade and Gender 81
Table 58 OLS Regressions of School, Principal, and Teacher Characteristics on Reported Teacher Shortage at School 82
v i i i .

i x .
AcknowledgmentsThe Indonesia KIAT Guru: Improving Teacher Performance and Accountability analytical study was led by Dewi Susanti (Senior Social Development Specialist) with a core team that included Christopher Bjork (Professor of Educational Studies, Vassar College); Arya Gaduh (Associate Professor of Economics, University of Arkansas); Jan Priebe (Research Fellow, German Institute of Global and Area Studies); and Menno Pradhan (Professor at the Amsterdam Institute for International Development - Free University and University of Amsterdam). Adama Bah (Development Economist, KIT Royal Tropical Institute), Jan Priebe and Dewi Susanti wrote the report. Team research analysts were Rajius Idzalika (Monitoring and Evaluation Analyst, Former Consultant, World Bank); Kurniawati (Data management Analyst, TNP2K); Sharon Kanthy Lumbanraja (Research and Knowledge Management Analyst, TNP2K); and Indah Ayu Prameswari (Research and Knowledge Management Associate, TNP2K).
Data collection and cleaning was led by Dedy Junaedi (Survey Team Leader, Consultant, World Bank); Lulus Kusbudiharjo (Survey Assistant Team Leader, Consultant, World Bank); Anas Sutisna (Survey Assistant Team Leader, Consultant, World Bank); and Mulyana (Data Programmer, Consultant, World Bank), with a great contribution of data collection conducted by Anggitya Eki Adista, Agustian, Aulia Subur Prasetyo Aji, Sulthani Al Aziz, Riska Ayu Andriyani, Meritaningrum Anggraeni, Fitri Nur Annisa, Rizwar Ansyari, Kartika Yoga Asmara, Doni Aswandi, Yohannes Adio B, Budiyanto, Fiske Kristina Chandrawati, Sartika Dewi, Santi Dwiningsih, M Makhrus Effendi, Nurul Endrastuti, Mochamad Faizin, Niza Ferlina, Paulus Fernandez, Astarina Fiona, Muhammad Firdaus, Fitra, Ikhwanul, Hendri Gunawan, Yuyu Gustiana, Rois Habibi, Vembri Harjanti, Syarif Hidayat, M Ikhsanudin, Farikha Fathul Imami, Nurul Isnaini, Wulan Kusuma Jati, Hikmat Catur Jayusman, Panggung Dwi Kuncoro, Mugi Lestari, Ade Liska, Budi Marwanto, Amrinsiana Merry, Siti Munawaroh, Syirojan Muniron, Ria Arbiati Ningtyas, Irvan Noer, Nur Aji Nugroho, Nurbaiti, Sigit Sawung Pamuji, Andriyani Prabawati, Aninda Pratiwi, Jayus Priyana, Nunik Pudyastini, Lilik Hadi Purwanto, Deny Puspitasari, Dani Ramdani, Ramdhony, Rano, A Rifa’i, Deni Riyanto, Ade Rizky, Nur Rochim, Anton Rohmadi, Sabiruddin, Rahmat Saiful, Dedy Samsiar, Itmamul Wafa Samudra, Teguh Santoso, Idha Ayu Setyawati, Setyorini, Isti Sofia, Subadri, Sukiyanto, Ika Sundari, Fanser Syahtriawan, Nanang Tanjung, Taufan, Taufiqqurohman, M Yahya Yogo Utomo, Ariani Widiastuti, Rini Widiastuti, Wiwit Widiyani, Arief Setio Widodo, Ika Widyaningsih, Dewi Widyastuti, Tyani Aji Windu, Retno Suci Wulandari, Tri Widadi Wulandari, Rohmad Yasin Y, Rangga Sukma Yana, Hanifan Yudhistira, Yuliawati, Zezen Zaenudin and Muhammad Zulfan. Caroline Tupamahu (Project Team Leader, BaKTI); Setiawan Cahyo Nugroho (Technical Coordinator, KIAT Guru, TNP2K); and Tri Yuni Rinawati (Operations Coordinator, KIAT Guru, TNP2K) coordinated inputs and supported the survey implementation on behalf of TNP2K and BaKTI.
Members of the extended team included Gregorius Kelik Endarso (Operations Analyst, World Bank); Yulia Herawati (Social Development Specialist, World Bank); Lily Hoo (Former Senior Social Development Specialist, World Bank); Audrey Sacks (Senior Social Development Specialist, World Bank); and the Indonesia Education cluster team, under the leaderships of Tazeen Fasih (Lead Economist) and Noah Bunce Yarrow (Senior Social Education Specialist). Megha Kapoor (Knowledge Management officer, World Bank); Chatarina Ayu Widiarti (Program Analyst, World Bank); and Fazlania Zain (Communication and Operations Consultant, World Bank) provided overall support to the team. Audrey Sacks and Andrew B. Ragatz (Senior Education Specialist, World Bank) reviewed the final draft and provided constructive feedbacks for the final version. Publishing process by Dinda Putri Hapsari (Knowledge Management Consultant, World Bank), and Design and Layout by Yohanes Cahyanto Aji.

x .
The World Bank is thankful to the Indonesian Ministry of Education and Culture (MoEC) and the National Team for Acceleration of Poverty Reduction under the office of the Vice President of Indonesia (TNP2K) for their advice and support which was critical to the success of this initiative. The Bank is especially thankful to Bapak Bambang Widianto (Executive Secretary, TNP2K); Bapak Sumarna Surapranata (Former Director General for Teachers and Education Personnel, MoEC); Bapak Supriano (Director General for Teachers and Education Personnel, MoEC); Bapak E. Nurzaman (Secretary of the Directorate General for Teachers and Education Personnel 2015-2018, MoEC); Ibu Dian Wahyuni (Head of Legal and Organization Bureau, MoEC); Bapak Praptono (Director for Development of Basic Education Teachers, MoEC); Bapak Temu Ismail (Section Head of Legal, Governance and Employment, MoEC); and Ibu Budi Kusumawati (Sub-Section Head of Legal, Governance and Employment, MoEC) for their insightful guidance and support.
The Government of Australia’s Department of Foreign Affairs and Trade generously financed this study and provided guidance and continuous support to the Team. In addition, the Task Team is grateful for the guidance extended by the Country Management Unit including Rodrigo Chaves (Country Director); Rolande Simone Pryce (Operations Manager); and Camilla Holmemo (Program Leader). Kevin Tomlinson (Former Social Development Program Manager), and Nina Bhatt (Social Development Practice Manager) provided oversight of the Task Team.
x i .
Abbreviations
ACDP Analytical and Capacity Development Partnership
ASER Annual Status of Education Report
KIAT Guru Kinerja dan Akuntabilitas Guru (Teacher Performance and Accountability)
MoEC Ministry of Education and Culture
NTT Nusa Tenggara Timur (East Nusa Tenggara)
OECD Organization for Economic Co-operation and Development
OLS Ordinary Least Squares
PISA Programme for International Student Assessment
PLN Perusahaan Listrik Negara (Indonesian State-Owned Electricity Company)
PNS Pegawai Negeri Sipil (Civil Servants)
IDR Indonesian Rupiah
SLA Student Learning Assessment
TAS Teacher Absence Survey
TIMSS Trends in International Mathematics and Science Study
UNICEF United Nations Children’s Emergency Fund

x i i .

x i i i .
Competitiveness in an increasingly globalized world requires a highly skilled and educated workforce. The Government of Indonesia recognizes that a highly educated and skilled workforce is critical to reducing inequality and poverty. To ensure schools are given adequate attention, the 2003 Law 20 on National Education System mandates that 20 percent of national and district government budgets is for education. This target was achieved in 2009 and has continued thereafter.
Indonesia has made considerable progress in achieving universal enrollment at the primary and secondary school levels. The Government’s attention to education through its policies as well as the two decades favorable economic growth has enabled gross enrollment at the primary school levels at about 100 percent, with gross enrollment at the secondary school levels increasing from 55 to more than 86 percent.1
Paradoxically, despite success in education enrollment, Indonesian students have low learning outcomes, particularly in rural and remote areas of the country. Findings show that years of education and enrollment figures do not correlate with the quality of education provided. In other words, “schooling ain’t learning” (Pritchett 2013; World Bank 2018a). In all international assessments (such as the PISA, TIMSS, and PIRLS), Indonesian students rank bottom among all countries assessed (Hanushek and Woessmann 2007; OECD 2017; World Bank 2017). Over the past 20 years, Indonesian student learning outcomes have tended to remain flat (OECD 2017; Beatty et al. 2018). In addition, studies show that primary and secondary schools located in rural and remote areas have substantially lower learning outcomes compared with their urban counterparts (Stern and Nordstrum 2014; BPS 2017; Beatty et al. 2018).
Gaps remain between rural and urban education outcomes which have both supply and demand side dimensions. From a supply-side perspective, teacher absenteeism is a key challenge in remote parts of the country. A first teacher absenteeism survey in Indonesia found a national average of 15 percent teachers being absent from school, with those working in remote areas having a 24 percent absenteeism rate (Chaudhury, et al. 2006). A more recent survey found that while teacher absenteeism in general has reduced over time, rural teacher absence rates remain high at 20 percent, compared to urban teacher absenteeism at six percent (ACDP 2016). Likewise, teacher absenteeism rate in more remote locations like Papua and West Papua was even higher, with a rate of 37 percent (UNICEF 2012). In addition, two-thirds of schools in remote areas do not have teachers yet two-thirds of urban schools have too many (World Bank 2013b). Because rural poverty rates remain high, this fact constrains rural families from enrolling their children in school (BPS 2016; World Bank 2016). Parental views on education also shape enrollment. Early schooling does not yield immediate
Executive Summary
1 Gross enrollment is a percentage of the population who were at school regardless of age, compared to the number of school-age population for the particular school level. World Bank World Development Indicator Database, https://data.worldbank.org/indicator/SE.SEC.ENRR?locations=ID
National and district government budgets
for education
Teacher absenteeism survey in Indonesia found
a national average of
Teacher absenteeism in remote areas
Gross enrollment at the secondary school
increasing
more than
to
a c h i e v e d i n 2 0 0 9
( 2 0 0 6 )
( 2 0 0 6 )
20%
15%
24%
55%
86%

x iv .
dividends. It often means there is one or several less persons to help earn rural incomes. Thus, with education not being valued in the same manner, rural enrollment fares worse.
Since the early 2000s, the Government of Indonesia has shifted its education policies towards a focus on quality and equity. Quality improvements have included providing schools with more education resources (through the School Operational Support); improving teacher qualification; enhancing community participation through school committees; and benchmarking student performance using international assessments. In addition, the Government of Indonesia now provides cash transfers to students from impoverished backgrounds to attend schools; and sets a policy of rotating teachers systematically to ensure there is equity of distribution.
Starting in 2016, the World Bank has supported the Government of Indonesia to improve teacher performance and community participation in education through KIAT Guru. The KIAT Guru (Improving Teacher Performance and Accountability) has been piloted in five districts across Indonesia, namely, Ketapang, Landak, and Sintang (in West Kalimantan province) and West Manggarai and East Manggarai (in East Nusa Tenggara province). Prior to piloting the KIAT Guru, a baseline survey, which is summarized in this report, was conducted in 270 remote primary schools between 2016-2017 with multiple local stakeholders including school staff (principals and teachers); school committees; village heads; and parents. The survey instruments were designed to achieve better understanding of the challenges of primary education service delivery in remote areas. This report presents a detailed description of the six main findings of the survey.
2 The exchange rate was approximately IDR 14,000 to US$1 at the date of publication.
Schools and villages face shortages in key areas which hampers good educational outcomes. There are connectivity challenges: some households and schools are on average 149 km or five hours away from district capitals; study areas have only 29 percent connection to the electricity; limited internet access (17 percent); and long distances to financial institutions, which affects salary retrieval for teachers (52 km or 2.3 hours on average). Infrastructure barriers can adversely affect placements of younger and highly motivated teachers in rural and remote areas. In addition, transaction costs associated with remoteness also reduce how government prioritizes funding for schools. The available resources within pilot schools may suggest adequacy: 91 percent have toilets which are reasonably gender balanced (50 percent are for females); 54 percent of schools have a library; and 39 percent have sufficient textbooks. Observations indicate that gaps in these areas can be met by attention to how funds are allocated rather than simply a focus on allocation amount.
which is summarized in this report, was conducted in
KIAT Guru baseline survey
during 2016 - 2017
r e m o t e p r i m a r y s c h o o l s
270
Connectivity challenge
o r f i v e h o u r s a w a y f r o m d i s t r i c t c a p i t a l s
h a v e c o n n e c t i o n t o t h e e l e c t r i c i t y
l i m i t e d i n t e r n e t a c c e s
149km
29%
17%
Manggarai Barat
Manggarai Timur
Ketapang
Landak Sintang
1.

2 The exchange rate was approximately IDR 14,000 to US$1 at the date of publication.
xv .
The specificities of school characteristics in terms of class sizes, teacher composition, and school management is not matched with the needs at hand. While class ratios compare well with national averages (20 students per class in remote areas compared with 23 at the national level); the uniqueness of remote area teachers is that they often substitute for absent teachers; and must teach multiple grades (in 25 percent of the schools) despite lacking the training to do so. Survey results show that permanent teachers who are part of the civil service stands at 40 percent, with remaining teaching gaps met by short term contract teachers who constitute the majority of the teaching force (42.5 percent contracted by schools and 15.8 percent contracted by districts or provinces). Compared to permanent teachers, contract teachers have lower qualifications, much lower salary, and therefore more likely to have second jobs. Not having tertiary education degrees was fairly widespread: 34 percent of teachers and 18 percent of principals only have high school degrees. Likewise, although Indonesian should be the main language of instruction in primary schools, the study reveals that this is often not the case. For instance, in East Nusa Tenggara, nearly a third of schools utilize another language for teaching. While this may improve learning comprehensions, it imposes a challenge when students take national exams in Indonesian.
Teacher incomes fluctuate substantially within schools, which may affect motivation. Differential teacher income stems from whether they are civil servants and have certification status. While certified civil servants have median monthly income levels of IDR 8.4 million (US$600), noncertified civil servants earn roughly IDR 4.6 million (US$329) monthly. The lowest income earners are non-civil servants, with a median monthly income of IDR 0.55 million (US$40).2
Teacher absence from school and teaching is a serious issue. Unannounced visits to sample schools indicated that 25 percent of classrooms did not have a teacher, and 17 percent of teachers did not come to school on a given day. Our analysis indicate that teacher absence is associated with being a male, with civil servant status, and experiencing less supervision by the school principal. In other words, female and contracted teachers were teaching more often. Our analysis also shows, however, that evaluated teachers tend to have better presence in school. Hence, ensuring that teachers are monitored and supervised could reduce teacher tardiness.
Student learning outcomes were low. Most students tested were performing two grade levels below their current grade and had not mastered basic standards of their former grade level. For example, a grade four student demonstrated the competency of a grade two student. Our analysis associates low student learning outcomes with low parental education; less time dedicated to their child’s schooling; and far less engagement with school committees and teachers.
Teacher composition
Teacher absence
t e a c h e r s w h o a r e p a r t o f t h e c i v i l s e r v i c e
c l a s s r o o m s d i d n o t h a v e a t e a c h e r
t e a c h e r s d i d n o t c o m e t o s c h o o l o n
a g i v e n d a y
c o n t r a c t e d b y s c h o o l s
c o n t r a c t e d b y d i s t r i c t s o r p r o v i n c e s
40%
25%
17%
42.5%
15.8%
unannounced visits to sample schools indicated that
2.
4.
5.
3.
t h e p a r e n t s a n d s c h o o l c o m m i t t e e s r e p o r t e d t h a t t h e y
w e r e s a t i s f i e d w i t h t h e q u a l i t y
o f e d u c a t i o n a n d l e a r n i n g o u t c o m e s
xv i .
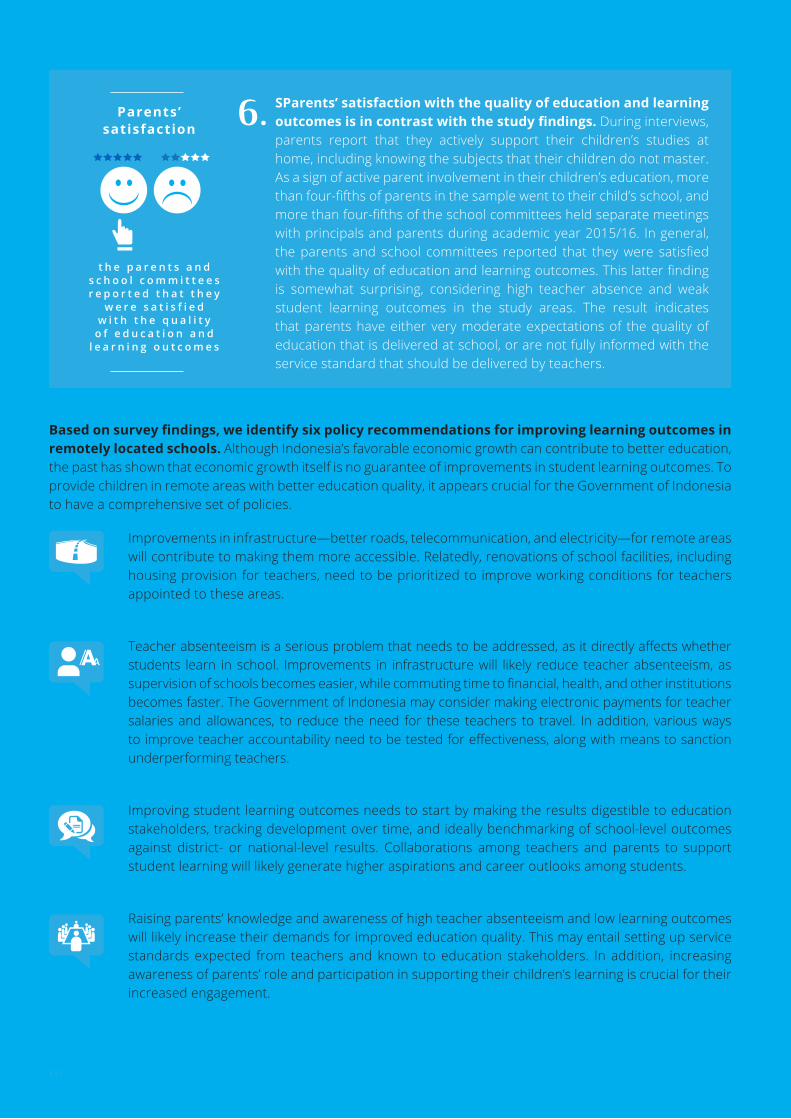
SParents’ satisfaction with the quality of education and learning outcomes is in contrast with the study findings. During interviews, parents report that they actively support their children’s studies at home, including knowing the subjects that their children do not master. As a sign of active parent involvement in their children’s education, more than four-fifths of parents in the sample went to their child’s school, and more than four-fifths of the school committees held separate meetings with principals and parents during academic year 2015/16. In general, the parents and school committees reported that they were satisfied with the quality of education and learning outcomes. This latter finding is somewhat surprising, considering high teacher absence and weak student learning outcomes in the study areas. The result indicates that parents have either very moderate expectations of the quality of education that is delivered at school, or are not fully informed with the service standard that should be delivered by teachers.
Based on survey findings, we identify six policy recommendations for improving learning outcomes in remotely located schools. Although Indonesia’s favorable economic growth can contribute to better education, the past has shown that economic growth itself is no guarantee of improvements in student learning outcomes. To provide children in remote areas with better education quality, it appears crucial for the Government of Indonesia to have a comprehensive set of policies.
Improvements in infrastructure—better roads, telecommunication, and electricity—for remote areas will contribute to making them more accessible. Relatedly, renovations of school facilities, including housing provision for teachers, need to be prioritized to improve working conditions for teachers appointed to these areas.
Teacher absenteeism is a serious problem that needs to be addressed, as it directly affects whether students learn in school. Improvements in infrastructure will likely reduce teacher absenteeism, as supervision of schools becomes easier, while commuting time to financial, health, and other institutions becomes faster. The Government of Indonesia may consider making electronic payments for teacher salaries and allowances, to reduce the need for these teachers to travel. In addition, various ways to improve teacher accountability need to be tested for effectiveness, along with means to sanction underperforming teachers.
Improving student learning outcomes needs to start by making the results digestible to education stakeholders, tracking development over time, and ideally benchmarking of school-level outcomes against district- or national-level results. Collaborations among teachers and parents to support student learning will likely generate higher aspirations and career outlooks among students.
Raising parents’ knowledge and awareness of high teacher absenteeism and low learning outcomes will likely increase their demands for improved education quality. This may entail setting up service standards expected from teachers and known to education stakeholders. In addition, increasing awareness of parents’ role and participation in supporting their children’s learning is crucial for their increased engagement.
Parents’ satisfaction 6.
xv i i .
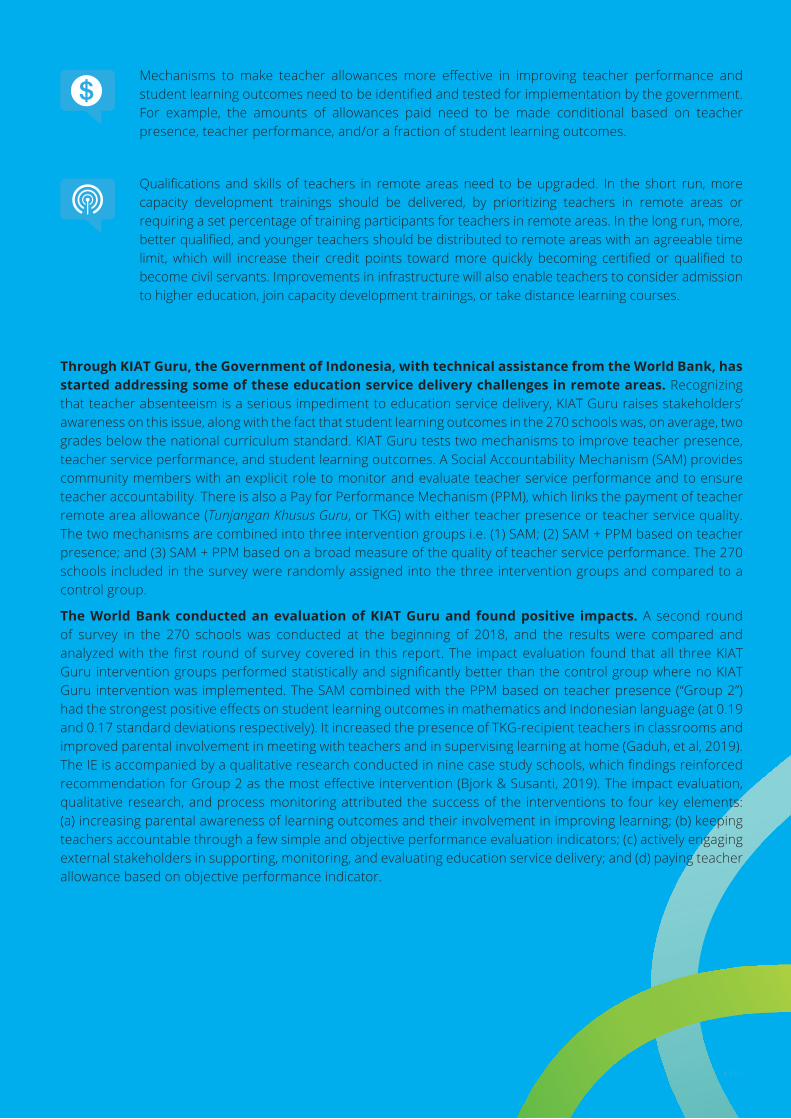
Mechanisms to make teacher allowances more effective in improving teacher performance and student learning outcomes need to be identified and tested for implementation by the government. For example, the amounts of allowances paid need to be made conditional based on teacher presence, teacher performance, and/or a fraction of student learning outcomes.
Qualifications and skills of teachers in remote areas need to be upgraded. In the short run, more capacity development trainings should be delivered, by prioritizing teachers in remote areas or requiring a set percentage of training participants for teachers in remote areas. In the long run, more, better qualified, and younger teachers should be distributed to remote areas with an agreeable time limit, which will increase their credit points toward more quickly becoming certified or qualified to become civil servants. Improvements in infrastructure will also enable teachers to consider admission to higher education, join capacity development trainings, or take distance learning courses.
Through KIAT Guru, the Government of Indonesia, with technical assistance from the World Bank, has started addressing some of these education service delivery challenges in remote areas. Recognizing that teacher absenteeism is a serious impediment to education service delivery, KIAT Guru raises stakeholders’ awareness on this issue, along with the fact that student learning outcomes in the 270 schools was, on average, two grades below the national curriculum standard. KIAT Guru tests two mechanisms to improve teacher presence, teacher service performance, and student learning outcomes. A Social Accountability Mechanism (SAM) provides community members with an explicit role to monitor and evaluate teacher service performance and to ensure teacher accountability. There is also a Pay for Performance Mechanism (PPM), which links the payment of teacher remote area allowance (Tunjangan Khusus Guru, or TKG) with either teacher presence or teacher service quality. The two mechanisms are combined into three intervention groups i.e. (1) SAM; (2) SAM + PPM based on teacher presence; and (3) SAM + PPM based on a broad measure of the quality of teacher service performance. The 270 schools included in the survey were randomly assigned into the three intervention groups and compared to a control group.
The World Bank conducted an evaluation of KIAT Guru and found positive impacts. A second round of survey in the 270 schools was conducted at the beginning of 2018, and the results were compared and analyzed with the first round of survey covered in this report. The impact evaluation found that all three KIAT Guru intervention groups performed statistically and significantly better than the control group where no KIAT Guru intervention was implemented. The SAM combined with the PPM based on teacher presence (“Group 2”) had the strongest positive effects on student learning outcomes in mathematics and Indonesian language (at 0.19 and 0.17 standard deviations respectively). It increased the presence of TKG-recipient teachers in classrooms and improved parental involvement in meeting with teachers and in supervising learning at home (Gaduh, et al, 2019). The IE is accompanied by a qualitative research conducted in nine case study schools, which findings reinforced recommendation for Group 2 as the most effective intervention (Bjork & Susanti, 2019). The impact evaluation, qualitative research, and process monitoring attributed the success of the interventions to four key elements: (a) increasing parental awareness of learning outcomes and their involvement in improving learning; (b) keeping teachers accountable through a few simple and objective performance evaluation indicators; (c) actively engaging external stakeholders in supporting, monitoring, and evaluating education service delivery; and (d) paying teacher allowance based on objective performance indicator.
xviii.
Introduction
INTRODUCTION
01
1.
The Government of Indonesia recognizes the importance of education in improving productivities and reducing poverty and inequality. With the government’s budget for education tripling in real terms since 2001, Indonesia has made considerable progress in achieving universal enrollment at the primary and junior secondary school levels. Law 20 on National Education System, which was passed in 2003, mandated 20 percent of national and district government budgets for education, and this has been met since 2009. In 2017, the gross enrollment rate of Indonesian children ages 13 to 15 exceeded 95 percent.3
Education policies in Indonesia have shifted focus toward quality and equity. Quality improvements have included providing schools with more control of education resources (through the School Operational Support)4, improving capacities and qualifications of teachers, enhancing community participation through school committees, and benchmarking student performance through participation in international assessments. The Government of Indonesia has also provided students from poor backgrounds with cash transfers and attempted to improve equity by redistributing teachers.
A Major education policy reform has focused on improving teacher welfare, although teacher performance has remained stagnant. In 2005, Law 14 on Teachers and Lecturers increased the minimum teacher academic qualification to a bachelor’s degree, requiring all teachers to complete their certification process successfully by 2015.5 For teachers who complete the certification process6, the law introduced a certification allowance, in the amount up to 100 percent of their base salary.7 Those working in remote areas receive a remote area allowance, also up to 100 percent of their base salary. Half of the national education budget has been allocated for payment of close to three million teachers’ salaries and allowances, which in 2018 amounted to US$16.1 billion. However, recipients of the remote area allowance had a higher teacher absenteeism rate
3 Badan Pusat Statistik 2018.4 Bantuan Operasional Sekolah (BOS) is a school-managed operational fund allocated by the Ministry of Education and Culture based on the number of registered students in the school. In 2018, BOS amounted to Rp 800,000 (US$57) per student per year.5 http://peraturan.go.id/uu/nomor-14-tahun-2005.html. 6 The teacher certification process requires that teachers hold an undergraduate degree, submit a portfolio of their teaching experiences, and pass a competence test. Teachers are currently certified for life, with no recertification process in place.7 Tunjangan Khusus Guru (teacher special allowance) is allocated for teachers assigned to special areas, including remote areas. For ease of reference, we use the term remote area allowance in this report.

2.
compared with nonrecipients in the same schools. Likewise, the performance of students of certified teachers did not differ from students of those who were not certified.8
Indonesian students achieve relatively low levels of learning. In all international assessments in which the country has participated, the learning outcomes of Indonesian students rank at the bottom among participating countries.9,10 Furthermore, only little progress has been achieved in student learning outcomes over the past 20 years (OECD 2016; Beatty et al. 2018). The latest reading assessment of the Programme for International Student Assessment (PISA) shows that fewer than one in two Indonesian students demonstrates the basic reading skills needed to participate effectively and productively in life.11 In the 2015 Trends in International Mathematics and Science Study (TIMSS), Indonesian fourth grade students’ math scores ranked 53 among 57 participating countries.12 Using the assumptions of improvement rates on PISA tests from 2003 and 2015, the World Development Report 2018 calculated that it would take Indonesia 48 years to achieve the current Organisation for Economic Co-operation and Development average score in mathematics and 73 years in reading, if education practices do not change (Beatty 2018; World Bank 2018a). Clearly, “schooling ain’t learning”13 and years of education and enrollment figures do not necessarily tell much about the quality of education provided. Given the importance of education quality for individual earnings and well-being and bearing in mind the role of education quality for economic growth, 14 governments around the world need to focus on achieving better student learning. Furthermore, it is noteworthy that learning results vary substantially across the country, with rural and remote areas lagging significantly behind urban areas.15
Education equity in poor rural and remote areas remains a challenge (World Bank 2013b). Rural areas have consistently higher rates of poverty (14.1 percent) compared with urban areas (8.2 percent), poorer connectivity, and lower quality of basic services
(BPS 2019). As a result, over one-third of the increase in inequality from 2002 to 2012 can be explained by where one is born and who one’s parents are (World Bank 2016). Disparity among rural and urban locations persists in education service delivery and outcomes. Two-thirds of schools in remote areas are lacking teachers, while two-thirds of urban schools have too many teachers (World Bank 2013b). Around 50 percent of the population age 15 and above in rural areas has not completed or just completed elementary education, compared with 35 percent in urban areas (BPS 2018).
Teacher absence is a significant constraint in remote areas. In 2003, the first assessment of teacher absence conducted in Indonesia found a nationwide absence rate of approximately 19 percent among teachers in public primary schools.16 Although this rate was reduced to 10 percent in 2014, in remote areas, still one in five teachers was absent from school.17 Furthermore, teacher absence in Indonesia is associated with higher student absences18; higher dropout rates, particularly in remote areas19; as well as lower student test scores.20
The Government of Indonesia has issued policies and resources to specifically focus on improving education service delivery in rural and remote areas. The 2005 Law 14, the Minister of Education Regulation 32 from 2007, and Government Regulation 74 from 2008 defined special areas (daerah khusus), which include remote, frontier, and disaster- and conflict- prone areas. Teachers placed in these areas are entitled to several additional compensations and benefits, ranging from housing entitlement, automatic promotion, special promotion, job security and protection, scholarships, and priority for improving academic qualifications, certifications and competencies. Most importantly, teachers have become eligible for allowances that double or triple their base salary, if they meet certain requirements. For example, a teacher who becomes certified is eligible to receive a Tunjangan Profesi (certification allowance), which doubles his/ her base salary. Similarly, those
8 Toyamah et al. 2010; De Ree et al. 2018.9 The participating countries comprise the 34 Organisation for Economic Co-operation and Development (OECD) member countries, as well as several partner countries in Latin America, Eastern Europe, Asia, and the Middle East and North Africa.10 OECD 2016; World Bank 2018a.11 OECD 2016.12 Mullis et al. 2016.13 Pritchett 2013; World Bank 2018a.14 Hanushek and Woessmann 2007.15 ACDP 2014; Stern and Nordstrum 2014.
16 Usman, Akhmadi, and Suryadarma 2004; World Bank 2004; Chaudhury et al. 2006.17 ACDP 2014.18 Toyamah et al. 2010.19 UNICEF 2012.20 Usman, Akhmadi, and Suryadarma 2004; Suryadarma et al. 2006.

INTRODUCTION
3.
who works in special areas are eligible to receive a Tunjangan Khusus, which range from IDR 1.5 million to double the teacher’s base salary. So if a certified civil servant teacher works in remote area, he or she could be entitled to a total income of up to three times his/ her base salary. While significantly increasing teachers’ income might seem like a significant incentive for teachers to improve their performance, a World Bank study on the impact of certified teachers on student learning outcomes does not find that this is the case (De Ree et al., 2018). Similar outcome was identified for Tunjangan Khusus, where recipients had highest rate of absenteeism in comparison to non-recipients (Toyamah et al., 2010).
As a follow up policy intervention, the Government of Indonesia with technical assistance from the World Bank has been implementing KIAT Guru since 2016. KIAT Guru aims to improve teacher presence, teacher service performance, and student learning outcomes in remote primary schools. Prior to implementation of several interventions, the World Bank conducted a survey in the study areas, to achieve better understanding of the challenges of primary education service delivery in remote areas. The study areas consist of five districts across Indonesia, namely, Ketapang, Landak, and Sintang (in West Kalimantan province) and West Manggarai and East Manggarai (in East Nusa Tenggara (NTT) province). This report presents a detailed description of the survey findings, conducted in a total of 270 primary schools located in 235 very remote villages. Although the sampling, instruments, and research questions were generated to match the specific demands for KIAT Guru, the findings are general enough to inform the conditions of education in the study areas.
4.

Map 1. Participating Districts and Number of Schools in Each District
02 Scope of the Study: Locations, Instruments, and Sample
SCOPE of STUDY
Manggarai Barat
Manggarai Timur
Ketapang
Landak Sintang
59
51 88
38 34
5.
The report is organized as follows. Section 2 describes the baseline survey administered in the study villages. Section 3 presents the schooling context. Section 4 discusses parental and community involvement in education. Section 5 analyzes teacher absence in the sample primary schools. Section 6 analyzes student learning outcomes. Section 7 concludes.
Selection of Study Areas
The study districts represent five of 122 disadvantaged districts in Indonesia. The selection of districts was based on the list of disadvantaged districts established by the Ministry of Villages, Disadvantaged Areas, and Transmigration in 2015. The list was narrowed through parameters set by the KIAT Guru project. Districts with very remote locations, conflict-prone, very low demand for education, very weak governance, and very high operational costs were excluded. Shortlisted districts had at least 40 primary schools in remote areas that fulfill the definition of eligible schools described below. Upon consultations with the Government of Indonesia at the national level, the list was further narrowed and visited to identify those having anecdotal problems of teacher absenteeism, whose district governments showed willingness to reform. The final list (map 1) includes three districts in West Kalimantan (Ketapang, Sintang, and Landak) and two districts in NTT (West Manggarai and East Manggarai). Schools eligible for selection in the study had a minimum

6.
of 70 students, located at least a one-hour drive from the district capital, and with at least three teachers who received the remote area allowance. Table 1 presents characteristics of the five study districts: poverty, remoteness, administrative units, population, and schools, with summary findings described below.
Compared with other districts in Indonesia, the five study districts have higher poverty rates. All five districts have higher poverty rates compared with the provincial and national rates, except Sintang, which has a lower poverty rate compared with the national average (11 percent in 2016). West Kalimantan districts are more prosperous than NTT districts and have a lower poverty rate than the national average. However, the three West Kalimantan districts are poorer than other districts in that province. NTT has an average poverty rate of 22 percent, compared with the national poverty rate of 11 percent, with West Manggarai sitting below the provincial average and East Manggarai above it, with nearly 28 percent of its population living below the official poverty line.
West Kalimantan NTTNational AverageKetapang Landak Sintang Province
AverageWest
ManggaraiEast
ManggaraiProvince Average
Poverty rate (%) 10.99 12.32 10.07 7.87 19.35 27.71 22.19 10.86
Very remote villages based on IDM (#)
136 79 287 72 55 59 21 26
Very remote villages based on IDM (%)
51.91 51.30 82.23 48.31 32.54 33.52 13.96 16.28
Subdistricts 21 13 14 12 10 9 14 14
Villages 262 154 349 148 169 176 151 161
Average # villages per subdistrict
12 12 25 12 17 20 11 12
Total population (# individuals)
482,831 361,469 400,789 338,349 256,105 275,622 227,083 504,680
Average village population (# individuals)
1,843 2,347 1,148 2,284 1,515 1,566 1,503 3,139
Primary schools 526 457 429 305 259 329 368 289
Average # primary school per village
2 3 1 2 2 2 2 2
Table 1. Characteristics of the Study Districts Compared with Provincial and National Averages
Sources:• Subdistricts and villages (2017): Central Bureua of Statistics https://www.bps.go.id/website/fileMenu/Perka-BPS-No55-Tahun-2017.
pdf.• Individuals and households: SUSENAS March 2016 (own calculation).• School data: MoEC http://dapo.dikdasmen.kemdikbud.go.id/sp.• Poverty rate (2016): Central Bureau of Statistcs https://www.bps.go.id/website/pdf_publikasi/Data-dan-Informasi-Kemiskinan-
Kabupaten-Kota-2016--.pdf.• Villages with IDM status (2015): MoV http://kedesa.id/id_ID/repository/indeks-desa-membangun-indonesia/.• National Socio-Economic Survey.Note: IDM = Individual Deprivation Measure; MoEC = Ministry of Education and Culture; NTT = East Nusa Tenggara; SUSENAS
The five districts have different provincial characteristics in terms of administrative units, but they all have more primary schools and more remote schools compared with the national average. Table 1 presents the average number of villages classified as very remote according to the Village Development Index 2015.21 In the West Kalimantan districts, at least 50 percent of the villages, and up to 82 percent of the villages in Sintang district, are classified as very remote. In West Manggarai and East Manggarai, approximately one-third of the villages are classified as very remote, which is significantly higher than in NTT (with only 14 percent of villages classified as very remote).
The average village population in the five districts is relatively small compared with the national level but relatively large compared with the provincial level. All five study districts have smaller populations than the average district nationally, but larger than the average district in their respective provinces. The three West Kalimantan districts, which have, on average, a population of about 415,000 individuals, are much larger than the NTT districts, which have 265,000 individuals on average. Yet, the West Kalimantan survey districts are, per village, less populated than villages in the average district in the province.
21 The Village Development Index was developed by the Ministry of Villages, Disadvantaged Areas and Transmigration (2015).

SCOPE OF STUDY
7.
Survey Instruments
The survey comprises instruments to measure teacher absence and student learning outcomes, along with five questionnaires. The teacher absence survey is based on Analytical and Capacity Development Partnership’s instrument, which was used for its 2014 survey, based on an instrument developed by the World Bank for World Development Report 2004.22,23 Teacher presence is directly observed by enumerators during an unannounced school visit. It collects information on teacher location (in or out of school, and in or out of class), teacher activity (teaching-related or non-teaching-related) during school hours, and student absences from school. It generates data to assess the rate of teacher absence from school, classroom, and teaching.
The Student Learning Assessment (SLA) captures student competencies in literacy and numeracy, according to the standards set in the 2006 national curriculum. The SLA instrument is a grade-specific test, which was developed based on frameworks and findings from international and national assessment tools. The assessment aims to capture basic to higher-order skills in reading and writing (in this case, Indonesian) and performing mathematical operations.24 Tests were developed to contain a larger distribution of lower grade–level questions, to capture a more normal distribution of student learning outcomes. The SLA was administered to all the students in grades one to five in the sample schools.25 of the 28,790 students registered in grades one to five, 26,612 students—present on the day enumerators administered the tests—undertook the SLA Indonesian and math tests (table 2). Students
Grade Gender All AreasWest Kalimantan NTT
Ketapang Landak Sintang West Manggarai East Manggarai
Number of students registered in school
1 Male 3,192 633 511 1,080 485 483
Female 2,685 517 462 888 404 414
2 Male 2,924 564 484 925 452 499
Female 2,458 488 408 776 372 414
3 Male 3,068 615 465 1,024 492 472
Female 2,616 481 397 864 475 399
4 Male 3,080 552 557 938 541 492
Female 2,815 522 449 957 492 395
5 Male 3,126 552 520 1,015 533 506
Female 2,826 525 429 996 450 426
Number of students present in school on the day of the test
1 Male 2,802 537 436 949 431 449
Female 2,375 441 391 799 359 385
2 Male 2,641 491 434 838 402 476
Female 2,280 448 370 720 344 398
3 Male 2,838 551 410 973 459 445
Female 2,489 448 367 831 456 387
4 Male 2,884 492 513 897 516 466
Female 2,662 476 420 905 477 384
5 Male 2,918 495 479 964 507 473
Female 2,723 500 408 964 433 418
Table 2. Student Learning Assessment: Sample Description
22 Chaudhury et al. 2006.23 Usman, Akhmadi, and Suryadarma 2004; Toyamah et al. 2010; UNICEF 2012; ACDP 2014.24 ASER 2014; Gove and Wetterberg 2011; Mullis et al. 2016; Platas et al. 2014; Uwezo 2012.25 To avoid teachers preparing students for the test, it was announced to teachers and students one day before administration. All participating students started with the Indonesian test with a time limit of 25 minutes for grades one and two, and 45 minutes
for grades three through five. without a break, unless requested by students, the math test then followed, with a time limit of 15 minutes for grades one and two and 50 minutes for grades three through five. The differing time limits between the lower and upper grades were determined based on test item types. The items for the lower grades were largely on recognition (for example, letter and number recognition), which required less time to work on than the more complex items for the upper grades (for example, reading comprehension and performing math operations).
8.
in grades one and two took the test individually, that is, one person at a time, and were allowed 25 minutes for the Indonesian test and 15 minutes for the math test. Students in grades three to five were allowed 45 minutes for the Indonesian test and 50 minutes for the math test and took the tests in groups.26
The SLA was a multiple-choice test, with three to four possible answers for each question.27 There were 23 and 30 questions in the Indonesian and math tests, respectively, for each grade-level test. Except for the tests for grade one, all the grade-level tests were developed with a large distribution of lower grade–level questions, given that they were administered during the middle of the first semester of the academic
year. Students had not yet been taught—even less so mastered—a significant part of the material for their current grade level. Therefore, 80 percent of the questions for the Indonesian and math tests were based on the curriculum standards for one and two grade levels below the respective grades at which the tests were administered. The remaining items (20 percent of the questions) were based on the curriculum standards of the current grade level.
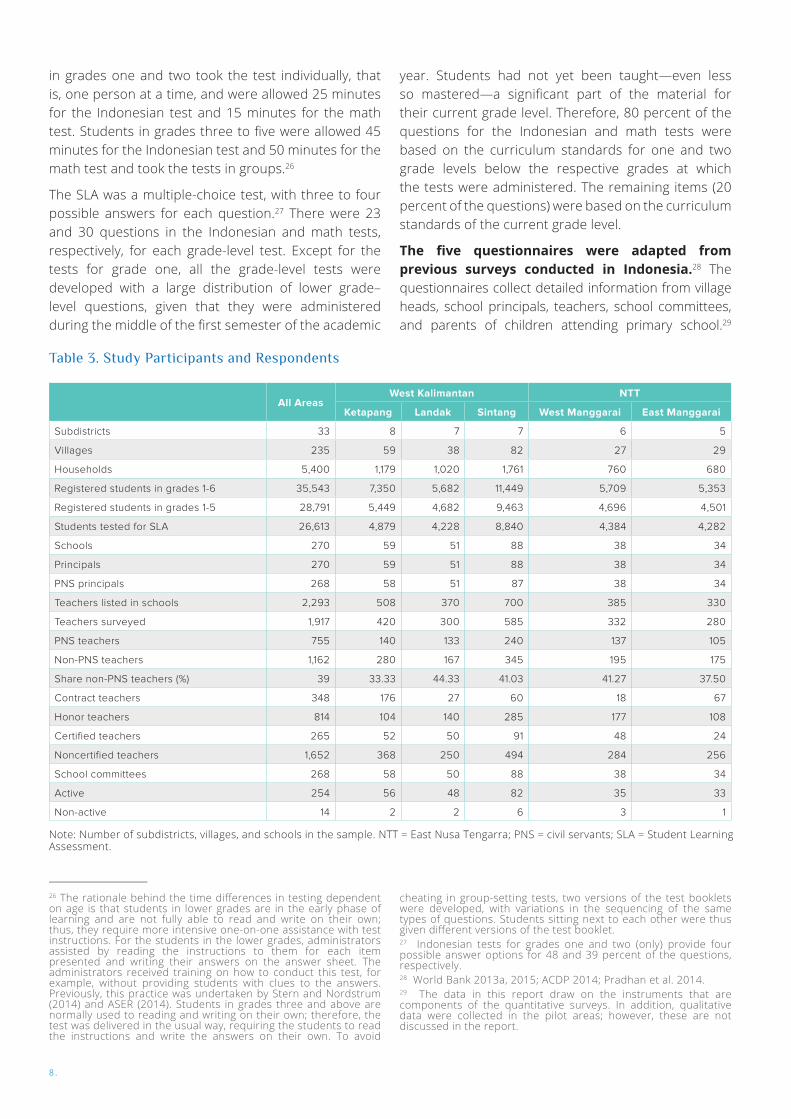
The five questionnaires were adapted from previous surveys conducted in Indonesia.28 The questionnaires collect detailed information from village heads, school principals, teachers, school committees, and parents of children attending primary school.29
Table 3. Study Participants and Respondents
All AreasWest Kalimantan NTT
Ketapang Landak Sintang West Manggarai East Manggarai
Subdistricts 33 8 7 7 6 5
Villages 235 59 38 82 27 29
Households 5,400 1,179 1,020 1,761 760 680
Registered students in grades 1-6 35,543 7,350 5,682 11,449 5,709 5,353
Registered students in grades 1-5 28,791 5,449 4,682 9,463 4,696 4,501
Students tested for SLA 26,613 4,879 4,228 8,840 4,384 4,282
Schools 270 59 51 88 38 34
Principals 270 59 51 88 38 34
PNS principals 268 58 51 87 38 34
Teachers listed in schools 2,293 508 370 700 385 330
Teachers surveyed 1,917 420 300 585 332 280
PNS teachers 755 140 133 240 137 105
Non-PNS teachers 1,162 280 167 345 195 175
Share non-PNS teachers (%) 39 33.33 44.33 41.03 41.27 37.50
Contract teachers 348 176 27 60 18 67
Honor teachers 814 104 140 285 177 108
Certified teachers 265 52 50 91 48 24
Noncertified teachers 1,652 368 250 494 284 256
School committees 268 58 50 88 38 34
Active 254 56 48 82 35 33
Non-active 14 2 2 6 3 1
Note: Number of subdistricts, villages, and schools in the sample. NTT = East Nusa Tengarra; PNS = civil servants; SLA = Student Learning Assessment.
26 The rationale behind the time differences in testing dependent on age is that students in lower grades are in the early phase of learning and are not fully able to read and write on their own; thus, they require more intensive one-on-one assistance with test instructions. For the students in the lower grades, administrators assisted by reading the instructions to them for each item presented and writing their answers on the answer sheet. The administrators received training on how to conduct this test, for example, without providing students with clues to the answers. Previously, this practice was undertaken by Stern and Nordstrum (2014) and ASER (2014). Students in grades three and above are normally used to reading and writing on their own; therefore, the test was delivered in the usual way, requiring the students to read the instructions and write the answers on their own. To avoid
cheating in group-setting tests, two versions of the test booklets were developed, with variations in the sequencing of the same types of questions. Students sitting next to each other were thus given different versions of the test booklet.27 Indonesian tests for grades one and two (only) provide four possible answer options for 48 and 39 percent of the questions, respectively.28 World Bank 2013a, 2015; ACDP 2014; Pradhan et al. 2014.29 The data in this report draw on the instruments that are components of the quantitative surveys. In addition, qualitative data were collected in the pilot areas; however, these are not discussed in the report.
SCOPE OF STUDY
9.
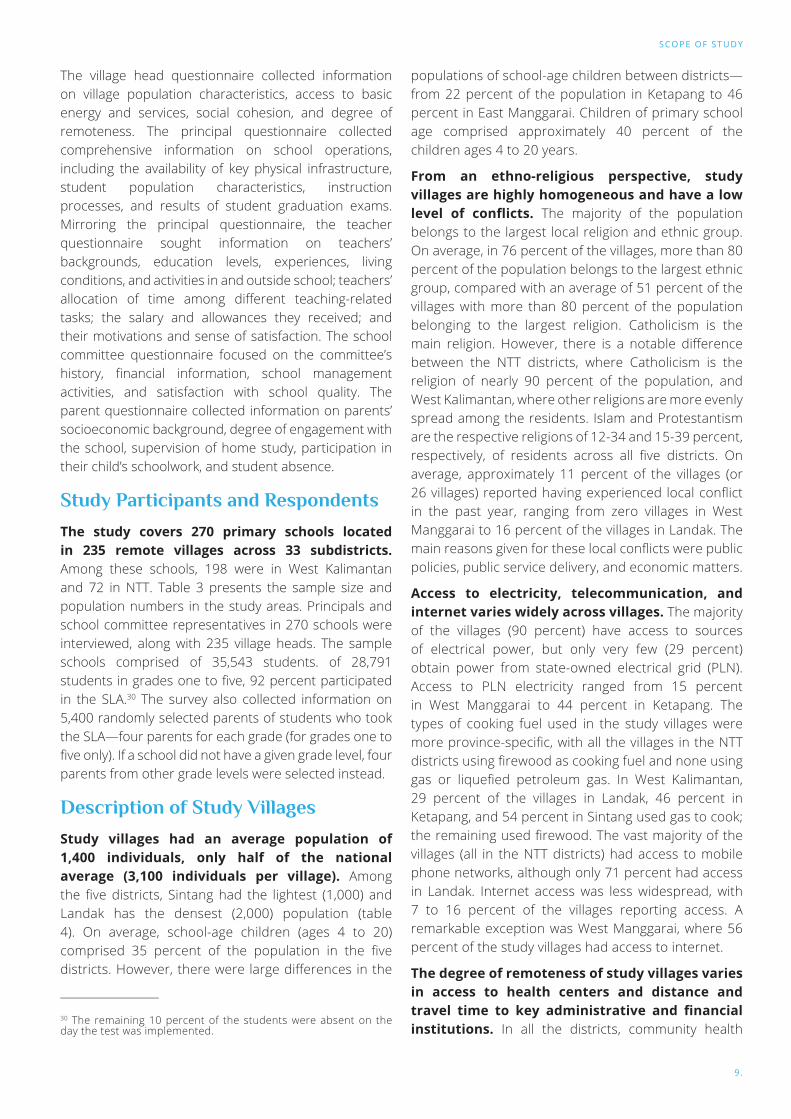
The village head questionnaire collected information on village population characteristics, access to basic energy and services, social cohesion, and degree of remoteness. The principal questionnaire collected comprehensive information on school operations, including the availability of key physical infrastructure, student population characteristics, instruction processes, and results of student graduation exams. Mirroring the principal questionnaire, the teacher questionnaire sought information on teachers’ backgrounds, education levels, experiences, living conditions, and activities in and outside school; teachers’ allocation of time among different teaching-related tasks; the salary and allowances they received; and their motivations and sense of satisfaction. The school committee questionnaire focused on the committee’s history, financial information, school management activities, and satisfaction with school quality. The parent questionnaire collected information on parents’ socioeconomic background, degree of engagement with the school, supervision of home study, participation in their child’s schoolwork, and student absence.
Study Participants and Respondents
The study covers 270 primary schools located in 235 remote villages across 33 subdistricts. Among these schools, 198 were in West Kalimantan and 72 in NTT. Table 3 presents the sample size and population numbers in the study areas. Principals and school committee representatives in 270 schools were interviewed, along with 235 village heads. The sample schools comprised of 35,543 students. of 28,791 students in grades one to five, 92 percent participated in the SLA.30 The survey also collected information on 5,400 randomly selected parents of students who took the SLA—four parents for each grade (for grades one to five only). If a school did not have a given grade level, four parents from other grade levels were selected instead.
Description of Study Villages
Study villages had an average population of 1,400 individuals, only half of the national average (3,100 individuals per village). Among the five districts, Sintang had the lightest (1,000) and Landak has the densest (2,000) population (table 4). On average, school-age children (ages 4 to 20) comprised 35 percent of the population in the five districts. However, there were large differences in the
populations of school-age children between districts—from 22 percent of the population in Ketapang to 46 percent in East Manggarai. Children of primary school age comprised approximately 40 percent of the children ages 4 to 20 years.
From an ethno-religious perspective, study villages are highly homogeneous and have a low level of conflicts. The majority of the population belongs to the largest local religion and ethnic group. On average, in 76 percent of the villages, more than 80 percent of the population belongs to the largest ethnic group, compared with an average of 51 percent of the villages with more than 80 percent of the population belonging to the largest religion. Catholicism is the main religion. However, there is a notable difference between the NTT districts, where Catholicism is the religion of nearly 90 percent of the population, and West Kalimantan, where other religions are more evenly spread among the residents. Islam and Protestantism are the respective religions of 12-34 and 15-39 percent, respectively, of residents across all five districts. On average, approximately 11 percent of the villages (or 26 villages) reported having experienced local conflict in the past year, ranging from zero villages in West Manggarai to 16 percent of the villages in Landak. The main reasons given for these local conflicts were public policies, public service delivery, and economic matters.
Access to electricity, telecommunication, and internet varies widely across villages. The majority of the villages (90 percent) have access to sources of electrical power, but only very few (29 percent) obtain power from state-owned electrical grid (PLN). Access to PLN electricity ranged from 15 percent in West Manggarai to 44 percent in Ketapang. The types of cooking fuel used in the study villages were more province-specific, with all the villages in the NTT districts using firewood as cooking fuel and none using gas or liquefied petroleum gas. In West Kalimantan, 29 percent of the villages in Landak, 46 percent in Ketapang, and 54 percent in Sintang used gas to cook; the remaining used firewood. The vast majority of the villages (all in the NTT districts) had access to mobile phone networks, although only 71 percent had access in Landak. Internet access was less widespread, with 7 to 16 percent of the villages reporting access. A remarkable exception was West Manggarai, where 56 percent of the study villages had access to internet.
The degree of remoteness of study villages varies in access to health centers and distance and travel time to key administrative and financial institutions. In all the districts, community health
30 The remaining 10 percent of the students were absent on the day the test was implemented.

10.
Table 4. Characteristics of Study Villages
All Areas
West Kalimantan NTT
Ketapang Landak Sintang West Manggarai
East Manggarai
Demographic characteristics
Total population 1,396 1,576 2,097 999 1,328 1,328
School age (4-20) individuals 495 352 737 369 493 607
School age (4-20) individuals (% total population) 35.5 22.4 35.2 36.9 37.1 45.7
Pre-primary school age (4-6) 89 62 132 68 95 103
Primary school age (7-12) 193 178 264 153 196 202
Primary school age (7-12) (% total population) 13.9 11.3 12.6 15.3 14.8 15.2
Primary school age (7-12) (% school-age population) 39.1 50.6 35.8 41.6 39.8 33.3
Junior secondary school age (13-15) 108 61 172 78 100 149
Senior secondary school age (16-20) 104 51 169 69 102 153
Households/families 717 828 1,061 517 662 677
Use of basic energy and communication infrastructure (% villages with access)
PLN electricity 29 44 32 26 15 21
Non-PLN electricity 90 92 89 88 100 86
Cooking fuel: gas or LPG 35 46 29 54 0 0
Cooking fuel: firewood 64 54 63 46 100 100
Mobile phone 90 90 71 93 100 100
Internet 17 12 16 13 56 7
Distribution of religions among residents (% village population)
Islam 16.2 34.1 12.9 11.6 10.7 1.8
Christian - Protestant 23.6 15.2 38.8 36.7 1.1 3.5
Catholic 59.4 48.9 48.3 50.5 88.2 94.8
Buddha 0.34 1 0.03 0.88 0 0
Hindu 0.04 0.15 0 0 0 0
Confucius 0.01 0.02 0 0.010 0 0
Others 0.38 1.460 0 0 0 0
Community homogeneity and conflict
Number of religions present in the village 2.46 2.78 2.820 2.77 1.31 1.48
% villages with more than 80% of the population having the largest religion
51 53 11 39 88 100
% villages with more than 50% of the population having the largest religion
88 81 79 88 100 100
% villages with more than 80% of the population of the largest ethnicity
76 63 82 88 70 69
% villages with more than 50% of the population of the largest ethnicity
93 93 100 98 89 76
Occurrence of local conflicts in village during past year 11 14 16 13 0 3
Conflict over public policies/services (% conflicts in past year)
35 38 17 36 0 100
Conflict over economic matters (% conflicts in past year) 23 13 33 27 0 0
Conflict over personal matters (% conflicts in past year) 15 25 33 0 0 0
Note: LPG = liquefied petroleum gas; NTT = East Nusa Tenggara; PLN = state-owned electrical grid.
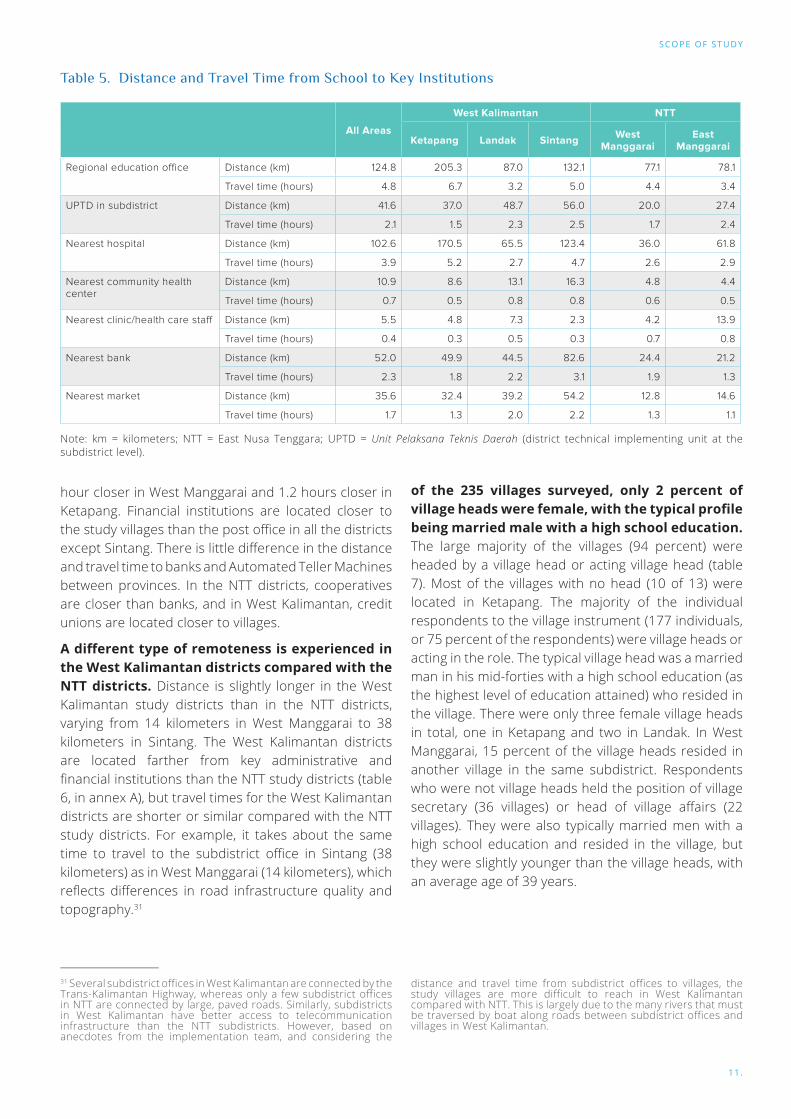
centers and health care staff are located less than one hour from schools (table 5). Hospitals are much farther, on average, approximately 100 kilometers and nearly four hours travel away. On average villages were 149 kilometers and almost five hours away from the district
capital. The institution that is closest to the village hall is the subdistrict office, which is located on average 28 kilometers and approximately 1.3 hours travel time from the village. Neighboring district government offices may often be located closer—nearly one
SCOPE OF STUDY
11.
Table 5. Distance and Travel Time from School to Key Institutions
hour closer in West Manggarai and 1.2 hours closer in Ketapang. Financial institutions are located closer to the study villages than the post office in all the districts except Sintang. There is little difference in the distance and travel time to banks and Automated Teller Machines between provinces. In the NTT districts, cooperatives are closer than banks, and in West Kalimantan, credit unions are located closer to villages.
A different type of remoteness is experienced in the West Kalimantan districts compared with the NTT districts. Distance is slightly longer in the West Kalimantan study districts than in the NTT districts, varying from 14 kilometers in West Manggarai to 38 kilometers in Sintang. The West Kalimantan districts are located farther from key administrative and financial institutions than the NTT study districts (table 6, in annex A), but travel times for the West Kalimantan districts are shorter or similar compared with the NTT study districts. For example, it takes about the same time to travel to the subdistrict office in Sintang (38 kilometers) as in West Manggarai (14 kilometers), which reflects differences in road infrastructure quality and topography.31
All Areas
West Kalimantan NTT
Ketapang Landak Sintang West Manggarai
East Manggarai
Regional education office Distance (km) 124.8 205.3 87.0 132.1 77.1 78.1
Travel time (hours) 4.8 6.7 3.2 5.0 4.4 3.4
UPTD in subdistrict Distance (km) 41.6 37.0 48.7 56.0 20.0 27.4
Travel time (hours) 2.1 1.5 2.3 2.5 1.7 2.4
Nearest hospital Distance (km) 102.6 170.5 65.5 123.4 36.0 61.8
Travel time (hours) 3.9 5.2 2.7 4.7 2.6 2.9
Nearest community health center
Distance (km) 10.9 8.6 13.1 16.3 4.8 4.4
Travel time (hours) 0.7 0.5 0.8 0.8 0.6 0.5
Nearest clinic/health care staff Distance (km) 5.5 4.8 7.3 2.3 4.2 13.9
Travel time (hours) 0.4 0.3 0.5 0.3 0.7 0.8
Nearest bank Distance (km) 52.0 49.9 44.5 82.6 24.4 21.2
Travel time (hours) 2.3 1.8 2.2 3.1 1.9 1.3
Nearest market Distance (km) 35.6 32.4 39.2 54.2 12.8 14.6
Travel time (hours) 1.7 1.3 2.0 2.2 1.3 1.1
Note: km = kilometers; NTT = East Nusa Tenggara; UPTD = Unit Pelaksana Teknis Daerah (district technical implementing unit at the subdistrict level).
of the 235 villages surveyed, only 2 percent of village heads were female, with the typical profile being married male with a high school education. The large majority of the villages (94 percent) were headed by a village head or acting village head (table 7). Most of the villages with no head (10 of 13) were located in Ketapang. The majority of the individual respondents to the village instrument (177 individuals, or 75 percent of the respondents) were village heads or acting in the role. The typical village head was a married man in his mid-forties with a high school education (as the highest level of education attained) who resided in the village. There were only three female village heads in total, one in Ketapang and two in Landak. In West Manggarai, 15 percent of the village heads resided in another village in the same subdistrict. Respondents who were not village heads held the position of village secretary (36 villages) or head of village affairs (22 villages). They were also typically married men with a high school education and resided in the village, but they were slightly younger than the village heads, with an average age of 39 years.
31 Several subdistrict offices in West Kalimantan are connected by the Trans-Kalimantan Highway, whereas only a few subdistrict offices in NTT are connected by large, paved roads. Similarly, subdistricts in West Kalimantan have better access to telecommunication infrastructure than the NTT subdistricts. However, based on anecdotes from the implementation team, and considering the
distance and travel time from subdistrict offices to villages, the study villages are more difficult to reach in West Kalimantan compared with NTT. This is largely due to the many rivers that must be traversed by boat along roads between subdistrict offices and villages in West Kalimantan.

12.
All AreasWest Kalimantan NTT
Ketapang Landak Sintang West Manggarai East Manggarai
# Villages 235 59 38 82 27 29
Type of respondent and characteristics
Village head or acting village head (% respondents)
75 47 76 79 96 100
Village head or acting village head (#) 177 28 29 65 26 29
Other: secretary (% respondents) 15 24 18 17 4 0
Other: secretary (#) 36 14 7 14 1 0
Other: head affairs (% respondents) 9 29 5 4 0 0
Other: head affairs (#) 22 17 2 3 0 0
Duration in office (years) 3 3 3 3 3 5
Village with no village head (% respondents) 6 17 5 0 4 0
Village with no village head (#) 13 10 2 0 1 0
Village head - demographics and education
Age (years) 44 45 42 41 47 47
% female 2 4 7 0 0 0
% married 97 100 97 97 88 100
% primary education 1 0 3 0 0 0
% junior secondary education 14 21 14 12 23 0
% senior secondary education 68 61 48 77 58 83
% university education 18 18 34 11 19 17
Other respondent - demographics and education
Age (years) 39 37 49 38 41 -
% female 5 10 0 0 0 -
% married 98 100 100 94 100 -
% primary education 3 3 11 0 0 -
% junior secondary education 5 6 0 6 0 -
% senior secondary education 83 87 78 76 100 -
% university education 9 3 11 18 0 -
Village head - residence location (% village heads)
Village 92 86 86 98 85 97
Other village in subdistrict 6 11 7 2 15 3
Other subdistrict in district 2 4 7 0 0 0
Other respondent - residence location (% other respondents)
Village 95 94 100 94 100 -
Other village in subdistrict 3 3 0 6 0 -
Other subdistrict in distict 2 3 0 0 0 -
Table 7. Village Leadership Characteristics
Note: NTT = East Nusa Tenggara.
03 Schooling Context
SCHOOLING CONTEXT
13.
School Characteristics
School Availability
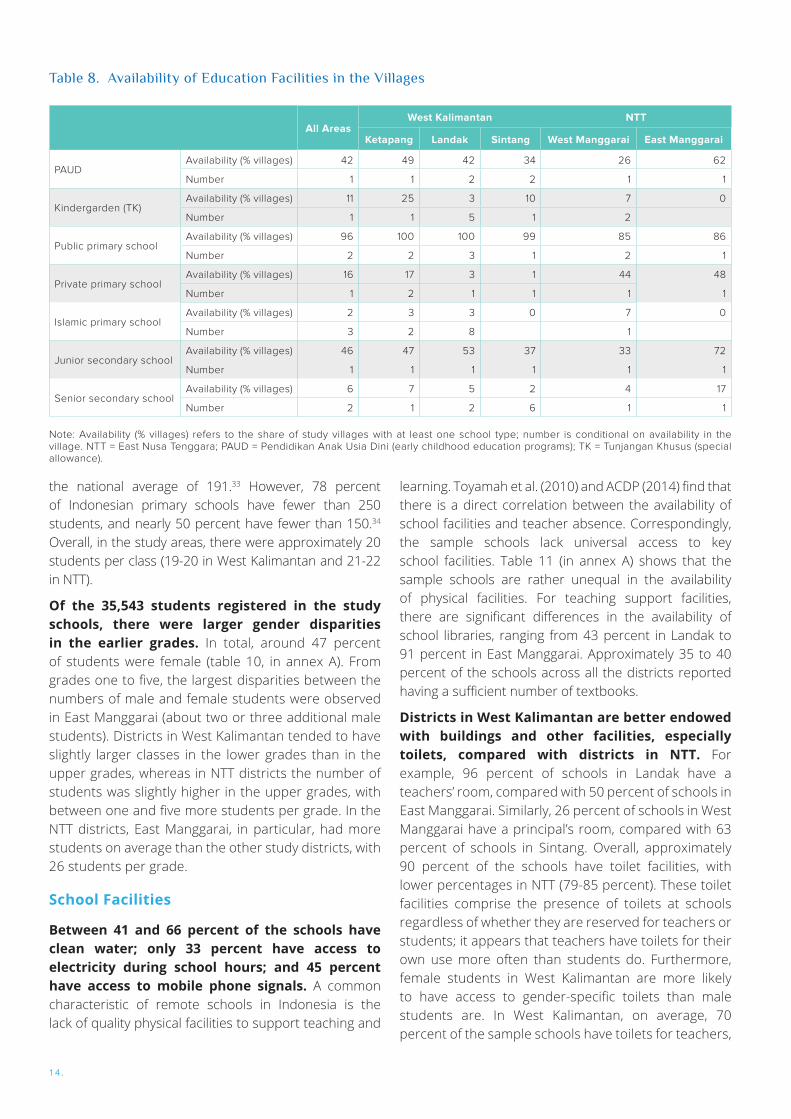
Public primary schools are the most widely available type of educational institution in the five districts, with nearly a quarter of the schools conducting multi-grade classes. The implementation of the largest primary school construction program in the world happened in Indonesia between 1973 and 1978 (Duflo 2001). As shown in table 8, in West Kalimantan nearly all the study villages have at least one public primary school. In NTT, 85 percent of the villages have a public primary school. Other educational institutions are more diversely available across the survey districts. On average, 42 percent of the villages have at least one early childhood education facility, ranging from 26 percent in West Manggarai to 62 percent in East Manggarai. Kindergartens are scarcer in the study villages—there are none in the villages in East Manggarai; 25 percent of the villages in Ketapang have at least one kindergarten. On average, 46 percent of the villages have a junior secondary school, with variation across districts, from 33 percent in West Manggarai to 72 percent in East Manggarai. In general, senior high schools are only seldomly available, with 6 percent of the 235 villages having at least one such school. The study area includes 22 private primary schools, of which 20 are in NTT (table 55, in annex A). About 2 percent of the villages have an Islamic primary school. Nearly a quarter of the schools, ranging from 18 percent in the districts in NTT to 34 percent in Ketapang, employ multi-grade classes (table 9). These are defined as classes where a single teacher teaches students of two or more grades at the same time (Little 2006).
Student Distribution
The number of students per school is a bit lower than the national average. Table 9 presents the number of students in the study areas and their distribution in classes within schools. On average, there are six classes (rombongan belajar) per school–that is, one class per grade (kelas)–in the sample schools.32 These schools have a student-teacher ratio of 16 to 1, which is just slightly below national average of 17 to 1. The average number of students per school ranges from 111 in Landak to 157 in East Manggarai, well below
32 A grade (kelas) lasts an academic year and corresponds to a given level in the school system; there is a specific curriculum that students at this level are to be taught, and when they have not reached the required level, students may be required to repeat a grade. Class (kelompok belajar) corresponds roughly to the group of students who are physically located in a particular classroom and being taught simultaneously. 33 World Bank 2018b. 34 World Bank 2008.
14.
All AreasWest Kalimantan NTT
Ketapang Landak Sintang West Manggarai East Manggarai
PAUDAvailability (% villages) 42 49 42 34 26 62
Number 1 1 2 2 1 1
Kindergarden (TK)Availability (% villages) 11 25 3 10 7 0
Number 1 1 5 1 2
Public primary schoolAvailability (% villages) 96 100 100 99 85 86
Number 2 2 3 1 2 1
Private primary schoolAvailability (% villages) 16 17 3 1 44 48
Number 1 2 1 1 1 1
Islamic primary schoolAvailability (% villages) 2 3 3 0 7 0
Number 3 2 8 1
Junior secondary schoolAvailability (% villages) 46 47 53 37 33 72
Number 1 1 1 1 1 1
Senior secondary schoolAvailability (% villages) 6 7 5 2 4 17
Number 2 1 2 6 1 1
Table 8. Availability of Education Facilities in the Villages
Note: Availability (% villages) refers to the share of study villages with at least one school type; number is conditional on availability in the village. NTT = East Nusa Tenggara; PAUD = Pendidikan Anak Usia Dini (early childhood education programs); TK = Tunjangan Khusus (special allowance).
the national average of 191.33 However, 78 percent of Indonesian primary schools have fewer than 250 students, and nearly 50 percent have fewer than 150.34 Overall, in the study areas, there were approximately 20 students per class (19-20 in West Kalimantan and 21-22 in NTT).
Of the 35,543 students registered in the study schools, there were larger gender disparities in the earlier grades. In total, around 47 percent of students were female (table 10, in annex A). From grades one to five, the largest disparities between the numbers of male and female students were observed in East Manggarai (about two or three additional male students). Districts in West Kalimantan tended to have slightly larger classes in the lower grades than in the upper grades, whereas in NTT districts the number of students was slightly higher in the upper grades, with between one and five more students per grade. In the NTT districts, East Manggarai, in particular, had more students on average than the other study districts, with 26 students per grade.
School Facilities
Between 41 and 66 percent of the schools have clean water; only 33 percent have access to electricity during school hours; and 45 percent have access to mobile phone signals. A common characteristic of remote schools in Indonesia is the lack of quality physical facilities to support teaching and
learning. Toyamah et al. (2010) and ACDP (2014) find that there is a direct correlation between the availability of school facilities and teacher absence. Correspondingly, the sample schools lack universal access to key school facilities. Table 11 (in annex A) shows that the sample schools are rather unequal in the availability of physical facilities. For teaching support facilities, there are significant differences in the availability of school libraries, ranging from 43 percent in Landak to 91 percent in East Manggarai. Approximately 35 to 40 percent of the schools across all the districts reported having a sufficient number of textbooks.
Districts in West Kalimantan are better endowed with buildings and other facilities, especially toilets, compared with districts in NTT. For example, 96 percent of schools in Landak have a teachers’ room, compared with 50 percent of schools in East Manggarai. Similarly, 26 percent of schools in West Manggarai have a principal’s room, compared with 63 percent of schools in Sintang. Overall, approximately 90 percent of the schools have toilet facilities, with lower percentages in NTT (79-85 percent). These toilet facilities comprise the presence of toilets at schools regardless of whether they are reserved for teachers or students; it appears that teachers have toilets for their own use more often than students do. Furthermore, female students in West Kalimantan are more likely to have access to gender-specific toilets than male students are. In West Kalimantan, on average, 70 percent of the sample schools have toilets for teachers,

SCHOOLING CONTEXT
15.
All AreasWest Kalimantan NTT
Ketapang Landak Sintang West Manggarai East Manggarai
School size and class distribution by grade
Average # students per school 132 125 111 130 150 157
Student-teacher ratio 16 14 16 16 15 16
Total # class groups 1,753 384 306 563 256 244
# Grade 1 classes 298 65 51 100 41 41
# Grade 2 classes 299 63 52 97 43 44
# Grade 3 classes 298 64 51 95 47 41
# Grade 4 classes 290 65 51 91 44 39
# Grade 5 classes 288 63 51 91 42 41
# Grade 6 classes 280 64 50 89 39 38
Average # classes per school 6.5 6.5 6.0 6.4 6.7 7.2
Average class size 20 19 19 20 22 21
Schools with multi-grade classes (%) 24 34 24 22 18 18
Student population
# Students 35,543 7,350 5,682 11,449 5,709 5,353
# Male students 18,706 3,847 3,048 5,968 2,995 2,848
# Female students 16,837 3,503 2,634 5,481 2,714 2,505
Student graduation results, 2015/16
# Students in grade 6 21 20 20 21 25 24
# Male students in grade 6 10 10 10 10 12 11
# Female students in grade 6 11 10 10 11 13 13
# Graduates 21 20 20 21 25 24
# Male graduates 10 10 10 10 12 11
# Female graduates 11 10 10 11 13 13
Average UN score 149.0 113.7 112.3 160.7 187.2 194.7
Score in Indonesian 60.2 56.3 50.1 59.7 66.4 77.3
Score in math 54.8 50.2 45.2 52.9 64.7 72.0
Score in science 61.1 59.7 50.5 62.0 64.0 74.1
Table 9. Characteristics of Student Population in the Sample Schools
Note: NTT = East Nusa Tenggara; UN = United Nations.
nearly 60 percent have toilets for female students, and 50 percent have toilets for male students. In comparison, in NTT, on average, 82 percent of the sample schools have toilets for teachers, 30 percent have toilets for female students, and 21 percent have toilets for male students.
School Budget
All the schools receive operational funds from the central government. The amount received from the central government under the School Operations Fund for academic year 2015/16 varied between IDR
89 million (US$6,360) in Landak and IDR 131 million (US$9,360) in East Manggarai (table 12).35,36 Local governments also contribute to school operational funds,37 except for the schools in Landak, which did not receive funding from any local government. In the other four study districts that reported having received financial support, district governments were the second most important source of school operational funds, although there were significant variations across districts in the amounts the schools received. In West Manggarai and East Manggarai, 16 and 12 percent of the schools received IDR 33 million (US$2,360) and IDR 23 million (US$1,640), respectively, from the district government. In Ketapang and Sintang, on average, approximately 90 percent of the schools received IDR 35 The exchange rate was approximately Rp 14,000 to US$1 at the
date of publication.36 This is in line with findings from Al-Samarrai and Cerdan-Infantes (2013): about half the public schools at the primary and junior secondary levels nationally reported not having received any additional financial support from the district government in 2010.
37 These are comprised of funds from the district-specific complement to the national School Operations Fund.

16.
10 million (US$715) from their district government. Al-Samarrai and Cerdan-Infantes (2013) find that differences occur in the amount of resources allocated by district governments to schools for teacher salaries compared with resources allocated for direct education support. Districts indeed tend to allocate a large part of their budgets to paying salaries––particularly to contract teachers––which leaves fewer resources available for direct support to schools. Provincial government funds are scarcer and not homogeneously distributed across districts. In NTT, only one school in the province received additional provincial funding (IDR 18 million (US$1,285) for West Manggarai). In West Kalimantan, six schools in Ketapang and three schools in Sintang reported having received approximately IDR 5 million (US$360) and IDR 13 million (US$930), respectively, per district, from the provincial government.
Government funds comprise between 94.0 and 99.5 percent of school operational funds.38 The remainder predominantly come from parent contributions (on average, 1.33 percent), which vary widely in type and amount (table 13). Overall, the
All AreasWest Kalimantan NTT
Ketapang Landak Sintang West Manggarai East Manggarai
Source of school operation funds
Central government (%schools)
100 100 100 100 100 100
Amount from central government (Rp)
108,695,824 105,881,608 88,737,600 108,972,376 119,043,496 130,656,944
Province government (%schools)
4 5 0 7 3 0
Amount from province government (Rp)
10,838,640 4,733,334 12,697,733 18,000,000
District government (%schools)
53 92 0 89 16 12
Amount from district government (Rp)
12,110,747 10,315,019 11,171,484 33,033,334 23,050,000
Village government (% schools)
1 3 0 0 0 6
Amount from village government (Rp)
2,400,000 3,000,000 1,800,000
Reported distribution of school operation funds by source (%)
Government 97.7 97.3 99.5 98.3 97.6 94.3
Fees paid by parents 1.3 0.7 0.4 1.0 1.1 5.0
Community contribution
0.1 0.2 0.0 0.0 0.3 0.4
Other sources 0.8 2.0 0.1 0.6 1.0 0.4
most frequent fees charged to parents are for school uniforms, celebrations, and examinations.
Language and Curriculum Utilized in Sample Schools
Indonesian is the principal language used in most of the schools in the study areas. More than 90 percent of the schools in West Kalimantan and 70 percent in NTT use Indonesian (table 14, in annex A). The remaining schools in NTT use Manggarai as the main teaching language. In West Kalimantan, Malay (Ketapang) and Dayak (Sintang and Landak) are reported to be the principal languages of instruction in 3 to 7 percent of the schools, and by 2 to 9 percent of the teachers.
The study found some discrepancies in the use of the national curriculum in the surveyed districts. Most teachers (74 percent) teach at least four subjects, and 14 percent teach one subject. For the curriculum, 99 percent of the principals reported that the 2004 curriculum is used in their school, whereas 94 percent of the teachers reported using the 2006 curriculum.
Table 12. Funding Sources for Sample Schools, Academic Year 2015/16
Note: NTT = East Nusa Tenggara.
38 Here, “government funds” refers to national, provincial, district, and village funding sources.
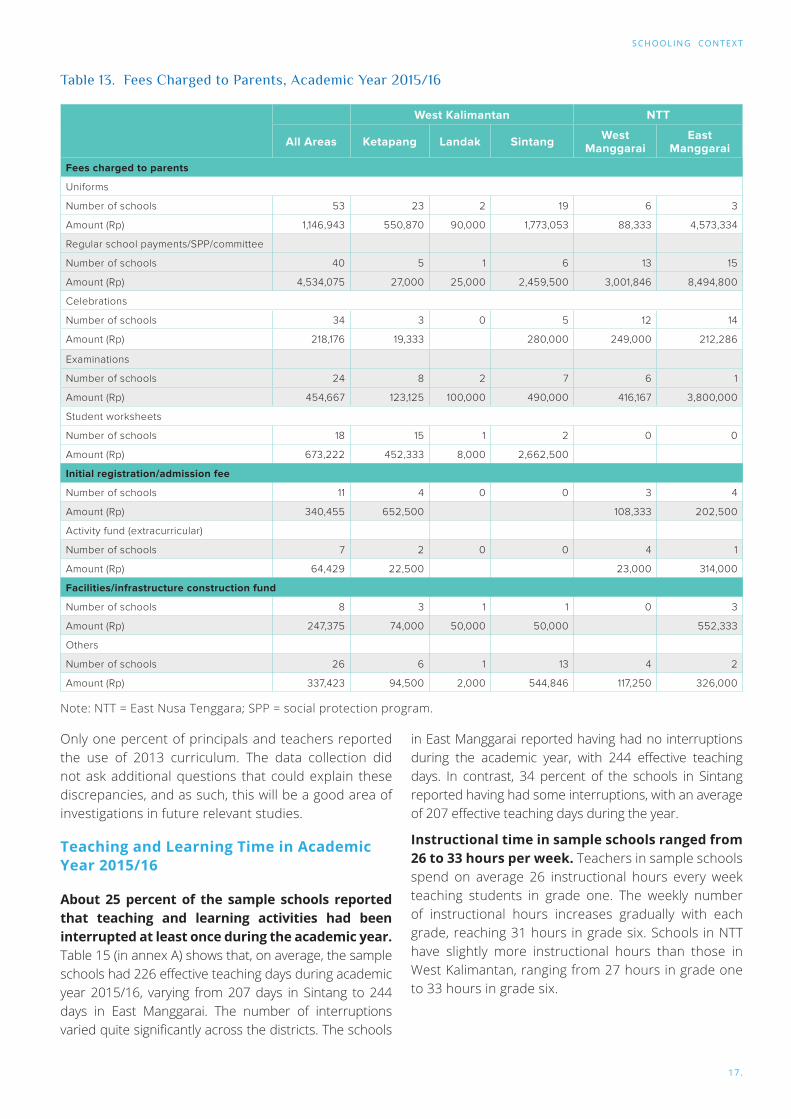
SCHOOLING CONTEXT
17.
West Kalimantan NTT
All Areas Ketapang Landak Sintang West Manggarai
East Manggarai
Fees charged to parents
Uniforms
Number of schools 53 23 2 19 6 3
Amount (Rp) 1,146,943 550,870 90,000 1,773,053 88,333 4,573,334
Regular school payments/SPP/committee
Number of schools 40 5 1 6 13 15
Amount (Rp) 4,534,075 27,000 25,000 2,459,500 3,001,846 8,494,800
Celebrations
Number of schools 34 3 0 5 12 14
Amount (Rp) 218,176 19,333 280,000 249,000 212,286
Examinations
Number of schools 24 8 2 7 6 1
Amount (Rp) 454,667 123,125 100,000 490,000 416,167 3,800,000
Student worksheets
Number of schools 18 15 1 2 0 0
Amount (Rp) 673,222 452,333 8,000 2,662,500
Initial registration/admission fee
Number of schools 11 4 0 0 3 4
Amount (Rp) 340,455 652,500 108,333 202,500
Activity fund (extracurricular)
Number of schools 7 2 0 0 4 1
Amount (Rp) 64,429 22,500 23,000 314,000
Facilities/infrastructure construction fund
Number of schools 8 3 1 1 0 3
Amount (Rp) 247,375 74,000 50,000 50,000 552,333
Others
Number of schools 26 6 1 13 4 2
Amount (Rp) 337,423 94,500 2,000 544,846 117,250 326,000
Table 13. Fees Charged to Parents, Academic Year 2015/16
Note: NTT = East Nusa Tenggara; SPP = social protection program.
Only one percent of principals and teachers reported the use of 2013 curriculum. The data collection did not ask additional questions that could explain these discrepancies, and as such, this will be a good area of investigations in future relevant studies.
Teaching and Learning Time in Academic Year 2015/16
About 25 percent of the sample schools reported that teaching and learning activities had been interrupted at least once during the academic year. Table 15 (in annex A) shows that, on average, the sample schools had 226 effective teaching days during academic year 2015/16, varying from 207 days in Sintang to 244 days in East Manggarai. The number of interruptions varied quite significantly across the districts. The schools
in East Manggarai reported having had no interruptions during the academic year, with 244 effective teaching days. In contrast, 34 percent of the schools in Sintang reported having had some interruptions, with an average of 207 effective teaching days during the year.
Instructional time in sample schools ranged from 26 to 33 hours per week. Teachers in sample schools spend on average 26 instructional hours every week teaching students in grade one. The weekly number of instructional hours increases gradually with each grade, reaching 31 hours in grade six. Schools in NTT have slightly more instructional hours than those in West Kalimantan, ranging from 27 hours in grade one to 33 hours in grade six.

18.
School Supervision and Meetings In Academic Year 2015/16
On average, about 90 percent of principals reported having had a supervisory visit from the school superintendent or other officials during academic year 2015/16. Two-thirds of the teachers reported having been supervised by another education official while teaching during the year (table 16).39 Nearly all the principals (between 91 and 100 percent, depending on the district) reported having had regular internal meetings between principals and teachers (approximately six times during academic year 2015/16). This implies that there were approximately bimonthly internal meetings between principals and teachers.40 A similar, slightly lower frequency of internal meetings was reported by teachers.
All Areas
West Kalimantan NTT
Ketapang Landak Sintang West Manggarai
East Manggarai
School and teacher supervision
Visit from superintendant/officials/foundation 88 80 80 90 100 97
Teacher supervision during teaching 67 71 62 64 67 73
Internal meetings between principals and teachers
Principal report 95 97 94 91 100 100
Average # internal meetings (principal) 6 5 5 6 8 6
Teacher report 0.880 0.880 0.840 0.880 0.880 0.930
Average # internal meetings (teachers) 5 5 4 4 7 6
Participation of teachers in preparing school programs
Entirely 58 60 32 48 71 88
Partially 22 27 24 28 14 9
Table 16. School Supervision and Meetings, Academic Year 2015/16
Note: NTT = East Nusa Tenggara.
Figure 1. School Meetings with External Stakeholders, 2015/16
School principals or other staff also engaged in several meetings with external stakeholders during academic year 2015/16. In most of the districts, approximately 90 percent of the schools had meetings between parents and teacher working groups during the year (figure 1). Meetings with education authorities and district and subdistrict technical implementing unit education agencies were also common, with approximately 75 and 80 percent of the schools, respectively, reporting having had such meetings. Figure 2 shows the topics covered during these meetings, as reported by teachers. In these discussions, the student learning process was the most frequently discussed issue, followed by the curriculum, students’ grades, and teaching quality.
39 A teacher could be supervised by another teacher, the principal, the superintendent, or some other person working for a public educational institution.
40 The school year runs from mid-July to mid-June in Indonesian public schools.
Per
cen
t o
f S
cho
ols
With District Education
office
All Areas Ketapang Landak Sintang West Manggarai East Manggarai
1009080706050403020100
With Teacher Working Group
With Parents With Other school
With UPTD With Foundation
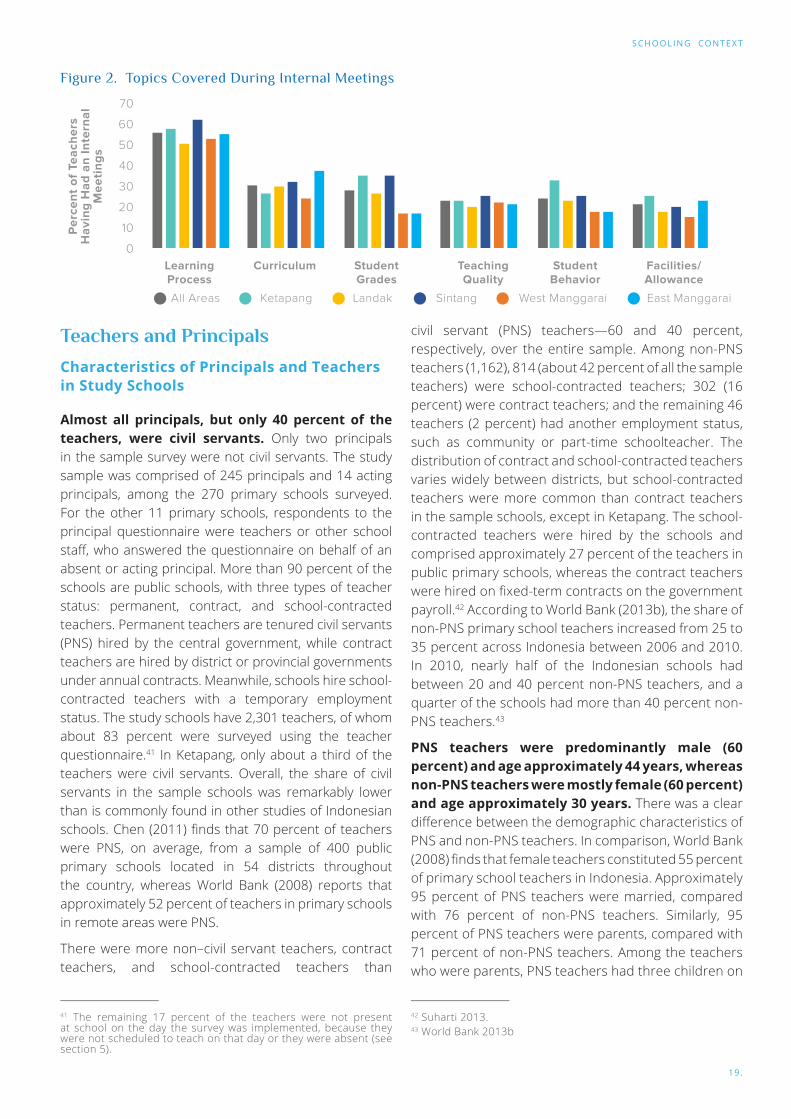
SCHOOLING CONTEXT
19.
Figure 2. Topics Covered During Internal Meetings
Teachers and Principals
Characteristics of Principals and Teachers in Study Schools
Almost all principals, but only 40 percent of the teachers, were civil servants. Only two principals in the sample survey were not civil servants. The study sample was comprised of 245 principals and 14 acting principals, among the 270 primary schools surveyed. For the other 11 primary schools, respondents to the principal questionnaire were teachers or other school staff, who answered the questionnaire on behalf of an absent or acting principal. More than 90 percent of the schools are public schools, with three types of teacher status: permanent, contract, and school-contracted teachers. Permanent teachers are tenured civil servants (PNS) hired by the central government, while contract teachers are hired by district or provincial governments under annual contracts. Meanwhile, schools hire school-contracted teachers with a temporary employment status. The study schools have 2,301 teachers, of whom about 83 percent were surveyed using the teacher questionnaire.41 In Ketapang, only about a third of the teachers were civil servants. Overall, the share of civil servants in the sample schools was remarkably lower than is commonly found in other studies of Indonesian schools. Chen (2011) finds that 70 percent of teachers were PNS, on average, from a sample of 400 public primary schools located in 54 districts throughout the country, whereas World Bank (2008) reports that approximately 52 percent of teachers in primary schools in remote areas were PNS.
There were more non–civil servant teachers, contract teachers, and school-contracted teachers than
civil servant (PNS) teachers—60 and 40 percent, respectively, over the entire sample. Among non-PNS teachers (1,162), 814 (about 42 percent of all the sample teachers) were school-contracted teachers; 302 (16 percent) were contract teachers; and the remaining 46 teachers (2 percent) had another employment status, such as community or part-time schoolteacher. The distribution of contract and school-contracted teachers varies widely between districts, but school-contracted teachers were more common than contract teachers in the sample schools, except in Ketapang. The school-contracted teachers were hired by the schools and comprised approximately 27 percent of the teachers in public primary schools, whereas the contract teachers were hired on fixed-term contracts on the government payroll.42 According to World Bank (2013b), the share of non-PNS primary school teachers increased from 25 to 35 percent across Indonesia between 2006 and 2010. In 2010, nearly half of the Indonesian schools had between 20 and 40 percent non-PNS teachers, and a quarter of the schools had more than 40 percent non-PNS teachers.43
PNS teachers were predominantly male (60 percent) and age approximately 44 years, whereas non-PNS teachers were mostly female (60 percent) and age approximately 30 years. There was a clear difference between the demographic characteristics of PNS and non-PNS teachers. In comparison, World Bank (2008) finds that female teachers constituted 55 percent of primary school teachers in Indonesia. Approximately 95 percent of PNS teachers were married, compared with 76 percent of non-PNS teachers. Similarly, 95 percent of PNS teachers were parents, compared with 71 percent of non-PNS teachers. Among the teachers who were parents, PNS teachers had three children on
41 The remaining 17 percent of the teachers were not present at school on the day the survey was implemented, because they were not scheduled to teach on that day or they were absent (see section 5).
42 Suharti 2013.43 World Bank 2013b
Per
cen
t o
f Te
ach
ers
Hav
ing
Had
an
Inte
rnal
M
eeti
ng
s
Learning Process
70
60
50
40
30
20
10
0
Teaching Quality
Student Behavior
Facilities/Allowance
Curriculum Student Grades
All Areas Ketapang Landak Sintang West Manggarai East Manggarai

20.
All AreasWest Kalimantan NTT
Ketapang Landak Sintang West Manggarai
East Manggarai
Respondent status (#)
Schools 270 59 51 88 38 34
Principal 245 55 38 82 38 32
Acting principal 14 2 10 1 0 1
Respondent on behalf of principal 11 2 3 5 0 1
PNS teachers 755 140 133 240 137 105
Non-PNS teachers 1162 280 167 345 195 175
Contract teacher 302 138 24 58 15 67
Honor teacher 814 104 140 285 177 108
Other employment status 46 38 3 2 3 0
Principal demographic characteristics
Age (years) 48 47 49 47 51 51
Gender: male (%) 84 81 96 73 100 79
Marital status: married (%) 97 97 96 98 97 94
Marital status: single (%) 2 3 4 1 3 0
Marital status: other (%) 1 0 0 1 0 6
Has children (%) 98 98 96 99 95 100
Average # children 3 3 3 3 5 4
PNS teachers demographic characteristics
Age (years) 44 43 44 45 45 45
Gender: male (%) 60 57 58 61 61 65
Marital status: married (%) 95 97 95 94 96 95
Marital status: single (%) 3 2 3 3 1 3
Marital status: other (%) 2 1 2 3 3 2
Has children (%) 95 95 93 95 96 96
Average # children 3 2 3 3 4 3
Non-PNS teachers demographic characteristics
Age (years) 30 30 32 31 30 30
Gender: male (%) 40 36 45 39 36 45
Marital status: married (%) 76 78 74 78 74 74
Marital status: single (%) 22 21 24 18 24 25
Marital status: other (%) 2 1 2 4 2 1
Has children (%) 71 73 69 77 66 65
Average # children 1 1 1 1 1 1
average, whereas non-PNS teachers had one child on average. Lastly, only 3 percent of PNS teachers and 2 percent of principals were single; 22 percent of non-PNS teachers were single. As shown in table 17, the typical principal in the sample schools was a married man approaching age 50, with three children.
Only slightly more than half of the principals and teachers in study schools held an undergraduate degree. The 2005 national Teacher Law requires that all teachers have a four-year bachelor’s degree;
Note: NTT = East Nusa Tenggara; PNS = civil servants.
Table 17. Principal and Teacher Demographics
however, the law has not yet been fully implemented for the sample schools. Principal and teacher educational attainment levels are presented in figure 3. Data from the teacher census show that only 14 percent of primary school teachers in remote areas held a bachelor’s degree in 2010, compared with 27 percent of all primary school teachers nationally.44
44 World Bank 2013b.
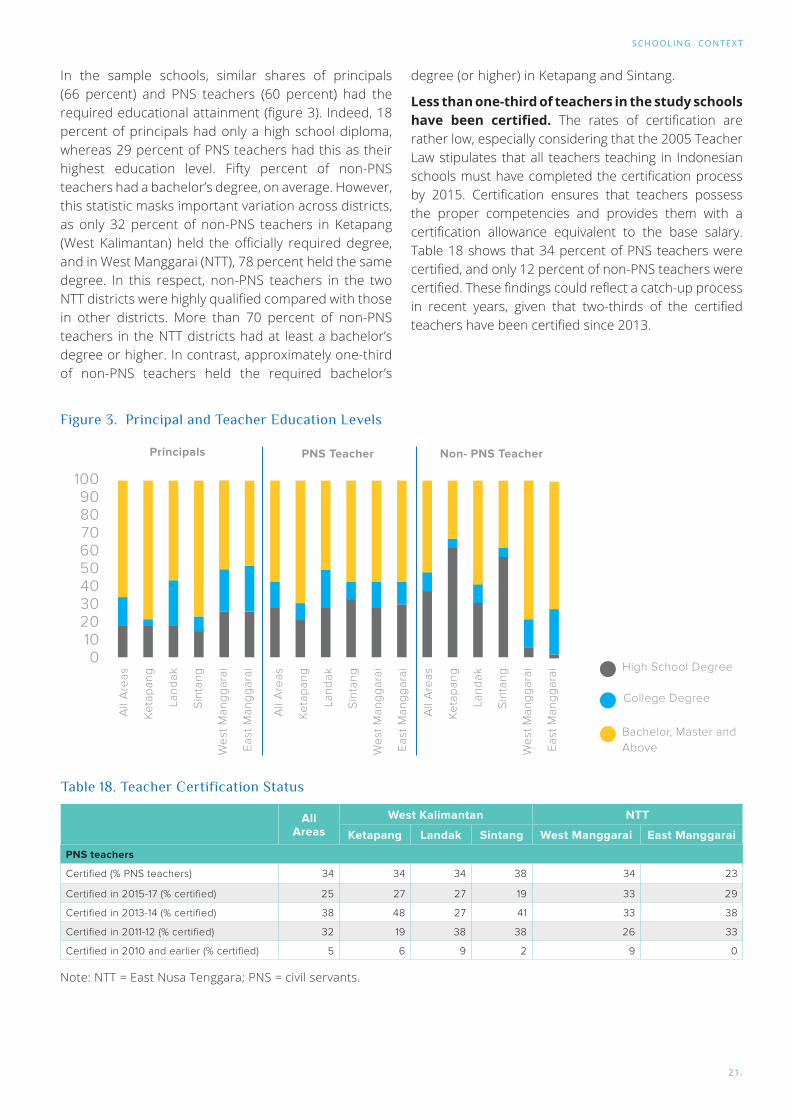
SCHOOLING CONTEXT
21.
degree (or higher) in Ketapang and Sintang.
Less than one-third of teachers in the study schools have been certified. The rates of certification are rather low, especially considering that the 2005 Teacher Law stipulates that all teachers teaching in Indonesian schools must have completed the certification process by 2015. Certification ensures that teachers possess the proper competencies and provides them with a certification allowance equivalent to the base salary. Table 18 shows that 34 percent of PNS teachers were certified, and only 12 percent of non-PNS teachers were certified. These findings could reflect a catch-up process in recent years, given that two-thirds of the certified teachers have been certified since 2013.
All Areas
West Kalimantan NTT
Ketapang Landak Sintang West Manggarai East Manggarai
PNS teachers
Certified (% PNS teachers) 34 34 34 38 34 23
Certified in 2015-17 (% certified) 25 27 27 19 33 29
Certified in 2013-14 (% certified) 38 48 27 41 33 38
Certified in 2011-12 (% certified) 32 19 38 38 26 33
Certified in 2010 and earlier (% certified) 5 6 9 2 9 0
Table 18. Teacher Certification Status
Note: NTT = East Nusa Tenggara; PNS = civil servants.
Figure 3. Principal and Teacher Education Levels
1009080706050403020100
Principals PNS Teacher Non- PNS Teacher
High School Degree
College Degree
Bachelor, Master and
Above
All
Are
as
Ke
tap
an
g
Lan
da
k
Sin
tan
g
We
st M
an
gg
ara
i
Ea
st M
an
gg
ara
i
All
Are
as
Ke
tap
an
g
Lan
da
k
Sin
tan
g
We
st M
an
gg
ara
i
Ea
st M
an
gg
ara
i
All
Are
as
Ke
tap
an
g
Lan
da
k
Sin
tan
g
We
st M
an
gg
ara
i
Ea
st M
an
gg
ara
i
In the sample schools, similar shares of principals (66 percent) and PNS teachers (60 percent) had the required educational attainment (figure 3). Indeed, 18 percent of principals had only a high school diploma, whereas 29 percent of PNS teachers had this as their highest education level. Fifty percent of non-PNS teachers had a bachelor’s degree, on average. However, this statistic masks important variation across districts, as only 32 percent of non-PNS teachers in Ketapang (West Kalimantan) held the officially required degree, and in West Manggarai (NTT), 78 percent held the same degree. In this respect, non-PNS teachers in the two NTT districts were highly qualified compared with those in other districts. More than 70 percent of non-PNS teachers in the NTT districts had at least a bachelor’s degree or higher. In contrast, approximately one-third of non-PNS teachers held the required bachelor’s
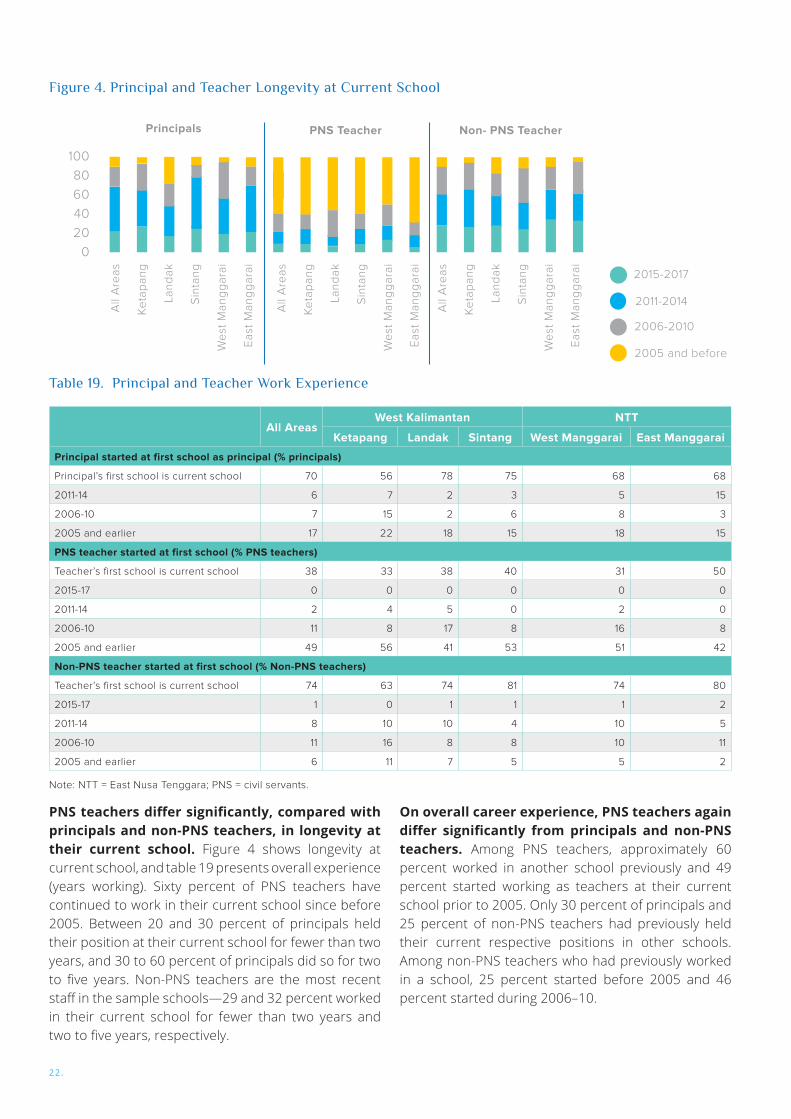
22.
PNS teachers differ significantly, compared with principals and non-PNS teachers, in longevity at their current school. Figure 4 shows longevity at current school, and table 19 presents overall experience (years working). Sixty percent of PNS teachers have continued to work in their current school since before 2005. Between 20 and 30 percent of principals held their position at their current school for fewer than two years, and 30 to 60 percent of principals did so for two to five years. Non-PNS teachers are the most recent staff in the sample schools—29 and 32 percent worked in their current school for fewer than two years and two to five years, respectively.
All AreasWest Kalimantan NTT
Ketapang Landak Sintang West Manggarai East Manggarai
Principal started at first school as principal (% principals)
Principal’s first school is current school 70 56 78 75 68 68
2011-14 6 7 2 3 5 15
2006-10 7 15 2 6 8 3
2005 and earlier 17 22 18 15 18 15
PNS teacher started at first school (% PNS teachers)
Teacher’s first school is current school 38 33 38 40 31 50
2015-17 0 0 0 0 0 0
2011-14 2 4 5 0 2 0
2006-10 11 8 17 8 16 8
2005 and earlier 49 56 41 53 51 42
Non-PNS teacher started at first school (% Non-PNS teachers)
Teacher’s first school is current school 74 63 74 81 74 80
2015-17 1 0 1 1 1 2
2011-14 8 10 10 4 10 5
2006-10 11 16 8 8 10 11
2005 and earlier 6 11 7 5 5 2
On overall career experience, PNS teachers again differ significantly from principals and non-PNS teachers. Among PNS teachers, approximately 60 percent worked in another school previously and 49 percent started working as teachers at their current school prior to 2005. Only 30 percent of principals and 25 percent of non-PNS teachers had previously held their current respective positions in other schools. Among non-PNS teachers who had previously worked in a school, 25 percent started before 2005 and 46 percent started during 2006–10.
Table 19. Principal and Teacher Work Experience
Note: NTT = East Nusa Tenggara; PNS = civil servants.
Figure 4. Principal and Teacher Longevity at Current School
100
80
60
40
20
0
Principals PNS Teacher Non- PNS Teacher
2015-2017
2011-2014
2006-2010
2005 and before
All
Are
as
Ke
tap
an
g
Lan
da
k
Sin
tan
g
We
st M
an
gg
ara
i
Ea
st M
an
gg
ara
i
All
Are
as
Ke
tap
an
g
Lan
da
k
Sin
tan
g
We
st M
an
gg
ara
i
Ea
st M
an
gg
ara
i
All
Are
as
Ke
tap
an
g
Lan
da
k
Sin
tan
g
We
st M
an
gg
ara
i
Ea
st M
an
gg
ara
i
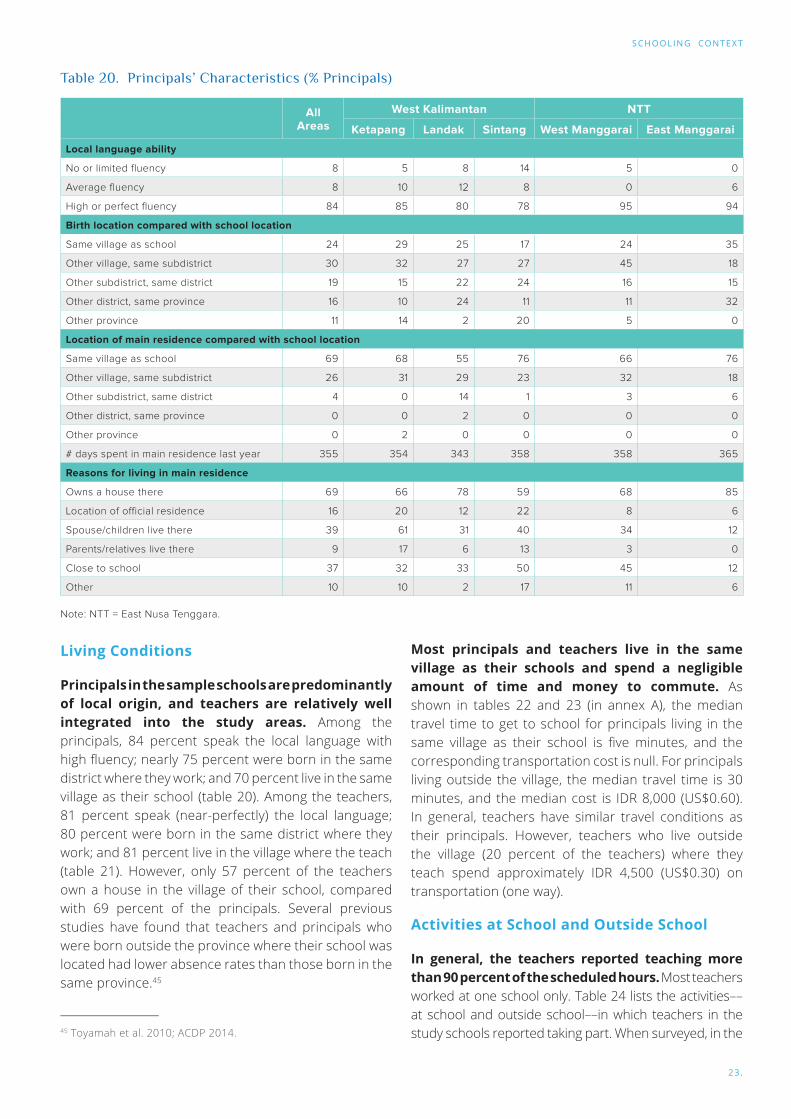
SCHOOLING CONTEXT
23.
All Areas
West Kalimantan NTT
Ketapang Landak Sintang West Manggarai East Manggarai
Local language ability
No or limited fluency 8 5 8 14 5 0
Average fluency 8 10 12 8 0 6
High or perfect fluency 84 85 80 78 95 94
Birth location compared with school location
Same village as school 24 29 25 17 24 35
Other village, same subdistrict 30 32 27 27 45 18
Other subdistrict, same district 19 15 22 24 16 15
Other district, same province 16 10 24 11 11 32
Other province 11 14 2 20 5 0
Location of main residence compared with school location
Same village as school 69 68 55 76 66 76
Other village, same subdistrict 26 31 29 23 32 18
Other subdistrict, same district 4 0 14 1 3 6
Other district, same province 0 0 2 0 0 0
Other province 0 2 0 0 0 0
# days spent in main residence last year 355 354 343 358 358 365
Reasons for living in main residence
Owns a house there 69 66 78 59 68 85
Location of official residence 16 20 12 22 8 6
Spouse/children live there 39 61 31 40 34 12
Parents/relatives live there 9 17 6 13 3 0
Close to school 37 32 33 50 45 12
Other 10 10 2 17 11 6
Living Conditions
Principals in the sample schools are predominantly of local origin, and teachers are relatively well integrated into the study areas. Among the principals, 84 percent speak the local language with high fluency; nearly 75 percent were born in the same district where they work; and 70 percent live in the same village as their school (table 20). Among the teachers, 81 percent speak (near-perfectly) the local language; 80 percent were born in the same district where they work; and 81 percent live in the village where the teach (table 21). However, only 57 percent of the teachers own a house in the village of their school, compared with 69 percent of the principals. Several previous studies have found that teachers and principals who were born outside the province where their school was located had lower absence rates than those born in the same province.45
Most principals and teachers live in the same village as their schools and spend a negligible amount of time and money to commute. As shown in tables 22 and 23 (in annex A), the median travel time to get to school for principals living in the same village as their school is five minutes, and the corresponding transportation cost is null. For principals living outside the village, the median travel time is 30 minutes, and the median cost is IDR 8,000 (US$0.60). In general, teachers have similar travel conditions as their principals. However, teachers who live outside the village (20 percent of the teachers) where they teach spend approximately IDR 4,500 (US$0.30) on transportation (one way).
Activities at School and Outside School
In general, the teachers reported teaching more than 90 percent of the scheduled hours. Most teachers worked at one school only. Table 24 lists the activities––at school and outside school––in which teachers in the study schools reported taking part. When surveyed, in the
Note: NTT = East Nusa Tenggara.
Table 20. Principals’ Characteristics (% Principals)
45 Toyamah et al. 2010; ACDP 2014.

24.
All AreasWest Kalimantan NTT
Ketapang Landak Sintang West Manggarai East Manggarai
Local language ability
No or limited fluency 1 0.170 1 0.080 0.080 0.060
Average fluency 0.090 0.150 0.110 0.080 0.050 0.080
High or perfect fluency 0.810 0.690 0.790 0.840 0.860 0.860
Birth location compared with school location
Same village as school 39 39 39 40 31 42
Other village, same subdistrict 24 21 21 23 30 27
Other subdistrict, same district 17 14 24 17 19 13
Other district, same province 12 7 10 12 14 18
Other province 9 18 6 8 6 0
Location of main residence compared with school location
Same village as school 81 81 72 86 80 82
Other village, same subdistrict 16 16 19 13 19 18
Other subdistrict, same district 2 2 8 1 1 0
Other district, same province 0 0 1 1 1 0
Other province 0 0 0 0 0 0
# days spent in main residence last year 359 355 357 361 359 361
Reasons for living in main residence
Owns a house there 57 56 61 61 48 54
Location of official residence 14 15 12 17 16 5
Spouse/children live there 63 85 47 71 56 40
Parents/relatives live there 25 36 24 24 19 19
Close to school 32 41 23 28 44 25
Other 4 10 4 2 2 0
Table 21. Teachers’ Characteristics (% Teachers)
Note: NTT = East Nusa Tenggara.
previous week teachers had taught 26 hours, on average, of nearly 28 scheduled hours. However, there were sizable variations across districts, with the number of scheduled teaching hours ranging from 26 hours in Landak and East Manggarai to 33 hours in West Manggarai. Considering that students usually attend school six days a week in Indonesia, this implies that teachers in the sample areas teach, on average, between 4.3 and 5.5 scheduled teaching hours daily. This differs from the number of weekly realized teaching hours, which ranged from 22 hours in East Manggarai to 31 hours in West Manggarai. These self-reported weekly teaching hours are relatively high compared with the average national teaching load. World Bank (2008) reports that approximately half of the primary school teachers nationally have a workload of fewer than 18 hours weekly. More recently, Suharti (2013) finds that nationally only 44 percent of teachers teach the minimum level of teaching hours required by law (24 hours), while 53 percent of teachers in rural areas, and 59 percent in remote areas, work fewer than 18 hours each week.
Teachers also reported spending time to give and assess exams and homework. On average, there were approximately 11 primary school student exams conducted during the academic year, although there were significant variations across districts, from seven exams in Landak to 14 in Ketapang. Homework is given daily by about 25 percent of the teachers, and weekly by more than 90 percent. Approximately 90 percent of the teachers reported assessing homework themselves, spending between three hours (Landak) and five hours (East Manggarai) assessing homework each week. On weekly time allocation, assessing daily exams and homework was the third most important teacher activity, after teaching and preparing lesson plans. Other teaching-related tasks that occur less frequently during the academic year include assessment of midterm and final exams (between four hours in Landak and 11 hours in East Manggarai, on a monthly basis) and teacher training and self-development (allocated monthly, ranging from four hours in Landak to eight hours in Sintang).
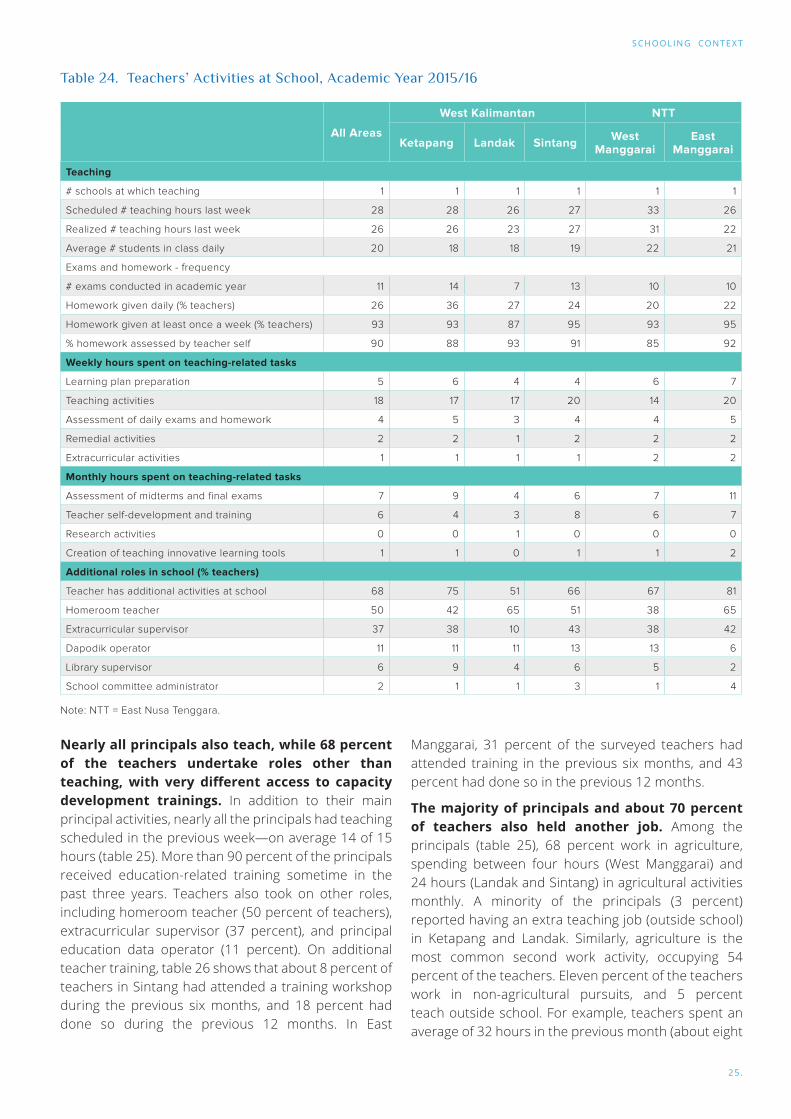
SCHOOLING CONTEXT
25.
All Areas
West Kalimantan NTT
Ketapang Landak Sintang West Manggarai
East Manggarai
Teaching
# schools at which teaching 1 1 1 1 1 1
Scheduled # teaching hours last week 28 28 26 27 33 26
Realized # teaching hours last week 26 26 23 27 31 22
Average # students in class daily 20 18 18 19 22 21
Exams and homework - frequency
# exams conducted in academic year 11 14 7 13 10 10
Homework given daily (% teachers) 26 36 27 24 20 22
Homework given at least once a week (% teachers) 93 93 87 95 93 95
% homework assessed by teacher self 90 88 93 91 85 92
Weekly hours spent on teaching-related tasks
Learning plan preparation 5 6 4 4 6 7
Teaching activities 18 17 17 20 14 20
Assessment of daily exams and homework 4 5 3 4 4 5
Remedial activities 2 2 1 2 2 2
Extracurricular activities 1 1 1 1 2 2
Monthly hours spent on teaching-related tasks
Assessment of midterms and final exams 7 9 4 6 7 11
Teacher self-development and training 6 4 3 8 6 7
Research activities 0 0 1 0 0 0
Creation of teaching innovative learning tools 1 1 0 1 1 2
Additional roles in school (% teachers)
Teacher has additional activities at school 68 75 51 66 67 81
Homeroom teacher 50 42 65 51 38 65
Extracurricular supervisor 37 38 10 43 38 42
Dapodik operator 11 11 11 13 13 6
Library supervisor 6 9 4 6 5 2
School committee administrator 2 1 1 3 1 4
Note: NTT = East Nusa Tenggara.
Table 24. Teachers’ Activities at School, Academic Year 2015/16
Nearly all principals also teach, while 68 percent of the teachers undertake roles other than teaching, with very different access to capacity development trainings. In addition to their main principal activities, nearly all the principals had teaching scheduled in the previous week—on average 14 of 15 hours (table 25). More than 90 percent of the principals received education-related training sometime in the past three years. Teachers also took on other roles, including homeroom teacher (50 percent of teachers), extracurricular supervisor (37 percent), and principal education data operator (11 percent). On additional teacher training, table 26 shows that about 8 percent of teachers in Sintang had attended a training workshop during the previous six months, and 18 percent had done so during the previous 12 months. In East
Manggarai, 31 percent of the surveyed teachers had attended training in the previous six months, and 43 percent had done so in the previous 12 months.
The majority of principals and about 70 percent of teachers also held another job. Among the principals (table 25), 68 percent work in agriculture, spending between four hours (West Manggarai) and 24 hours (Landak and Sintang) in agricultural activities monthly. A minority of the principals (3 percent) reported having an extra teaching job (outside school) in Ketapang and Landak. Similarly, agriculture is the most common second work activity, occupying 54 percent of the teachers. Eleven percent of the teachers work in non-agricultural pursuits, and 5 percent teach outside school. For example, teachers spent an average of 32 hours in the previous month (about eight

26.
Table 25. Principals’ Additional Activities: Trainings, Other Jobs, and Involvement in Local Organizations
Note: NTT = East Nusa Tenggara.
All Areas
West Kalimantan NTT
Ketapang Landak Sintang West Manggarai
East Manggarai
Activities at school
Teaching at same school (% principals) 94 92 92 98 89 97
Scheduled # teaching hours (if teaching) 15 18 20 14 14 9
Realized # teaching hours (if teaching) 14 16 16 14 12 7
Ever received training in education (% principals) 94 90 94 97 92 94
Received training in education in past 3 years
(% principals)
90 85 90 94 92 82
Other jobs, past month
Teaching outside school (% principals) 3 8 4 0 0 0
# hours spent, if teaching outside school 6 5 8
Median monthly income from extra teaching job (Rp) 450,000 200,000 700,000
Working in agriculture (% principals) 68 61 75 72 58 73
# hours spent, if working in agriculture 18 18 24 24 4 8
Median monthly income from agriculture job (Rp) 400,000 500,000 294,667 500,000 187,500 170,833
Other non-agricultural job (% principals) 8 18 8 5 3 3
Hours spent, if other job 24 38 15 8 4 4
Median monthly income from other job (Rp) 708,333 1,125,000 1,080,000 500,000 1,250,000 500,000
Involvement in local organizations (% principals)
Active in local organizations 64 81 48 69 55 56
Local government organization 13 20 20 6 8 15
Religious/youth/farmer organization 54 66 44 51 55 53
Political party or nongovernmental organization 0 0 2 0 0 0
Education/health/social organization 24 27 12 44 3 12
hours weekly) working in agriculture, compared with 26 hours teaching each week, on average. Although time spent by teachers in agricultural or other pursuits may not appear to be overly time consuming or onerous, it could be argued that it is time taken away from teaching or leisure activities. In comparison, the amount of time spent on an additional job is remarkably higher than, for instance, the amount of time spent on training and self-development per month (five hours on average, table 26). This may be related to the low proportion of teachers (34 percent) in the sample schools who reported being certified. Indeed, De Ree et al. (2018) find that an important effect of the certification program and its certification allowance is to reduce the probability of teachers holding a second job.
Additional jobs do not provide principals and teachers with significant additional income. Principals with an extra agricultural job received additional median monthly income varying from less than IDR 200,000 in the NTT districts to IDR 500,000 (US$36) in Sintang and Ketapang. The principals who have an extra non-agricultural job receive the highest
additional median monthly income (on average, IDR 700,000), although there are significant variations between districts (table 25). Similarly, for teachers who have an extra agricultural job, their additional median monthly income varies from IDR 167,000 (US$12) to IDR 437,000 (US$31) in West Manggarai and Sintang, respectively. For those who have an extra non-agricultural job, their additional median monthly income is more substantial—on average, IDR 500,000 (US$36) and up to IDR 833,000 (US$60) in Sintang.
Many of the principals and teachers participate in local organizations. Sixty-four percent of the principals are involved in one or more local organizations—religious, youth, or farmer organizations (84 percent); education, health, or social organizations (38 percent); and local government organizations (20 percent) (table 25). Table 26 shows that about 55 percent of the teachers (1,048) reported that they are involved in local organizations. These teachers are mainly involved in religious, youth, or farmer organizations (84 percent across all types of organizations); education, health, or social organizations (24 percent); and local government organizations (20

SCHOOLING CONTEXT
27.
Note: NTT = East Nusa Tenggara.
All Areas
West Kalimantan NTT
Ketapang Landak Sintang West Manggarai
East Manggarai
Education training (% of teachers)
Attended training workshop in past 6 months 17 18 15 8 20 31
Attended training workshop in past 12 months 29 33 26 18 34 43
Other jobs, past month
Teaching outside school (% teachers) 5 9 12 2 2 1
# hours spent, if teaching outside school 21 21 21 17 32 17
Median monthly income from extra teaching job (Rp) 200,000 158,333 275,000 180,000 300,000 143,750
Working in agriculture (% teachers) 54 46 61 62 41 60
# hours spent, if working in agriculture 32 35 34 39 16 24
Median monthly income from agriculture job (Rp) 300,000 333,333 266,667 437,500 166,667 191,667
Other non-agriculture job (% teachers) 11 21 16 8 7 2
Hours spent, if other job 42 43 37 43 52 31
Median monthly income from other job (Rp) 500,000 500,000 500,000 833,333 250,000 654,167
Involvement in local organizations (% teachers)
Active in local organizations 55 62 48 50 55 60
Local government organization 20 16 20 19 17 29
Religious/youth/farmer organization 84 76 84 79 94 92
Political party or nongovernmental organization 1 2 3 0 1 2
Education/health/social organization 24 39 19 27 8 14
Table 26. Teachers’ Additional Activities: Trainings, Other Jobs, and Involvement In Local Organizations
percent). Involvement in local organizations may affect teachers’ performance, for example, by increasing their workload. This would reflect the findings of ACDP (2014), which reports high rates of absenteeism among teachers who are also involved in community organizations.46 However, being more involved in their local communities
may lead teachers to be more responsive to community demands for improvement in teaching outcomes, for example, through increased peer pressure to perform better.
Principals conducted teacher performance evaluation in the majority of the schools. More
Figure 5. Median Monthly Total Income (Idr)
46 In ACDP (2014), less than 1 percent of the teachers reported being involved in government programs as facilitators.

28.
Table 27. Evaluation of Teachers by Principal, Academic Year 2015/16
All Areas
West Kalimantan NTT
Ketapang Landak Sintang West Manggarai
East Manggarai
Principal reporting (%)
# Principals reporting having conducted teacher evaluation 195 44 38 57 28 28
Evaluation criteria
Teacher discipline/behavior 87 86 74 93 89 93
Teaching capability 76 59 89 84 68 75
Teacher attendance 75 70 74 79 79 75
Performance or behavior of teacher’s students 58 50 55 60 61 71
Creativity outside the class 24 23 13 28 7 50
Others 53 48 39 49 71 68
Evaluation results communicated to teachers 98 98 97 98 96 100
Recognition of high-performing teachers
Nothing 71 67 83 45 97 100
Oral praise 27 32 10 55 3 0
Appreciation certificate 0.1 4 0 0 3 0
Help with promotion and/or self-development opportunities 3 4 0 0.1 13 0
Promotion to become principal 2 4 0 4 0 0
Financial reward 4 2 6 8 0 0
Teacher reporting (%)
# Teachers reporting having been evaluated 1,506 342 195 446 263 260
Evaluation criteria
Teacher discipline/behavior 80 80 70 77 86 86
Teaching capability 62 71 57 63 59 56
Teacher attendance 70 72 60 73 70 71
Performance or behavior of teacher’s students 57 60 50 56 55 62
Creativity outside the class 24 27 15 20 26 33
Others 35 35 21 26 48 47
Evaluation results communicated by principal 67 65 68 65 62 78
Evaluation results considered fair and objective 97 96 97 98 96 98
Recognition of high-performing teachers
Nothing 36 36 52 38 25 28
Oral praise 56 53 41 53 67 69
Appreciation certificate 0 2 0 0 1 0
Help with promotion and/or self-development opportunities 3 3 3 2 3 4
Promotion to become principal 0 0.1 0 0 0 0
Financial reward 3 5 0.1 4 5 1
Note: NTT = East Nusa Tenggara.
than 70 percent of principals reported having evaluated teachers in their school, and nearly 80 percent of teachers reported having been evaluated by their principal during academic year 2015/16 (table 27). The main evaluation criteria included teacher discipline or behavior (87 percent), teaching capability (76 percent), attendance (75 percent), and the performance or behavior of their students (58 percent). These percentages correspond with the main evaluation
criteria of principals as reported by teachers—teacher discipline/behavior (80 percent), teacher attendance (70 percent), teaching capability (62 percent), and the performance or behavior of students (57 percent). Approximately 25 percent of school principals reported having communicated the evaluation results to teachers. In contrast, approximately 67 percent of teachers reported having received their evaluation results from their principals, with 97 percent of these
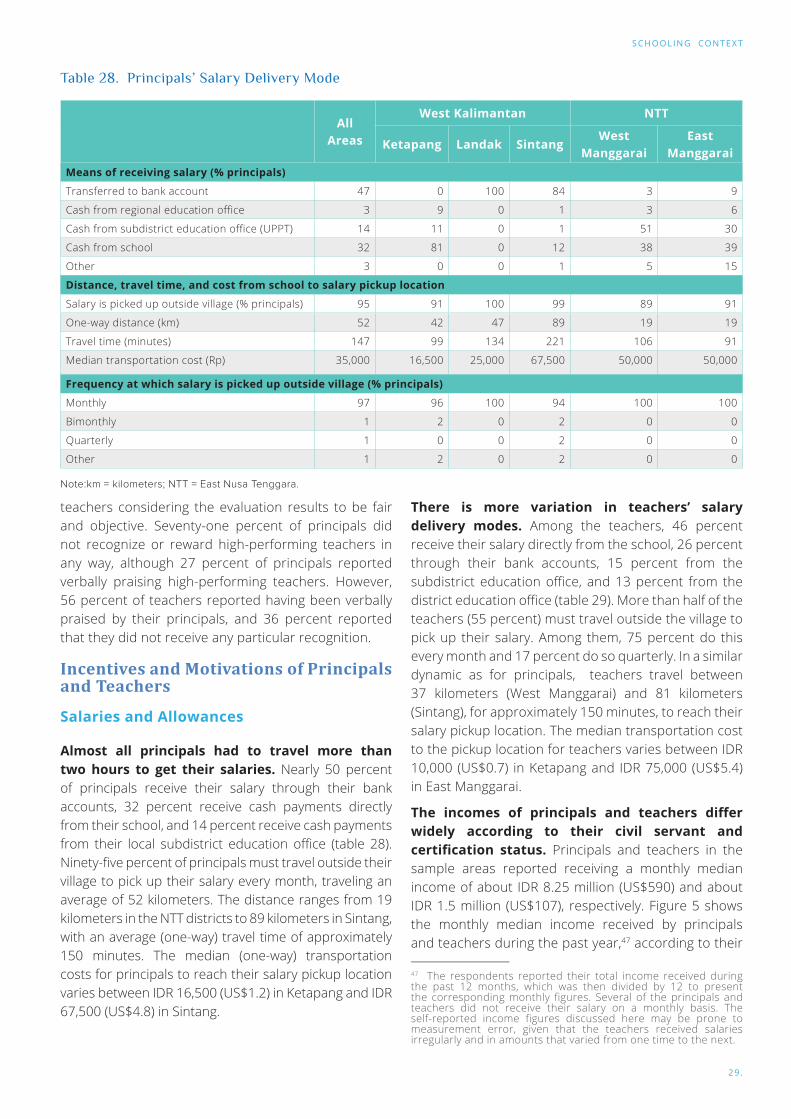
SCHOOLING CONTEXT
29.
Table 28. Principals’ Salary Delivery Mode
All Areas
West Kalimantan NTT
Ketapang Landak SintangWest
ManggaraiEast
ManggaraiMeans of receiving salary (% principals)
Transferred to bank account 47 0 100 84 3 9
Cash from regional education office 3 9 0 1 3 6
Cash from subdistrict education office (UPPT) 14 11 0 1 51 30
Cash from school 32 81 0 12 38 39
Other 3 0 0 1 5 15
Distance, travel time, and cost from school to salary pickup location
Salary is picked up outside village (% principals) 95 91 100 99 89 91
One-way distance (km) 52 42 47 89 19 19
Travel time (minutes) 147 99 134 221 106 91
Median transportation cost (Rp) 35,000 16,500 25,000 67,500 50,000 50,000
Frequency at which salary is picked up outside village (% principals)
Monthly 97 96 100 94 100 100
Bimonthly 1 2 0 2 0 0
Quarterly 1 0 0 2 0 0
Other 1 2 0 2 0 0
Note:km = kilometers; NTT = East Nusa Tenggara.
teachers considering the evaluation results to be fair and objective. Seventy-one percent of principals did not recognize or reward high-performing teachers in any way, although 27 percent of principals reported verbally praising high-performing teachers. However, 56 percent of teachers reported having been verbally praised by their principals, and 36 percent reported that they did not receive any particular recognition.
Incentives and Motivations of Principals and Teachers
Salaries and Allowances
Almost all principals had to travel more than two hours to get their salaries. Nearly 50 percent of principals receive their salary through their bank accounts, 32 percent receive cash payments directly from their school, and 14 percent receive cash payments from their local subdistrict education office (table 28). Ninety-five percent of principals must travel outside their village to pick up their salary every month, traveling an average of 52 kilometers. The distance ranges from 19 kilometers in the NTT districts to 89 kilometers in Sintang, with an average (one-way) travel time of approximately 150 minutes. The median (one-way) transportation costs for principals to reach their salary pickup location varies between IDR 16,500 (US$1.2) in Ketapang and IDR 67,500 (US$4.8) in Sintang.
There is more variation in teachers’ salary delivery modes. Among the teachers, 46 percent receive their salary directly from the school, 26 percent through their bank accounts, 15 percent from the subdistrict education office, and 13 percent from the district education office (table 29). More than half of the teachers (55 percent) must travel outside the village to pick up their salary. Among them, 75 percent do this every month and 17 percent do so quarterly. In a similar dynamic as for principals, teachers travel between 37 kilometers (West Manggarai) and 81 kilometers (Sintang), for approximately 150 minutes, to reach their salary pickup location. The median transportation cost to the pickup location for teachers varies between IDR 10,000 (US$0.7) in Ketapang and IDR 75,000 (US$5.4) in East Manggarai.
The incomes of principals and teachers differ widely according to their civil servant and certification status. Principals and teachers in the sample areas reported receiving a monthly median income of about IDR 8.25 million (US$590) and about IDR 1.5 million (US$107), respectively. Figure 5 shows the monthly median income received by principals and teachers during the past year,47 according to their
47 The respondents reported their total income received during the past 12 months, which was then divided by 12 to present the corresponding monthly figures. Several of the principals and teachers did not receive their salary on a monthly basis. The self-reported income figures discussed here may be prone to measurement error, given that the teachers received salaries irregularly and in amounts that varied from one time to the next.

30.
certification and contract (PNS or otherwise) status. In the figure, important differences depend on teacher status (PNS or another category of teacher). In all the study areas, the median income of certified teachers is roughly similar to the median income of principals, around IDR 8.4 million (US$600). In 2018, nationwide, close to 1.9 million elementary and secondary school teachers in Indonesia were recipients of the certification allowance, with an annual budget of US$5.6 billion. The same year, close to 69,000 elementary and secondary school teachers were recipients of the remote area allowance, with an annual budget of US$183 million. In Sintang, certified teachers receive slightly more than principals (median incomes of IDR 10.8 million (US$770) and IDR 10.1 million (US$720), respectively). Next are noncertified PNS teachers, who receive an average median monthly income of about IDR 4.6 million (US$330), ranging from IDR 3.4 million (US$243) in East Manggarai to IDR 6.3 million (US$450) in Sintang. Non-PNS and noncertified teachers have much lower incomes, with little variation across districts. The contract teachers’ monthly median income ranged between IDR 0.85 million (US$61) (East Manggarai) and IDR 1.5 million (US$107) (Landak and West Manggarai) during the previous year. The school-contracted teachers’ median monthly income was around IDR 0.55 million (US$40).
Differences in income for teachers are largely the result of differences in the amount of additional allowances received. This can be observed by separately examining the base salary and additional
no additional allowances. There are also differences, albeit smaller, in teachers’ base salaries. School-contracted teachers received a monthly median base salary of IDR 0.6 million, with remarkably little differences extant between districts. Contract teachers and PNS teachers received IDR 1.2 million and IDR 2.9 million, respectively. Principals and certified teachers received a base salary of approximately IDR 3.8 million.
Principals and teachers may also receive professional and remote area allowances. The 2005 Teacher Law stipulates that certified teachers receive a certification allowance equal to their base salary. It also provides a remote area allowance, which is equal to the base salary for certified teachers. For noncertified teachers who have taught for at least two years and at least 24 hours weekly in an eligible school, the remote area allowance provides an additional allowance of approximately IDR 1.5 million (US$107) per month.48 The additional income allowance (tambahan penghasilan) is specifically for noncertified teachers. Based on Presidential Decree 52/2009, the amount of the additional income allowance for noncertified teachers is fixed at IDR 250,000 (US$18) per month.
Nearly all the principals receive some additional allowance, on average, a monthly median of approximately IDR 3.5 million (US$250). About 70 percent of the surveyed principals receive the certification allowance, varying from IDR 2 million (US$143) per month in West Manggarai to IDR 3.7 million (US$264) per month in Landak (table 30, in
Figure 6. Median Monthly Base Salary (IDR)
48 Tomayah et al. 2010.
allowances of teaching staff (figures 6 and 7). During the past year, only principals, certified teachers, and PNS teachers received an additional allowance, at monthly medians of IDR 3.5 million (US$250), IDR 3.6 million (US$257), and IDR 0.96 million (US$69), respectively. Among other types of teachers, the majority received
annex A). Approximately 31 percent of principals (80 respondents) reported having received the remote area allowance in the past 12 months. The monthly median amount varies dramatically between districts,

SCHOOLING CONTEXT
31.
from IDR 0.83 million (US$60) on average in Ketapang to IDR 2.8 million (US$200) in Sintang. No principal in the East Manggarai sample schools reported receiving the remote area allowance during the past 12 months. In Landak, principals reported receiving a monthly median remote area allowance of IDR 2.7 million (US$193) and median additional income allowance of IDR 0.1 million (US$7).
The median monthly amount of the additional income allowance for noncertified teachers is significantly less than the remote area allowance across all the districts, except East Manggarai.49 Table 31 (in annex A) shows that approximately 84 percent of PNS teachers and 45 percent of non-PNS teachers received some additional allowance during academic year 2015/16. The monthly medians of the additional income allowance were approximately IDR 1.3 million (US$93) and IDR 0.2 million (US$14) for PNS and non-PNS teachers, respectively. In a similar dynamic as for principals, the largest allowance for teachers was the certification allowance, followed by the remote area allowance, and lastly the additional income allowance for noncertified teachers. For all three types of allowances, PNS teachers received amounts that were significantly greater than those received by non-PNS teachers.
Approximately 32 percent of PNS teachers in the sample received the certification allowance. The median amount varied from IDR 1.8 million in West Manggarai to IDR 3.3 million (US$129) in Landak (table 31). Only five non-PNS teachers received the
certification allowance; the median amount these teachers received was IDR 1.3 million (US$93).
The median monthly amount of the remote area allowance varied dramatically between districts. Approximately 16 and 6 percent of PNS and non-PNS teachers, respectively, reported having received the remote area allowance in the past 12 months (table 31). For PNS teachers, the monthly remote area allowance ranged from IDR 0.725 million (US$52) in Ketapang to IDR 2.7 million (US$193) in Sintang. For non-PNS teachers, the remote area allowance ranged from IDR 0.75 million (US$54) in East Manggarai, on average, to IDR 1.4 million (US$100) in Landak and Sintang.
The median monthly additional income allowance for noncertified teachers was significantly less than the remote area allowance across all the districts. The additional income allowance for noncertified teachers was received by 35 and 11 percent of PNS and non-PNS teachers, respectively, in the sample areas (table 31). The exception was non-PNS teachers, who received IDR 0.75 million (US$54) in remote area allowance and IDR 1 million (US$71) in additional income allowance for noncertified teachers, on average, per month. In Landak, not one non-PNS teacher had received the additional income allowance for noncertified teachers in the past 12 months.
The number of principals and teachers who received the certification allowance increased steadily between 2014 and 2016. Data on salary and allowance delivery performance for teachers and principals during 2014–16 are presented in table 32 (in annex A). The vast majority of the principals and teachers (combined, more than 90 percent) reported having received the entire combined amount available via the different allowances during 2014 and 2015.
Figure 7. Median Monthly Total Allowances (IDR)
49 The amount of the additional income allowance for noncertified teachers reported here differs from the amount specified in Presidential Decree 52/2009. The amount reported may include the additional income allowance for noncertified teachers, which may have been funded through the local budgets of some district governments.
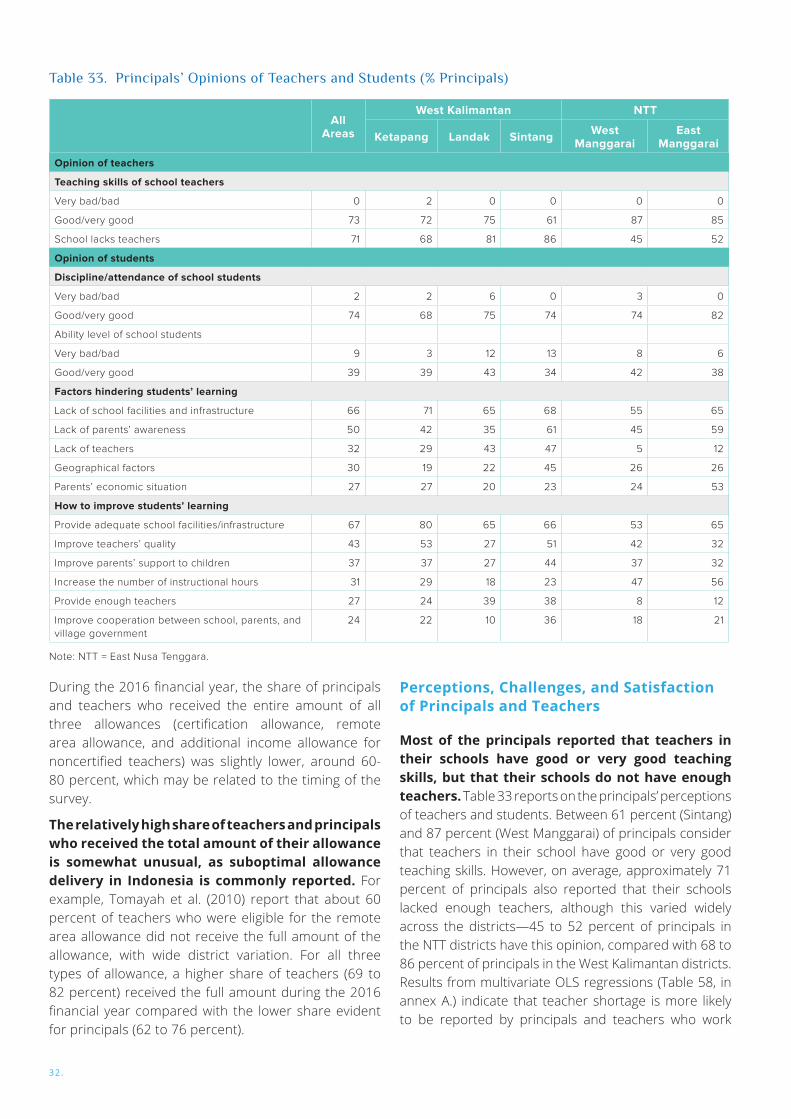
32.
All Areas
West Kalimantan NTT
Ketapang Landak Sintang West Manggarai
East Manggarai
Opinion of teachers
Teaching skills of school teachers
Very bad/bad 0 2 0 0 0 0
Good/very good 73 72 75 61 87 85
School lacks teachers 71 68 81 86 45 52
Opinion of students
Discipline/attendance of school students
Very bad/bad 2 2 6 0 3 0
Good/very good 74 68 75 74 74 82
Ability level of school students
Very bad/bad 9 3 12 13 8 6
Good/very good 39 39 43 34 42 38
Factors hindering students’ learning
Lack of school facilities and infrastructure 66 71 65 68 55 65
Lack of parents’ awareness 50 42 35 61 45 59
Lack of teachers 32 29 43 47 5 12
Geographical factors 30 19 22 45 26 26
Parents’ economic situation 27 27 20 23 24 53
How to improve students’ learning
Provide adequate school facilities/infrastructure 67 80 65 66 53 65
Improve teachers’ quality 43 53 27 51 42 32
Improve parents’ support to children 37 37 27 44 37 32
Increase the number of instructional hours 31 29 18 23 47 56
Provide enough teachers 27 24 39 38 8 12
Improve cooperation between school, parents, and village government
24 22 10 36 18 21
During the 2016 financial year, the share of principals and teachers who received the entire amount of all three allowances (certification allowance, remote area allowance, and additional income allowance for noncertified teachers) was slightly lower, around 60-80 percent, which may be related to the timing of the survey.
The relatively high share of teachers and principals who received the total amount of their allowance is somewhat unusual, as suboptimal allowance delivery in Indonesia is commonly reported. For example, Tomayah et al. (2010) report that about 60 percent of teachers who were eligible for the remote area allowance did not receive the full amount of the allowance, with wide district variation. For all three types of allowance, a higher share of teachers (69 to 82 percent) received the full amount during the 2016 financial year compared with the lower share evident for principals (62 to 76 percent).
Perceptions, Challenges, and Satisfaction of Principals and Teachers
Most of the principals reported that teachers in their schools have good or very good teaching skills, but that their schools do not have enough teachers. Table 33 reports on the principals’ perceptions of teachers and students. Between 61 percent (Sintang) and 87 percent (West Manggarai) of principals consider that teachers in their school have good or very good teaching skills. However, on average, approximately 71 percent of principals also reported that their schools lacked enough teachers, although this varied widely across the districts—45 to 52 percent of principals in the NTT districts have this opinion, compared with 68 to 86 percent of principals in the West Kalimantan districts. Results from multivariate OLS regressions (Table 58, in annex A.) indicate that teacher shortage is more likely to be reported by principals and teachers who work
Table 33. Principals’ Opinions of Teachers and Students (% Principals)
Note: NTT = East Nusa Tenggara.

SCHOOLING CONTEXT
33.
All areas
West Kalimantan NTT
Ketapang Landak Sintang West Manggarai
East Manggarai
Challenges experienced by teachers and affecting performance
Inadequacy of school infrastructure/facilities 88 85 90 89 86 91
Inadequacy of school infrastructure/facilities discourages performance
68 66 71 69 67 67
Inadequate teaching tools/learning materials 87 83 89 89 86 91
Inadequate teaching tools/learning materials discourages performance
74 70 74 76 73 73
Insufficient salary 77 76 86 76 68 85
Insufficient salary discourages performance 40 38 43 41 35 44
Lack of discipline from students 68 65 74 61 76 70
Lack of discipline from students discourages performance 53 52 52 52 50 63
Lack of attention of students during class 68 69 71 62 71 71
Lack of attention of students during class discourages performance
57 55 55 58 55 61
Lack of interest from students’ parents 58 70 66 52 52 51
Lack of interest from students’ parents discourages performance
64 63 69 66 55 66
Students are often absent 57 60 70 51 51 58
Students are often absent discourages performance 53 48 53 51 56 62
Teacher shortage 50 45 68 68 22 34
Teacher shortage discourages performance 65 61 73 68 51 56
Lack of interest in education from community 41 48 49 34 41 40
Lack of interest in education from community discourages performance
56 55 64 58 45 54
Lack of study and training opportunities 41 49 44 33 39 44
Lack of study and training opportunities discourages performance
64 68 68 62 60 60
Irregular salary 38 54 37 23 27 55
Irregular salary discourages performance 45 41 60 39 43 47
House is far from school 23 19 29 17 26 33
House is far from school discourages performance 48 38 52 57 44 47
Too many other tasks in addition to teaching 21 25 22 19 16 24
Too many other tasks in addition to teaching discourages performance
45 44 49 45 40 45
Irregular payment and lack of transprency of special allowance (TK)
14 19 13 14 11 14
Irregular payment and lack of transprency of special allowance (TK) discourages performance
31 29 28 33 29 34
Irregular payment and lack of transprency of professional allowance (TP)
7 10 5 6 5 6
Irregular payment and lack of transprency of professional allowance (TP) discourages performance
30 36 29 22 13 50
Problems with student’s parents 7 8 6 6 6 8
Problems with student’s parents discourages performance 52 62 53 62 16 52
Disruption/excessive demand from officials outside the school
6 9 4 4 4 8
Disruption/excessive demand from officials outside the school discourages performance
55 56 45 65 42 52
Table 34. Challenges Experienced by Teachers (% Teachers)
Note: The share of teachers who report that a challenge discourages performance is conditional on having reporting the challenge in question. NTT = East Nusa Tenggara; TK = Tunjangan Khusus (special allowance); TP = Tunjangan Profesi (professional allowance).

34.
in schools which have relatively few assigned teachers and relatively more enrolled students. Furthermore, the OLS results show that schools who suffer from higher teacher absence are more likely to report that teacher shortage is a problem.
Notably, staff shortages are a common problem reported by schools in remote areas across Indonesia. For example, World Bank (2008) reports that 93 percent of remote schools in the sample area claimed they lacked personnel. However, those results contrast markedly with the results from the study sample schools, as shown in table 9. The sample schools demonstrate a low student-teacher ratio of 16 to 1.
In general, principals hold a rather favorable opinion of the students in their schools. However, there is a clear difference between the share of principals who consider the discipline and attendance of their students as good or very good (74 percent) and the share who rate the ability of their students as good or very good (39 percent) (table 33). According to the principals, the main factors hindering student learning are related to school environment and parental awareness, namely, lack of school facilities and infrastructure (66 percent), lack of parental awareness and support for children in their education (50 percent), lack of available teachers (32 percent), and geographical factors (30 percent). Consequently, the main suggestions provided by principals on potential measures to improve student learning are related to school facilities (67 percent), teacher quality (43 percent), parental support for children (37 percent), and the number of instructional hours (31 percent).
The most significant challenge reported by teachers is related to the inadequacy of school infrastructure and learning facilities. Eighty-eight percent of the teachers reported this was the case (table 34). For two-thirds of these respondents, this challenge discourages teacher performance. The inadequacy of teaching tools was also acknowledged by 87 percent of teachers, 75 percent of whom find it a challenge that discourages performance. Teachers’ working conditions are also a challenge, especially the low salary levels (77 percent), although only two-fifths of the teachers find it a challenge important enough to discourage teacher performance. Salary irregularity affects 38 percent of the teachers in the sample. Teacher shortages affect half the teachers in the sample, two-thirds of whom reported that it discourages their performance. Teachers reported several challenges related to students and their behavior. Sixty-eight percent of the teachers reported that students’ lack of
discipline and attention is a challenge, and 57 percent reported that student absence is a challenge. For roughly half these teachers, student-related challenges discourage performance. Parents’ lack of interest in their children’s educational process is a challenge for 58 percent of the teachers, and lack of community interest is a challenge for 41 percent.
Overall, teachers are relatively satisfied with the appreciation they have received from the central government for their role. As shown in table 35 (annex A), 35 percent of teachers rate their satisfaction at 6 or 7, on a scale from 1 to 7 (7 being the most satisfied). However, notably, 15 percent of teachers are very dissatisfied, rating their satisfaction at 1. Interestingly, there is little difference between the districts in teachers’ overall satisfaction with the central government’s appreciation of their work. However, disaggregating between PNS and non-PNS teachers, a clear divide emerges. PNS teachers are much more satisfied with the appreciation shown by the central government—53 percent of them are highly satisfied, and only 19 percent have a low or very low satisfaction level. Among non-PNS teachers, 23 and 47 percent have high and low to very low levels of satisfaction, respectively.
Teachers appear to be satisfied with the performance of the district education offices in the organization of primary schools. Among teachers, 38 percent provided a satisfaction rate of 6-7, whereas only 7 percent provided a rating of 1, and there is little difference between the five districts of the study (table 35, in annex A). Slightly fewer PNS teachers expressed dissatisfaction than non-PNS teachers—4 and 9 percent, respectively, gave a satisfaction rate of 1. Forty-seven percent of PNS teachers expressed a highly satisfied rate, compared with 32 percent of non-PNS teachers. Teachers reported that they are similarly satisfied with the performance of the village government and community members (as a joint category), who help in the organization of school management, and with the level of appreciation of teachers’ roles by community members involved in school management. However, there appear to be notable differences between districts in the level of satisfaction with community members’ appreciation of their roles as teachers. Fewer teachers in Landak (about 35 percent, PNS and non-PNS) rated their satisfaction level at 6-7 on this criterion, compared with teachers in other districts, nearly half of whom rated their satisfaction at 6-7.
SCHOOLING CONTEXT
35.
Most teachers were satisfied with their income, with PNS having higher level of satisfaction compared to non-PNS. Overall, 53 and 20 percent of PNS and non-PNS teachers, respectively, reported a high level of satisfaction (6-7), again with large differences between districts (table 36, in annex A). Among PNS teachers, 38 percent in Landak and 62 percent in Sintang expressed high satisfaction. Among non-PNS teachers, only 10 percent in East Manggarai and 28 percent in Ketapang reported being highly satisfied with their salary/honorarium. Approximately 13 percent of teachers overall reported a very low level of satisfaction (1). However, this figure comprises only 3 percent of PNS teachers, yet 20 percent of non-PNS teachers. Between districts, there are larger differences, especially in the share of teachers with a very low level of satisfaction (1), which ranges from 14 percent in Ketapang to 38 percent in East Manggarai.
When asked about their ideal salary, the majority of the teachers in the sample schools preferred to have higher than their current salary. Sixty-three percent of PNS teachers and 6 percent of non-PNS teachers reported this to be the case. Twenty percent of the teachers reported that their current salary was satisfactorily ideal, and 20 percent of teachers in the NTT districts would ideally prefer a higher salary. The share of PNS teachers who would prefer a higher salary ranges from 5 percent in Sintang to 17 percent in East Manggarai. Among non-PNS teachers, this share ranges from 4 percent in Landak to 21 percent in East Manggarai and West Manggarai.
In summary, in line with the significant differences in salary and allowances, PNS teachers reported being more satisfied than non-PNS teachers with the support from higher authorities and financial incentives they receive. It remains to seen whether such differences also lead to differences in performance quality between PNS and non-PNS teachers. Overall, principals and teachers overwhelmingly reported that learning is affected by poor school facilities, which both groups recognize as their most important challenge. Principals and teachers also reported lack of parental interest in their children’s education as a significant challenge to student learning. This could be due to the lack of relevant information available to parents about their children’s learning progress (such as ability to learn, behavior at school, and provision of homework), and lack of awareness about how to participate more actively in their children’s education process (such as reading with their child, helping with homework, making sure their child does not work during school hours, and ensuring that children are fed). This study could contribute to effect changes in this important topic. Interestingly, principals and teachers hold very different perceptions on student behavior and discipline. Most of the principals expressed relative satisfaction with student behavior, whereas most of the teachers reported it to be a significant challenge.
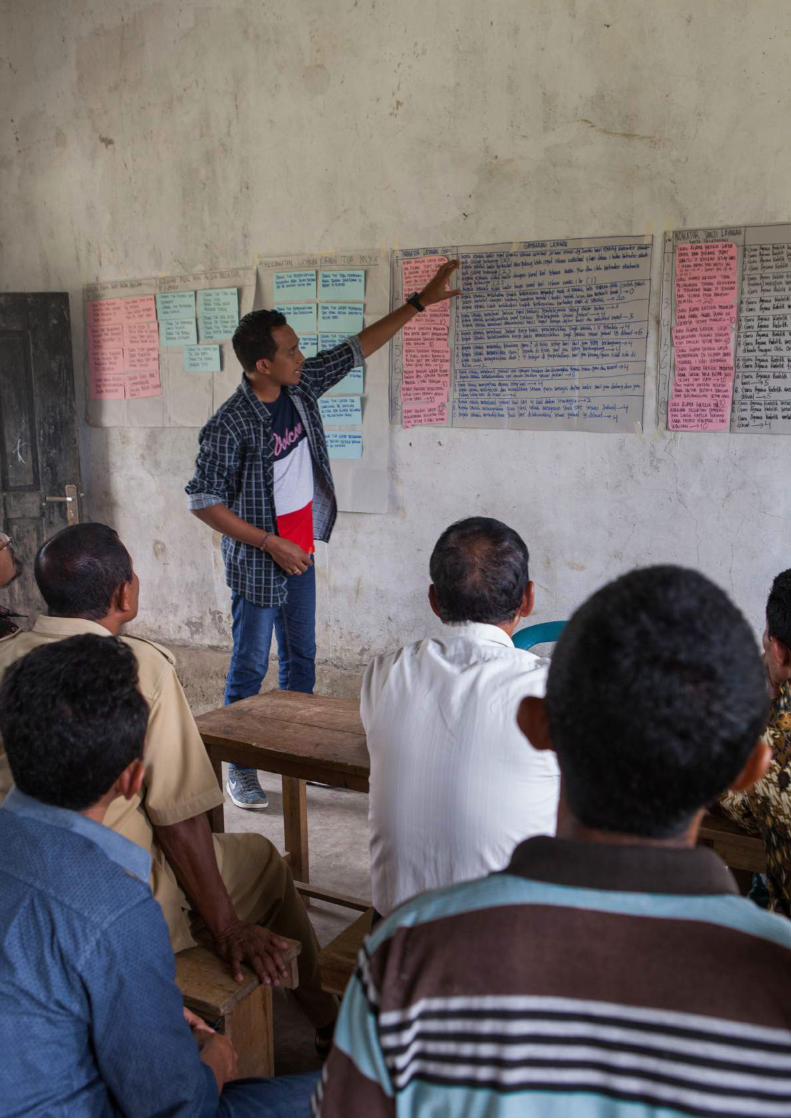
36.
37.
04 Parent and Community Involvement in Education
Parents
Parent Background
Most parents are caretakers of students in the study schools, practice the predominant religion in their village, and use a language other than Indonesian at home. Table 37 shows the socioeconomic characteristics of parents of students in the sample schools. The students overwhelmingly (97 percent) reside with their parents. Only 181 caretakers, or 3 percent of the 5,400 caretakers surveyed, are guardians of students. Sixty-three percent of student guardians are the children’s grandparents, and 26 percent are uncles or aunts. Unsurprisingly, the religion of the parents in the sample is by-and-large representative of the predominant religions in the villages in which they reside, with Catholicism being the main religion of the parents in the sample. However, there is a difference between the NTT districts, where Catholicism is the religion of 86 and 99 percent of the parents, and West Kalimantan, where there is also a significant presence of Islam and Protestantism, with between 14 and 36 percent of parents practicing Islam and between 13 and 39 percent practicing Protestantism. Only a minority of the parents use the Indonesian language to communicate with their child at home, this being more common in West Kalimantan than in the NTT districts. In West Kalimantan, between 58 and 82 percent of parents use the Dayak language, and between 7 and 33 percent use the Malay language, as the preferred language of communication with their child. In NTT, 89-93 percent of parents use the Manggarai language at home; the remainder use other local languages.
Most of the parents attended primary school as their highest level of education. In the West Kalimantan districts, between 53 and 59 percent of parents attended primary school as their highest level of education; 19 to 21 percent attended junior secondary, and 14 to 16 percent attended senior high school (table 37). In the NTT districts, about 75 percent of parents attended primary school as their highest level of education, 13 to 15 percent attended junior secondary school, and 8 to 10 percent attended senior high school. In Sintang, 11 percent of parents never attended school. Across all five districts, between 7 and 11 percent of parents are unable to read and write (using the Roman alphabet).
PARENT AND COMMUNITY INVOLMENT IN EDUCATION
37.

38.
All AreasWest Kalimantan NTT
Ketapang Landak Sintang West Manggarai
East Manggarai
Main caretaker
Parent 97 97 98 97 97 95
Guardian (wali murid) 3 3 2 3 3 5
Grandparents 63 50 85 57 65 73
Uncle/aunt 26 30 15 27 26 24
Brother/sister 6 5 0 12 4 3
Other family 4 10 0 5 0 0
Other but not family 2 5 0 0 4 0
Demographic characteristics (#)
Age of parents (years) 37 37 37 36 39 40
Age of guardian (years) 49 46 54 47 52 54
Average household size (#) 5 5 5 5 6 5
Average # children 3 2 3 2 3 3
Religion
Islam 18 36 16 14 14 1
Christian - Protestant 21 13 32 39 0 0
Catholic 61 51 51 47 86 99
Others 0 0 0 0 0 0
Main language used to communicate with child
Bahasa Indonesia 7 9 8 9 1 1
Malay 12 33 13 7 0 0
Dayak 54 58 78 82 0 0
Manggarai 24 0 0 0 89 93
Others 3 1 1 2 10 6
Highest education level attended
No education 6 5 5 11 2 2
Primary school 60 59 55 53 74 72
Junior secondary school 19 21 23 19 15 13
Senior secondary school 13 14 16 14 8 10
University 2 2 1 3 1 3
Literacy ability
Able to read and write Roman alphabet 84 83 87 80 90 86
Able to read and write non-Roman alphabet 2 1 1 4 0 4
Able to read and write multiple alphabets 3 7 1 3 0 1
Unable to read or write 9 7 8 11 8 8
Employment status and sector
Worked in past month 98 98 98 98 98 99
Work in agriculture 85 80 92 82 88 90
Work in industry and construction 7 7 4 9 6 4
Work in trade and services 8 12 4 9 6 5
Employment - position
Self-employed 18 23 19 17 18 9
Self-employed with unpaid labor 53 31 49 60 64 68
Self-employed with paid labor 2 4 2 2 2 2
Private employee 20 33 28 13 10 16
Freelancer 5 8 1 5 5 3
Unpaid worker 1 1 1 1 1 1
Government employee 1 1 0 2 1 1
Table 37. Parents’ Background Information (% Parents)
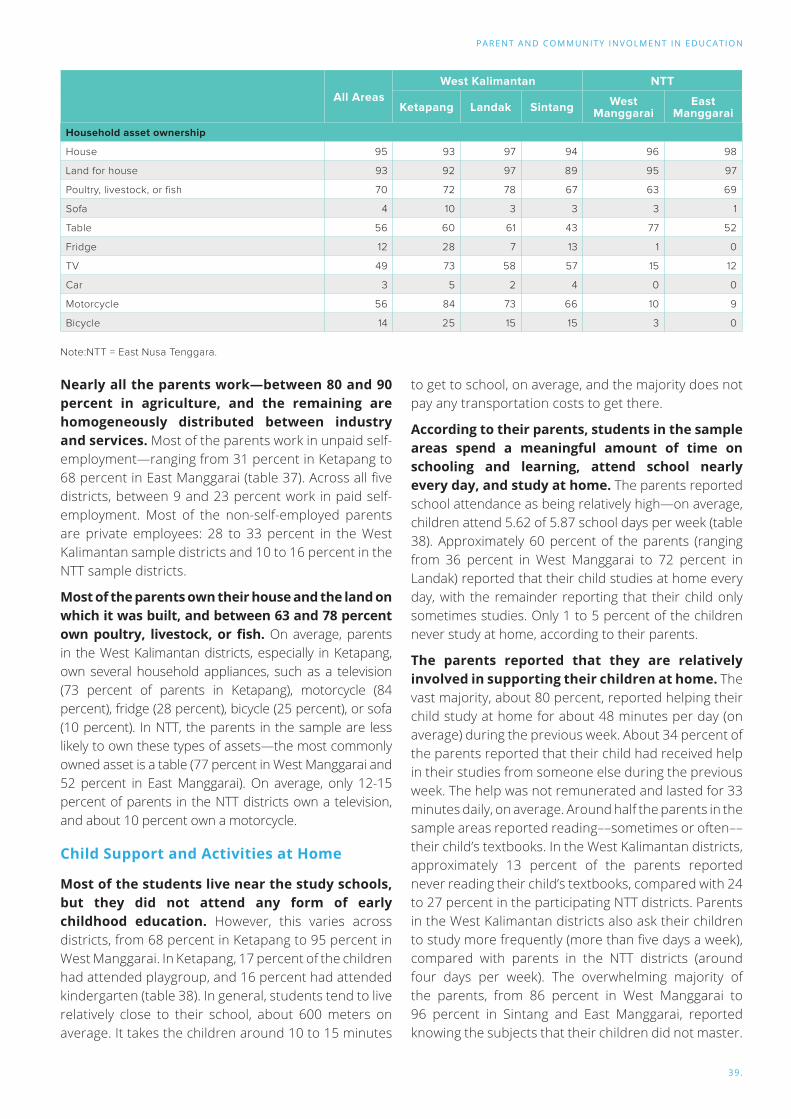
39.
PARENT AND COMMUNITY INVOLMENT IN EDUCATION
Nearly all the parents work—between 80 and 90 percent in agriculture, and the remaining are homogeneously distributed between industry and services. Most of the parents work in unpaid self-employment—ranging from 31 percent in Ketapang to 68 percent in East Manggarai (table 37). Across all five districts, between 9 and 23 percent work in paid self-employment. Most of the non-self-employed parents are private employees: 28 to 33 percent in the West Kalimantan sample districts and 10 to 16 percent in the NTT sample districts.
Most of the parents own their house and the land on which it was built, and between 63 and 78 percent own poultry, livestock, or fish. On average, parents in the West Kalimantan districts, especially in Ketapang, own several household appliances, such as a television (73 percent of parents in Ketapang), motorcycle (84 percent), fridge (28 percent), bicycle (25 percent), or sofa (10 percent). In NTT, the parents in the sample are less likely to own these types of assets—the most commonly owned asset is a table (77 percent in West Manggarai and 52 percent in East Manggarai). On average, only 12-15 percent of parents in the NTT districts own a television, and about 10 percent own a motorcycle.
Child Support and Activities at Home
Most of the students live near the study schools, but they did not attend any form of early childhood education. However, this varies across districts, from 68 percent in Ketapang to 95 percent in West Manggarai. In Ketapang, 17 percent of the children had attended playgroup, and 16 percent had attended kindergarten (table 38). In general, students tend to live relatively close to their school, about 600 meters on average. It takes the children around 10 to 15 minutes
to get to school, on average, and the majority does not pay any transportation costs to get there.
According to their parents, students in the sample areas spend a meaningful amount of time on schooling and learning, attend school nearly every day, and study at home. The parents reported school attendance as being relatively high—on average, children attend 5.62 of 5.87 school days per week (table 38). Approximately 60 percent of the parents (ranging from 36 percent in West Manggarai to 72 percent in Landak) reported that their child studies at home every day, with the remainder reporting that their child only sometimes studies. Only 1 to 5 percent of the children never study at home, according to their parents.
The parents reported that they are relatively involved in supporting their children at home. The vast majority, about 80 percent, reported helping their child study at home for about 48 minutes per day (on average) during the previous week. About 34 percent of the parents reported that their child had received help in their studies from someone else during the previous week. The help was not remunerated and lasted for 33 minutes daily, on average. Around half the parents in the sample areas reported reading––sometimes or often––their child’s textbooks. In the West Kalimantan districts, approximately 13 percent of the parents reported never reading their child’s textbooks, compared with 24 to 27 percent in the participating NTT districts. Parents in the West Kalimantan districts also ask their children to study more frequently (more than five days a week), compared with parents in the NTT districts (around four days per week). The overwhelming majority of the parents, from 86 percent in West Manggarai to 96 percent in Sintang and East Manggarai, reported knowing the subjects that their children did not master.
All AreasWest Kalimantan NTT
Ketapang Landak Sintang West Manggarai
East Manggarai
Household asset ownership
House 95 93 97 94 96 98
Land for house 93 92 97 89 95 97
Poultry, livestock, or fish 70 72 78 67 63 69
Sofa 4 10 3 3 3 1
Table 56 60 61 43 77 52
Fridge 12 28 7 13 1 0
TV 49 73 58 57 15 12
Car 3 5 2 4 0 0
Motorcycle 56 84 73 66 10 9
Bicycle 14 25 15 15 3 0
Note:NTT = East Nusa Tenggara.

40.
All Areas
West Kalimantan NTT
Ketapang Landak Sintang West Manggarai
East Manggarai
Early childhood education attended (% parents reporting)
Playgroup/Kelompok Bermain (KB) 7 17 6 3 4 6
Kindergarten (TK) 10 16 7 14 2 1
Raudhatul Athfal (RA) 0 0 0 0 0 0
Did not attend PAUD 83 68 88 83 95 92
Child school attendance in past week
Average # school days in past week 5.9 5.8 5.9 5.8 6 6
Average # school days attended in past week 5.6 5.5 5.7 5.6 5.6 5.7
Distance to school
Median distance from house to school (km) 0.3 0.3 0.3 0.3 0.5 0.5
Median travel time from house to school (minutes) 10 10 10 5 10 15
Median transportation cost from house to school (Rp) 0 0 0 0 0 0
Study at home (% parents reporting)
Child studies at home every day 58 61 72 57 36 59
Child studies at home sometimes 39 37 26 40 58 39
Child never studies at home 3 1 2 3 5 2
Child is helped by caretaker for home study 82 88 81 82 78 76
Child received help from caretaker in past week 74 79 74 77 67 66
Time spent daily by caretaker in past week, if help from caretaker (minutes)
48 45 47 45 55 52
Child was helped by other for home study in past week 34 40 28 29 31 46
Time spent daily by other in past week, if helped by other (minutes)
33.48 30.22 34.86 30.67 38.38 38
Caretaker paid other to help child, if helped by other 0 0 2 2 0 0
Amount paid to other to help child per visit, if paid (Rp) 27,521 83,300 32,650 19,375 1,000 0
Parent awareness of child’s performance at school (% parents reporting)
Frequency of reading child’s textbooks
Never 16 12 14 12 27 24
Rarely 19 23 19 17 14 19
Sometimes/often 53 52 60 56 43 46
Child has no books 7 6 3 7 11 6
Parent cannot read 6 7 4 8 5 5
Parent knows subjects that the child does not master 93 92 91 96 86 96
Average # days in week parent asks child to study 5 6 5 6 4 5
Table 38. Child’s Education and Parent Involvement
Note: KB = Kelompok Bermain (playgroup); km = kilometers; NTT = East Nusa Tenggara; PAUD = Pendidikan Anak Usia Dini (early childhood education programs).
Child participation in work was not very common in the sample areas, although the majority of the children help with household chores. About two-thirds of the parents reported that their child helped with household chores during the past month (table 39). Children’s help with household chores is more common in the NTT districts: 85 to 90 percent of parents reported that their child helps with chores for approximately five hours weekly, compared with 55 to 72 percent in the West Kalimantan districts (approximately two to four
hours weekly). Children work in family businesses in 19 percent of the households in Ketapang, 14 percent in West Manggarai and East Manggarai, 10 percent in Sintang, and 5 percent in Landak. On average, children spend approximately eight hours per week working in family businesses, with (one-way) travel taking approximately 20 minutes to undertake this work. Children working for pay is not very common in the sample areas, with the number of paid weekly hours worked varying from four in Landak to eight in Sintang

41.
PARENT AND COMMUNITY INVOLMENT IN EDUCATION
All areas
West Kalimantan NTT
Ketapang Landak Sintang West Manggarai
East Manggarai
Paid work
Child has worked for pay in past month 3 8 1 2 4 3
# weekly hours in past month, if worked for pay 8 8 4 8 8 6
Median monthly income from work, if worked for pay (Rp) 30,000 40,000 15,000 30,000 22,000 11,250
One-way travel time to go to work, if worked for pay (minutes)
16 14 16 13 19 20
Unpaid, family work
Child has worked for family business in past month 12 19 5 10 14 14
# weekly hours in family business past month, if worked for family
8 8 7 7 6 11
One-way travel time to go to family business, if worked for family (minutes)
19 18 18 19 17 25
Household chores
Child has helped with household chores in past month 67 72 55 56 85 90
# weekly hours spent doing household chores, if chores 4 2 4 4 5 5
All areas
West Kalimantan NTT
Ketapang Landak Sintang West Manggarai
East Manggarai
Expectations - child’s achievement at school
Attend school everyday 40 38 25 44 36 61
Be able to go to the next grade 36 34 45 32 41 28
Get high scores/be class champion/join competitions 47 56 51 43 47 38
Be able to read/write/count 43 42 35 39 57 51
Others 6 16 3 4 3 3
None 1 1 0 2 2 0
Expectations - child’s highest education level
Graduate from primary school 1 2 0 1 1 3
Junior secondary school 3 3 2 2 3 4
Senior secondary school 19 17 20 17 16 31
College/university 43 38 42 42 48 46
It is up to the child 16 16 19 14 24 12
As high as possible 18 24 17 25 8 4
Expected actions in case of grade retention
Give advice or reprimand the child verbally 90 89 90 89 92 90
Give physical punishment 3 2 2 1 9 4
Give nonphysical punishment 2 3 2 2 3 1
Ask teacher/classroom teacher/principal 6 9 5 4 7 7
Do nothing 6 4 6 8 5 5
Others 3 8 2 2 2 1
Table 39. Child Participation in Paid, Unpaid, and Household Works
Note: NTT = East Nusa Tenggara.
Note: NTT = East Nusa Tenggara.
Table 40. Parents’ Expectations of Child’s Education

42.
and Ketapang. The monthly income received by children who work for pay ranges from IDR 34,500 (US$2.5) in Landak to IDR 81,000 (US$5.8) in Ketapang.
Parents’ Expectations for Their Children
Parents in the sample areas expect their children to be able to read, write, and count; attend school every day; and move to the next grade in school. In West Manggarai, nearly 60 percent of parents reported that they expected their children to be able to read, write, and count (table 40). In Ketapang and Landak, the predominant expectation of the parents is that their children would achieve high scores, be the class champion, and join competitions. In Sintang, parents expect daily school attendance from their children, in addition to high performance. Across all five districts, between 28 and 45 percent of parents expect that their children will go to the next grade.
All the parents in the survey sample expect their children to progress beyond graduating from primary school. Approximately 43 percent of parents expect their children to reach university. On average, approximately 20 percent of parents expect their children to reach senior high school, ranging from 16 percent in West Manggarai to 31 percent in East Manggarai. Between 12 and 24 percent of parents leave expectations of their children’s highest education level to their children.
The survey asked parents what they would do if their child were to be held back in a grade. About 90 percent of the parents reported that they would give advice to or reprimand their child verbally, as required. In contrast, 6 percent of the parents reported they would do nothing or ask the teaching personnel about it. Nine and 4 percent of the parents in West Manggarai and East Manggarai, respectively, reported that they would use physical punishment with their children. In the other districts, this proportion was lower—around 2 percent.
School Committees
Committee Background and Establishment
Since 2002, school committees have been formally established as the institution representing communities at the school level. This has been a consequence of Indonesian Ministry of Education Decree No.044/U/2002 on the Education Board and School Committees and following the principles of school-based management. The objective of this decree was that school committees would support improvements in educational service delivery. In particular, it was expected
that the committees would monitor and provide input about school operations (including programs, budget plans, facility improvement, and teacher training), while formally involving parents and communities in the functioning of their children’s schools.
Most of the schools in the sample areas have an active school committee, and most of the school committees manage one school. Among the 270 schools included in the study, 254 have an active school committee, 14 have an inactive committee, and two appear to have no current committee (table 41, annex A). of the 241 schools with an active committee (for which we have information on their date of establishment), 20 percent were established in 2016–17, 63 percent in 2010–15, 14 percent in 2005–09, and 4 percent before 2005. The overwhelming majority of the active school committees (93 percent) manage only one school. For the functioning of school committees, 15 percent have articles of association or bylaws; 12 percent received funds for activities from the school during academic year 2015/16; and 2 percent (five committees) were provided with an office space by the school.
Committee Management
Most of the school committee respondents had been serving for five years, with the majority of them having graduated from senior secondary school. Most of the respondents were chairpersons, and a few were vice-chairpersons, secretaries, members, and treasurers. On average, the respondents had occupied their positions in the school committee for approximately five years (table 42). The highest education levels of the committee respondents were senior secondary education (36 percent), junior secondary education (27 percent), primary education (24 percent), and university-level education (6 percent). About 9 percent of the respondents were also administrators or members of other school committees.
Most of the school committee members were democratically selected. The school committee questionnaire asked about the composition of the school committees and how committee members were selected. According to Chen (2011), school committees are required to be chaired by a community representative from outside the school and should have at least nine members elected from among parents, community leaders, education professionals, the private sector, education associations, teachers, nongovernmental organizations, and village officials. Overall, committee administrators in the sample schools

43.
PARENT AND COMMUNITY INVOLMENT IN EDUCATION
All Areas
West Kalimantan NTT
Ketapang Landak Sintang West Manggarai East Manggarai
Respondent characteristics
Type of respondent
Chairperson 86 79 94 89 94 73
Vice chairperson 6 11 2 4 0 12
Secretary 4 5 2 1 6 9
Treasurer 1 0 2 1 0 0
Member 4 5 0 5 0 6
Duration of respondent in current role (years) 5 3 5 3 8 6
Education level of respondent
Did not graduate primary school 6 7 2 6 11 0
Primary school 24 30 19 26 23 21
Junior secondary school 27 34 25 24 29 24
Senior secondary school 36 21 52 35 34 39
University 6 5 0 7 3 12
Package a/b/c 2 2 2 1 0 3
Respondent is member/administrator of committees for other schools
9 16 8 4 9 12
Committee management establishment
Selection of committee administrators
Selection through meeting 88 88 81 87 91 97
Appointed by school (principal and teachers) 10 11 19 11 6 0
Appointed by previous member/administrators
1 0 0 1 0 3
Other 1 2 0 1 3 0
Who attended selection meeting
Principal 93 96 87 96 94 91
Teachers 95 96 87 97 100 94
Parents 88 92 97 82 90 81
Village officials/public figure 72 78 56 77 81 63
Previous committee members 49 33 38 72 45 38
Selection of committee chairperson during meeting:
Deliberation without voting (consensus) 24 29 31 27 16 9
Voting 75 71 64 73 84 91
Appointed by principal 1 0 5 0 0 0
Selection of other committee administrators during meeting:
Deliberation without voting (consensus) 29 31 26 39 16 25
Voting 52 51 46 40 65 72
Appointed by principal 3 0 13 3 0 0
Appointed by chairperson 9 12 3 11 13 3
Appointed by others 1 0 3 1 3 0
Only chairperson in the committee structure 5 6 10 6 3 0
Table 42. School Committee Management (% Committee Respondents)
were predominantly selected through a committee meeting process (88 percent of the committees in the sample); a small portion were appointed directly by the school (10 percent). Committee administrator selection
meetings were reported to have been attended by school principals (93 percent of the committees), teachers (95 percent), parents (88 percent), village officials and leaders (72 percent), and previous

44.
committee members (49 percent). During these selection meetings, the chairperson was selected by vote or consensus, whereas other administrators were selected by vote, designated by consensus, or appointed by the chairperson. Five percent of the committees in the sample schools only have a chairperson, without other committee members. Interestingly, Pradhan et al. (2014) test the effectiveness of various school committee institutional reforms and find that the election of committee members does not lead to improvements in student learning, although it does increase community awareness. These findings suggest that community awareness alone does not provide committees with the legitimacy and power needed to improve educational service delivery.
Eighteen percent of the committees reported that the administrator and chairperson receive a salary for their role. In West Kalimantan, the median monthly salary for the administrator or chairperson is IDR 100,000 (US$7); in the NTT districts, it is much lower, at IDR 50,000 (US$3.5) to IDR 60,000 (US$4.3). The incentives for the committee administrator and chairperson are from the School Operations Fund for 82 percent of the school committees that offer a salary to their administrator, and from the school budget for 9 percent of the school committees. In the NTT districts, funds for administrator and/or chairperson incentives come from parents in two schools.
Involvement of Parents and Committees at School
Parental and Committee Involvement at School
Parents in study schools were actively involved in school affairs. More than four-fifths of the parents in the sample survey visited their child’s school during academic year 2015/16 (table 43). However,
parental involvement in school affairs in the study areas tends to be limited to interactions with teachers or principals on issues related to their own children, as reflected in similar findings by other studies.50 Among those who visited their child’s school during academic year 2015/16, 17 percent discussed their child’s exam results with the principal, 23 percent with their child’s classroom teacher, and 10 percent with another teacher. Fifteen, 12, and 6 percent of the parents discussed their child’s overall learning development with the principal, classroom teacher, or another teacher, respectively. Approximately 11 percent of the parents reported having discussed their child’s discipline and/or attendance at school with the principal, 9 percent with the classroom teacher, and 5 percent with another teacher. In the NTT districts, the parents discussed—with the principal (20 to 33 percent), the classroom teacher (13 percent), and other teachers (10 to 13 percent)—how they or the school committee could contribute to their child’s education.
The majority of the school committees reported having at least one annual meeting to discuss various topics. Nearly four-fifths of the school committees held at least one meeting with the principal, parents, or the principal and parents together during academic year 2015/16. During academic year 2015/16, 35 percent of the committees reported having only met with the principal, and among these committees, 48 percent had met in the previous month. The committee respondents reported that they covered topics such as the preparation of student evaluations (84 percent of the committees), suggestions and complaints from parents (83 percent), school budget and financial resources (77 percent), student learning outcomes (76 percent), student discipline and behavior (76 percent), and teacher discipline and behavior (68 percent) (table
All Areas
West Kalimantan NTT
Ketapang Landak Sintang West Manggarai East Manggarai
Committee’s administrators/members receive salary
18 9 31 22 11 9
Median monthly salary (Rp) 100,000 100,000 100,000 100,000 58,334 50,000
Incentive sources:
Parents 4 0 0 0 25 33
School budget 9 0 7 11 25 0
School Operations Fund 82 80 93 78 75 67
Other sources 4 20 0 0 25 0
Do not know 4 0 0 11 0 0
Note: NTT = East Nusa Tenggara.
50 Chen 2011; Vernez, Karam, and Marshall 2012.
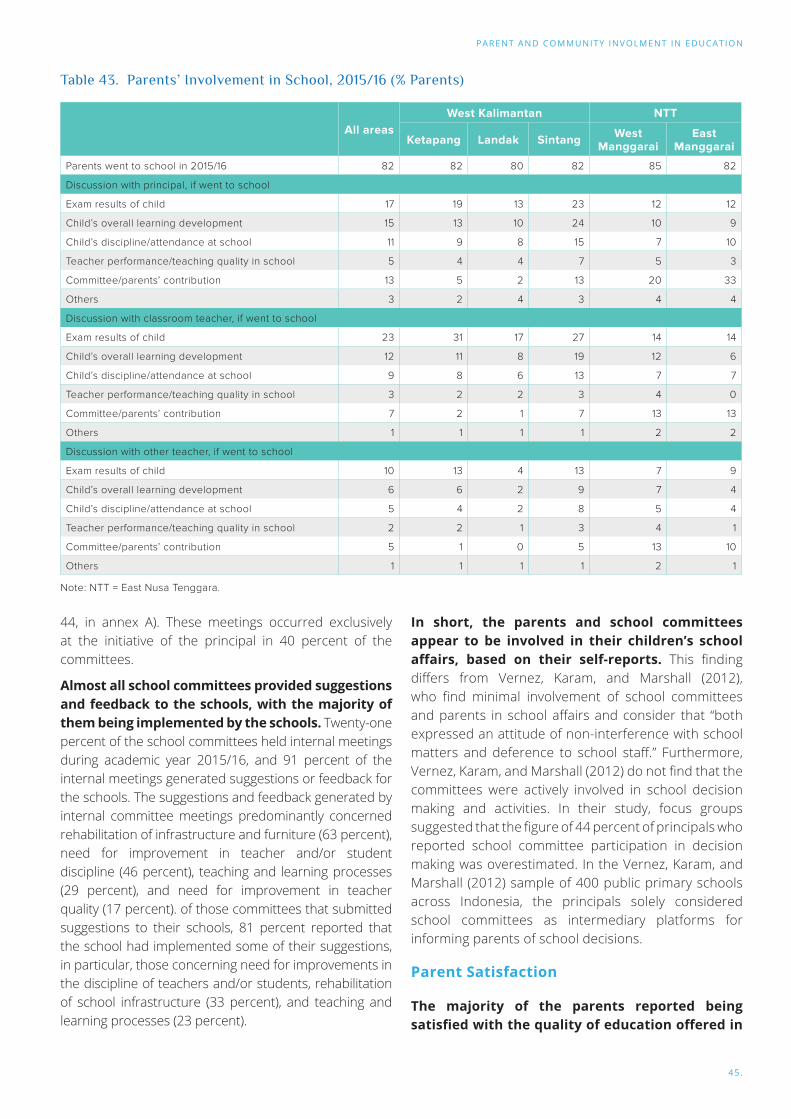
45.
PARENT AND COMMUNITY INVOLMENT IN EDUCATION
All areasWest Kalimantan NTT
Ketapang Landak Sintang West Manggarai
East Manggarai
Parents went to school in 2015/16 82 82 80 82 85 82
Discussion with principal, if went to school
Exam results of child 17 19 13 23 12 12
Child’s overall learning development 15 13 10 24 10 9
Child’s discipline/attendance at school 11 9 8 15 7 10
Teacher performance/teaching quality in school 5 4 4 7 5 3
Committee/parents’ contribution 13 5 2 13 20 33
Others 3 2 4 3 4 4
Discussion with classroom teacher, if went to school
Exam results of child 23 31 17 27 14 14
Child’s overall learning development 12 11 8 19 12 6
Child’s discipline/attendance at school 9 8 6 13 7 7
Teacher performance/teaching quality in school 3 2 2 3 4 0
Committee/parents’ contribution 7 2 1 7 13 13
Others 1 1 1 1 2 2
Discussion with other teacher, if went to school
Exam results of child 10 13 4 13 7 9
Child’s overall learning development 6 6 2 9 7 4
Child’s discipline/attendance at school 5 4 2 8 5 4
Teacher performance/teaching quality in school 2 2 1 3 4 1
Committee/parents’ contribution 5 1 0 5 13 10
Others 1 1 1 1 2 1
44, in annex A). These meetings occurred exclusively at the initiative of the principal in 40 percent of the committees.
Almost all school committees provided suggestions and feedback to the schools, with the majority of them being implemented by the schools. Twenty-one percent of the school committees held internal meetings during academic year 2015/16, and 91 percent of the internal meetings generated suggestions or feedback for the schools. The suggestions and feedback generated by internal committee meetings predominantly concerned rehabilitation of infrastructure and furniture (63 percent), need for improvement in teacher and/or student discipline (46 percent), teaching and learning processes (29 percent), and need for improvement in teacher quality (17 percent). of those committees that submitted suggestions to their schools, 81 percent reported that the school had implemented some of their suggestions, in particular, those concerning need for improvements in the discipline of teachers and/or students, rehabilitation of school infrastructure (33 percent), and teaching and learning processes (23 percent).
In short, the parents and school committees appear to be involved in their children’s school affairs, based on their self-reports. This finding differs from Vernez, Karam, and Marshall (2012), who find minimal involvement of school committees and parents in school affairs and consider that “both expressed an attitude of non-interference with school matters and deference to school staff.” Furthermore, Vernez, Karam, and Marshall (2012) do not find that the committees were actively involved in school decision making and activities. In their study, focus groups suggested that the figure of 44 percent of principals who reported school committee participation in decision making was overestimated. In the Vernez, Karam, and Marshall (2012) sample of 400 public primary schools across Indonesia, the principals solely considered school committees as intermediary platforms for informing parents of school decisions.
Parent Satisfaction
The majority of the parents reported being satisfied with the quality of education offered in
Table 43. Parents’ Involvement in School, 2015/16 (% Parents)
Note: NTT = East Nusa Tenggara.

46.
their village. Eighteen percent rated their satisfaction as very good (satisfaction rate of 7, on a scale from 1 to 7), and 65 percent as good (satisfaction rate of 4, 5, or 6) (figure 8). The quality of education at their child’s school (during academic year 2015/16) was rated as very good by 10 percent of the parents, and as good by 79 percent of the parents. Compared with academic year 2014/15, the quality of education in 2015/16 was considered better or similar by 26 and 66 percent of the parents, respectively. According to Chen (2011), parents’ paradoxical satisfaction with the quality of education at their child’s school, in light of their limited interaction and involvement with the school, casts doubt on whether increasing school accountability to parents in Indonesia will be effective, given the strong sense of community and related tendency of people not to complain openly or express dissatisfaction.
Parents’ satisfaction with their child’s classroom teacher is also relatively high, with 21 percent highly satisfied and 53 percent satisfied. However, about 20 percent responded that they did not know whether they were satisfied with their child’s classroom teacher; therefore, they could not give an answer.
Figure 8. Parent Satisfaction with Education Quality and Learning Outcomes
Figure 9. School Committee Satisfaction with Education and School Quality
Compared with the aforementioned report on overall parent satisfaction with education,51 there appears to be less parent satisfaction in the sample areas when rating the learning outcomes of their children in math and Indonesian—approximately 24 percent of the parents rated the outcomes as bad, and 5 percent rated them as very bad.
Committee Satisfaction
The school committees in the study areas were relatively satisfied with educational and school quality. In particular, the school committees were highly satisfied with community and parental support to schools and the quality and behavior of teachers (figure 9). However, their satisfaction toward average student learning outcomes during 2015/16 was more mitigated—44 percent found it satisfying, and 45 percent found it unsatisfying. Nearly half of the school committees found that support from the district and subdistrict education offices was unsatisfying, and nearly three-fourths were dissatisfied about the physical condition of school facilities, mirroring the dissatisfaction of principals and teachers.
51 Chen 2011.
Very Good
Very Good
Good
Good
Bad
Bad
Very Bad
Very Bad
Do not know
Do not know
District/subdistrict education office support to school
05

47.
05 Teacher Absence
TEACHER ABSENCE
Definitions and Statistics
Definition and Measurement
This report presents measures of teacher absence from class and teacher absence from school. It reports teacher absence from class—that is, the share of classes observed without teachers. Students being left without a teacher is arguably the biggest problem facing Indonesian schools. Additionally, several other measures of teacher absence are reported, to provide a more complete picture of teacher absence in line with previous studies on this subject.52 Teacher absence from school is defined as the number of teachers who were not at school on the day of the visit. Teacher absence from teaching is defined as the number of teachers who were not in the classroom, although they were present at the school.53
Class Absence, or Classes Observed without Teachers
During unannounced visits to the sample schools, enumerators directly observed 1,705 classes, of which nearly a quarter were without a teacher. Table 45 shows that 398 classes (23 percent on average) were observed without teachers. This share varies widely across districts, from 14 percent of the classes in Sintang to 32 percent in Ketapang. However, the absent teacher physically returned to the classroom before the end of the enumerator’s observation in 327 classes (19 percent of all observed classes).
Previous studies of teacher absence in Indonesia have found relatively high rates of teacher absence, despite a slight improvement in recent years.54 For instance, Usman, Akhmadi, and Suryadarma (2004) found that almost one in five (19 percent) teachers in Indonesian public primary schools were absent from classrooms. However, Toyamah et al. (2010) subsequently found a reduced overall teacher absence rate of 14 percent. In particular, lower teacher absence was found to be directly related to more regular supervision of schools, higher salaries, and teachers’ overall sense of improved welfare. In comparison, this report demonstrates that the teacher
52 ACDP 2014.53 To allow comparisons of teacher absence rates with previous studies, all teacher absence numbers are expressed as a proportion of all teachers who were reported scheduled to be teaching during the period of observation. In the sample, based on principal reports, 1,687 teachers were reported scheduled to teach during the observation, which is close to the number of classes observed on the day of the survey.54 ACDP 2014; Chaudhury et al. 2006.
47.
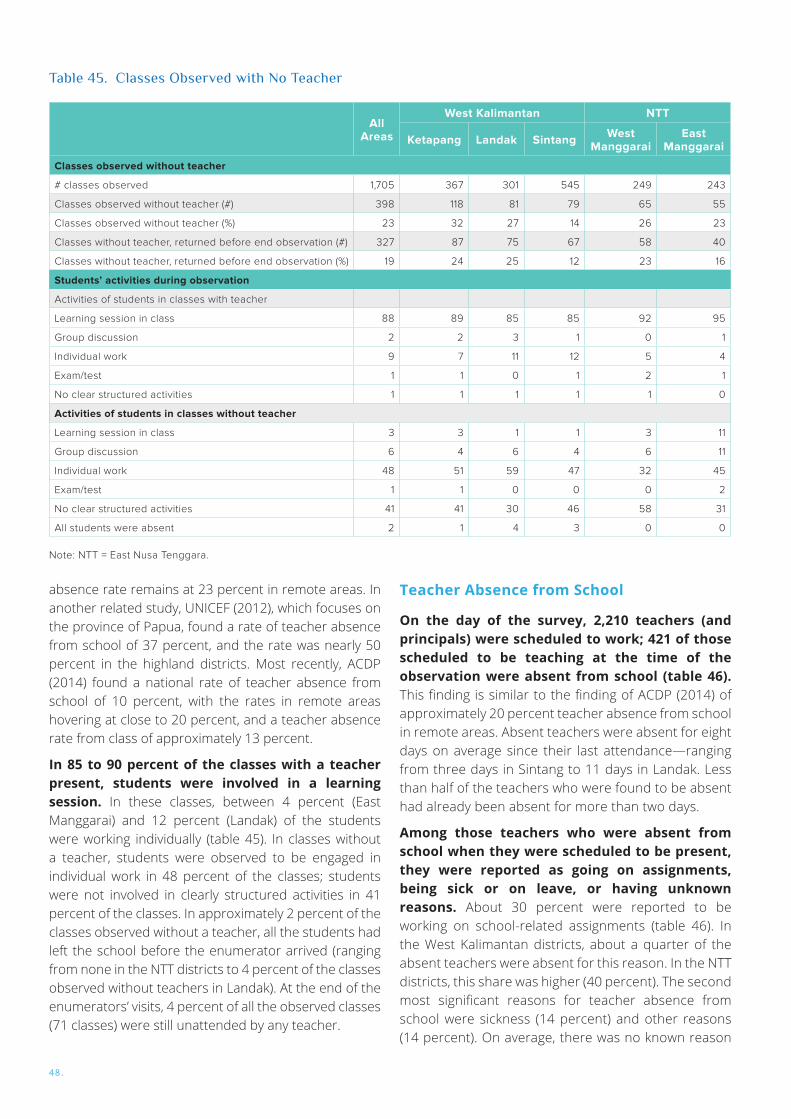
48.
All Areas
West Kalimantan NTT
Ketapang Landak Sintang West Manggarai
East Manggarai
Classes observed without teacher
# classes observed 1,705 367 301 545 249 243
Classes observed without teacher (#) 398 118 81 79 65 55
Classes observed without teacher (%) 23 32 27 14 26 23
Classes without teacher, returned before end observation (#) 327 87 75 67 58 40
Classes without teacher, returned before end observation (%) 19 24 25 12 23 16
Students’ activities during observation
Activities of students in classes with teacher
Learning session in class 88 89 85 85 92 95
Group discussion 2 2 3 1 0 1
Individual work 9 7 11 12 5 4
Exam/test 1 1 0 1 2 1
No clear structured activities 1 1 1 1 1 0
Activities of students in classes without teacher
Learning session in class 3 3 1 1 3 11
Group discussion 6 4 6 4 6 11
Individual work 48 51 59 47 32 45
Exam/test 1 1 0 0 0 2
No clear structured activities 41 41 30 46 58 31
All students were absent 2 1 4 3 0 0
absence rate remains at 23 percent in remote areas. In another related study, UNICEF (2012), which focuses on the province of Papua, found a rate of teacher absence from school of 37 percent, and the rate was nearly 50 percent in the highland districts. Most recently, ACDP (2014) found a national rate of teacher absence from school of 10 percent, with the rates in remote areas hovering at close to 20 percent, and a teacher absence rate from class of approximately 13 percent.
In 85 to 90 percent of the classes with a teacher present, students were involved in a learning session. In these classes, between 4 percent (East Manggarai) and 12 percent (Landak) of the students were working individually (table 45). In classes without a teacher, students were observed to be engaged in individual work in 48 percent of the classes; students were not involved in clearly structured activities in 41 percent of the classes. In approximately 2 percent of the classes observed without a teacher, all the students had left the school before the enumerator arrived (ranging from none in the NTT districts to 4 percent of the classes observed without teachers in Landak). At the end of the enumerators’ visits, 4 percent of all the observed classes (71 classes) were still unattended by any teacher.
Teacher Absence from School
On the day of the survey, 2,210 teachers (and principals) were scheduled to work; 421 of those scheduled to be teaching at the time of the observation were absent from school (table 46). This finding is similar to the finding of ACDP (2014) of approximately 20 percent teacher absence from school in remote areas. Absent teachers were absent for eight days on average since their last attendance—ranging from three days in Sintang to 11 days in Landak. Less than half of the teachers who were found to be absent had already been absent for more than two days.
Among those teachers who were absent from school when they were scheduled to be present, they were reported as going on assignments, being sick or on leave, or having unknown reasons. About 30 percent were reported to be working on school-related assignments (table 46). In the West Kalimantan districts, about a quarter of the absent teachers were absent for this reason. In the NTT districts, this share was higher (40 percent). The second most significant reasons for teacher absence from school were sickness (14 percent) and other reasons (14 percent). On average, there was no known reason
Table 45. Classes Observed with No Teacher
Note: NTT = East Nusa Tenggara.

49.
TEACHER ABSENCE
All Areas
West Kalimantan NTT
Ketapang Landak Sintang West Manggarai
East Manggarai
# Teachers
Total # teachers listed in schools (including principals)
2,293 508 370 700 385 330
# teachers scheduled to be present at school 2,210 466 365 677 376 326
# teachers scheduled to be teaching 1,687 364 289 537 251 246
Teacher absence from school
# teachers absent from school 421 91 105 82 77 66
Teacher absence from school (% teachers scheduled to be teaching)
25 25 36 15 31 27
Duration of teacher absence since last attendance
Mean # days of absence from school 8 8 11 3 10 8
Median # days of absence from school since last attendance
2 2 1 1 2 2
Teacher absence is justified in writing to principal (% absent teachers)
75 79 84 85 64 58
Reasons for teacher absence from school (% absent teachers)
Working on school-related assignments 30 23 26 24 42 36
Sick 14 9 12 12 18 18
Taking care of sick family member 10 15 10 12 7 5
Working on non-school-related assignments 9 14 8 5 4 12
Going to college/further education 5 5 3 11 1 2
Late arrival 5 3 3 6 12 5
Scheduled teaching hour is not yet started 3 2 5 7 0 2
Early leave 1 1 0 0 4 0
Scheduled hour is already finished 0 1 0 0 0 0
On leave 3 4 3 1 1 5
Others 14 18 17 12 9 12
Do not know 7 3 14 9 1 5
Location of absent teachers
Same village as school location 25 23 23 21 27 32
Different village within the subdistrict 14 16 18 13 14 8
Subdistrict where district capital is located 16 16 20 22 16 3
Different subdistrict within the district 27 26 16 26 32 38
Different district within the province 8 3 8 9 8 14
Other province 2 7 1 1 1 0
Other country 1 2 0 0 0 2
Do not know 7 5 14 9 1 5
Table 46. Teacher Absence from School
for teacher absence for 7 percent of the teachers, with Landak recording a survey high of 14 percent. The principal had received a written justification for three-quarters of the cases of teacher absence. In comparison, in 2003, another study found that 45 percent of absent teachers had been absent without any known reason; 36 percent had been sick or on official leave; and the remaining 19 percent had been on official duties outside the school, such as attending
meetings or participating in training sessions (Usman, Akhmadi, and Suryadarma 2004). In ACDP (2014), the main reason given for absence is official duties outside the school (26 percent). Significantly, the results show that absent teachers were mainly resident in another subdistrict other than the subdistrict where the school or district capital is located (27 percent) or in the same village as the school (25 percent).

50.
Teacher Absence from Teaching
Among the 25 percent of teachers absent from classrooms, 5 percent were replaced by other teachers who were not scheduled to teach the observed classes. In focusing on teachers who were scheduled to teach, we found on average a teacher absence rate (from teaching) of 25 percent, ranging from 16 percent in Sintang to 34 percent in West Manggarai. Only 8 percent of the teachers were found to be in school but not observed teaching—ranging from 2 percent in East Manggarai to 16 percent in West Manggarai. According to the principals’ reports, 1,687 teachers were scheduled to teach on the day of the observation. The teachers who were observed teaching, but who were not scheduled to do so, were most likely substitute teachers replacing absent teachers. To identify the number of classes that were left without (substitute) teachers, we compared the number of teachers scheduled to teach and found teaching with the number of teachers found teaching, regardless of whether they were scheduled to teach. Among those who were scheduled to teach, 75 percent were indeed observed in class teaching. However, as seen in table 47, there were 1,354 teachers observed in class teaching on the day of the survey, which amounts to 80 percent of those who were scheduled to teach. This finding implies that, among the teachers who were scheduled to teach but not observed teaching by the enumerators (25 percent), 5 percent were replaced by another teacher, and 20 percent of the (scheduled) classes remained without a teacher.
The teachers who were absent from teaching were predominantly also absent from school. Two-thirds of the teachers who were observed to be absent from teaching were reported to be involved in school-related administrative activities; the remainder were on a break or involved in non-school-related activities.
In summary, teacher absence is rather high in the study areas. The enumerators observed that approximately one in four classes was without a teacher. One-fourth of the teachers who were scheduled to be teaching during the observation were absent from school, and one-third of those teachers were reported to be absent because of school-related assignments. Approximately 25 percent of the teachers were absent from teaching, and 20 percent of the scheduled classes were without a teacher. These data contrast with the self-reported teacher and principal information on teaching, which suggests that teachers spend a lot of time on teaching and other activities.
Determinants of Teacher Absence
This subsection provides some additional insights into the teacher and school characteristics that are associated with teacher absence. It presents results from simple ordinary least squares (OLS) regressions of a dummy (equal to 1 for teachers absent from teaching) on a set of teacher and school characteristics derived from the descriptive analysis presented in the previous sections.
As explanatory variables, the analysis uses several teacher and principal characteristics. These include dummy variables for principals, female teachers/principals, PNS teachers, certified teachers, having at least a bachelor’s degree, remote area allowance receipt, additional income allowance for noncertified teachers receipt, having an extra job, high satisfaction (> 4) with their salary/honorarium, and having been evaluated by the principal in 2015/16. The last two variables are used only in the OLS regressions run using teachers as the subsample, as this information is only pertinent for teachers. The analysis also uses the number of years of seniority at the current school as a teacher characteristic.
Additional variables include school characteristics. The analysis includes dummy variables for schools with toilets for teachers, schools with electricity, and schools that reported having been visited by school supervisors during 2015/16. Additional continuous variables include school distance to the district education office and the shares of PNS teachers, teachers with a bachelor’s degree, teachers who have been in their current school for more than five years, certified teachers, teachers receiving a remote area allowance, and teachers with high satisfaction (> 4) with their salary/honorarium. We run additional regressions on schools with an active committee as a subsample, include dummies for schools where the committee chairperson was selected by vote during meetings attended by parents, and dummies for committees that reportedly held separate meetings with the principal and parents during 2015/16. All the regressions include district fixed effects to control for differences in local education policy.
Principals, PNS teachers, male teachers, and those who have worked at the school for at least five years are associated with absence from teaching. The results of the OLS regressions are presented in table 48. The regression results are merely correlations and cannot be interpreted as causal effects. For example, it is remarkable, and in line with the findings of UNICEF (2012), that the survey findings

51.
TEACHER ABSENCE
All Areas
West Kalimantan NTT
Ketapang Landak Sintang West Manggarai
East Manggarai
Teachers found in class teaching
# Teachers found in class teaching 1,354 260 219 472 198 205
Teachers found in class teaching (% teachers scheduled to be teaching)
80 71 76 88 79 83
Absence from teaching - teachers scheduled to teach
# Teachers scheduled to be teaching 1,687 364 289 537 251 246
# Teachers found in class teaching while scheduled to teach
1,258 247 200 453 166 192
Teachers found in class teaching (% teachers scheduled to be teaching)
75 68 69 84 66 78
# Teachers absent from teaching while scheduled to teach
429 117 89 84 85 54
Teachers absent from teaching (% teachers scheduled to be teaching)
25 32 31 16 34 22
# Teachers absent from school while scheduled to teach 288 66 76 53 45 48
Teachers absent from school (% teachers scheduled to be teaching)
17 18 26 10 18 20
# Teachers found in school but not in class while scheduled to teach
141 51 13 31 40 6
Teachers found in school but not in class (% teachers scheduled to be teaching)
8 14 4 6 16 2
Activities of teachers absent from teaching (% teachers absent from teaching)
School-related administrative activities 66 62 67 69 66 72
Break/non-school-related activities 34 38 33 31 34 28
show that being a principal is positively and significantly associated with absence from teaching duties, controlling for all other characteristics. Interestingly, female teachers and teachers regularly evaluated by the principal are significantly less likely to be absent from teaching duties; this finding is robust across the different specifications. Other individual characteristics are not significantly associated with absence from teaching. An exception is that teachers who have been evaluated by the principal are less likely to be absent, as seen in columns (3) and (4), which present the results (in the subsample of teachers) of regressions of teacher absence from teaching, conditional on being scheduled to teach.
Democratically elected school committee chair is correlated with better teacher presence in class. Selection of the school committee chairperson—by the vote of attendees at selection meetings,55 as opposed to being appointed by the principal or selected through consensus—is significantly negatively associated with teacher absence from teaching, conditional on being scheduled to teach. Another study in Indonesia showed that democratically elected school committee increased community awareness (Pradhan et al. 2014). It is plausible that this increased awareness affects teachers’ behavior, but this survey did not collect additional data.
Table 47. Teacher Absence from Teaching
Note:NTT = East Nusa Tenggara
55 Attendees at selection meetings may include the principal, teachers, parents, village officials, community members, and previous committee members.
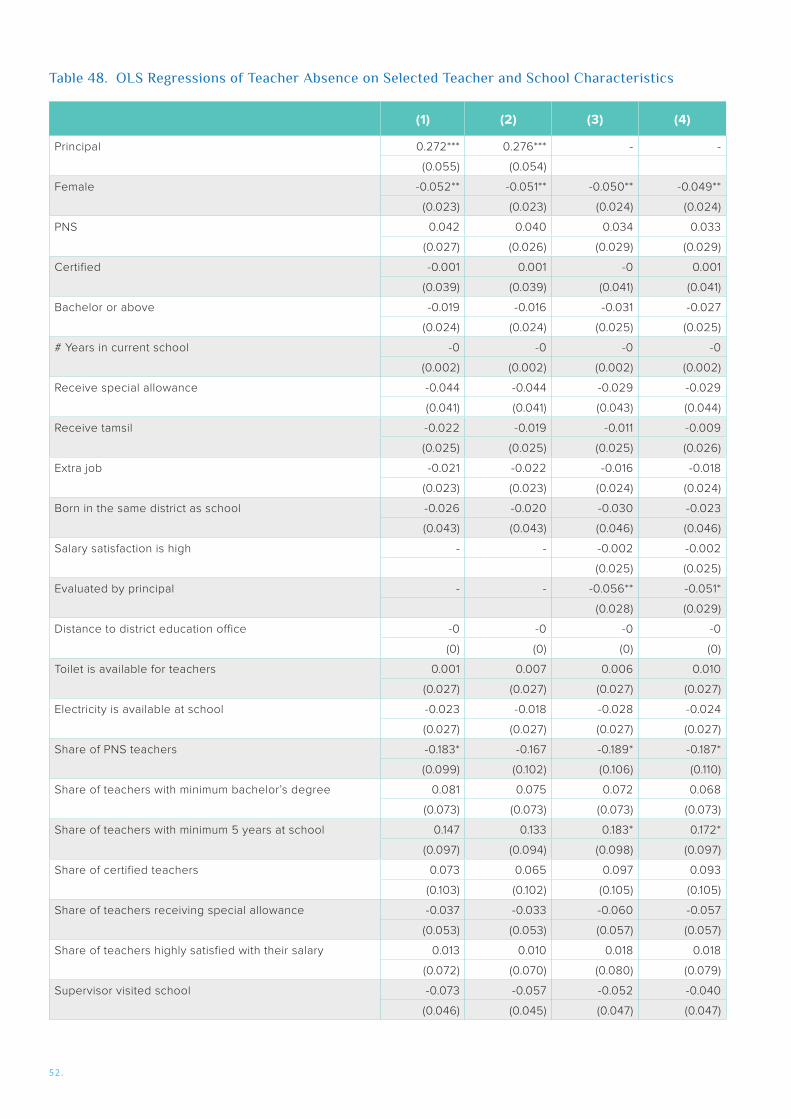
52.
(1) (2) (3) (4)
Principal 0.272*** 0.276*** - -
(0.055) (0.054)
Female -0.052** -0.051** -0.050** -0.049**
(0.023) (0.023) (0.024) (0.024)
PNS 0.042 0.040 0.034 0.033
(0.027) (0.026) (0.029) (0.029)
Certified -0.001 0.001 -0 0.001
(0.039) (0.039) (0.041) (0.041)
Bachelor or above -0.019 -0.016 -0.031 -0.027
(0.024) (0.024) (0.025) (0.025)
# Years in current school -0 -0 -0 -0
(0.002) (0.002) (0.002) (0.002)
Receive special allowance -0.044 -0.044 -0.029 -0.029
(0.041) (0.041) (0.043) (0.044)
Receive tamsil -0.022 -0.019 -0.011 -0.009
(0.025) (0.025) (0.025) (0.026)
Extra job -0.021 -0.022 -0.016 -0.018
(0.023) (0.023) (0.024) (0.024)
Born in the same district as school -0.026 -0.020 -0.030 -0.023
(0.043) (0.043) (0.046) (0.046)
Salary satisfaction is high - - -0.002 -0.002
(0.025) (0.025)
Evaluated by principal - - -0.056** -0.051*
(0.028) (0.029)
Distance to district education office -0 -0 -0 -0
(0) (0) (0) (0)
Toilet is available for teachers 0.001 0.007 0.006 0.010
(0.027) (0.027) (0.027) (0.027)
Electricity is available at school -0.023 -0.018 -0.028 -0.024
(0.027) (0.027) (0.027) (0.027)
Share of PNS teachers -0.183* -0.167 -0.189* -0.187*
(0.099) (0.102) (0.106) (0.110)
Share of teachers with minimum bachelor’s degree 0.081 0.075 0.072 0.068
(0.073) (0.073) (0.073) (0.073)
Share of teachers with minimum 5 years at school 0.147 0.133 0.183* 0.172*
(0.097) (0.094) (0.098) (0.097)
Share of certified teachers 0.073 0.065 0.097 0.093
(0.103) (0.102) (0.105) (0.105)
Share of teachers receiving special allowance -0.037 -0.033 -0.060 -0.057
(0.053) (0.053) (0.057) (0.057)
Share of teachers highly satisfied with their salary 0.013 0.010 0.018 0.018
(0.072) (0.070) (0.080) (0.079)
Supervisor visited school -0.073 -0.057 -0.052 -0.040
(0.046) (0.045) (0.047) (0.047)
Table 48. OLS Regressions of Teacher Absence on Selected Teacher and School Characteristics
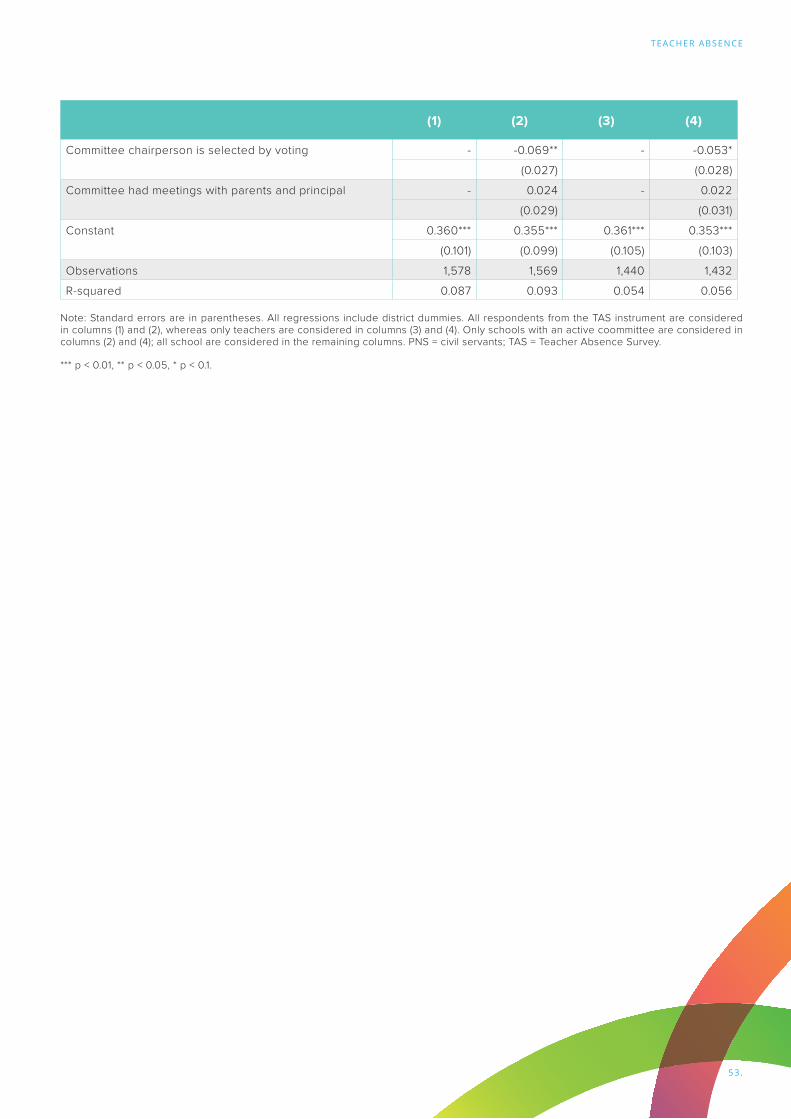
53.
TEACHER ABSENCE
(1) (2) (3) (4)
Committee chairperson is selected by voting - -0.069** - -0.053*
(0.027) (0.028)
Committee had meetings with parents and principal - 0.024 - 0.022
(0.029) (0.031)
Constant 0.360*** 0.355*** 0.361*** 0.353***
(0.101) (0.099) (0.105) (0.103)
Observations 1,578 1,569 1,440 1,432
R-squared 0.087 0.093 0.054 0.056
Note: Standard errors are in parentheses. All regressions include district dummies. All respondents from the TAS instrument are considered in columns (1) and (2), whereas only teachers are considered in columns (3) and (4). Only schools with an active coommittee are considered in columns (2) and (4); all school are considered in the remaining columns. PNS = civil servants; TAS = Teacher Absence Survey.
*** p < 0.01, ** p < 0.05, * p < 0.1.
54.
55.
Student Absence
There is a discrepancy between the official student absences and enumerators’ observations. Only 8 percent of the students were absent when the enumerator visited, according to the schools’ attendance books (table 49, in annex A). However, the number of students found in class during the observations shows a higher student absence rate of 14 percent, on average. This difference was particularly significant in Ketapang, where 9 percent of registered students were officially absent, but 24 percent of them were not present in class.
Likewise, the rate of student presence differs from the official figures and parent information, suggesting that student absence is a substantial problem that may affect teacher performance and student learning. Student absence rates decrease with each increase in grade. In the NTT districts, and East Manggarai in particular, there were fewer differences between official and observed student absence rates than in the West Kalimantan districts (table 49, in annex A). In approximately one-third of all the classes observed, all the students were present on the day of the enumerators’ visit. In grade one, full student presence ranged from 15 percent of the observed classes in West Manggarai to 34 percent in East Manggarai. This figure is rather low and again contrasts with official student attendance records and parents’ reports that their children attended nearly all scheduled school days.
There are more registered male students than female students across all grades, and male students have a slightly higher absence rate than female students. Male and female absence rates are 9 and 7 percent overall, on average (table 57, in annex A). Student absence rates decrease slightly as grades increase—for female students, from 11 percent in grade one to 5 percent in grade six, and for male students, from 12 to 7 percent.
Outcome Levels
The test results indicate whether students had mastered the grade-level competencies they were supposed to have acquired when they graduated to their current grade level. First, student test results are expressed as percentages of correct answers, ranging from zero to 100, as seen in table 50. The tests were multiple-choice, with three or four possible answers for each question. Therefore, a student who answered each question randomly has an expected score of 25 to 33 percent.
06STUDENT ABSENCE AND LEARNING OUTCOMES
Student Absence and Learning Outcomes
55.
56 Mullis et al. 2016.

56.
Table 50. Student Test Scores: Descriptive Statistics
Grade Subject All AreasWest Kalimantan NTT
Ketapang Landak Sintang West Manggarai East Manggarai
Bahasa
1
Mean 32.72 38.81 26.23 36.14 26.98 30.3
SD 22.65 22.62 20.16 25.4 18.64 18.87
Median 30.43 34.78 26.09 34.78 26.09 26.09
Min 0 0 0 0 0 0
Max 100 100 95.65 100 95.65 95.65
2
Mean 44 49.24 36.01 44.88 42.01 45.86
SD 22.59 23.18 21.28 25.45 18.85 18.11
Median 43.48 47.83 34.78 43.48 39.13 43.48
Min 0 0 0 0 0 0
Max 100 100 100 100 100 95.65
3
Mean 28.26 34.16 25.33 31.58 19.87 25.92
SD 15.84 14.17 13.89 15.31 15.61 15.91
Median 26.09 34.78 26.09 30.43 17.39 26.09
Min 0 0 0 0 0 0
Max 78.26 69.57 69.57 78.26 65.22 69.57
4
Mean 35.32 39.96 32.91 39.02 27.99 33.38
SD 14.73 12.67 12.86 13.6 15.66 15.7
Median 34.78 39.13 34.78 39.13 30.43 34.78
Min 0 4.35 0 4.35 0 0
Max 78.26 78.26 78.26 73.91 69.57 78.26
5
Mean 35.3 38.05 32.19 38.86 28.8 34.51
SD 14.24 13.19 12.53 14.05 13.59 14.86
Median 34.78 39.13 30.43 39.13 26.09 34.78
Min 0 4.35 4.35 0 0 0
Max 78.26 73.91 73.91 78.26 73.91 73.91
Math
1
Mean 33.5 44.2 26.61 39.07 22.52 26.5
SD 24.33 22.81 22.53 25.85 18.68 20.55
Median 33.33 46.67 23.33 40 16.67 23.33
Min 0 0 0 0 0 0
Max 100 100 100 100 100 96.67
2
Mean 43.31 51.65 35.62 45.93 35.95 43.03
SD 23.42 21.92 19.59 25.13 22.02 22.23
Median 36.67 50 33.33 43.33 30 36.67
Min 0 0 0 0 0 0
Max 100 100 100 100 100 100
3
Mean 30.38 36.55 27.1 33.21 22.66 28.37
SD 16.83 14.07 15.26 16.03 18.16 17.23
Median 30 36.67 26.67 33.33 20 26.67
Min 0 0 0 0 0 0
Max 73.33 70 66.67 73.33 73.33 70
4
Mean 29.72 32.62 28.23 31.53 25.76 28.82
SD 10.79 10.27 9.21 9.6 12.41 11.55
Median 30 33.33 26.67 30 26.67 30
Min 0 0 0 0 0 0
Max 70 66.67 56.67 70 60 63.33

57.
STUDENT ABSENCE AND LEARNING OUTCOMES
Note:NTT = East Nusa Tenggara; SD = standard deviation.
Table 51. Student Test Scores in Indonesian and Math, by Parent Education
Grade 1 Grade 2 Grade 3 Grade 4 Grade 5
Indonesian
Overall 33.49 44.83 28.62 34.45 32.58
Parents have no education 28.91 41.180 27.54 31.94 32.65
Parents have primary education 31.25 42.96 27.51 33.3 31.41
Parents have junior secondary education 37.5 47.88 30.78 36.96 35.35
Parents have senior secondary education 36.72 49.3 30.63 37.93 35.05
Parents have university education 50.38 56.37 36.41 42.43 39.35
Math
Overall 34.41 44.23 30.82 29.55 32.03
Parents have no education 33.15 41.74 29.96 28 32.02
Parents have primary education 32 42.52 29.94 29.1 31.43
Parents have junior secondary education 39.12 47.7 33.12 30.6 32.99
Parents have senior secondary education 37.54 48.27 32.33 30.7 33.78
Parents have university education 46.78 50.48 35.02 34.53 35.94
Grade Subject All AreasWest Kalimantan NTT
Ketapang Landak Sintang West Manggarai East Manggarai
Math
5
Mean 30.7 32.7 30.36 32.67 27.1 28.34
SD 10.63 10.36 9.31 10.38 10.62 11.17
Median 30 33.33 30 33.33 26.67 30
Min 0 0 0 3.33 0 0
Max 66.67 63.33 63.33 63.33 66.67 63.33
Overall, the students have slightly higher scores in Indonesian than in math, and female students averaged higher scores than male students. This difference is consistent with the PISA scores (OECD 2016). Overall, there is a positive correlation between parent education levels and student scores (table 51). Table 56 (in annex A), shows student test scores by grade and gender. Female students have higher average scores than male students in Indonesian and math and across all grades, which is consistent with the findings from the TIMSS56 and the Progress in International Reading Literacy Study. 57
The averages in Indonesian and math are low, with some regional patterns. In grade one, students obtained an average score of 32.7 in Indonesian, varying from 26.2 in Landak to 38.8 in Ketapang. Test scores in grade one vary from zero to 100, except in Landak, West Manggarai, and East Manggarai. Scores in grade two range from 36 in Landak to 49 in Ketapang. In
grade three, the scores in Indonesian are quite low, as low as the benchmark score of 25 percent for random guessing, varying from 20 in West Manggarai to 34 in Ketapang. From grade three onward, the maximum scores obtained are also far below 100. In grades four and five, scores range from approximately 28 in West Manggarai to nearly 40 in Ketapang, with lower standard deviations, suggesting more homogeneity in students’ ability in Indonesian in these grades compared with students in grades one and two. The scores in math display similar regional patterns of relative performance to those in Indonesian. Students in Ketapang have the highest scores across all grades, whereas students in West Manggarai and Landak have the lowest scores. The math scores in grades three to five are the lowest scores of all the grades, only marginally higher than the benchmark random guess score of 25 percent. There is also a lower standard deviation in math scores in grades four and five.
57 Mullis et al. 2012.

58.
Second, students’ results are also classified by grade-level competencies based on the 2006 curriculum standards, to present learning outcomes in a simple and meaningful way for community and local education stakeholders.58 Classifications are assigned based on students’ test scores, which are defined by the number of questions answered correctly on the test (tables 52 and 53). These classifications are applied to the Indonesian and math test results. There are four classifications of competencies: whether a child is (1) unable to recognize letters/numbers, (2) able to recognize letters/numbers but lacking basic competencies, (3) below current grade-level competencies, or (4) at or above current grade-level competencies. The classification is expected to contribute to raising stakeholders’ awareness of their children’s learning achievements as well as providing information about the general quality of teaching and learning in their school. This information should stimulate concrete actions toward improvement in student learning outcomes. Further explanation of the classifications of student competencies is provided in annex B.
The results are in stark contrast with the high proportion of parents who reported being satisfied or very satisfied with their child’s learning outcomes. Tables 52 and 53 (in annex A) show the proportion of students who acquired each of the four classifications of student competency in Indonesian and math. Confirming the findings in table 50, these tables show that student learning outcomes are low. In Indonesian, barely any students reached the competency level corresponding to the grade they currently attended, which may be partially explained by the timing of the survey. In math, between 6 and 13 percent of the students in grades one to three reached the level of the grade they currently attended. Nevertheless, in all grades for Indonesian and math, the majority of the students are two grade levels behind their current grade in their competencies, implying that these students have not yet mastered competency of the previous grade level from which they had graduated.
Most students in grade one were unable to recognize letters, and most students in grade two had no basic reading comprehension. In Indonesian, the vast majority of the students in grade one (between
36 percent in Ketapang and 57 percent in West Manggarai) are unable to recognize letters. Between 43 percent of the students in West Manggarai and 62 percent in Ketapang have a basic understanding of letters but no basic reading competency. Only 3 percent of grade one students in Sintang attained the grade one level in Indonesian. In grade two, between 2 percent of the students in East Manggarai and 8 percent in Sintang and Landak have no understanding of letters. On average, 80 percent of the students in grade two have only a basic understanding of letters and no reading competency. Approximately 11 percent of the students in grade two have reached the level of grade one in Indonesian—ranging from 5 percent of the students in West Manggarai and Landak to 17 percent in Ketapang.
Most students in grades three to five reached reading and writing competency levels that are two grades below their current grade level. By grade three, all the students reached a basic understanding of letters; however, the majority of the grade three students (between 57 percent in Ketapang and 74 percent in Landak) acquired only the grade one level in Indonesian. In West Manggarai, 20 percent of the students in grade three acquired only a basic understanding of letters and no reading ability. In Ketapang, East Manggarai, and Sintang, between one-fifth and two-fifths of the students reached the grade two level. No students in grade three in the sample schools had yet reached the grade three level in Indonesian. Similarly, the overwhelming majority of the students in grade four (between 81 percent in West Manggarai and 93 percent in Landak) reached the grade two level—they were two grades behind in their competencies. Almost one-fifth of the students in grade four in West Manggarai have no basic reading ability in Indonesian. In the sample areas, an average of 4 percent of the students in grade five (up to 9 percent of the students in West Manggarai) remain excluded from further learning due to only having a basic understanding of letters. Between 75 percent of the students in grade five in Sintang and 87 percent in Landak only reached the grade three level in Indonesian, whereas an average of 17 percent across all five districts reached the grade four level.
The math test results were similar to those for the Indonesian test: overall, the majority of the students in each grade are, on average, two grade levels behind in their ability. However, in grade one, there are more students who reached grade one competency in math compared with Indonesian, including up to 20 percent of grade one students in Ketapang and Sintang. The proportion of students who reached the level of their current grade decreased
58 This classification framework for interpreting and reporting test results has been adopted from the model applied by several citizen-led assessments, such as the Annual Status of Education Report and Uwezo (Plaut and Jamierson Eberhardt 2015). The citizen-led assessment movement, which was initiated by Pratham, is an attempt by civil society organizations to gather evidence on learning–specifically basic literacy and numeracy–and use it for two main purposes: to increase awareness of low learning outcomes and stimulate actions that are intended to address the learning gap (Plaut and Jamierson Eberhardt 2015).

59.
STUDENT ABSENCE AND LEARNING OUTCOMES
rapidly thereafter, reaching zero by grade three. A percentage of students barely learned anything across all the grades, with shares varying in different grades. The largest share of students who exhibit only a basic competency in math is in grade five. The highest competency level that grade five math students reached is the grade three level.
Determinants of Student Learning
This subsection presents the results of OLS regressions of student test scores based on a set of student, parent, and school characteristics. The student characteristics include gender, early childhood education participation, whether they live with their parents, and whether they report being helped by parents when studying at home. The parent characteristics include mother and father education levels across the entire sample. In the subsample of students whose parents were also surveyed using the parent instrument, we add dummy variables for students whose parents reported helping their child study at home and parents who reported high satisfaction the levels with student outcomes in Indonesian or math (very good or good).
The school characteristics included in the regressions are comprised of the same variables as for the teacher absence regressions and variables for teacher characteristics and district fixed effects. That is, the regressions include shares of PNS teachers, teachers with a bachelor’s degree, teachers in their current school for more than five years, certified teachers, teachers who received a remote area allowance, and teachers expressing high satisfaction (> 4) with their salary/honorarium. The regressions also include dummies for schools where the school committee chairperson was selected by vote during meetings attended by parents, and where the school committee reported holding (separate or joint) meetings with the principal and parents during 2015/16. We also include teacher absence rates (defined as teachers absent from teaching or classes observed without a teacher, depending on the specification), as well as district fixed effects in all the regressions, to control for differences in local conditions and education policy in particular.
Several of the parent characteristics are positively associated with students’ test scores, but school characteristics are not. Table 54 presents the results of OLS regressions for the Indonesian (columns (1) to (3)) and math (columns (4) to (6)) scores for the samples
of students whose parents were also surveyed using the parent instrument and students who attend schools with an active committee. Again, the regression results are merely correlations and cannot be interpreted as causal effects. Columns (1) and (4) present regressions on student characteristics for the Indonesian and math test scores, respectively. There are common correlates for Indonesian and math and correlates that are significantly associated with only one or the other. A parent’s own participation in early childhood education is a strong positive correlate of their child’s learning outcomes in Indonesian and math, as are a mother’s education level above junior secondary school and parent satisfaction with their child’s outcomes in Indonesian or math. The level of a father’s education is a strong correlate of the Indonesian scores, whereas only a father’s education above senior secondary level is statistically significantly associated with the math scores. Parents who reported that they help their child study at home is significantly and positively associated with students’ math scores, but not with their Indonesian scores. Notably, adding school characteristics (columns (2)-(3) and (5)-(6)) does not affect the correlations of the student-level variables with test scores.
Although the regressions find some positive associations between teacher characteristics and students’ test scores, teacher absence has no association. Teacher absence, whether measured as absence from teaching (conditional on being scheduled to teach)59 or as the share of classes observed without a teacher (columns (3) and (6), respectively), is not statistically significantly associated with student test scores. Positive correlations with student scores, in Indonesian and math, occur with teachers with a bachelor’s degree, the share of certified teachers in the school, and having a school committee that has met with the principal and parents in the previous academic year. Interestingly, seniority at the school level, measured by the share of teachers who have taught for more than five years at the school, is negatively correlated with test scores. There are positive correlations between several school characteristics, such as the share of teachers receiving a remote area allowance and the share who are highly satisfied with their salary.
59 Similar results are obtained when using unconditional teacher absence from teaching.

60.
Variable (1) (2) (3) (4) (5) (6)
Attended PAUD/ECED 7.348*** 7.050*** 6.882*** 7.652*** 7.491*** 7.205***
(0.939) (0.951) (0.949) (0.916) (0.926) (0.925)
Living with parents -1.944 -2.460 -2.517 -0.954 -1.573 -1.652
(2.248) (2.237) (2.237) (2.194) -2.177 (2.180)
Parents help at home -0.275 -0.360 -0.353 1.756*** 1.798*** 1.800***
(0.635) (0.633) (0.633) (0.619) (0.616) (0.617)
Mother education: SD 0.459 0.599 0.598 0.862 1.064 1.035
(1.112) (1.109) (1.109) (1.083) (1.078) (1.079)
Mother education: SMP 3.063** 2.985** 2.906** 2.682** 2.912** 2.724**
(1.309) (1.310) (1.309) (1.275) (1.273) (1.273)
Mother education: SMA or above 5.574*** 5.724*** 5.675*** 3.708*** 3.997*** 3.861***
(1.410) (1.413) (1.412) (1.374) (1.373) (1.374)
Father education: SD 2.311* 2.323* 2.315* 0.159 0.121 0.141
(1.261) (1.255) (1.255) (1.232) (1.223) (1.224)
Father education: SMP 3.628*** 3.761*** 3.738*** 0.367 0.522 0.506
(1.405) (1.401) (1.401) (1.371) (1.363) (1.365)
Father education: SMA 4.078*** 4.010*** 4.023*** 2.458* 2.487* 2.537*
(1.449) (1.445) (1.445) (1.415) (1.407) (1.409)
Satisfied with learning outcome 6.211*** 5.919*** 5.909*** 6.314*** 6.055*** 6.059***
(0.533) (0.534) (0.534) (0.519) (0.519) (0.520)
Teacher absence rate - 1.403 -0.532 - 4.109*** 0.999
(1.263) (1.169) (1.226) (1.138)
Share of PNS teachers - -3.124 -3.309 - -1.724 -1.945
(2.067) (2.070) (2.007) (2.012)
Share of teachers with minimum bachelor’s degree - 5.220*** 5.209*** - 4.652*** 4.608***
(1.008) (1.008) (0.979) (0.980)
Share of teachers with minimum 5 years at school - -4.894** -4.732** - -9.962*** -9.425***
(1.915) (1.908) (1.861) (1.857)
Share of certified teachers - 9.561*** 9.765*** - 12.25*** 12.45***
(2.095) (2.100) (2.033) (2.040)
Share of teachers receiving special allowance - -0.207 -0.348 - 1.627** 1.408*
(0.783) (0.783) (0.763) (0.763)
Share of teachers highly satisfied with their salary - 1.527 1.441 - 2.891** 2.883**
(1.312) (1.317) (1.279) (1.285)
Committee chairperson is selected by voting - 0.913 0.719 - 1.191** 0.798
(0.592) (0.580) (0.576) (0.565)
Committee had meetings with parents and principal - 2.114*** 2.148*** - 1.467** 1.557**
(0.631) (0.630) (0.612) (0.612)
Constant 26.31*** 22.96*** 23.71*** 24.31*** 21.87*** 22.94***
(2.560) (2.958) (2.967) (2.495) (2.876) (2.888)
Observations 4,998 4,963 4,963 5,011 4,975 4,975
R-squared 0.101 0.113 0.113 0.113 0.132 0.130
Table 54. OLS Regressions of Selected Student and School Characteristics on Student Test Scores
Note: Standard errors are in parentheses. All regressions include district dummies. Columns (1) to (3) report results from regressions of Indonesian scores; columns (4) to (6) report results from regressions of math scores. All regressions are run on the sample of students whose parents are also surveyed using the parent instrument and who go to schools with an active committee. In columns (2), and (4), teacher absence is the share of teachers absent from teaching conditional on being scheduled to teach. In columns (3) and (6), teacher absence is the share of classes observed without teachers. ECED = early childhood education; PAUD = Pendidikan Anak Usia Dini (early childhood education programs); PNS = civil servants; Sekolah Menengah Atas (senior high school); SD = standard deviation; SMA = SMP = Sekolah Menengah Pertama (junior high school). It is important to keep in mind that in the regression we are at partial correlations. So teacher absence is positively correlated with math scores, holding all variables constant. It is possible that this is due to some correlation between teacher absence and one or some of the other correlates included in the regression.*** p < 0.01, ** p < 0.05, * p < 0.1.

61.
This report presents the educational context of five districts located in remote Indonesia, namely, Ketapang, Landak, and Sintang in the province of West Kalimantan, as well as West Manggarai and East Manggarai in the province of NTT. The report is based on a comprehensive survey of primary schools and their personnel (principals, teachers, and committees) as well as an assessment of teacher absence, student learning outcomes, and a detailed parent survey.
On average, the study schools are located five hours away from district capitals, and 2.3 hours away from financial institutions. This long traveling time affects principals and teachers who need to travel to district capitals for administrative and logistical purposes, or to retrieve their salaries on a regular basis. Improving infrastructure – better roads, telecommunication, and electricity – is likely to contribute to improving the quality of education in remote Indonesia, since it increases the attractiveness of these areas for better qualified personnel and makes communication, money withdrawal, and supervision easier.
The study areas are characterized by high teacher absence compared with average estimates for schools across the country, but they are similar to estimates for remote schools. Enumerators observed that approximately one in four classes did not have a teacher. One in four teachers who were scheduled to be teaching during the observation was absent from school, with one-third of these teachers reported to be absent due to school-related assignments. Overall, 20 percent of the scheduled classes did not have a teacher, and approximately 25 percent of the scheduled teachers were absent from teaching. The Government of Indonesia should address this serious problem, as it directly affects whether students learn in school. In addition, various ways to improve teacher presence need to be tested, including strengthening teacher monitoring, enforcing teacher evaluation and invoking sanctions for underperforming teachers. It should be noted, however, that OLS regression results demonstrate that, all else being equal, teacher absence is not significantly correlated, or positively correlated, with student test scores. Thus, ensuring that teachers are present and involved in teaching might not automatically lead to improved learning outcomes among students.
07CONCLUSION
Conclusions
61.
The survey finds that poor infrastructure seriously hampers education service delivery.
Teacher presence is remarkably low in the five study districts, suggesting that there is a dire need and ample room for improvement.
Manggarai Barat
Manggarai Timur
Ketapang
Landak Sintang

62.
Parents and communities would benefit from participating in setting service standards alongside principals and teachers, correspondingly participating in the evaluation of teacher performance against these standards, and having clear channels for effectively voicing their concerns about the outcomes of teacher services. On the supply side, principals and teachers cited the lack of active involvement of parents in their children’s education as an important factor hindering student learning. Being held (more) accountable by parents and communities may lead principals and teachers to become more motivated to improve their performance, including on attendance.
Barely any students had reached the ability level corresponding to the grade they currently attended—the majority were two grade levels behind. In contradiction with the observed low quality of education in the study areas, principals, parents, and school committees reported high satisfaction levels with teacher performance and student learning outcomes. This is in stark contrast with the share of students who demonstrated no basic ability in Indonesian and/or math. This situation may be influenced by a limitation of the quantitative survey, which may be subject to bias due to respondents answering what they think is the “right” answer. Additional qualitative data may identify this as a potential issue.60 Nevertheless, the regression results suggest that parents’ satisfaction with their children’s learning outcomes is a strong correlate of student scores. If this is the case, then student learning outcomes may improve by providing parents, school committees, and communities with relevant and targeted information on student learning development and the service quality levels expected from teachers.
Providing additional support, monitoring, and evaluation of teachers may improve their motivations and efforts to improve their presence and service performance. However, these social pressures may not be enough to affect lasting changes in teachers’ behavior. As such, pecuniary mechanisms may provide stronger incentives, particularly for underperforming teachers. As mentioned in the introduction section, the Government of Indonesia has provided eligible teachers working in remote areas with a Tunjangan Khusus, at a substantial amount ranging from IDR 1.5 million up to one times teacher’s monthly base salary. However, recipients of Tunjangan Khusus turned out to have higher absenteeism rate compared to non-recipients (Toyamah, et al., 2010). As such, mechanisms to make Tunjangan Khusus more effective in directly incentivizing teacher presence or service performance should be tested. A 2017 World Bank survey in 100 schools in ten districts, including five districts covered in this study, indicated that principals and teachers preferred performance-based over seniority-based determinants of pay and promotion (Perez-Alvarez, et al. 2019).
60 As undertaken in Vernez, Karam, and Marshall (2012).
Another area for improvement would be the provision of more accurate information to parents and school committees on actual levels of student learning outcomes.
In addition to social accountability, performance-based payment of teacher allowance should be considered as a means to improve teacher performance.
There may be a need to reset parent and community expectations of the quality of the educational services their children receive, particularly in regards to teacher presence.
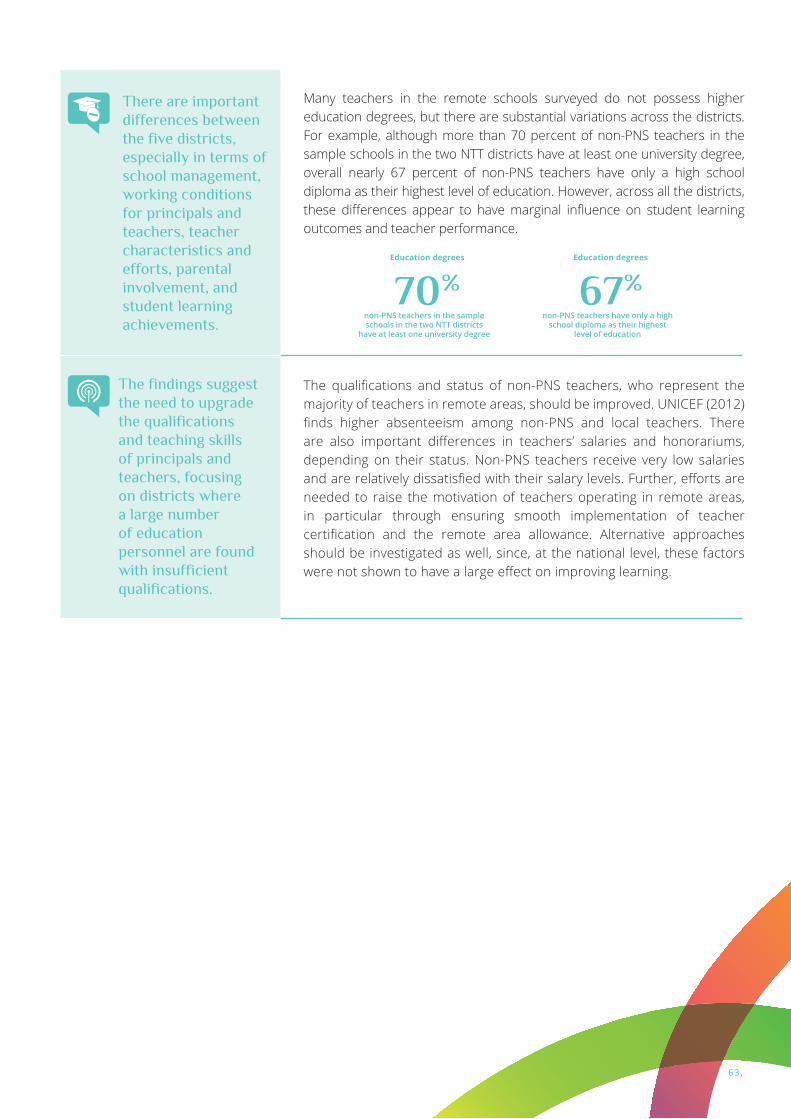
63.
Many teachers in the remote schools surveyed do not possess higher education degrees, but there are substantial variations across the districts. For example, although more than 70 percent of non-PNS teachers in the sample schools in the two NTT districts have at least one university degree, overall nearly 67 percent of non-PNS teachers have only a high school diploma as their highest level of education. However, across all the districts, these differences appear to have marginal influence on student learning outcomes and teacher performance.
The qualifications and status of non-PNS teachers, who represent the majority of teachers in remote areas, should be improved. UNICEF (2012) finds higher absenteeism among non-PNS and local teachers. There are also important differences in teachers’ salaries and honorariums, depending on their status. Non-PNS teachers receive very low salaries and are relatively dissatisfied with their salary levels. Further, efforts are needed to raise the motivation of teachers operating in remote areas, in particular through ensuring smooth implementation of teacher certification and the remote area allowance. Alternative approaches should be investigated as well, since, at the national level, these factors were not shown to have a large effect on improving learning.
There are important differences between the five districts, especially in terms of school management, working conditions for principals and teachers, teacher characteristics and efforts, parental involvement, and student learning achievements.
The findings suggest the need to upgrade the qualifications and teaching skills of principals and teachers, focusing on districts where a large number of education personnel are found with insufficient qualifications.
Education degrees Education degrees
non-PNS teachers in the sample schools in the two NTT districts
have at least one university degree
non-PNS teachers have only a high school diploma as their highest
level of education
70% 67%

64.

65.
ANNEX A . TABLES
Annex A. Tables
All Areas
West Kalimantan NTT
Ketapang Landak Sintang West Manggarai
East Manggarai
Subdistrict office
Distance (km) 28.4 28.3 24.3 37.8 14.4 19.8
Travel time (hours0 1.3 1.1 1.0 1.6 1.5 1.4
District government office
Distance (km) 149.1 268.3 102.6 129.2 94.3 78.3
Travel time (hours0 4.8 6.8 3.2 4.6 4.8 3.5
Nearest district government office
Distance (km) 139.7 200.5 103.6 166.3 71.6 76.4
Travel time (hours0 4.9 5.6 3.5 5.9 3.8 3.5
Post office Distance (km) 53.8 45.4 48.9 71.7 34.3 46.2
Travel time (hours0 2.3 1.5 1.9 2.9 2.3 2.4
Bank Distance (km) 53.4 44.0 47.4 80.3 28.5 26.9
Travel time (hours0 2.2 1.4 1.8 3.2 1.9 1.4
ATM Distance (km) 56.8 54.1 47.2 76.4 32.7 42.6
Travel time (hours0 2.3 1.7 1.8 3.0 2.2 2.1
Cooperative Distance (km) 42.1 36.9 40.6 62.9 16.9 22.2
Travel time (hours0 1.6 1.2 1.7 2.3 1.4 1.1
Credit union Distance (km) 26.8 20.2 22.8 18.6 39.1 70.0
Travel time (hours0 1.2 0.6 1.2 0.9 3.7 3.1
Note: ATM = automated teller machine; km = kilometers; NTT = East Nusa Tenggara.
Table 6. Distance and Travel Time from the Village Hall to Administrative and Financial Institutions
Grade Gender All Areas
West Kalimantan NTT
Ketapang Landak Sintang West Manggarai
East Manggarai
1
All 23 23 19 23 24 26
Male 12 13 10 13 13 14
Female 11 11 9 11 11 12
2
All 21 21 18 20 24 27
Male 11 11 10 11 13 14
Female 10 10 8 9 11 13
3
All 22 21 17 22 26 26
Male 12 11 9 12 13 14
Female 10 10 8 10 13 11
4
All 22 20 20 22 28 27
Male 12 10 11 11 15 15
Female 11 10 9 11 13 12
5
All 22 20 18 23 26 27
Male 12 10 10 12 14 15
Female 11 10 8 11 12 13
6
All 22 19 20 21 26 25
Male 11 9 10 10 13 12
Female 11 10 10 11 13 13
Table 10. Gender Distribution of Students, by Grade
Note: NTT = East Nusa Tenggara.

66.
All Areas
West Kalimantan NTT
Ketapang Landak Sintang West Manggarai
East Manggarai
Buildings
Principal room 48 51 47 63 26 32
Teachers’ room 87 86 96 97 87 50
Sports equipment/field 99 100 96 99 100 100
Additional physical facilities
Toilets 91 90 96 97 79 85
Toilets - only for teachers 64 66 80 65 50 50
Toilets - only for female students 50 56 61 53 32 35
Toilets - only for male students 41 51 59 40 29 15
Clean water 54 66 59 52 42 41
Electricty during school hours 30 36 18 40 24 24
Mobile phone signal 45 44 27 28 68 91
Teaching supporting facilities
Library 54 58 43 48 47 91
Textbooks in sufficient number 39 37 35 42 39 41
All Areas
West Kalimantan NTT
Ketapang Landak Sintang West Manggarai
East Manggarai
Main teaching language - principal report (% schools)
Indonesian 86 92 94 92 63 74
Malay 1 5 0 1 0 0
Dayak 4 3 6 7 0 0
Manggarai 9 0 0 0 37 26
Curriculum used in 2015/16 - principal report (% schools)
2013 curriculum 1 2 0 1 0 0
2006 curriculum (education unit level) 2 5 2 2 0 0
2004 curriculum (competence based) 99 100 98 100 95 100
Curriculum used in 2015/16 - teacher report (% teachers)
2013 curriculum 1 1 1 1 0 0
2006 curriculum (education unit level) 94 94 93 95 93 94
2004 curriculum (competence based) 8 8 9 7 11 6
Subjects taught (% teachers)
Teachers teaching 1 subject 14 13 12 11 21 17
Teachers teaching 2-3 subjects 12 6 6 7 23 22
Teachers teaching 4 subjects or more 74 81 82 83 56 61
Note: NTT = East Nusa Tenggara.
Note: NTT = East Nusa Tenggara.
Table 14. Instructional Language, Curriculum, and Teaching Load, Academic Year 2015/16
Table 11. Availability of Key School Facilities (Percentage of Sample Schools)

67.
ANNEX A . TABLES
All Areas
West Kalimantan NTT
Ketapang Landak Sintang West Manggarai
East Manggarai
Effective teaching days
Effective teaching days 226.38 235.37 228.18 206.56 240.24 243.970
Interruption in teaching (% schools) 25 34 31 34 3 0
Weekly teaching hours (average #)
Grade 1 26 26 26 25 27 28
Grade 2 26 27 26 26 27 29
Grade 3 29 29 28 28 31 32
Grade 4 31 32 30 30 32 33
Grade 5 31 32 31 30 32 33
Grade 6 31 33 31 30 32 33
Note: NTT = East Nusa Tenggara.
Table 15. Instructional Time, Academic Year 2015/16
All Areas
West Kalimantan NTT
Ketapang Landak Sintang West Manggarai
East Manggarai
Overall
Distance from house to school (km) 0.5 1 6 0.200 0.280 0.320
Travel time from house to school (minutes) 5 10 20 5 8.5 5
Transportation cost from house to school (Rp) 0 1,500 3,000 0 0 0
Principals living in same village as school
Distance from house to school (km) 0.150 0.230 0.5 1 1 0.150
Travel time from house to school (minutes) 5 5 5 3 3 5
Transportation cost from house to school (Rp) 0 1,000 0 0 0 0
Others
Distance from house to school (km) 8 11 12 7 3 3.5
Travel time from house to school (minutes) 30 30 40 30 29 30
Transportation cost from house to school (Rp) 8,000 7,500 10,000 5,000 6,000 10,000
Table 22. Principals’ Living Conditions: Median Distance, Travel Time, and Transportation Cost from Home to School
Note: km = Kilometer; NTT = East Nusa Tenggara.

68.
All Areas
West Kalimantan NTT
Ketapang Landak Sintang West Manggarai East Manggarai
Overall
Distance from house to school (km) 0.300 0.400 0.5 0.200 0.160 0.5
Travel time from house to school (minutes) 5 5 10 5 6.5 10
Transportation cost from house to school (Rp) 0 900 0 0 0 0
Teachers living in same village as school
Distance from house to school (km) 0.200 0.300 0.200 0.200 1 0.300
Travel time from house to school (minutes) 5 5 5 5 5 10
Transportation cost from house to school (Rp) 0 0 0 0 0 0
Others
Distance from house to school (km) 5 7 15 4 3 3
Travel time from house to school (minutes) 30 20 45 30 30 30
Transportation cost from house to school (Rp) 4500 4500 8000 4500 0 3650
All AreasWest Kalimantan NTT
Ketapang Landak Sintang West Manggarai
East Manggarai
Total allowance
# principals receiving it 252 57 44 83 38 30
% principals receiving it 97 100 92 100 100 91
Monthly median (Rp) 3,575,525 3,058,575 4,064,868 4,605,900 3,125,000 2,766,113
Professional allowance (TP), past 12 months
# principals receiving it 182 46 32 53 29 22
% principals receiving it 70 81 67 64 76 67
Monthly median (Rp) 3,257,880 3,079,287 3,706,908 3,602,400 1,850,967 2,920,000
Special allowance (TK), past 12 months
# principals receiving it 92 8 10 60 12 2
% principals receiving it 36 14 21 72 32 6
Monthly median (Rp) 2,678,825 90,625 2,707,200 2,834,425 2,609,500 156,250
Additional income allowance (Tamsil), past 12 months
# principals receiving it 110 35 11 43 15 6
% principals receiving it 42 61 23 52 39 18
Monthly median (Rp) 408,333 350,000 100,000 775,000 833,333 350,833
Table 23. Teachers’ Living Conditions: Median Distance, Travel Time, and Transportation Cost from Home to School
Note: km = Kilometer; NTT = East Nusa Tenggara.
Table 30. Principals’ Allowance
Note:NTT = East Nusa Tenggara; TK = Tunjangan Khusus (special allowance); TP = Tunjangan Profesi (professional allowance).

69.
ANNEX A . TABLES
All AreasWest Kalimantan NTT
Ketapang Landak Sintang West Manggarai
East Manggarai
PNS teachers
# teachers receiving total allowance 631 130 96 221 114 70
% teachers receiving it 84 93 72 92 83 67
Median monthly total allowance (Rp) 1,333,333 1,227,083 952,099 2,694,500 1,299,533 433,333
# teachers receiving professional allowance (TP) 244 47 41 89 44 23
% teachers receiving it 32 34 31 37 32 22
Median monthly professional allowance (Rp) 2,898,700 2,800,000 3,333,333 3,133,333 1,782,458 2,023,711
# teachers receiving special allowance (TK) 144 18 13 80 27 6
% teachers receiving it 19 13 10 33 20 6
Median monthly special allowance (Rp) 2,144,583 100,000 2,549,342 2,733,333 1,000,000 736,250
# teachers receiving additional allowance (Tamsil) 265 65 16 87 62 35
% teachers receiving it 0.350 0.460 0.120 0.360 0.450 0.330
Median monthly additional income allowance (Rp) 400,000 380,000 100,000 747,500 683,333 62,500
Non-PNS teachers
# teachers receiving total allowance 519 186 37 100 136 60
% teachers receiving it 45 66 22 29 70 34
Median monthly total allowance (Rp) 200,000 300,000 37,500 221,667 164,167 329,167
# teachers receiving professional allowance (TP) 5 2 0 1 2 0
% teachers receiving it 0 1 0 0 1 0
Median monthly professional allowance (Rp) 1,375,000 1,437,500 - 1,500,000 955,833 -
# teachers receiving special allowance (TK) 81 21 3 29 20 8
% teachers receiving it 7 8 2 8 10 5
Median monthly special allowance (Rp) 1,057,500 1,050,000 416,667 1,375,000 1,025,000 708,333
# teachers receiving additional allowance (Tamsil) 130 70 0 12 25 23
% teachers receiving it 11 25 0 3 13 13
Median monthly additional income allowance (Rp) 366,667 366,667 - 500,000 100,000 1,080,000
Note:NTT = East Nusa Tenggara; PNS = civil servants; TK = Tunjangan Khusus (special allowance); TP = Tunjangan Profesi (professional allowance).
Table 31. Teachers’ Allowance
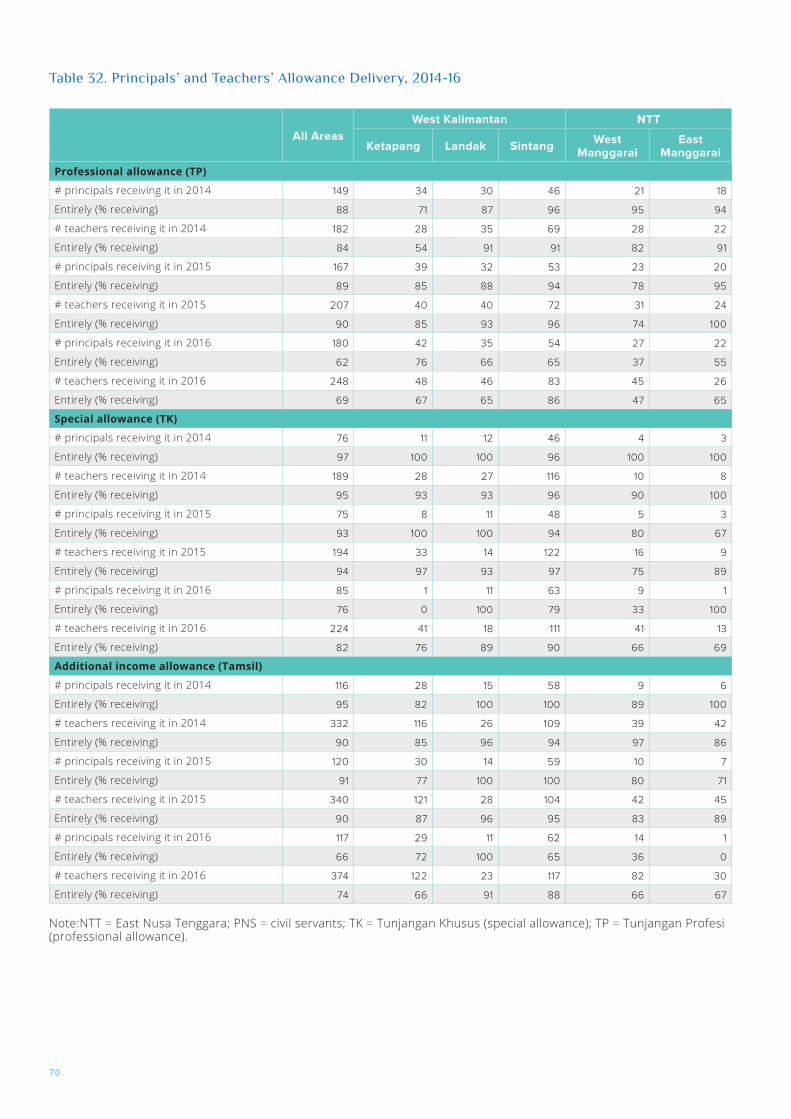
70.
All AreasWest Kalimantan NTT
Ketapang Landak Sintang West Manggarai
East Manggarai
Professional allowance (TP)
# principals receiving it in 2014 149 34 30 46 21 18
Entirely (% receiving) 88 71 87 96 95 94
# teachers receiving it in 2014 182 28 35 69 28 22
Entirely (% receiving) 84 54 91 91 82 91
# principals receiving it in 2015 167 39 32 53 23 20
Entirely (% receiving) 89 85 88 94 78 95
# teachers receiving it in 2015 207 40 40 72 31 24
Entirely (% receiving) 90 85 93 96 74 100
# principals receiving it in 2016 180 42 35 54 27 22
Entirely (% receiving) 62 76 66 65 37 55
# teachers receiving it in 2016 248 48 46 83 45 26
Entirely (% receiving) 69 67 65 86 47 65
Special allowance (TK)
# principals receiving it in 2014 76 11 12 46 4 3
Entirely (% receiving) 97 100 100 96 100 100
# teachers receiving it in 2014 189 28 27 116 10 8
Entirely (% receiving) 95 93 93 96 90 100
# principals receiving it in 2015 75 8 11 48 5 3
Entirely (% receiving) 93 100 100 94 80 67
# teachers receiving it in 2015 194 33 14 122 16 9
Entirely (% receiving) 94 97 93 97 75 89
# principals receiving it in 2016 85 1 11 63 9 1
Entirely (% receiving) 76 0 100 79 33 100
# teachers receiving it in 2016 224 41 18 111 41 13
Entirely (% receiving) 82 76 89 90 66 69
Additional income allowance (Tamsil)
# principals receiving it in 2014 116 28 15 58 9 6
Entirely (% receiving) 95 82 100 100 89 100
# teachers receiving it in 2014 332 116 26 109 39 42
Entirely (% receiving) 90 85 96 94 97 86
# principals receiving it in 2015 120 30 14 59 10 7
Entirely (% receiving) 91 77 100 100 80 71
# teachers receiving it in 2015 340 121 28 104 42 45
Entirely (% receiving) 90 87 96 95 83 89
# principals receiving it in 2016 117 29 11 62 14 1
Entirely (% receiving) 66 72 100 65 36 0
# teachers receiving it in 2016 374 122 23 117 82 30
Entirely (% receiving) 74 66 91 88 66 67
Note:NTT = East Nusa Tenggara; PNS = civil servants; TK = Tunjangan Khusus (special allowance); TP = Tunjangan Profesi (professional allowance).
Table 32. Principals’ and Teachers’ Allowance Delivery, 2014-16
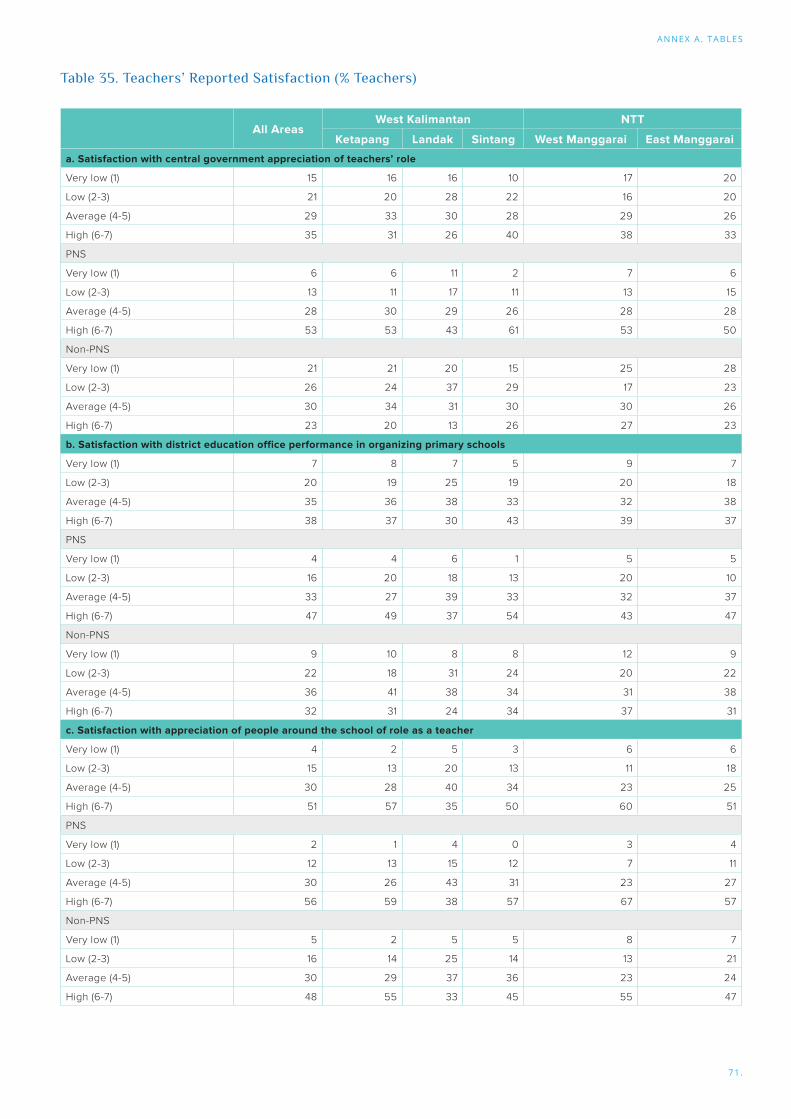
71.
ANNEX A . TABLES
All AreasWest Kalimantan NTT
Ketapang Landak Sintang West Manggarai East Manggarai
a. Satisfaction with central government appreciation of teachers’ role
Very low (1) 15 16 16 10 17 20
Low (2-3) 21 20 28 22 16 20
Average (4-5) 29 33 30 28 29 26
High (6-7) 35 31 26 40 38 33
PNS
Very low (1) 6 6 11 2 7 6
Low (2-3) 13 11 17 11 13 15
Average (4-5) 28 30 29 26 28 28
High (6-7) 53 53 43 61 53 50
Non-PNS
Very low (1) 21 21 20 15 25 28
Low (2-3) 26 24 37 29 17 23
Average (4-5) 30 34 31 30 30 26
High (6-7) 23 20 13 26 27 23
b. Satisfaction with district education office performance in organizing primary schools
Very low (1) 7 8 7 5 9 7
Low (2-3) 20 19 25 19 20 18
Average (4-5) 35 36 38 33 32 38
High (6-7) 38 37 30 43 39 37
PNS
Very low (1) 4 4 6 1 5 5
Low (2-3) 16 20 18 13 20 10
Average (4-5) 33 27 39 33 32 37
High (6-7) 47 49 37 54 43 47
Non-PNS
Very low (1) 9 10 8 8 12 9
Low (2-3) 22 18 31 24 20 22
Average (4-5) 36 41 38 34 31 38
High (6-7) 32 31 24 34 37 31
c. Satisfaction with appreciation of people around the school of role as a teacher
Very low (1) 4 2 5 3 6 6
Low (2-3) 15 13 20 13 11 18
Average (4-5) 30 28 40 34 23 25
High (6-7) 51 57 35 50 60 51
PNS
Very low (1) 2 1 4 0 3 4
Low (2-3) 12 13 15 12 7 11
Average (4-5) 30 26 43 31 23 27
High (6-7) 56 59 38 57 67 57
Non-PNS
Very low (1) 5 2 5 5 8 7
Low (2-3) 16 14 25 14 13 21
Average (4-5) 30 29 37 36 23 24
High (6-7) 48 55 33 45 55 47
Table 35. Teachers’ Reported Satisfaction (% Teachers)

72.
All AreasWest Kalimantan NTT
Ketapang Landak Sintang West Manggarai East Manggarai
d. Satisfaction with performance of government and people in the village in helping organizing school
Very low (1) 6 6 5 4 11 8
Low (2-3) 22 25 29 17 23 21
Average (4-5) 36 35 40 38 32 34
High (6-7) 36 35 26 42 33 37
PNS
Very low (1) 4 4 4 1 9 5
Low (2-3) 19 18 27 14 23 16
Average (4-5) 37 32 39 38 34 39
High (6-7) 40 46 30 47 34 39
Non-PNS
Very low (1) 8 7 5 6 13 10
Low (2-3) 24 28 31 19 24 23
Average (4-5) 35 36 41 38 30 31
High (6-7) 33 30 23 38 33 35
Note:NTT = East Nusa Tenggara; PNS = civil servants.

73.
ANNEX A . TABLES
All AreasWest Kalimantan NTT
Ketapang Landak Sintang West Manggarai
East Manggarai
Satisfaction with salary/honorarium received as teacher in current school
Very low (1) 13 11 14 11 14 20
Low (2-3) 26 26 35 23 24 25
Average (4-5) 27 27 27 28 24 31
High (6-7) 33 36 24 37 38 24
PNS
Very low (1) 3 5 3 0 4 6
Low (2-3) 15 16 27 11 16 8
Average (4-5) 28 27 32 26 23 38
High (6-7) 53 52 38 62 57 48
Non PNS
Very low (1) 20 14 23 19 21 28
Low (2-3) 33 31 41 32 29 35
Average (4-5) 27 27 22 29 25 27
High (6-7) 20 28 13 20 25 10
Ideal salary/honorarium
Much Lower 1 1 1 1 0 2
Lower 2 1 2 1 2 4
Equal to current salary 19 15 15 21 27 18
Higher 66 70 77 68 54 58
Much higher 12 14 5 9 17 19
PNS
Much Lower 0 0 0 0 1 1
Lower 2 0 2 2 1 4
Equal to current salary 25 16 24 28 33 23
Higher 63 71 68 65 55 55
Much higher 9 13 6 5 10 17
Non PNS
Much Lower 1 1 1 1 0 3
Lower 2 1 3 1 2 3
Equal to current salary 16 14 8 17 23 14
Higher 67 69 83 70 54 60
Much higher 14 15 4 12 21 20
Table 36. Teachers’ Reported Satisfaction with Their Salary (Percentage of Teachers)
Note:NTT = East Nusa Tenggara; PNS = civil servants.

74.
All AreasWest Kalimantan NTT
Ketapang Landak Sintang West Manggarai
East Manggarai
# Schools having an active committee 254 56 48 82 35 33
# Schools having an inactive committee 14 2 2 6 3 1
(Active) school committee characteristics (% active committees)
Current committee establishment
2016-17 20 22 19 27 6 10
2010-15 63 69 55 65 52 69
2005-09 14 5 23 6 32 17
Before 2005 4 4 2 3 10 3
Committee only manages this school 93 95 88 95 97 91
Committee has article of association/bylaws 15 16 13 17 6 18
Committee received funds for activities from school in 2015/2016
12 13 7 20 6 7
Median funds received from school (Rp) 326,000 300,000 200,000 301,000 2,300,000 300,000
School provides office space for committee 2 4 2 1 0 3
Table 41. School Committee Background
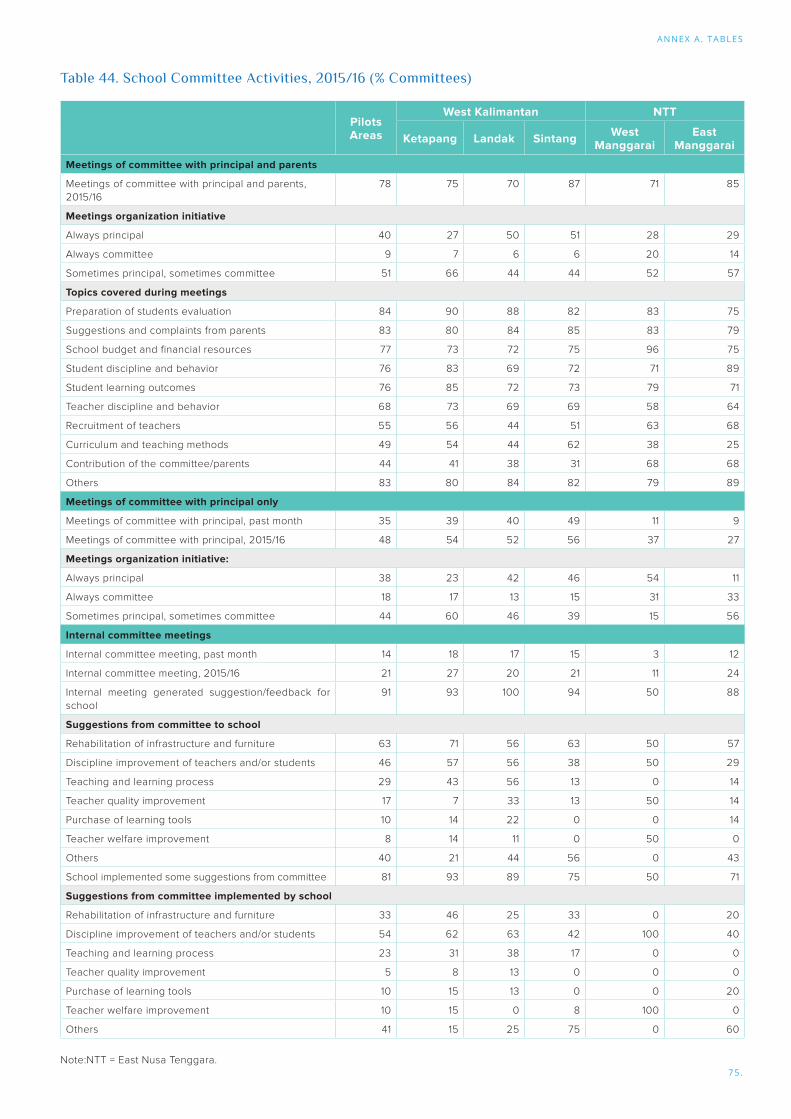
75.
ANNEX A . TABLES
Note:NTT = East Nusa Tenggara.
Pilots Areas
West Kalimantan NTT
Ketapang Landak Sintang West Manggarai
East Manggarai
Meetings of committee with principal and parents
Meetings of committee with principal and parents, 2015/16
78 75 70 87 71 85
Meetings organization initiative
Always principal 40 27 50 51 28 29
Always committee 9 7 6 6 20 14
Sometimes principal, sometimes committee 51 66 44 44 52 57
Topics covered during meetings
Preparation of students evaluation 84 90 88 82 83 75
Suggestions and complaints from parents 83 80 84 85 83 79
School budget and financial resources 77 73 72 75 96 75
Student discipline and behavior 76 83 69 72 71 89
Student learning outcomes 76 85 72 73 79 71
Teacher discipline and behavior 68 73 69 69 58 64
Recruitment of teachers 55 56 44 51 63 68
Curriculum and teaching methods 49 54 44 62 38 25
Contribution of the committee/parents 44 41 38 31 68 68
Others 83 80 84 82 79 89
Meetings of committee with principal only
Meetings of committee with principal, past month 35 39 40 49 11 9
Meetings of committee with principal, 2015/16 48 54 52 56 37 27
Meetings organization initiative:
Always principal 38 23 42 46 54 11
Always committee 18 17 13 15 31 33
Sometimes principal, sometimes committee 44 60 46 39 15 56
Internal committee meetings
Internal committee meeting, past month 14 18 17 15 3 12
Internal committee meeting, 2015/16 21 27 20 21 11 24
Internal meeting generated suggestion/feedback for school
91 93 100 94 50 88
Suggestions from committee to school
Rehabilitation of infrastructure and furniture 63 71 56 63 50 57
Discipline improvement of teachers and/or students 46 57 56 38 50 29
Teaching and learning process 29 43 56 13 0 14
Teacher quality improvement 17 7 33 13 50 14
Purchase of learning tools 10 14 22 0 0 14
Teacher welfare improvement 8 14 11 0 50 0
Others 40 21 44 56 0 43
School implemented some suggestions from committee 81 93 89 75 50 71
Suggestions from committee implemented by school
Rehabilitation of infrastructure and furniture 33 46 25 33 0 20
Discipline improvement of teachers and/or students 54 62 63 42 100 40
Teaching and learning process 23 31 38 17 0 0
Teacher quality improvement 5 8 13 0 0 0
Purchase of learning tools 10 15 13 0 0 20
Teacher welfare improvement 10 15 0 8 100 0
Others 41 15 25 75 0 60
Table 44. School Committee Activities, 2015/16 (% Committees)
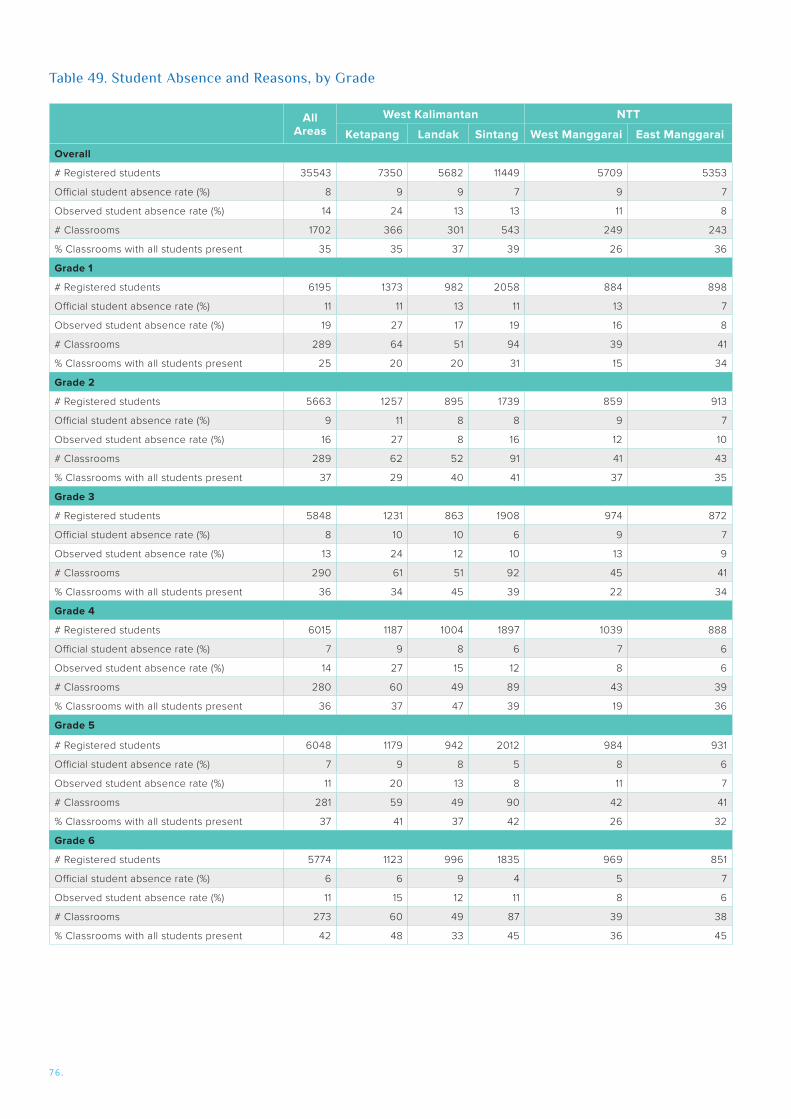
76.
All Areas
West Kalimantan NTT
Ketapang Landak Sintang West Manggarai East Manggarai
Overall
# Registered students 35543 7350 5682 11449 5709 5353
Official student absence rate (%) 8 9 9 7 9 7
Observed student absence rate (%) 14 24 13 13 11 8
# Classrooms 1702 366 301 543 249 243
% Classrooms with all students present 35 35 37 39 26 36
Grade 1
# Registered students 6195 1373 982 2058 884 898
Official student absence rate (%) 11 11 13 11 13 7
Observed student absence rate (%) 19 27 17 19 16 8
# Classrooms 289 64 51 94 39 41
% Classrooms with all students present 25 20 20 31 15 34
Grade 2
# Registered students 5663 1257 895 1739 859 913
Official student absence rate (%) 9 11 8 8 9 7
Observed student absence rate (%) 16 27 8 16 12 10
# Classrooms 289 62 52 91 41 43
% Classrooms with all students present 37 29 40 41 37 35
Grade 3
# Registered students 5848 1231 863 1908 974 872
Official student absence rate (%) 8 10 10 6 9 7
Observed student absence rate (%) 13 24 12 10 13 9
# Classrooms 290 61 51 92 45 41
% Classrooms with all students present 36 34 45 39 22 34
Grade 4
# Registered students 6015 1187 1004 1897 1039 888
Official student absence rate (%) 7 9 8 6 7 6
Observed student absence rate (%) 14 27 15 12 8 6
# Classrooms 280 60 49 89 43 39
% Classrooms with all students present 36 37 47 39 19 36
Grade 5
# Registered students 6048 1179 942 2012 984 931
Official student absence rate (%) 7 9 8 5 8 6
Observed student absence rate (%) 11 20 13 8 11 7
# Classrooms 281 59 49 90 42 41
% Classrooms with all students present 37 41 37 42 26 32
Grade 6
# Registered students 5774 1123 996 1835 969 851
Official student absence rate (%) 6 6 9 4 5 7
Observed student absence rate (%) 11 15 12 11 8 6
# Classrooms 273 60 49 87 39 38
% Classrooms with all students present 42 48 33 45 36 45
Table 49. Student Absence and Reasons, by Grade

77.
ANNEX A . TABLES
All Areas
West Kalimantan NTT
Ketapang Landak Sintang West Manggarai
East Manggarai
Grade 1 (% students)
BMH - no understanding of letters 47 36 56 43 57 51
BMKD - understand letters but no basic competency 51 62 44 55 43 49
KD1 - grade 1 level 1 2 1 3 0 0
Grade 2 (% students)
BMH - no understanding of letters 6 5 8 8 5 2
BMKD - understand letters but no basic competency 80 74 85 73 90 88
KD1 - grade 1 level 11 17 5 14 5 9
KD2 - grade 2 level 3 5 2 4 1 1
Grade 3 (% students)
BMKD - understand letters but no basic competency 7 2 6 3 20 8
KD1 - grade 1 level 64 57 74 63 65 66
KD2 - grade 2 level 29 41 20 34 15 26
KD3 - grade 3 level 0 0 0 0 0 0
Grade 4 (% students)
BMKD - understand letters but no basic competency 6 1 4 1 17 9
KD2 - grade 2 level 89 91 93 91 81 86
KD3 - grade 3 level 6 8 3 8 3 4
KD4 - grade 4 level 0 0 0 0 0 0
Grade 5 (% students)
BMKD - understand letters but no basic competency 4 1 3 1 9 6
KD3 - grade 3 level 80 79 87 75 85 79
KD4 - grade 4 level 17 20 10 23 6 16
KD4 - grade 5 level 0 0 0 0 0 0
Table 52. Classification of Student Competency in Indonesian
Note:NTT = East Nusa Tenggara.
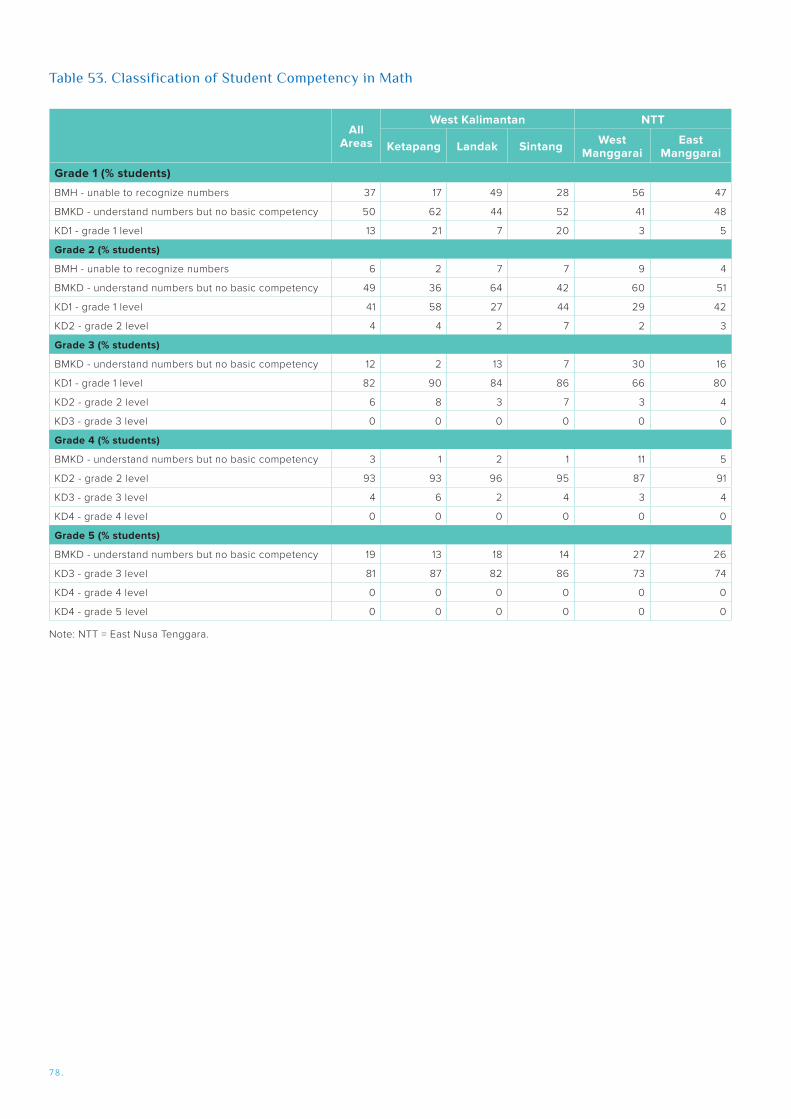
78.
All Areas
West Kalimantan NTT
Ketapang Landak Sintang West Manggarai
East Manggarai
Grade 1 (% students)
BMH - unable to recognize numbers 37 17 49 28 56 47
BMKD - understand numbers but no basic competency 50 62 44 52 41 48
KD1 - grade 1 level 13 21 7 20 3 5
Grade 2 (% students)
BMH - unable to recognize numbers 6 2 7 7 9 4
BMKD - understand numbers but no basic competency 49 36 64 42 60 51
KD1 - grade 1 level 41 58 27 44 29 42
KD2 - grade 2 level 4 4 2 7 2 3
Grade 3 (% students)
BMKD - understand numbers but no basic competency 12 2 13 7 30 16
KD1 - grade 1 level 82 90 84 86 66 80
KD2 - grade 2 level 6 8 3 7 3 4
KD3 - grade 3 level 0 0 0 0 0 0
Grade 4 (% students)
BMKD - understand numbers but no basic competency 3 1 2 1 11 5
KD2 - grade 2 level 93 93 96 95 87 91
KD3 - grade 3 level 4 6 2 4 3 4
KD4 - grade 4 level 0 0 0 0 0 0
Grade 5 (% students)
BMKD - understand numbers but no basic competency 19 13 18 14 27 26
KD3 - grade 3 level 81 87 82 86 73 74
KD4 - grade 4 level 0 0 0 0 0 0
KD4 - grade 5 level 0 0 0 0 0 0
Table 53. Classification of Student Competency in Math
Note: NTT = East Nusa Tenggara.

79.
ANNEX A . TABLES
Subdistrict # Villages # PS # Villages w/ 1 PS
# Villages w/ 2 PS # Public PS # Private
PS
All areas 0 235 270 184 51 248 22
Ketapang 0 59 59 59 0 58 1
Jelai Hulu 8 8 8 0 8 0
Kendawangan 9 9 9 0 9 0
Manis Mata 8 8 8 0 8 0
Marau 4 4 4 0 4 0
Sandai 6 6 6 0 6 0
Simpang Dua 4 4 4 0 4 0
Simpang Hulu 10 10 10 0 10 0
Sungai Laur 10 10 10 0 9 1
Landak 38 51 25 13 51 0
Air Besar 12 17 7 5 17 0
Jelimpo 5 7 3 2 7 0
Mempawah Hulu 7 10 4 3 10 0
Menjalin 3 4 2 1 4 0
Menyuke 4 4 4 0 4 0
Ngabang 3 4 2 1 4 0
Sebangki 4 5 3 1 5 0
Sintang 82 88 63 19 87 1
Kayan Hilir 17 17 12 5 17 0
Kayan Hulu 13 13 12 1 13 0
Ketungau Hilir 5 5 5 0 5 0
Ketungau Hulu 16 16 12 4 16 0
Ketungau Tengah 11 13 8 3 13 0
Sepauk 12 13 9 3 12 1
Tempunak 8 11 5 3 11 0
M. Barat 27 38 15 12 29 9
Boleng 4 6 2 2 5 1
Komodo 2 4 0 2 4 0
Kuwus 5 7 3 2 3 4
Macang Pacar 5 6 4 1 5 1
Ndoso 5 7 2 3 7 0
Welak 6 8 4 2 5 3
M. Timur 29 34 22 7 23 11
Elar 5 5 5 0 4 1
Kota Komba 2 4 0 2 3 1
Lamba Leda 6 6 5 1 3 3
Rana Mese 9 11 6 3 7 4
Sambi Rampas 7 8 6 1 6 2
Table 55. Primary School Availability at the Subdistrict Level
Note: The total numbers of schools and villages in each subdistrict, pilot subdistricts. PS = primary school.
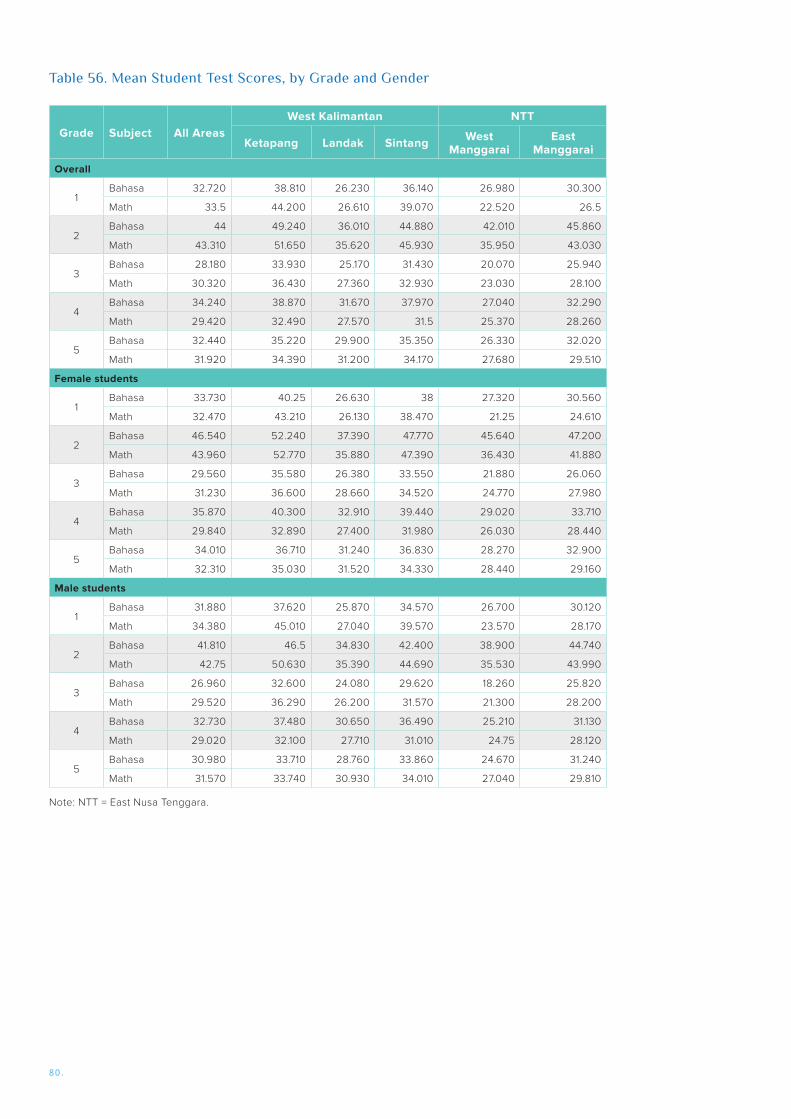
80.
Grade Subject All AreasWest Kalimantan NTT
Ketapang Landak Sintang West Manggarai
East Manggarai
Overall
1Bahasa 32.720 38.810 26.230 36.140 26.980 30.300
Math 33.5 44.200 26.610 39.070 22.520 26.5
2Bahasa 44 49.240 36.010 44.880 42.010 45.860
Math 43.310 51.650 35.620 45.930 35.950 43.030
3Bahasa 28.180 33.930 25.170 31.430 20.070 25.940
Math 30.320 36.430 27.360 32.930 23.030 28.100
4Bahasa 34.240 38.870 31.670 37.970 27.040 32.290
Math 29.420 32.490 27.570 31.5 25.370 28.260
5Bahasa 32.440 35.220 29.900 35.350 26.330 32.020
Math 31.920 34.390 31.200 34.170 27.680 29.510
Female students
1Bahasa 33.730 40.25 26.630 38 27.320 30.560
Math 32.470 43.210 26.130 38.470 21.25 24.610
2Bahasa 46.540 52.240 37.390 47.770 45.640 47.200
Math 43.960 52.770 35.880 47.390 36.430 41.880
3Bahasa 29.560 35.580 26.380 33.550 21.880 26.060
Math 31.230 36.600 28.660 34.520 24.770 27.980
4Bahasa 35.870 40.300 32.910 39.440 29.020 33.710
Math 29.840 32.890 27.400 31.980 26.030 28.440
5Bahasa 34.010 36.710 31.240 36.830 28.270 32.900
Math 32.310 35.030 31.520 34.330 28.440 29.160
Male students
1Bahasa 31.880 37.620 25.870 34.570 26.700 30.120
Math 34.380 45.010 27.040 39.570 23.570 28.170
2Bahasa 41.810 46.5 34.830 42.400 38.900 44.740
Math 42.75 50.630 35.390 44.690 35.530 43.990
3Bahasa 26.960 32.600 24.080 29.620 18.260 25.820
Math 29.520 36.290 26.200 31.570 21.300 28.200
4Bahasa 32.730 37.480 30.650 36.490 25.210 31.130
Math 29.020 32.100 27.710 31.010 24.75 28.120
5Bahasa 30.980 33.710 28.760 33.860 24.670 31.240
Math 31.570 33.740 30.930 34.010 27.040 29.810
Table 56. Mean Student Test Scores, by Grade and Gender
Note: NTT = East Nusa Tenggara.
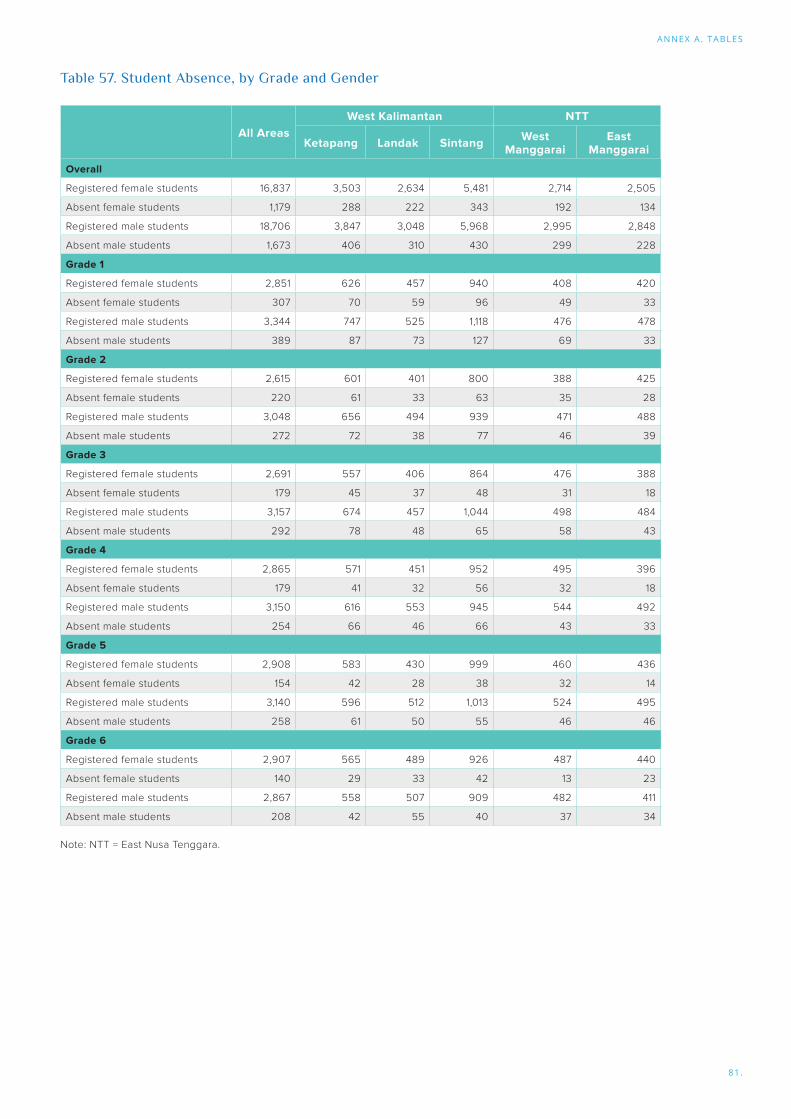
81.
ANNEX A . TABLES
All AreasWest Kalimantan NTT
Ketapang Landak Sintang West Manggarai
East Manggarai
Overall
Registered female students 16,837 3,503 2,634 5,481 2,714 2,505
Absent female students 1,179 288 222 343 192 134
Registered male students 18,706 3,847 3,048 5,968 2,995 2,848
Absent male students 1,673 406 310 430 299 228
Grade 1
Registered female students 2,851 626 457 940 408 420
Absent female students 307 70 59 96 49 33
Registered male students 3,344 747 525 1,118 476 478
Absent male students 389 87 73 127 69 33
Grade 2
Registered female students 2,615 601 401 800 388 425
Absent female students 220 61 33 63 35 28
Registered male students 3,048 656 494 939 471 488
Absent male students 272 72 38 77 46 39
Grade 3
Registered female students 2,691 557 406 864 476 388
Absent female students 179 45 37 48 31 18
Registered male students 3,157 674 457 1,044 498 484
Absent male students 292 78 48 65 58 43
Grade 4
Registered female students 2,865 571 451 952 495 396
Absent female students 179 41 32 56 32 18
Registered male students 3,150 616 553 945 544 492
Absent male students 254 66 46 66 43 33
Grade 5
Registered female students 2,908 583 430 999 460 436
Absent female students 154 42 28 38 32 14
Registered male students 3,140 596 512 1,013 524 495
Absent male students 258 61 50 55 46 46
Grade 6
Registered female students 2,907 565 489 926 487 440
Absent female students 140 29 33 42 13 23
Registered male students 2,867 558 507 909 482 411
Absent male students 208 42 55 40 37 34
Note: NTT = East Nusa Tenggara.
Table 57. Student Absence, by Grade and Gender

82.
Variable (1) (2)
# Teachers at school -0.110*** -0.208***
(0.016) (0.014)
# PNS teachers at school -0.016 -0.070***
(0.018) (0.016)
# Of students at school 0.002*** 0.005***
(0.001) (0.001)
# Ff classes at school 0.004 -0.018
(0.032) (0.026)
Teacher presence (# present teachers/#teachers) at school
-0.244* -1.010***
(0.142) (0.135)
Age of principal -0.004 -0.001
(0.003) (0.003)
Principal is female 0.041 0.061
(0.071) (0.066)
Principal is married -0.102 -0.177
(0.144) (0.131)
Age of teacher -0.001
(0.003)
Teacher is female -0.050
(0.049)
Teacher is married 0.064
(0.068)
Teacher is not civil servant -0.110***
(0.035)
Constant 1.879*** 4.636***
(0.282) (0.303)
Adjusted R2 0.203 0.166
Number of observations 259 1,918
Table 58. OLS Regressions of School, Principal, and Teacher Characteristics on Reported Teacher Shortage at School
Note: Standard errors are in parentheses. All regressions include district dummies. The dependent variable is binary (1=teacher shortage , 0=no reported teacher shortage). Column 1 contains results on principals while column 2 displays results from teacher regressions.
*** p < 0.01, ** p < 0.05, * p < 0.1.

83.
The classifications were assigned based on student test scores, which are defined by the number of questions answered correctly on the test. These classifications are applied for the results of the Indonesian and math tests. There are four classifications of competencies for whether a child is (1) unable to recognize letters/numbers, (2) below basic competencies, (3) below current grade-level competencies, or (4) at or above current grade-level competencies.
A student is classified as unable to recognize letters/numbers—the lowest level of competency—when s/he is unable to answer all the letter and number recognition questions in the Indonesian and math tests. This state of learning outcomes can only be detected for students in grades one and two, who are given letter and number recognition questions. A student is classified as having below basic competency when s/he is able to recognize letters and numbers but unable to answer at least more than half of the total number of questions that are two grade levels below the current grade-level standards in the test.61 A student is then classified as having below current grade level competency when s/he is unable to answer at least more than half of the total number of questions at their current grade-level standards in the test. Lastly, a student is classified as having at or above current grade level competency when s/he can answer more than half of the total number of questions at their current or higher grade-level standards in the test, which is the ideal learning outcome expected from students. For type 3 and 4 classifications, a student’s specific grade-level competency is thus determined by the number of questions at the highest grade-level standards that s/he can answer correctly, whereby s/he is able to answer at least more than half of the highest grade-level questions provided in the test.
ANNEX B . STUDENT COMPETENCY CLASSIF ICATIONS
61 The exception to this rule is grade one Indonesian, whereby students are classified in this type of competency when they cannot answer at least one set of grade one–level reading comprehension questions. This exception was applied because there were only two sets of reading comprehension questions in the grade one Indonesian test.
Annex B. Student Competency Classifications
84.

85.
REFERENCES
References
ACDP (Education Sector Analytical and Capacity Development Partnership). 2014. Study on Teacher Absenteeism in Indonesia 2014. Jakarta, Indonesia: ACDP.
Al-Samarrai, Samer, and Pedro Cerdan-Infantes. 2013. “Where Did All the Money Go? Financing Basic Education in Indonesia.” In Education in Indonesia, edited by D. Suryadarma and G. Jones, 109–38. Singapore: ISEAS–Yusof Ishak Institute.
ASER (Annual Status of Education Report). 2014. Annual Status of Education Report (Rural) 2013. New Delhi, India: ASER Centre.
BPS. 2018. Statistik Indonesia: Statistical Yearbook of Indonesia 2017. Jakarta: Badan Pusat Statistik.
BPS. 2019. Profil Kemiskinan di Indonesia September 2018. Jakarta: Badan Pusat Statistik.
Beatty, Amanda, Emelie Berkhout, Luhur Bima, Thomas Coen, Menno Pradhan and Daniel Suryadarma. 2018. “Indonesia Got Schooled: 15 Years of Rising Schooling and Flat Learning Profiles.” RISE Working Paper 18/026, Research on Improving Systems of Education, Oxford, United Kingdom.
Bjork, Christopher, and Dewi Susanti. "Community Participation and Teacher Accountability: Improving Learning Outcomes in Remote Areas of Indonesia." Unpublished manuscript, last modified 11 June, 2019. Microsoft Word file.
Chaudhury, Nazmul, Jeffrey Hammer, Michael Kremer, Karthik Muralidharan, and Hasley F. Rogers. 2006. “Missing in Action: Teacher and Health Worker Absence in Developing Countries.” Journal of Economic Perspectives 20 (1): 91–116.
Chen, Dandan. 2011. “School-Based Management, School Decision-Making and Education Outcomes in Indonesian Primary Schools.” Policy Research Working Paper 5809, World Bank, Washington, DC, https://openknowledge.worldbank.org/handle/10986/3572.
De Ree, Joppe, Karthik Muralidharan, Menno Pradhan, and Halsey Rogers. 2018. “Double for Nothing? Experimental Evidence on an Unconditional Teacher Salary Increase in Indonesia.” Quarterly Journal of Economics 133 (2): 993–1039.
Duflo, Esther. 2001. “Schooling and Labor Market Consequences of School Construction in Indonesia: Evidence from an Unusual Policy Experiment.” American Economic Review 91 (4): 795–813.
Gaduh, Arya, Menno Pradhan, Jan Priebe, and Dewi Susanti. "Scores, Camera, Action? Incentivizing Teachers in Remote Areas." Unpublished manuscript, last modified 28 March, 2019. Microsoft Word file.
Gove, Amber, and Anna Wetterberg, eds. 2011. The Early Grade Reading Assessment: Applications and Interventions to Improve Basic Literacy. Research Triangle Park, NC: RTI Press.
Hanushek, Eric A., and Ludger Woessmann. 2007. “The Role of Education Quality for Economic Growth.” Policy Research Working Paper 4122, World Bank, Washington, DC, https://openknowledge.worldbank.org/handle/10986/7154.

86.
Little, Angela W., ed. 2006. Education for All and Multi-Grade Teaching: Challenges and Opportunities. London: Springer.
Ministry of Villages, Disadvantaged Regions and Transmigration. 2016. Peraturan Menteri Desa, Pembangunan Daerah Tertinggal, dan Transmigrasi Republic Indonesia. Nomor 2, Tahun 2016. Tentang Indeks Membangunan Desa. Jakarta, Indonesia: Menteri Desa, Pembangunan Daerah Tertinggal, dan Transmigrasi.
Mullis, Ina V. S., Michael O. Martin, Pierre Foy, and Kathleen T. Drucker. 2012. PIRLS (Progress in International Reading Literacy Study) 2011 International Results in Reading. Chestnut Hill, MA: TIMSS & PIRLS International Study Center, Lynch School of Education, Boston College.
Mullis, Ina V. S., Michael O. Martin, Pierre Foy, and M. Hooper. 2016. TIMSS (Trends in International Mathematics and Science Study) 2015 International Results in Mathematics. Chestnut Hill, MA: TIMSS & PIRLS International Study Center, Lynch School of Education, Boston College.
OECD (Organisation for Economic Co-operation and Development). 2016. PISA 2015 Results in Focus. Paris: OECD, Program for International Student Assessment.
Perez-Alvarez, Marcello, Jan Priebe, and Dewi Susanti. 2019. “Teacher Accountability and Pay-for-Performance Schemes in (Semi-) Urban Indonesia: What do Education Stakeholders Think?” Unpublished manuscript, last modified 25 January, 2019. Microsoft Word file.
Platas, Linda M., Leanne R. Ketterlin-Gellar, Aarnout Brombacher, and Yasmin Sitabkhan. 2014. Early Grade Mathematics Assessment (EGMA) Toolkit. Research Triangle Park, NC: Research Triangle Park Press.
Plaut, Daniel, and Molly Jamierson Eberhardt. 2015. Bringing Learning to Light: The Role of Citizen Led Assessments in Shifting the Education Agenda. Washington, DC: Results for Development Institute.
Pradhan, Menno, Daniel Suryadharma, Amanda Beatty, Maisy Wong, Armida Alishjabana, Arya Gaduh, and Rima Prama Artha. 2014. “Improving Educational Quality through Enhancing Community Participation: Results from a Randomized Field Experiment in Indonesia.” Policy Research Working Paper 5795, World Bank, Washington, DC, https://openknowledge.worldbank.org/handle/10986/3559.
Pritchett, Lant. 2013. The Rebirth of Education: Schooling Ain’t Learning. Baltimore, MD: Brookings Institution Press.
Stern, Jonathan, and Lee Nordstrum. 2014. Indonesia 2014: The National Early Grade Reading Assessment and Snapshot of School Management Effectiveness Survey Report and Findings. Research Triangle Park, NC: Research Triangle Park Press.
Suharti. 2013. “Trends in Education in Indonesia.” In Education in Indonesia, edited by Daniel Suryadarma and Gavin W. Jones, 15–52. Singapore: ISEAS–Yusof Ishak Institute.
Suryadarma, Daniel, Asep Suryahadi, Sudarno Sumarto, and F. Hasley Rogers. 2006. “Improving Student Performance in Public Primary Schools in Developing Countries: Evidence from Indonesia.” Education Economics 14 (4): 401–29.
Toyamah, Nina, Bambang Sulakson, Meuthia Rosfadhila, Silvia Devina, Sirojuddin Arif, Stella Aleida Hutagalung, Eduwin Pakpahan, and Asri Yusrina. 2010. Teacher Absenteeism and Remote Area Allowance: Baseline Survey. Jakarta, Indonesia: SMERU Research Institute.
UNICEF (United Nations Children’s Emergency Fund). 2012. We Like Being Taught: A Study on Teacher Absenteeism in Papua and West Papua. Jakarta, Indonesia: UNICEF.
Usman, Syaikhu, Akhmadi, and Daniel Suryadarma. 2004. When Teachers Are Absent: Where Do They Go and What Is the Impact on Students? Jakarta, Indonesia: SMERU Research Institute.
Uwezo. 2012. Are Our Children Learning? Annual Learning Assessment Report. Kampala, Uganda: Uwezo.
Vernez, Gorges, Rita Karam, and Jeffrey H. Marshall. 2012. Implementation of School-Based Management in Indonesia. Santa Monica, CA: Rand Corporation, sponsored by the World Bank.
World Bank. 2004. World Development Report 2004: Making Services Work for Poor People. Washington, DC: World Bank and Oxford University Press.

87.
World Bank. 2008. Teacher Employment and Deployment in Indonesia: Opportunities for Equity, Efficiency and Quality Improvement. Washington, DC: World Bank.
———. 2013a. Early Childhood Education and Development in Poor Villages of Indonesia: Strong Foundations, Later Success. Jakarta, Indonesia: World Bank.
———. 2013b. Indonesia: Spending More or Spending Better: Improving Education Financing in Indonesia. Jakarta, Indonesia: World Bank.
———. 2015. The Role of BOS in Improving Education Outcomes in Indonesia. Jakarta, Indonesia: World Bank.
———. 2016. Indonesia’s Rising Divide. Washington, D.C., USA. World Bank
———. 2018. World Development Report 2018: Learning to Realize Education’s Promise. Washington, DC: World Bank, doi:10.1596/978-1-4648-1096-1.
———. 2018b. Indonesia Economic Quarterly June 2018: Learning More, Growing Faster. Washington, DC: World Bank, https://openknowledge.worldbank.org/handle/10986/29921 License: CC BY 3.0 IGO.
REFERENCES

88.

89.
