pride surveys questionnaire for grades 7 thru 12 report
TRANSCRIPT

PRIDESurveys 2140 Newmarket Pkwy. #116
Marietta, GA 30067
770.726.9327
Pride Surveys Questionnaire for Grades 7 thru 12 Report2017-18 Warren County
Warren, OH
February 06, 2018
sponsored by PreventionFIRST!


Contents
1 Introduction 181.1 How To Use Your Data . . . . . . . . . . . . . . . . . . . . . . . . . . . . . . . . . . . . . . . . . . . . . . . . . . . . . . . . . . . . . . . . . . . 19
2 Summary 212.1 Core Measures . . . . . . . . . . . . . . . . . . . . . . . . . . . . . . . . . . . . . . . . . . . . . . . . . . . . . . . . . . . . . . . . . . . . . . . 212.2 Annual Use . . . . . . . . . . . . . . . . . . . . . . . . . . . . . . . . . . . . . . . . . . . . . . . . . . . . . . . . . . . . . . . . . . . . . . . . . 222.3 Where Students Use . . . . . . . . . . . . . . . . . . . . . . . . . . . . . . . . . . . . . . . . . . . . . . . . . . . . . . . . . . . . . . . . . . . . 222.4 When Students Use . . . . . . . . . . . . . . . . . . . . . . . . . . . . . . . . . . . . . . . . . . . . . . . . . . . . . . . . . . . . . . . . . . . . . 222.5 Risk Factors . . . . . . . . . . . . . . . . . . . . . . . . . . . . . . . . . . . . . . . . . . . . . . . . . . . . . . . . . . . . . . . . . . . . . . . . . 232.6 Protective Factors . . . . . . . . . . . . . . . . . . . . . . . . . . . . . . . . . . . . . . . . . . . . . . . . . . . . . . . . . . . . . . . . . . . . . . 23
3 Graphics 243.1 Frequency of Use . . . . . . . . . . . . . . . . . . . . . . . . . . . . . . . . . . . . . . . . . . . . . . . . . . . . . . . . . . . . . . . . . . . . . . 25
3.1.1 Annual Use . . . . . . . . . . . . . . . . . . . . . . . . . . . . . . . . . . . . . . . . . . . . . . . . . . . . . . . . . . . . . . . . . . . . . 253.1.2 Past 30-Day Use . . . . . . . . . . . . . . . . . . . . . . . . . . . . . . . . . . . . . . . . . . . . . . . . . . . . . . . . . . . . . . . . . . 33
3.2 Perception of Harm . . . . . . . . . . . . . . . . . . . . . . . . . . . . . . . . . . . . . . . . . . . . . . . . . . . . . . . . . . . . . . . . . . . . . 353.3 Perception of Parental Disapproval . . . . . . . . . . . . . . . . . . . . . . . . . . . . . . . . . . . . . . . . . . . . . . . . . . . . . . . . . . . . . 553.4 Perception of Friends Disapproval . . . . . . . . . . . . . . . . . . . . . . . . . . . . . . . . . . . . . . . . . . . . . . . . . . . . . . . . . . . . . 653.5 Average Age of Onset of Use . . . . . . . . . . . . . . . . . . . . . . . . . . . . . . . . . . . . . . . . . . . . . . . . . . . . . . . . . . . . . . . . 753.6 Student Information . . . . . . . . . . . . . . . . . . . . . . . . . . . . . . . . . . . . . . . . . . . . . . . . . . . . . . . . . . . . . . . . . . . . . 983.7 Availability . . . . . . . . . . . . . . . . . . . . . . . . . . . . . . . . . . . . . . . . . . . . . . . . . . . . . . . . . . . . . . . . . . . . . . . . . . 1103.8 Where Do You Use . . . . . . . . . . . . . . . . . . . . . . . . . . . . . . . . . . . . . . . . . . . . . . . . . . . . . . . . . . . . . . . . . . . . . 1173.9 When Do You Use . . . . . . . . . . . . . . . . . . . . . . . . . . . . . . . . . . . . . . . . . . . . . . . . . . . . . . . . . . . . . . . . . . . . . . 1403.10 Annual Drug Use by Gender . . . . . . . . . . . . . . . . . . . . . . . . . . . . . . . . . . . . . . . . . . . . . . . . . . . . . . . . . . . . . . . . 1633.11 Risk and Protective Factors – Cross Tabulations . . . . . . . . . . . . . . . . . . . . . . . . . . . . . . . . . . . . . . . . . . . . . . . . . . . . . . 189
3.11.1 Attend Church or Synagogue . . . . . . . . . . . . . . . . . . . . . . . . . . . . . . . . . . . . . . . . . . . . . . . . . . . . . . . . . . . . 1903.11.2 Take Part in Community Activities . . . . . . . . . . . . . . . . . . . . . . . . . . . . . . . . . . . . . . . . . . . . . . . . . . . . . . . . . 1913.11.3 Make Good Grades . . . . . . . . . . . . . . . . . . . . . . . . . . . . . . . . . . . . . . . . . . . . . . . . . . . . . . . . . . . . . . . . . 192
iii

3.11.4 Take Part in Sports Teams . . . . . . . . . . . . . . . . . . . . . . . . . . . . . . . . . . . . . . . . . . . . . . . . . . . . . . . . . . . . . 1933.11.5 Take Part in School Activities . . . . . . . . . . . . . . . . . . . . . . . . . . . . . . . . . . . . . . . . . . . . . . . . . . . . . . . . . . . . 1943.11.6 Get Into Trouble at School . . . . . . . . . . . . . . . . . . . . . . . . . . . . . . . . . . . . . . . . . . . . . . . . . . . . . . . . . . . . . 1953.11.7 Teachers Talk About Dangers of Drugs . . . . . . . . . . . . . . . . . . . . . . . . . . . . . . . . . . . . . . . . . . . . . . . . . . . . . . 1963.11.8 Parents Talk About Dangers of Drugs . . . . . . . . . . . . . . . . . . . . . . . . . . . . . . . . . . . . . . . . . . . . . . . . . . . . . . . 1973.11.9 Parents Set Clear Rules . . . . . . . . . . . . . . . . . . . . . . . . . . . . . . . . . . . . . . . . . . . . . . . . . . . . . . . . . . . . . . 1983.11.10Parents Punish for Breaking Rules . . . . . . . . . . . . . . . . . . . . . . . . . . . . . . . . . . . . . . . . . . . . . . . . . . . . . . . . . 199
3.12 Safety and Health – Cross Tabulations . . . . . . . . . . . . . . . . . . . . . . . . . . . . . . . . . . . . . . . . . . . . . . . . . . . . . . . . . . . 2003.13 Carrying a Gun to School . . . . . . . . . . . . . . . . . . . . . . . . . . . . . . . . . . . . . . . . . . . . . . . . . . . . . . . . . . . . . . . . . . 2013.14 Involvement in Gangs . . . . . . . . . . . . . . . . . . . . . . . . . . . . . . . . . . . . . . . . . . . . . . . . . . . . . . . . . . . . . . . . . . . . 2023.15 Threatening/Harmful Behaviors . . . . . . . . . . . . . . . . . . . . . . . . . . . . . . . . . . . . . . . . . . . . . . . . . . . . . . . . . . . . . . . 2033.16 Trouble with Police . . . . . . . . . . . . . . . . . . . . . . . . . . . . . . . . . . . . . . . . . . . . . . . . . . . . . . . . . . . . . . . . . . . . . 2043.17 Personal Safety . . . . . . . . . . . . . . . . . . . . . . . . . . . . . . . . . . . . . . . . . . . . . . . . . . . . . . . . . . . . . . . . . . . . . . . 2053.18 Gambling . . . . . . . . . . . . . . . . . . . . . . . . . . . . . . . . . . . . . . . . . . . . . . . . . . . . . . . . . . . . . . . . . . . . . . . . . . 206
4 Percentage Tables 2094.1 Personal & Family Information . . . . . . . . . . . . . . . . . . . . . . . . . . . . . . . . . . . . . . . . . . . . . . . . . . . . . . . . . . . . . . . 2104.2 Student Information . . . . . . . . . . . . . . . . . . . . . . . . . . . . . . . . . . . . . . . . . . . . . . . . . . . . . . . . . . . . . . . . . . . . . 2134.3 Within The Past Year How Often Have You... . . . . . . . . . . . . . . . . . . . . . . . . . . . . . . . . . . . . . . . . . . . . . . . . . . . . . . . . 2264.4 What Effect Do You Most Often Get When You Use . . . . . . . . . . . . . . . . . . . . . . . . . . . . . . . . . . . . . . . . . . . . . . . . . . . . 2414.5 During the Past 30 Days? . . . . . . . . . . . . . . . . . . . . . . . . . . . . . . . . . . . . . . . . . . . . . . . . . . . . . . . . . . . . . . . . . . 2434.6 Do You Feel The Following Are Harmful To Your Health? . . . . . . . . . . . . . . . . . . . . . . . . . . . . . . . . . . . . . . . . . . . . . . . . . 2454.7 How Much Do You Think People Risk Harming Themselves Physically Or In Other Ways If They . . . . . . . . . . . . . . . . . . . . . . . . . . . . 2524.8 How Easy Is It To Get . . . . . . . . . . . . . . . . . . . . . . . . . . . . . . . . . . . . . . . . . . . . . . . . . . . . . . . . . . . . . . . . . . . . 2564.9 Feel About Binge Drinking . . . . . . . . . . . . . . . . . . . . . . . . . . . . . . . . . . . . . . . . . . . . . . . . . . . . . . . . . . . . . . . . . 2584.10 How Wrong Do Your Friends Feel It Would Be For You To . . . . . . . . . . . . . . . . . . . . . . . . . . . . . . . . . . . . . . . . . . . . . . . . . 2594.11 How Wrong Do Your Parents Feel It Would Be For You To . . . . . . . . . . . . . . . . . . . . . . . . . . . . . . . . . . . . . . . . . . . . . . . . . 2624.12 From Whom Do You Get . . . . . . . . . . . . . . . . . . . . . . . . . . . . . . . . . . . . . . . . . . . . . . . . . . . . . . . . . . . . . . . . . . 2654.13 At What Age Did You First . . . . . . . . . . . . . . . . . . . . . . . . . . . . . . . . . . . . . . . . . . . . . . . . . . . . . . . . . . . . . . . . . 2684.14 Where Do You Usually Use... . . . . . . . . . . . . . . . . . . . . . . . . . . . . . . . . . . . . . . . . . . . . . . . . . . . . . . . . . . . . . . . . 2794.15 When Do You Usually Use... . . . . . . . . . . . . . . . . . . . . . . . . . . . . . . . . . . . . . . . . . . . . . . . . . . . . . . . . . . . . . . . . 2904.16 Gambling . . . . . . . . . . . . . . . . . . . . . . . . . . . . . . . . . . . . . . . . . . . . . . . . . . . . . . . . . . . . . . . . . . . . . . . . . . 2984.17 While At School Have You . . . . . . . . . . . . . . . . . . . . . . . . . . . . . . . . . . . . . . . . . . . . . . . . . . . . . . . . . . . . . . . . . 3064.18 In My School, I Feel Safe... . . . . . . . . . . . . . . . . . . . . . . . . . . . . . . . . . . . . . . . . . . . . . . . . . . . . . . . . . . . . . . . . . 3104.19 Frequency of Use . . . . . . . . . . . . . . . . . . . . . . . . . . . . . . . . . . . . . . . . . . . . . . . . . . . . . . . . . . . . . . . . . . . . . . 313
5 Drug-Free Communities Support Program Core Measures 320
iv

2017-18 Warren County Warren, OH
List of Tables
1.1 Number of Students Surveyed . . . . . . . . . . . . . . . . . . . . . . . . . . . . . . . . . . . . . . . . . . . . . . . . . . . . . . . . . . . . . . 19
2.1 Core Measures for All Students . . . . . . . . . . . . . . . . . . . . . . . . . . . . . . . . . . . . . . . . . . . . . . . . . . . . . . . . . . . . . 212.2 Percentage of Students Who Report Using Drugs . . . . . . . . . . . . . . . . . . . . . . . . . . . . . . . . . . . . . . . . . . . . . . . . . . . . 222.3 Where Do Students Report Using . . . . . . . . . . . . . . . . . . . . . . . . . . . . . . . . . . . . . . . . . . . . . . . . . . . . . . . . . . . . 222.4 When Do Students Report Using . . . . . . . . . . . . . . . . . . . . . . . . . . . . . . . . . . . . . . . . . . . . . . . . . . . . . . . . . . . . 222.5 Percentage Of Students At Risk . . . . . . . . . . . . . . . . . . . . . . . . . . . . . . . . . . . . . . . . . . . . . . . . . . . . . . . . . . . . . 232.6 Percentage Of Students Protected . . . . . . . . . . . . . . . . . . . . . . . . . . . . . . . . . . . . . . . . . . . . . . . . . . . . . . . . . . . . 23
3.1 Attend Church or Synagogue . . . . . . . . . . . . . . . . . . . . . . . . . . . . . . . . . . . . . . . . . . . . . . . . . . . . . . . . . . . . . . 1903.2 Take Part in Community Activities . . . . . . . . . . . . . . . . . . . . . . . . . . . . . . . . . . . . . . . . . . . . . . . . . . . . . . . . . . . . 1913.3 Make Good Grades . . . . . . . . . . . . . . . . . . . . . . . . . . . . . . . . . . . . . . . . . . . . . . . . . . . . . . . . . . . . . . . . . . . . 1923.4 Take Part in Sports Teams . . . . . . . . . . . . . . . . . . . . . . . . . . . . . . . . . . . . . . . . . . . . . . . . . . . . . . . . . . . . . . . . 1933.5 Take Part in School Activities . . . . . . . . . . . . . . . . . . . . . . . . . . . . . . . . . . . . . . . . . . . . . . . . . . . . . . . . . . . . . . . 1943.6 Get Into Trouble at School . . . . . . . . . . . . . . . . . . . . . . . . . . . . . . . . . . . . . . . . . . . . . . . . . . . . . . . . . . . . . . . . 1953.7 Teachers Talk About Dangers of Drugs . . . . . . . . . . . . . . . . . . . . . . . . . . . . . . . . . . . . . . . . . . . . . . . . . . . . . . . . . 1963.8 Parents Talk About Dangers of Drugs . . . . . . . . . . . . . . . . . . . . . . . . . . . . . . . . . . . . . . . . . . . . . . . . . . . . . . . . . . 1973.9 Parents Set Clear Rules . . . . . . . . . . . . . . . . . . . . . . . . . . . . . . . . . . . . . . . . . . . . . . . . . . . . . . . . . . . . . . . . . 1983.10 Parents Punish for Breaking Rules . . . . . . . . . . . . . . . . . . . . . . . . . . . . . . . . . . . . . . . . . . . . . . . . . . . . . . . . . . . . 199
4.1 Ethnic Origin . . . . . . . . . . . . . . . . . . . . . . . . . . . . . . . . . . . . . . . . . . . . . . . . . . . . . . . . . . . . . . . . . . . . . . . 2104.2 Are you Hispanic or Latino/Latina . . . . . . . . . . . . . . . . . . . . . . . . . . . . . . . . . . . . . . . . . . . . . . . . . . . . . . . . . . . . 2104.3 Sex . . . . . . . . . . . . . . . . . . . . . . . . . . . . . . . . . . . . . . . . . . . . . . . . . . . . . . . . . . . . . . . . . . . . . . . . . . . . 2104.4 Do you live with... . . . . . . . . . . . . . . . . . . . . . . . . . . . . . . . . . . . . . . . . . . . . . . . . . . . . . . . . . . . . . . . . . . . . . 2114.5 Do you have a job? . . . . . . . . . . . . . . . . . . . . . . . . . . . . . . . . . . . . . . . . . . . . . . . . . . . . . . . . . . . . . . . . . . . . 2114.6 Does your father have a job? . . . . . . . . . . . . . . . . . . . . . . . . . . . . . . . . . . . . . . . . . . . . . . . . . . . . . . . . . . . . . . . 2114.7 Does your mother have a job? . . . . . . . . . . . . . . . . . . . . . . . . . . . . . . . . . . . . . . . . . . . . . . . . . . . . . . . . . . . . . . 2124.8 What is the educational level of your father? . . . . . . . . . . . . . . . . . . . . . . . . . . . . . . . . . . . . . . . . . . . . . . . . . . . . . . . 2124.9 What is the educational level of your mother? . . . . . . . . . . . . . . . . . . . . . . . . . . . . . . . . . . . . . . . . . . . . . . . . . . . . . . 212

2017-18 Warren County Warren, OH
4.10 Do you make good grades? . . . . . . . . . . . . . . . . . . . . . . . . . . . . . . . . . . . . . . . . . . . . . . . . . . . . . . . . . . . . . . . 2134.11 Do you get into trouble at school? . . . . . . . . . . . . . . . . . . . . . . . . . . . . . . . . . . . . . . . . . . . . . . . . . . . . . . . . . . . . 2134.12 Do you take part in school sports teams? . . . . . . . . . . . . . . . . . . . . . . . . . . . . . . . . . . . . . . . . . . . . . . . . . . . . . . . . 2134.13 Do you take part in school activities such as band, clubs, etc.? . . . . . . . . . . . . . . . . . . . . . . . . . . . . . . . . . . . . . . . . . . . . . 2144.14 Do you take part in community activities such as scouts, rec. teams, youth clubs, etc.? . . . . . . . . . . . . . . . . . . . . . . . . . . . . . . . . 2144.15 Do you attend church, synagogue, etc.? . . . . . . . . . . . . . . . . . . . . . . . . . . . . . . . . . . . . . . . . . . . . . . . . . . . . . . . . . 2144.16 Do your parents talk with you about the dangers of tobacco, alcohol and drug use? . . . . . . . . . . . . . . . . . . . . . . . . . . . . . . . . . . 2154.17 Do your teachers talk with you about the dangers of tobacco, alcohol and drug use? . . . . . . . . . . . . . . . . . . . . . . . . . . . . . . . . . 2154.18 Does your school set clear rules on using alcohol and drugs during school and school functions? . . . . . . . . . . . . . . . . . . . . . . . . . . 2154.19 Does your school punish you when you break the rules about using alcohol and drugs? . . . . . . . . . . . . . . . . . . . . . . . . . . . . . . . 2164.20 Do your parents set clear rules for you about using alcohol and drugs? . . . . . . . . . . . . . . . . . . . . . . . . . . . . . . . . . . . . . . . . 2164.21 Do your parents punish you when you break the rules about using alcohol and drugs? . . . . . . . . . . . . . . . . . . . . . . . . . . . . . . . . 2164.22 Have you been in trouble with the police? . . . . . . . . . . . . . . . . . . . . . . . . . . . . . . . . . . . . . . . . . . . . . . . . . . . . . . . . 2174.23 Do you take part in gang activities? . . . . . . . . . . . . . . . . . . . . . . . . . . . . . . . . . . . . . . . . . . . . . . . . . . . . . . . . . . . 2174.24 Have you ever thought about committing suicide? . . . . . . . . . . . . . . . . . . . . . . . . . . . . . . . . . . . . . . . . . . . . . . . . . . . . 2174.25 Do your friends use tobacco (cigarettes, etc.)? . . . . . . . . . . . . . . . . . . . . . . . . . . . . . . . . . . . . . . . . . . . . . . . . . . . . . 2184.26 Do your friends use alcohol (beer, liquor, etc.)? . . . . . . . . . . . . . . . . . . . . . . . . . . . . . . . . . . . . . . . . . . . . . . . . . . . . . 2184.27 Do your friends use marijuana (weed, chronic, dank, kush, etc.)? . . . . . . . . . . . . . . . . . . . . . . . . . . . . . . . . . . . . . . . . . . . 2184.28 In the past 3 months, have you been at a party where alcohol was available? . . . . . . . . . . . . . . . . . . . . . . . . . . . . . . . . . . . . . 2194.29 In the past 3 months, have you been at a party where marijuana or other illicit drugs were available? . . . . . . . . . . . . . . . . . . . . . . . . 2194.30 In the past 3 months, have you been at a party where prescription drugs, not prescribed to you, were available? . . . . . . . . . . . . . . . . . . 2204.31 In general, how often do you experience stress in your daily life? . . . . . . . . . . . . . . . . . . . . . . . . . . . . . . . . . . . . . . . . . . . . 2204.32 Does your school ask any students to take a drug test? . . . . . . . . . . . . . . . . . . . . . . . . . . . . . . . . . . . . . . . . . . . . . . . . . 2204.33 Have you bought or sold drugs AT school? . . . . . . . . . . . . . . . . . . . . . . . . . . . . . . . . . . . . . . . . . . . . . . . . . . . . . . . 2204.34 Have you bought or sold drugs when NOT at school? . . . . . . . . . . . . . . . . . . . . . . . . . . . . . . . . . . . . . . . . . . . . . . . . . . 2214.35 Have you carried a gun for protection or as a weapon when AT school in the past year? . . . . . . . . . . . . . . . . . . . . . . . . . . . . . . . 2214.36 Have you carried a gun for protection or as a weapon when NOT at school in the past year? . . . . . . . . . . . . . . . . . . . . . . . . . . . . . 2214.37 I did not go to school 1 or more days because I felt unsafe at school? . . . . . . . . . . . . . . . . . . . . . . . . . . . . . . . . . . . . . . . . . 2214.38 I did not go to school 1 or more days because I felt unsafe on my way to or from school? . . . . . . . . . . . . . . . . . . . . . . . . . . . . . . . 2224.39 Are you aware of a drug prevention coalition in your neighborhood? . . . . . . . . . . . . . . . . . . . . . . . . . . . . . . . . . . . . . . . . . . 2224.40 Are you involved in an extracurricular activity where the primary purpose of the group is to organize activities around the prevention of drug and
alcohol use in your community?? . . . . . . . . . . . . . . . . . . . . . . . . . . . . . . . . . . . . . . . . . . . . . . . . . . . . . . . . . . . . 2224.41 During the past 7 days, how many times did you exercise, play a sport, or participate in a physical activity for at least 20 minutes that made you
sweat and breathe hard? . . . . . . . . . . . . . . . . . . . . . . . . . . . . . . . . . . . . . . . . . . . . . . . . . . . . . . . . . . . . . . . . . 2224.42 During the past 7 days, how many times did you eat at least one piece of fruit? . . . . . . . . . . . . . . . . . . . . . . . . . . . . . . . . . . . . 2234.43 During the past 7 days, how many times did you eat at least one vegetable? . . . . . . . . . . . . . . . . . . . . . . . . . . . . . . . . . . . . . 2234.44 On an average school night, how many hours of sleep do you get? . . . . . . . . . . . . . . . . . . . . . . . . . . . . . . . . . . . . . . . . . . . 223

2017-18 Warren County Warren, OH
4.45 Within the past year, as a result of drinking, I did something I later regretted? . . . . . . . . . . . . . . . . . . . . . . . . . . . . . . . . . . . . . 2244.46 On an average school day, how often do you play video or computer games or use a device for something that is not school work? (Count time
spent on things such as Xbox, Wii, tablets and smartphones) . . . . . . . . . . . . . . . . . . . . . . . . . . . . . . . . . . . . . . . . . . . . . . 2244.47 In the past 3 months, how often have you seen or heard anti-drug messages? (TV, Radio, Internet, Social Media Sites, Billboards, Movie Theaters) 2244.48 How many days have you been absent from school this year? . . . . . . . . . . . . . . . . . . . . . . . . . . . . . . . . . . . . . . . . . . . . . 2254.49 Within the past year how often have you smoked cigarettes? . . . . . . . . . . . . . . . . . . . . . . . . . . . . . . . . . . . . . . . . . . . . . . 2264.50 Within the past year how often have you used smokeless tobacco (chew, etc.)? . . . . . . . . . . . . . . . . . . . . . . . . . . . . . . . . . . . . 2264.51 Within the past year how often have you smoked cigars? . . . . . . . . . . . . . . . . . . . . . . . . . . . . . . . . . . . . . . . . . . . . . . . . 2274.52 Within the past year how often have you used an electronic vapor product (e-cigars, e-cigarettes, e-pipes, vape pipes, vaping pens, e-hookas,
hookah pens, etc.)? . . . . . . . . . . . . . . . . . . . . . . . . . . . . . . . . . . . . . . . . . . . . . . . . . . . . . . . . . . . . . . . . . . . . 2274.53 Within the past year how often have you drank beer? . . . . . . . . . . . . . . . . . . . . . . . . . . . . . . . . . . . . . . . . . . . . . . . . . . 2284.54 Within the past year how often have you drank coolers, hard lemonade, etc.? . . . . . . . . . . . . . . . . . . . . . . . . . . . . . . . . . . . . . 2284.55 Within the past year how often have you drank liquor (whiskey, vodka, rum, etc.)? . . . . . . . . . . . . . . . . . . . . . . . . . . . . . . . . . . . 2294.56 Within the past year how often have you had 5 or more glasses of beer, coolers, or shots of liquor within a few hours? . . . . . . . . . . . . . . . 2294.57 Within the past year how often have you smoked marijuana (weed, chronic, dank, kish, etc.? . . . . . . . . . . . . . . . . . . . . . . . . . . . . . 2304.58 Within the past year how often have you used synthetic marijuana (K2, spice)? . . . . . . . . . . . . . . . . . . . . . . . . . . . . . . . . . . . . 2304.59 Within the past year how often have you used chemical products to get high (bath salts)? . . . . . . . . . . . . . . . . . . . . . . . . . . . . . . 2314.60 Within the past year how often have you used pain medication not prescribed to you (Oxycontin, Vicodin, Percocet, etc.)? . . . . . . . . . . . . . 2314.61 Within the past year how often have you used stimulant medication not prescribed to you (Adderall, Ritalin, Concerta, etc.)? . . . . . . . . . . . . 2324.62 Within the past year how often have you used sleeping medication not prescribed to you (Ambien, Restoril, etc.)? . . . . . . . . . . . . . . . . . 2324.63 Within the past year how often have you used sedative/anxiety medication not prescribed to you (Xanax, Valium, Ativan, etc.)? . . . . . . . . . . 2334.64 Within the past year how often have you used over-the-counter drugs to get high? . . . . . . . . . . . . . . . . . . . . . . . . . . . . . . . . . . 2334.65 Within the past year how often have you used heroin? . . . . . . . . . . . . . . . . . . . . . . . . . . . . . . . . . . . . . . . . . . . . . . . . . 2344.66 Within the past year how often have you used cocaine (crack, etc.)? . . . . . . . . . . . . . . . . . . . . . . . . . . . . . . . . . . . . . . . . . . 2344.67 Within the past year how often have you used inhalants (glue, gas, etc.)? . . . . . . . . . . . . . . . . . . . . . . . . . . . . . . . . . . . . . . . 2354.68 Within the past year how often have you used hallucinogens (PCP, LSD, etc.)? . . . . . . . . . . . . . . . . . . . . . . . . . . . . . . . . . . . . 2354.69 Within the past year how often have you used steroids? . . . . . . . . . . . . . . . . . . . . . . . . . . . . . . . . . . . . . . . . . . . . . . . . 2364.70 Within the past year how often have you used ecstasy (MDMA)? . . . . . . . . . . . . . . . . . . . . . . . . . . . . . . . . . . . . . . . . . . . . 2364.71 Within the past year how often have you used meth (crystal, ice, crank, etc.)? . . . . . . . . . . . . . . . . . . . . . . . . . . . . . . . . . . . . . 2374.72 Within the past year how often have you ridden in a car with a driver who was drunk? . . . . . . . . . . . . . . . . . . . . . . . . . . . . . . . . . 2374.73 Within the past year how often have you ridden in a car with a driver who was high? . . . . . . . . . . . . . . . . . . . . . . . . . . . . . . . . . 2384.74 Within the past year how often have you driven a car while drunk? . . . . . . . . . . . . . . . . . . . . . . . . . . . . . . . . . . . . . . . . . . . 2384.75 Within the past year how often have you driven a car while high? . . . . . . . . . . . . . . . . . . . . . . . . . . . . . . . . . . . . . . . . . . . . 2394.76 Within the past year how often have you used any tobacco? . . . . . . . . . . . . . . . . . . . . . . . . . . . . . . . . . . . . . . . . . . . . . . 2394.77 Within the past year how often have you used any alcohol? . . . . . . . . . . . . . . . . . . . . . . . . . . . . . . . . . . . . . . . . . . . . . . . 2404.78 Within the past year how often have you used any illicit drug? . . . . . . . . . . . . . . . . . . . . . . . . . . . . . . . . . . . . . . . . . . . . . 2404.79 What effect do you most often get when you drink beer? . . . . . . . . . . . . . . . . . . . . . . . . . . . . . . . . . . . . . . . . . . . . . . . . 241

2017-18 Warren County Warren, OH
4.80 What effect do you most often get when you drink coolers, hard lemonade, etc.? . . . . . . . . . . . . . . . . . . . . . . . . . . . . . . . . . . . 2414.81 What effect do you most often get when you drink liquor? . . . . . . . . . . . . . . . . . . . . . . . . . . . . . . . . . . . . . . . . . . . . . . . . 2414.82 What effect do you most often get when you smoke marijuana? . . . . . . . . . . . . . . . . . . . . . . . . . . . . . . . . . . . . . . . . . . . . 2424.83 What effect do you most often get when you use an electronic vapor product? . . . . . . . . . . . . . . . . . . . . . . . . . . . . . . . . . . . . . 2424.84 What effect do you most often get when you use prescription drugs not prescribed to you? . . . . . . . . . . . . . . . . . . . . . . . . . . . . . . 2424.85 What effect do you most often get when you use other illicit drugs? . . . . . . . . . . . . . . . . . . . . . . . . . . . . . . . . . . . . . . . . . . 2434.86 During the past 30 days did you drink one or more drinks of an alcoholic beverage? . . . . . . . . . . . . . . . . . . . . . . . . . . . . . . . . . 2434.87 During the past 30 days did you smoke part or all of a cigarette? . . . . . . . . . . . . . . . . . . . . . . . . . . . . . . . . . . . . . . . . . . . . 2434.88 During the past 30 days have you used marijuana or hashish? . . . . . . . . . . . . . . . . . . . . . . . . . . . . . . . . . . . . . . . . . . . . . 2434.89 During the past 30 days have you used prescription drugs not prescribed to you? . . . . . . . . . . . . . . . . . . . . . . . . . . . . . . . . . . . 2444.90 During the past 30 days have you used other illicit drugs? . . . . . . . . . . . . . . . . . . . . . . . . . . . . . . . . . . . . . . . . . . . . . . . 2444.91 During the past 30 days have you used an electronic vapor product? . . . . . . . . . . . . . . . . . . . . . . . . . . . . . . . . . . . . . . . . . . 2444.92 Do you feel smoking cigarettes is harmful to your health? . . . . . . . . . . . . . . . . . . . . . . . . . . . . . . . . . . . . . . . . . . . . . . . . 2454.93 Do you feel using smokeless tobacco is harmful to your health? . . . . . . . . . . . . . . . . . . . . . . . . . . . . . . . . . . . . . . . . . . . . 2454.94 Do you feel smoking cigars is harmful to your health? . . . . . . . . . . . . . . . . . . . . . . . . . . . . . . . . . . . . . . . . . . . . . . . . . . 2454.95 Do you feel using an electronic vapor product is harmful to your health? . . . . . . . . . . . . . . . . . . . . . . . . . . . . . . . . . . . . . . . . 2464.96 Do you feel drinking beer is harmful to your health? . . . . . . . . . . . . . . . . . . . . . . . . . . . . . . . . . . . . . . . . . . . . . . . . . . . 2464.97 Do you feel drinking coolers, hard lemonade, etc. is harmful to your health? . . . . . . . . . . . . . . . . . . . . . . . . . . . . . . . . . . . . . . 2464.98 Do you feel drinking liquor is harmful to your health? . . . . . . . . . . . . . . . . . . . . . . . . . . . . . . . . . . . . . . . . . . . . . . . . . . 2474.99 Do you feel smoking marijuana is harmful to your health? . . . . . . . . . . . . . . . . . . . . . . . . . . . . . . . . . . . . . . . . . . . . . . . . 2474.100 Do you feel using synthetic marijuana is harmful to your health? . . . . . . . . . . . . . . . . . . . . . . . . . . . . . . . . . . . . . . . . . . . . 2474.101 Do you feel using chemical products (bath salts) to get high is harmful to your health? . . . . . . . . . . . . . . . . . . . . . . . . . . . . . . . . 2484.102 Do you feel using prescription drugs not prescribed to you is harmful to your health? . . . . . . . . . . . . . . . . . . . . . . . . . . . . . . . . . 2484.103 Do you feel using over-the-counter drugs to get high is harmful to your health? . . . . . . . . . . . . . . . . . . . . . . . . . . . . . . . . . . . . 2484.104 Do you feel using heroin is harmful to your health? . . . . . . . . . . . . . . . . . . . . . . . . . . . . . . . . . . . . . . . . . . . . . . . . . . . 2494.105 Do you feel using cocaine is harmful to your health? . . . . . . . . . . . . . . . . . . . . . . . . . . . . . . . . . . . . . . . . . . . . . . . . . . 2494.106 Do you feel using inhalants is harmful to your health? . . . . . . . . . . . . . . . . . . . . . . . . . . . . . . . . . . . . . . . . . . . . . . . . . . 2494.107 Do you feel using hallucinogens is harmful to your health? . . . . . . . . . . . . . . . . . . . . . . . . . . . . . . . . . . . . . . . . . . . . . . . 2504.108 Do you feel using steroids is harmful to your health? . . . . . . . . . . . . . . . . . . . . . . . . . . . . . . . . . . . . . . . . . . . . . . . . . . 2504.109 Do you feel using ecstasy is harmful to your health? . . . . . . . . . . . . . . . . . . . . . . . . . . . . . . . . . . . . . . . . . . . . . . . . . . 2504.110 Do you feel using meth is harmful to your health? . . . . . . . . . . . . . . . . . . . . . . . . . . . . . . . . . . . . . . . . . . . . . . . . . . . . 2514.111 How much do you think people risk harming themselves physically or in other ways if they use any alcohol? . . . . . . . . . . . . . . . . . . . . . 2524.112 How much do you think people risk harming themselves physically or in other ways if they have five or more drinks of an alcoholic beverage once
or twice a week? . . . . . . . . . . . . . . . . . . . . . . . . . . . . . . . . . . . . . . . . . . . . . . . . . . . . . . . . . . . . . . . . . . . . . 2524.113 How much do you think people risk harming themselves physically or in other ways if they take one or two drinks of an alcoholic beverage nearly
every day? . . . . . . . . . . . . . . . . . . . . . . . . . . . . . . . . . . . . . . . . . . . . . . . . . . . . . . . . . . . . . . . . . . . . . . . . 2524.114 How much do you think people risk harming themselves physically or in other ways if they use any tobacco? . . . . . . . . . . . . . . . . . . . . 253

2017-18 Warren County Warren, OH
4.115 How much do you think people risk harming themselves physically or in other ways if they smoke one or more packs of cigarettes per day? . . . . 2534.116 How much do you think people risk harming themselves physically or in other ways if they use electronic vapor products? . . . . . . . . . . . . . 2534.117 How much do you think people risk harming themselves physically or in other ways if they smoke marijuana once or twice a week? . . . . . . . . 2544.118 How much do you think people risk harming themselves physically or in other ways if they use prescription drugs that are not prescribed to them? 2544.119 How much do you think people risk harming themselves physically or in other ways if they use illicit drugs? . . . . . . . . . . . . . . . . . . . . . 2544.120 How much do you think people risk harming themselves physically or in other ways if they drive while drunk? . . . . . . . . . . . . . . . . . . . . 2554.121 How much do you think people risk harming themselves physically or in other ways if they drive while high? . . . . . . . . . . . . . . . . . . . . . 2554.122 How easy is it to get cigarettes, smokeless tobacco, cigars, etc.? . . . . . . . . . . . . . . . . . . . . . . . . . . . . . . . . . . . . . . . . . . . . 2564.123 How easy is it to get electronic vapor products? . . . . . . . . . . . . . . . . . . . . . . . . . . . . . . . . . . . . . . . . . . . . . . . . . . . . . 2564.124 How easy is it to get beer, wine, liquor and other alcohol products? . . . . . . . . . . . . . . . . . . . . . . . . . . . . . . . . . . . . . . . . . . 2564.125 How easy is it to get marijuana? . . . . . . . . . . . . . . . . . . . . . . . . . . . . . . . . . . . . . . . . . . . . . . . . . . . . . . . . . . . . . 2574.126 How easy is it to get prescription drugs not prescribed to you? . . . . . . . . . . . . . . . . . . . . . . . . . . . . . . . . . . . . . . . . . . . . . 2574.127 How easy is it to get other illicit drugs? . . . . . . . . . . . . . . . . . . . . . . . . . . . . . . . . . . . . . . . . . . . . . . . . . . . . . . . . . 2574.128 How do you feel about someone your age having one or two drinks of an alcoholic beverage nearly every day? . . . . . . . . . . . . . . . . . . . 2584.129 How wrong would your friends feel it would be for you to use any alcohol? . . . . . . . . . . . . . . . . . . . . . . . . . . . . . . . . . . . . . . . 2594.130 How wrong would your friends feel it would be for you to have one or two drinks of an alcoholic beverage nearly every day? . . . . . . . . . . . . 2594.131 How wrong would your friends feel it would be for you to use any tobacco? . . . . . . . . . . . . . . . . . . . . . . . . . . . . . . . . . . . . . . 2594.132 How wrong would your friends feel it would be for you to smoke tobacco? . . . . . . . . . . . . . . . . . . . . . . . . . . . . . . . . . . . . . . . 2604.133 How wrong would your friends feel it would be for you to use electronic vapor products? . . . . . . . . . . . . . . . . . . . . . . . . . . . . . . . 2604.134 How wrong would your friends feel it would be for you to smoke marijuana? . . . . . . . . . . . . . . . . . . . . . . . . . . . . . . . . . . . . . . 2604.135 How wrong would your friends feel it would be for you to use prescription drugs that are not prescribed to you? . . . . . . . . . . . . . . . . . . . 2614.136 How wrong would your friends feel it would be for you to use other illicit drugs? . . . . . . . . . . . . . . . . . . . . . . . . . . . . . . . . . . . . 2614.137 How wrong would your friends feel it would be for you to gamble anything of value? . . . . . . . . . . . . . . . . . . . . . . . . . . . . . . . . . . 2614.138 How wrong would your parents feel it would be for you to use any alcohol? . . . . . . . . . . . . . . . . . . . . . . . . . . . . . . . . . . . . . . 2624.139 How wrong would your parents feel it would be for you to have one or two drinks of an alcoholic beverage nearly every day? . . . . . . . . . . . . 2624.140 How wrong would your parents feel it would be for you to use any tobacco? . . . . . . . . . . . . . . . . . . . . . . . . . . . . . . . . . . . . . . 2624.141 How wrong would your parents feel it would be for you to smoke tobacco? . . . . . . . . . . . . . . . . . . . . . . . . . . . . . . . . . . . . . . . 2634.142 How wrong would your parents feel it would be for you to use electronic vapor products? . . . . . . . . . . . . . . . . . . . . . . . . . . . . . . . 2634.143 How wrong would your parents feel it would be for you to smoke marijuana? . . . . . . . . . . . . . . . . . . . . . . . . . . . . . . . . . . . . . 2634.144 How wrong would your parents feel it would be for you to use prescription drugs that are not prescribed to you? . . . . . . . . . . . . . . . . . . . 2644.145 How wrong would your parents feel it would be for you to use other illicit drugs? . . . . . . . . . . . . . . . . . . . . . . . . . . . . . . . . . . . . 2644.146 How wrong would your parents feel it would be for you to gamble anything of value? . . . . . . . . . . . . . . . . . . . . . . . . . . . . . . . . . 2644.147 From whom do you get alcohol? . . . . . . . . . . . . . . . . . . . . . . . . . . . . . . . . . . . . . . . . . . . . . . . . . . . . . . . . . . . . . 2654.148 From whom do you get tobacco? . . . . . . . . . . . . . . . . . . . . . . . . . . . . . . . . . . . . . . . . . . . . . . . . . . . . . . . . . . . . . 2654.149 From whom do you get electronic vapor products? . . . . . . . . . . . . . . . . . . . . . . . . . . . . . . . . . . . . . . . . . . . . . . . . . . . 2664.150 From whom do you get marijuana? . . . . . . . . . . . . . . . . . . . . . . . . . . . . . . . . . . . . . . . . . . . . . . . . . . . . . . . . . . . 2664.151 From whom do you get prescription drugs not prescribed to you? . . . . . . . . . . . . . . . . . . . . . . . . . . . . . . . . . . . . . . . . . . . 267

2017-18 Warren County Warren, OH
4.152 From whom do you get illicit drugs? . . . . . . . . . . . . . . . . . . . . . . . . . . . . . . . . . . . . . . . . . . . . . . . . . . . . . . . . . . . 2674.153 At what age did you first smoke cigarettes? . . . . . . . . . . . . . . . . . . . . . . . . . . . . . . . . . . . . . . . . . . . . . . . . . . . . . . . 2684.154 At what age did you first use smokeless tobacco? . . . . . . . . . . . . . . . . . . . . . . . . . . . . . . . . . . . . . . . . . . . . . . . . . . . . 2684.155 At what age did you first smoke cigars? . . . . . . . . . . . . . . . . . . . . . . . . . . . . . . . . . . . . . . . . . . . . . . . . . . . . . . . . . 2694.156 At what age did you first use electronic vapor products? . . . . . . . . . . . . . . . . . . . . . . . . . . . . . . . . . . . . . . . . . . . . . . . . 2694.157 At what age did you first drink beer? . . . . . . . . . . . . . . . . . . . . . . . . . . . . . . . . . . . . . . . . . . . . . . . . . . . . . . . . . . . 2704.158 At what age did you first drink coolers, hard lemonade, etc.? . . . . . . . . . . . . . . . . . . . . . . . . . . . . . . . . . . . . . . . . . . . . . . 2704.159 At what age did you first drink liquor? . . . . . . . . . . . . . . . . . . . . . . . . . . . . . . . . . . . . . . . . . . . . . . . . . . . . . . . . . . 2714.160 At what age did you first smoke marijuana? . . . . . . . . . . . . . . . . . . . . . . . . . . . . . . . . . . . . . . . . . . . . . . . . . . . . . . . 2714.161 At what age did you first use synthetic marijuana? . . . . . . . . . . . . . . . . . . . . . . . . . . . . . . . . . . . . . . . . . . . . . . . . . . . 2724.162 At what age did you first use chemical products (bath salts) to get high? . . . . . . . . . . . . . . . . . . . . . . . . . . . . . . . . . . . . . . . . 2724.163 At what age did you first use prescription drugs not prescribed to you? . . . . . . . . . . . . . . . . . . . . . . . . . . . . . . . . . . . . . . . . 2734.164 At what age did you first use over-the-counter drugs to get high? . . . . . . . . . . . . . . . . . . . . . . . . . . . . . . . . . . . . . . . . . . . . 2734.165 At what age did you first use heroin? . . . . . . . . . . . . . . . . . . . . . . . . . . . . . . . . . . . . . . . . . . . . . . . . . . . . . . . . . . . 2744.166 At what age did you first use cocaine? . . . . . . . . . . . . . . . . . . . . . . . . . . . . . . . . . . . . . . . . . . . . . . . . . . . . . . . . . . 2744.167 At what age did you first use inhalants? . . . . . . . . . . . . . . . . . . . . . . . . . . . . . . . . . . . . . . . . . . . . . . . . . . . . . . . . . 2754.168 At what age did you first use hallucinogens? . . . . . . . . . . . . . . . . . . . . . . . . . . . . . . . . . . . . . . . . . . . . . . . . . . . . . . 2754.169 At what age did you first use steroids? . . . . . . . . . . . . . . . . . . . . . . . . . . . . . . . . . . . . . . . . . . . . . . . . . . . . . . . . . . 2764.170 At what age did you first use ecstasy? . . . . . . . . . . . . . . . . . . . . . . . . . . . . . . . . . . . . . . . . . . . . . . . . . . . . . . . . . . 2764.171 At what age did you first use meth? . . . . . . . . . . . . . . . . . . . . . . . . . . . . . . . . . . . . . . . . . . . . . . . . . . . . . . . . . . . 2774.172 At what age did you first use any tobacco? . . . . . . . . . . . . . . . . . . . . . . . . . . . . . . . . . . . . . . . . . . . . . . . . . . . . . . . 2774.173 At what age did you first use any alcohol? . . . . . . . . . . . . . . . . . . . . . . . . . . . . . . . . . . . . . . . . . . . . . . . . . . . . . . . . 2784.174 At what age did you first use any illicit drug? . . . . . . . . . . . . . . . . . . . . . . . . . . . . . . . . . . . . . . . . . . . . . . . . . . . . . . . 2784.175 Where do you usually smoke cigarettes? . . . . . . . . . . . . . . . . . . . . . . . . . . . . . . . . . . . . . . . . . . . . . . . . . . . . . . . . 2794.176 Where do you usually use smokeless tobacco? . . . . . . . . . . . . . . . . . . . . . . . . . . . . . . . . . . . . . . . . . . . . . . . . . . . . . 2794.177 Where do you usually smoke cigars? . . . . . . . . . . . . . . . . . . . . . . . . . . . . . . . . . . . . . . . . . . . . . . . . . . . . . . . . . . 2804.178 Where do you usually use electronic vapor products? . . . . . . . . . . . . . . . . . . . . . . . . . . . . . . . . . . . . . . . . . . . . . . . . . . 2804.179 Where do you usually drink beer? . . . . . . . . . . . . . . . . . . . . . . . . . . . . . . . . . . . . . . . . . . . . . . . . . . . . . . . . . . . . 2814.180 Where do you usually drink coolers, hard lemonade, etc.? . . . . . . . . . . . . . . . . . . . . . . . . . . . . . . . . . . . . . . . . . . . . . . . 2814.181 Where do you usually drink liquor? . . . . . . . . . . . . . . . . . . . . . . . . . . . . . . . . . . . . . . . . . . . . . . . . . . . . . . . . . . . . 2824.182 Where do you usually smoke marijuana? . . . . . . . . . . . . . . . . . . . . . . . . . . . . . . . . . . . . . . . . . . . . . . . . . . . . . . . . 2824.183 Where do you usually use synthetic marijuana? . . . . . . . . . . . . . . . . . . . . . . . . . . . . . . . . . . . . . . . . . . . . . . . . . . . . . 2834.184 Where do you usually use chemical products (bath salts) to get high? . . . . . . . . . . . . . . . . . . . . . . . . . . . . . . . . . . . . . . . . . 2834.185 Where do you usually use prescription drugs not prescribed to you? . . . . . . . . . . . . . . . . . . . . . . . . . . . . . . . . . . . . . . . . . . 2844.186 Where do you usually use over-the-counter drugs to get high? . . . . . . . . . . . . . . . . . . . . . . . . . . . . . . . . . . . . . . . . . . . . . 2844.187 Where do you usually use heroin? . . . . . . . . . . . . . . . . . . . . . . . . . . . . . . . . . . . . . . . . . . . . . . . . . . . . . . . . . . . . 2854.188 Where do you usually use cocaine? . . . . . . . . . . . . . . . . . . . . . . . . . . . . . . . . . . . . . . . . . . . . . . . . . . . . . . . . . . . 285

2017-18 Warren County Warren, OH
4.189 Where do you usually use inhalants? . . . . . . . . . . . . . . . . . . . . . . . . . . . . . . . . . . . . . . . . . . . . . . . . . . . . . . . . . . 2864.190 Where do you usually use hallucinogens? . . . . . . . . . . . . . . . . . . . . . . . . . . . . . . . . . . . . . . . . . . . . . . . . . . . . . . . . 2864.191 Where do you usually use steroids? . . . . . . . . . . . . . . . . . . . . . . . . . . . . . . . . . . . . . . . . . . . . . . . . . . . . . . . . . . . 2874.192 Where do you usually use ecstasy? . . . . . . . . . . . . . . . . . . . . . . . . . . . . . . . . . . . . . . . . . . . . . . . . . . . . . . . . . . . 2874.193 Where do you usually use meth? . . . . . . . . . . . . . . . . . . . . . . . . . . . . . . . . . . . . . . . . . . . . . . . . . . . . . . . . . . . . 2884.194 Where do you usually use any tobacco? . . . . . . . . . . . . . . . . . . . . . . . . . . . . . . . . . . . . . . . . . . . . . . . . . . . . . . . . . 2884.195 Where do you usually use any alcohol? . . . . . . . . . . . . . . . . . . . . . . . . . . . . . . . . . . . . . . . . . . . . . . . . . . . . . . . . . 2894.196 Where do you usually use any illicit drug? . . . . . . . . . . . . . . . . . . . . . . . . . . . . . . . . . . . . . . . . . . . . . . . . . . . . . . . . 2894.197 When do you usually smoke cigarettes? . . . . . . . . . . . . . . . . . . . . . . . . . . . . . . . . . . . . . . . . . . . . . . . . . . . . . . . . . 2904.198 When do you usually use smokeless tobacco? . . . . . . . . . . . . . . . . . . . . . . . . . . . . . . . . . . . . . . . . . . . . . . . . . . . . . 2904.199 When do you usually smoke cigars? . . . . . . . . . . . . . . . . . . . . . . . . . . . . . . . . . . . . . . . . . . . . . . . . . . . . . . . . . . . 2904.200 When do you usually use electronic vapor products? . . . . . . . . . . . . . . . . . . . . . . . . . . . . . . . . . . . . . . . . . . . . . . . . . . 2914.201 When do you usually drink beer? . . . . . . . . . . . . . . . . . . . . . . . . . . . . . . . . . . . . . . . . . . . . . . . . . . . . . . . . . . . . 2914.202 When do you usually drink coolers, hard lemonade, etc.? . . . . . . . . . . . . . . . . . . . . . . . . . . . . . . . . . . . . . . . . . . . . . . . . 2914.203 When do you usually drink liquor? . . . . . . . . . . . . . . . . . . . . . . . . . . . . . . . . . . . . . . . . . . . . . . . . . . . . . . . . . . . . 2924.204 When do you usually smoke marijuana? . . . . . . . . . . . . . . . . . . . . . . . . . . . . . . . . . . . . . . . . . . . . . . . . . . . . . . . . . 2924.205 When do you usually use synthetic marijuana? . . . . . . . . . . . . . . . . . . . . . . . . . . . . . . . . . . . . . . . . . . . . . . . . . . . . . 2924.206 When do you usually use chemical products (bath salts) to get high? . . . . . . . . . . . . . . . . . . . . . . . . . . . . . . . . . . . . . . . . . 2934.207 When do you usually use prescription drugs not prescribed to you? . . . . . . . . . . . . . . . . . . . . . . . . . . . . . . . . . . . . . . . . . . 2934.208 When do you usually use over-the-counter drugs to get high? . . . . . . . . . . . . . . . . . . . . . . . . . . . . . . . . . . . . . . . . . . . . . 2934.209 When do you usually use heroin? . . . . . . . . . . . . . . . . . . . . . . . . . . . . . . . . . . . . . . . . . . . . . . . . . . . . . . . . . . . . 2944.210 When do you usually use cocaine? . . . . . . . . . . . . . . . . . . . . . . . . . . . . . . . . . . . . . . . . . . . . . . . . . . . . . . . . . . . 2944.211 When do you usually use inhalants? . . . . . . . . . . . . . . . . . . . . . . . . . . . . . . . . . . . . . . . . . . . . . . . . . . . . . . . . . . . 2944.212 When do you usually use hallucinogens? . . . . . . . . . . . . . . . . . . . . . . . . . . . . . . . . . . . . . . . . . . . . . . . . . . . . . . . . 2954.213 When do you usually use steroids? . . . . . . . . . . . . . . . . . . . . . . . . . . . . . . . . . . . . . . . . . . . . . . . . . . . . . . . . . . . 2954.214 When do you usually use ecstasy? . . . . . . . . . . . . . . . . . . . . . . . . . . . . . . . . . . . . . . . . . . . . . . . . . . . . . . . . . . . 2954.215 When do you usually use meth? . . . . . . . . . . . . . . . . . . . . . . . . . . . . . . . . . . . . . . . . . . . . . . . . . . . . . . . . . . . . . 2964.216 When do you usually use any tobacco? . . . . . . . . . . . . . . . . . . . . . . . . . . . . . . . . . . . . . . . . . . . . . . . . . . . . . . . . . 2964.217 When do you usually use any alcohol? . . . . . . . . . . . . . . . . . . . . . . . . . . . . . . . . . . . . . . . . . . . . . . . . . . . . . . . . . 2974.218 When do you usually use any illicit drug? . . . . . . . . . . . . . . . . . . . . . . . . . . . . . . . . . . . . . . . . . . . . . . . . . . . . . . . . 2974.219 Within the past year how often have you played "scratch offs"? . . . . . . . . . . . . . . . . . . . . . . . . . . . . . . . . . . . . . . . . . . . . . 2984.220 Within the past year how often have you played lottery tickets (Powerball or Megabucks)? . . . . . . . . . . . . . . . . . . . . . . . . . . . . . . 2984.221 Within the past year how often have you played pull tabs or "paper" games other than lotteries? . . . . . . . . . . . . . . . . . . . . . . . . . . . 2994.222 Within the past year how often have you played dice or coin flips? . . . . . . . . . . . . . . . . . . . . . . . . . . . . . . . . . . . . . . . . . . . 2994.223 Within the past year how often have you played cards (poker, etc.)? . . . . . . . . . . . . . . . . . . . . . . . . . . . . . . . . . . . . . . . . . . 3004.224 Within the past year how often have you bet on a sport? . . . . . . . . . . . . . . . . . . . . . . . . . . . . . . . . . . . . . . . . . . . . . . . . 3004.225 Within the past year how often have you bet on a horse/dog race? . . . . . . . . . . . . . . . . . . . . . . . . . . . . . . . . . . . . . . . . . . . 301
2017-18 Warren County Warren, OH
4.226 Within the past year how often have you bet on games of personal skill (bowling, video games, dares, etc.)? . . . . . . . . . . . . . . . . . . . . 3014.227 Within the past year how often have you played bingo for money? . . . . . . . . . . . . . . . . . . . . . . . . . . . . . . . . . . . . . . . . . . . 3024.228 Within the past year how often have you bet money over the internet? . . . . . . . . . . . . . . . . . . . . . . . . . . . . . . . . . . . . . . . . . 3024.229 Within the past year how often have you bet money in other ways? . . . . . . . . . . . . . . . . . . . . . . . . . . . . . . . . . . . . . . . . . . . 3034.230 Where do you usually gamble? . . . . . . . . . . . . . . . . . . . . . . . . . . . . . . . . . . . . . . . . . . . . . . . . . . . . . . . . . . . . . . 3034.231 Have you ever felt bad about the amount you bet or about what happens when you bet money? . . . . . . . . . . . . . . . . . . . . . . . . . . . 3044.232 Have you ever felt that you would like to stop betting money but didn’t think you could? . . . . . . . . . . . . . . . . . . . . . . . . . . . . . . . . 3044.233 Have you ever lied to anyone about betting or gambling? . . . . . . . . . . . . . . . . . . . . . . . . . . . . . . . . . . . . . . . . . . . . . . . . 3044.234 Have you ever bet or gambled more than you wanted? . . . . . . . . . . . . . . . . . . . . . . . . . . . . . . . . . . . . . . . . . . . . . . . . . 3054.235 While at school have you carried a handgun in the past year? . . . . . . . . . . . . . . . . . . . . . . . . . . . . . . . . . . . . . . . . . . . . . 3064.236 While at school have you carried a knife, club or other weapon in the past year? . . . . . . . . . . . . . . . . . . . . . . . . . . . . . . . . . . . 3064.237 While at school have you threatened a student with a handgun, knife or club in the past year? . . . . . . . . . . . . . . . . . . . . . . . . . . . . 3064.238 While at school have you threatened to hurt a student by hitting, slapping or kicking in the past year? . . . . . . . . . . . . . . . . . . . . . . . . 3074.239 While at school have you hurt a student by using a handgun, knife or club in the past year? . . . . . . . . . . . . . . . . . . . . . . . . . . . . . 3074.240 While at school have you hurt a student by hitting, slapping or kicking in the past year? . . . . . . . . . . . . . . . . . . . . . . . . . . . . . . . . 3074.241 While at school have you been threatened with a handgun, knife or club by a student in the past year? . . . . . . . . . . . . . . . . . . . . . . . 3084.242 While at school have you had a student threaten to hit, slap or kick you in the past year? . . . . . . . . . . . . . . . . . . . . . . . . . . . . . . . 3084.243 While at school have you been afraid a student may hurt you in the past year? . . . . . . . . . . . . . . . . . . . . . . . . . . . . . . . . . . . . 3084.244 While at school have you been hurt by a student using a handgun, knife or club in the past year? . . . . . . . . . . . . . . . . . . . . . . . . . . 3094.245 While at school have you been hurt by a student who hit, slapped or kicked you in the past year? . . . . . . . . . . . . . . . . . . . . . . . . . . 3094.246 In my school, I feel safe in the classroom. . . . . . . . . . . . . . . . . . . . . . . . . . . . . . . . . . . . . . . . . . . . . . . . . . . . . . . . . 3104.247 In my school, I feel safe in the cafeteria (lunchroom). . . . . . . . . . . . . . . . . . . . . . . . . . . . . . . . . . . . . . . . . . . . . . . . . . . 3104.248 In my school, I feel safe in the halls. . . . . . . . . . . . . . . . . . . . . . . . . . . . . . . . . . . . . . . . . . . . . . . . . . . . . . . . . . . . 3104.249 In my school, I feel safe in the bathroom. . . . . . . . . . . . . . . . . . . . . . . . . . . . . . . . . . . . . . . . . . . . . . . . . . . . . . . . . 3114.250 In my school, I feel safe in the gym. . . . . . . . . . . . . . . . . . . . . . . . . . . . . . . . . . . . . . . . . . . . . . . . . . . . . . . . . . . . 3114.251 In my school, I feel safe on the school bus. . . . . . . . . . . . . . . . . . . . . . . . . . . . . . . . . . . . . . . . . . . . . . . . . . . . . . . . 3114.252 In my school, I feel safe at school events (ballgames, etc.). . . . . . . . . . . . . . . . . . . . . . . . . . . . . . . . . . . . . . . . . . . . . . . . 3124.253 In my school, I feel safe in the parking lot. . . . . . . . . . . . . . . . . . . . . . . . . . . . . . . . . . . . . . . . . . . . . . . . . . . . . . . . . 3124.254 Frequency of use of cigarettes? . . . . . . . . . . . . . . . . . . . . . . . . . . . . . . . . . . . . . . . . . . . . . . . . . . . . . . . . . . . . . 3134.255 Frequency of use of smokeless tobacco? . . . . . . . . . . . . . . . . . . . . . . . . . . . . . . . . . . . . . . . . . . . . . . . . . . . . . . . . 3134.256 Frequency of use of cigars? . . . . . . . . . . . . . . . . . . . . . . . . . . . . . . . . . . . . . . . . . . . . . . . . . . . . . . . . . . . . . . . 3134.257 Frequency of use of electronic vapor products? . . . . . . . . . . . . . . . . . . . . . . . . . . . . . . . . . . . . . . . . . . . . . . . . . . . . . 3134.258 Frequency of use of beer? . . . . . . . . . . . . . . . . . . . . . . . . . . . . . . . . . . . . . . . . . . . . . . . . . . . . . . . . . . . . . . . . 3144.259 Frequency of use of coolers, hard lemonade, etc.? . . . . . . . . . . . . . . . . . . . . . . . . . . . . . . . . . . . . . . . . . . . . . . . . . . . 3144.260 Frequency of use of liquor? . . . . . . . . . . . . . . . . . . . . . . . . . . . . . . . . . . . . . . . . . . . . . . . . . . . . . . . . . . . . . . . 3144.261 Frequency of use of marijuana? . . . . . . . . . . . . . . . . . . . . . . . . . . . . . . . . . . . . . . . . . . . . . . . . . . . . . . . . . . . . . 3144.262 Frequency of use of synthetic marijuana? . . . . . . . . . . . . . . . . . . . . . . . . . . . . . . . . . . . . . . . . . . . . . . . . . . . . . . . . 315

4.263 Frequency of use of chemical products (bath salts)? . . . . . . . . . . . . . . . . . . . . . . . . . . . . . . . . . . . . . . . . . . . . . . . . . . 3154.264 Frequency of use of pain medication not prescribed to you? . . . . . . . . . . . . . . . . . . . . . . . . . . . . . . . . . . . . . . . . . . . . . . 3154.265 Frequency of use of stimulant medication not prescribed to you? . . . . . . . . . . . . . . . . . . . . . . . . . . . . . . . . . . . . . . . . . . . . 3154.266 Frequency of use of sleeping medication not prescribed to you? . . . . . . . . . . . . . . . . . . . . . . . . . . . . . . . . . . . . . . . . . . . . 3164.267 Frequency of use of sedative/anxiety medication not prescribed to you? . . . . . . . . . . . . . . . . . . . . . . . . . . . . . . . . . . . . . . . . 3164.268 Frequency of use of over-the-counter drugs to get high? . . . . . . . . . . . . . . . . . . . . . . . . . . . . . . . . . . . . . . . . . . . . . . . . 3164.269 Frequency of use of heroin? . . . . . . . . . . . . . . . . . . . . . . . . . . . . . . . . . . . . . . . . . . . . . . . . . . . . . . . . . . . . . . . 3164.270 Frequency of use of cocaine? . . . . . . . . . . . . . . . . . . . . . . . . . . . . . . . . . . . . . . . . . . . . . . . . . . . . . . . . . . . . . . 3174.271 Frequency of use of inhalants? . . . . . . . . . . . . . . . . . . . . . . . . . . . . . . . . . . . . . . . . . . . . . . . . . . . . . . . . . . . . . . 3174.272 Frequency of use of hallucinogens? . . . . . . . . . . . . . . . . . . . . . . . . . . . . . . . . . . . . . . . . . . . . . . . . . . . . . . . . . . . 3174.273 Frequency of use of steroids? . . . . . . . . . . . . . . . . . . . . . . . . . . . . . . . . . . . . . . . . . . . . . . . . . . . . . . . . . . . . . . 3174.274 Frequency of use of ecstasy? . . . . . . . . . . . . . . . . . . . . . . . . . . . . . . . . . . . . . . . . . . . . . . . . . . . . . . . . . . . . . . 3184.275 Frequency of use of meth? . . . . . . . . . . . . . . . . . . . . . . . . . . . . . . . . . . . . . . . . . . . . . . . . . . . . . . . . . . . . . . . . 3184.276 Frequency of use of any tobacco? . . . . . . . . . . . . . . . . . . . . . . . . . . . . . . . . . . . . . . . . . . . . . . . . . . . . . . . . . . . . 3184.277 Frequency of use of any alcohol? . . . . . . . . . . . . . . . . . . . . . . . . . . . . . . . . . . . . . . . . . . . . . . . . . . . . . . . . . . . . 3184.278 Frequency of use of any illicit drug? . . . . . . . . . . . . . . . . . . . . . . . . . . . . . . . . . . . . . . . . . . . . . . . . . . . . . . . . . . . 319
5.1 Core Measure for 30 Day Use by Grade . . . . . . . . . . . . . . . . . . . . . . . . . . . . . . . . . . . . . . . . . . . . . . . . . . . . . . . . . 3215.2 Core Measure for 30 Day Use by Sex . . . . . . . . . . . . . . . . . . . . . . . . . . . . . . . . . . . . . . . . . . . . . . . . . . . . . . . . . . 3215.3 Core Measure of Perception of Risk by Grade . . . . . . . . . . . . . . . . . . . . . . . . . . . . . . . . . . . . . . . . . . . . . . . . . . . . . . 3225.4 Core Measure of Perception of Risk by Sex . . . . . . . . . . . . . . . . . . . . . . . . . . . . . . . . . . . . . . . . . . . . . . . . . . . . . . . 3225.5 Core Measure of Parental Disapproval by Grade . . . . . . . . . . . . . . . . . . . . . . . . . . . . . . . . . . . . . . . . . . . . . . . . . . . . 3235.6 Core Measure of Parental Disapproval by Sex . . . . . . . . . . . . . . . . . . . . . . . . . . . . . . . . . . . . . . . . . . . . . . . . . . . . . . 3235.7 Core Measure of Friends Disapproval by Grade . . . . . . . . . . . . . . . . . . . . . . . . . . . . . . . . . . . . . . . . . . . . . . . . . . . . . 3245.8 Core Measure of Friends Disapproval by Sex . . . . . . . . . . . . . . . . . . . . . . . . . . . . . . . . . . . . . . . . . . . . . . . . . . . . . . 3245.9 Core Measure of Age of Onset by Grade . . . . . . . . . . . . . . . . . . . . . . . . . . . . . . . . . . . . . . . . . . . . . . . . . . . . . . . . 3255.10 Core Measure of Age of Onset by Sex . . . . . . . . . . . . . . . . . . . . . . . . . . . . . . . . . . . . . . . . . . . . . . . . . . . . . . . . . . 3255.11 Students Perception of Availability by Grade . . . . . . . . . . . . . . . . . . . . . . . . . . . . . . . . . . . . . . . . . . . . . . . . . . . . . . . 3265.12 Students Perception of Availability by Sex . . . . . . . . . . . . . . . . . . . . . . . . . . . . . . . . . . . . . . . . . . . . . . . . . . . . . . . . 326
xiii

2017-18 Warren County Warren, OH
List of Figures
3.1 Annual Use of Any Tobacco, Any Alcohol and Any Illicit Drug . . . . . . . . . . . . . . . . . . . . . . . . . . . . . . . . . . . . . . . . . . . . . . 263.2 Annual Use of Cigarettes, Smokeless Tobacco, Cigars and Vapor Products . . . . . . . . . . . . . . . . . . . . . . . . . . . . . . . . . . . . . . 273.3 Annual Use of Beer, Coolers, Liquor and Binge Drinking . . . . . . . . . . . . . . . . . . . . . . . . . . . . . . . . . . . . . . . . . . . . . . . . 283.4 Annual Use of Marijuana, Synthetic Marijuana and Bath Salts . . . . . . . . . . . . . . . . . . . . . . . . . . . . . . . . . . . . . . . . . . . . . 293.5 Annual Use of Pain Medication, Stimulants, . . . . . . . . . . . . . . . . . . . . . . . . . . . . . . . . . . . . . . . . . . . . . . . . . . . . . . . 303.6 Annual Use of Heroin, Cocaine, Inhalants and Hallucinogens . . . . . . . . . . . . . . . . . . . . . . . . . . . . . . . . . . . . . . . . . . . . . . 313.7 Annual Use of Steroids, Ecstasy and Meth . . . . . . . . . . . . . . . . . . . . . . . . . . . . . . . . . . . . . . . . . . . . . . . . . . . . . . . 323.8 30-Day Use of Cigarettes, Alcohol, Marijuana and Prescription Drugs . . . . . . . . . . . . . . . . . . . . . . . . . . . . . . . . . . . . . . . . . 343.9 Perception of Harm – Cigarettes . . . . . . . . . . . . . . . . . . . . . . . . . . . . . . . . . . . . . . . . . . . . . . . . . . . . . . . . . . . . . 363.10 Perception of Harm – Smokeless Tobacco . . . . . . . . . . . . . . . . . . . . . . . . . . . . . . . . . . . . . . . . . . . . . . . . . . . . . . . . 373.11 Perception of Harm – Cigars . . . . . . . . . . . . . . . . . . . . . . . . . . . . . . . . . . . . . . . . . . . . . . . . . . . . . . . . . . . . . . . 383.12 Perception of Harm – Electronic Vapor Products . . . . . . . . . . . . . . . . . . . . . . . . . . . . . . . . . . . . . . . . . . . . . . . . . . . . 393.13 Perception of Harm – Beer . . . . . . . . . . . . . . . . . . . . . . . . . . . . . . . . . . . . . . . . . . . . . . . . . . . . . . . . . . . . . . . . 403.14 Perception of Harm – Coolers, Hard Lemonade, etc. . . . . . . . . . . . . . . . . . . . . . . . . . . . . . . . . . . . . . . . . . . . . . . . . . . 413.15 Perception of Harm – Liquor . . . . . . . . . . . . . . . . . . . . . . . . . . . . . . . . . . . . . . . . . . . . . . . . . . . . . . . . . . . . . . . 423.16 Perception of Harm – Marijuana . . . . . . . . . . . . . . . . . . . . . . . . . . . . . . . . . . . . . . . . . . . . . . . . . . . . . . . . . . . . . 433.17 Perception of Harm – Synthetic Marijuana . . . . . . . . . . . . . . . . . . . . . . . . . . . . . . . . . . . . . . . . . . . . . . . . . . . . . . . . 443.18 Perception of Harm – Bath Salts . . . . . . . . . . . . . . . . . . . . . . . . . . . . . . . . . . . . . . . . . . . . . . . . . . . . . . . . . . . . . 453.19 Perception of Harm – Prescription Drugs . . . . . . . . . . . . . . . . . . . . . . . . . . . . . . . . . . . . . . . . . . . . . . . . . . . . . . . . 463.20 Perception of Harm – Over-the-Counter . . . . . . . . . . . . . . . . . . . . . . . . . . . . . . . . . . . . . . . . . . . . . . . . . . . . . . . . . 473.21 Perception of Harm – Heroin . . . . . . . . . . . . . . . . . . . . . . . . . . . . . . . . . . . . . . . . . . . . . . . . . . . . . . . . . . . . . . . 483.22 Perception of Harm – Cocaine . . . . . . . . . . . . . . . . . . . . . . . . . . . . . . . . . . . . . . . . . . . . . . . . . . . . . . . . . . . . . . 493.23 Perception of Harm – Inhalants . . . . . . . . . . . . . . . . . . . . . . . . . . . . . . . . . . . . . . . . . . . . . . . . . . . . . . . . . . . . . 503.24 Perception of Harm – Hallucinogens . . . . . . . . . . . . . . . . . . . . . . . . . . . . . . . . . . . . . . . . . . . . . . . . . . . . . . . . . . . 513.25 Perception of Harm – Steroids . . . . . . . . . . . . . . . . . . . . . . . . . . . . . . . . . . . . . . . . . . . . . . . . . . . . . . . . . . . . . . 523.26 Perception of Harm – Ecstasy . . . . . . . . . . . . . . . . . . . . . . . . . . . . . . . . . . . . . . . . . . . . . . . . . . . . . . . . . . . . . . 533.27 Perception of Harm – Meth . . . . . . . . . . . . . . . . . . . . . . . . . . . . . . . . . . . . . . . . . . . . . . . . . . . . . . . . . . . . . . . . 543.28 Perception of Parental Disapproval – Use Alcohol . . . . . . . . . . . . . . . . . . . . . . . . . . . . . . . . . . . . . . . . . . . . . . . . . . . . 56

2017-18 Warren County Warren, OH
3.29 Perception of Parental Disapproval – Binge Alcohol . . . . . . . . . . . . . . . . . . . . . . . . . . . . . . . . . . . . . . . . . . . . . . . . . . . 573.30 Perception of Parental Disapproval – Use Any Tobacco . . . . . . . . . . . . . . . . . . . . . . . . . . . . . . . . . . . . . . . . . . . . . . . . . 583.31 Perception of Parental Disapproval – Smoke Tobacco . . . . . . . . . . . . . . . . . . . . . . . . . . . . . . . . . . . . . . . . . . . . . . . . . . 593.32 Perception of Parental Disapproval – Use electronic vapor products . . . . . . . . . . . . . . . . . . . . . . . . . . . . . . . . . . . . . . . . . . 603.33 Perception of Parental Disapproval – Smoke Marijuana . . . . . . . . . . . . . . . . . . . . . . . . . . . . . . . . . . . . . . . . . . . . . . . . . 613.34 Perception of Parental Disapproval – Use Prescription Drugs . . . . . . . . . . . . . . . . . . . . . . . . . . . . . . . . . . . . . . . . . . . . . . 623.35 Perception of Parental Disapproval – Use Other Illicit Drugs . . . . . . . . . . . . . . . . . . . . . . . . . . . . . . . . . . . . . . . . . . . . . . 633.36 Perception of Parental Disapproval – Gamble anything of value . . . . . . . . . . . . . . . . . . . . . . . . . . . . . . . . . . . . . . . . . . . . 643.37 Perception of Friends Disapproval – Use Alcohol . . . . . . . . . . . . . . . . . . . . . . . . . . . . . . . . . . . . . . . . . . . . . . . . . . . . 663.38 Perception of Friends Disapproval – Binge Alcohol . . . . . . . . . . . . . . . . . . . . . . . . . . . . . . . . . . . . . . . . . . . . . . . . . . . 673.39 Perception of Friends Disapproval – Use Any Tobacco . . . . . . . . . . . . . . . . . . . . . . . . . . . . . . . . . . . . . . . . . . . . . . . . . 683.40 Perception of Friends Disapproval – Smoke Tobacco . . . . . . . . . . . . . . . . . . . . . . . . . . . . . . . . . . . . . . . . . . . . . . . . . . 693.41 Perception of Friends Disapproval – Use electronic vapor products . . . . . . . . . . . . . . . . . . . . . . . . . . . . . . . . . . . . . . . . . . . 703.42 Perception of Friends Disapproval – Smoke Marijuana . . . . . . . . . . . . . . . . . . . . . . . . . . . . . . . . . . . . . . . . . . . . . . . . . 713.43 Perception of Friends Disapproval – Use Prescription Drugs . . . . . . . . . . . . . . . . . . . . . . . . . . . . . . . . . . . . . . . . . . . . . . 723.44 Perception of Friends Disapproval – Use Other Illicit Drugs . . . . . . . . . . . . . . . . . . . . . . . . . . . . . . . . . . . . . . . . . . . . . . . 733.45 Perception of Friends Disapproval – Gamble anything of value . . . . . . . . . . . . . . . . . . . . . . . . . . . . . . . . . . . . . . . . . . . . . 743.46 Average Age of Onset of Use of Any Tobacco . . . . . . . . . . . . . . . . . . . . . . . . . . . . . . . . . . . . . . . . . . . . . . . . . . . . . . 763.47 Average Age of Onset of Use of Any Alcohol . . . . . . . . . . . . . . . . . . . . . . . . . . . . . . . . . . . . . . . . . . . . . . . . . . . . . . 773.48 Average Age of Onset of Use of Any Illicit Drug . . . . . . . . . . . . . . . . . . . . . . . . . . . . . . . . . . . . . . . . . . . . . . . . . . . . . 783.49 Average Age of Onset of Use of Cigarettes . . . . . . . . . . . . . . . . . . . . . . . . . . . . . . . . . . . . . . . . . . . . . . . . . . . . . . . 793.50 Average Age of Onset of Use of Smokeless Tobacco . . . . . . . . . . . . . . . . . . . . . . . . . . . . . . . . . . . . . . . . . . . . . . . . . . 803.51 Average Age of Onset of Use of Cigars . . . . . . . . . . . . . . . . . . . . . . . . . . . . . . . . . . . . . . . . . . . . . . . . . . . . . . . . . 813.52 Average Age of Onset of Use of Electronic Vapor Products . . . . . . . . . . . . . . . . . . . . . . . . . . . . . . . . . . . . . . . . . . . . . . . 823.53 Average Age of Onset of Use of Beer . . . . . . . . . . . . . . . . . . . . . . . . . . . . . . . . . . . . . . . . . . . . . . . . . . . . . . . . . . 833.54 Average Age of Onset of Use of Coolers, Hard Lemonade, etc. . . . . . . . . . . . . . . . . . . . . . . . . . . . . . . . . . . . . . . . . . . . . . 843.55 Average Age of Onset of Use of Liquor . . . . . . . . . . . . . . . . . . . . . . . . . . . . . . . . . . . . . . . . . . . . . . . . . . . . . . . . . 853.56 Average Age of Onset of Use of Marijuana . . . . . . . . . . . . . . . . . . . . . . . . . . . . . . . . . . . . . . . . . . . . . . . . . . . . . . . 863.57 Average Age of Onset of Use of Synthetic Marijuana . . . . . . . . . . . . . . . . . . . . . . . . . . . . . . . . . . . . . . . . . . . . . . . . . . 873.58 Average Age of Onset of Use of Bath Salts . . . . . . . . . . . . . . . . . . . . . . . . . . . . . . . . . . . . . . . . . . . . . . . . . . . . . . . 883.59 Average Age of Onset of Use of Prescription Drugs . . . . . . . . . . . . . . . . . . . . . . . . . . . . . . . . . . . . . . . . . . . . . . . . . . . 893.60 Average Age of Onset of Use of Over-the-Counter . . . . . . . . . . . . . . . . . . . . . . . . . . . . . . . . . . . . . . . . . . . . . . . . . . . 903.61 Average Age of Onset of Use of Heroin . . . . . . . . . . . . . . . . . . . . . . . . . . . . . . . . . . . . . . . . . . . . . . . . . . . . . . . . . 913.62 Average Age of Onset of Use of Cocaine . . . . . . . . . . . . . . . . . . . . . . . . . . . . . . . . . . . . . . . . . . . . . . . . . . . . . . . . 923.63 Average Age of Onset of Use of Inhalants . . . . . . . . . . . . . . . . . . . . . . . . . . . . . . . . . . . . . . . . . . . . . . . . . . . . . . . . 933.64 Average Age of Onset of Use of Hallucinogens . . . . . . . . . . . . . . . . . . . . . . . . . . . . . . . . . . . . . . . . . . . . . . . . . . . . . 943.65 Average Age of Onset of Use of Steroids . . . . . . . . . . . . . . . . . . . . . . . . . . . . . . . . . . . . . . . . . . . . . . . . . . . . . . . . 95

2017-18 Warren County Warren, OH
3.66 Average Age of Onset of Use of Ecstasy . . . . . . . . . . . . . . . . . . . . . . . . . . . . . . . . . . . . . . . . . . . . . . . . . . . . . . . . . 963.67 Average Age of Onset of Use of Meth . . . . . . . . . . . . . . . . . . . . . . . . . . . . . . . . . . . . . . . . . . . . . . . . . . . . . . . . . . 973.68 Attend Church or Synagogue . . . . . . . . . . . . . . . . . . . . . . . . . . . . . . . . . . . . . . . . . . . . . . . . . . . . . . . . . . . . . . . 993.69 Take Part in Community Activities . . . . . . . . . . . . . . . . . . . . . . . . . . . . . . . . . . . . . . . . . . . . . . . . . . . . . . . . . . . . 1003.70 Make Good Grades . . . . . . . . . . . . . . . . . . . . . . . . . . . . . . . . . . . . . . . . . . . . . . . . . . . . . . . . . . . . . . . . . . . . 1013.71 Take Part in Sports Teams . . . . . . . . . . . . . . . . . . . . . . . . . . . . . . . . . . . . . . . . . . . . . . . . . . . . . . . . . . . . . . . . 1023.72 Take Part in School Activities . . . . . . . . . . . . . . . . . . . . . . . . . . . . . . . . . . . . . . . . . . . . . . . . . . . . . . . . . . . . . . . 1033.73 Get in Trouble at School . . . . . . . . . . . . . . . . . . . . . . . . . . . . . . . . . . . . . . . . . . . . . . . . . . . . . . . . . . . . . . . . . 1043.74 Teachers Talk About the Dangers of Drugs . . . . . . . . . . . . . . . . . . . . . . . . . . . . . . . . . . . . . . . . . . . . . . . . . . . . . . . 1053.75 Parents Talk About the Dangers of Drugs . . . . . . . . . . . . . . . . . . . . . . . . . . . . . . . . . . . . . . . . . . . . . . . . . . . . . . . . 1063.76 Parents Set Clear Rules . . . . . . . . . . . . . . . . . . . . . . . . . . . . . . . . . . . . . . . . . . . . . . . . . . . . . . . . . . . . . . . . . 1073.77 Parents Punish for Breaking Rules . . . . . . . . . . . . . . . . . . . . . . . . . . . . . . . . . . . . . . . . . . . . . . . . . . . . . . . . . . . . 1083.78 How Often Do You Experience Stress In Your Life . . . . . . . . . . . . . . . . . . . . . . . . . . . . . . . . . . . . . . . . . . . . . . . . . . . . 1093.79 Availability – Any Tobacco . . . . . . . . . . . . . . . . . . . . . . . . . . . . . . . . . . . . . . . . . . . . . . . . . . . . . . . . . . . . . . . . 1113.80 Availability – Electronic Vapor Products . . . . . . . . . . . . . . . . . . . . . . . . . . . . . . . . . . . . . . . . . . . . . . . . . . . . . . . . . 1123.81 Availability – Any Alcohol . . . . . . . . . . . . . . . . . . . . . . . . . . . . . . . . . . . . . . . . . . . . . . . . . . . . . . . . . . . . . . . . . 1133.82 Availability – Marijuana . . . . . . . . . . . . . . . . . . . . . . . . . . . . . . . . . . . . . . . . . . . . . . . . . . . . . . . . . . . . . . . . . . 1143.83 Availability – Prescription Drugs . . . . . . . . . . . . . . . . . . . . . . . . . . . . . . . . . . . . . . . . . . . . . . . . . . . . . . . . . . . . . 1153.84 Availability – Other Illicit Drugs . . . . . . . . . . . . . . . . . . . . . . . . . . . . . . . . . . . . . . . . . . . . . . . . . . . . . . . . . . . . . . 1163.85 Where Do You Use Any Tobacco . . . . . . . . . . . . . . . . . . . . . . . . . . . . . . . . . . . . . . . . . . . . . . . . . . . . . . . . . . . . . 1183.86 Where Do You Use Any Alcohol . . . . . . . . . . . . . . . . . . . . . . . . . . . . . . . . . . . . . . . . . . . . . . . . . . . . . . . . . . . . . 1193.87 Where Do You Use Any Illicit Drug . . . . . . . . . . . . . . . . . . . . . . . . . . . . . . . . . . . . . . . . . . . . . . . . . . . . . . . . . . . . 1203.88 Where Do You Use Cigarettes . . . . . . . . . . . . . . . . . . . . . . . . . . . . . . . . . . . . . . . . . . . . . . . . . . . . . . . . . . . . . . 1213.89 Where Do You Use Smokeless Tobacco . . . . . . . . . . . . . . . . . . . . . . . . . . . . . . . . . . . . . . . . . . . . . . . . . . . . . . . . . 1223.90 Where Do You Use Cigars . . . . . . . . . . . . . . . . . . . . . . . . . . . . . . . . . . . . . . . . . . . . . . . . . . . . . . . . . . . . . . . . 1233.91 Where Do You Use Electronic Vapor Products . . . . . . . . . . . . . . . . . . . . . . . . . . . . . . . . . . . . . . . . . . . . . . . . . . . . . . 1243.92 Where Do You Use Beer . . . . . . . . . . . . . . . . . . . . . . . . . . . . . . . . . . . . . . . . . . . . . . . . . . . . . . . . . . . . . . . . . 1253.93 Where Do You Use Coolers, Hard Lemonade, etc. . . . . . . . . . . . . . . . . . . . . . . . . . . . . . . . . . . . . . . . . . . . . . . . . . . . 1263.94 Where Do You Use Liquor . . . . . . . . . . . . . . . . . . . . . . . . . . . . . . . . . . . . . . . . . . . . . . . . . . . . . . . . . . . . . . . . 1273.95 Where Do You Use Marijuana . . . . . . . . . . . . . . . . . . . . . . . . . . . . . . . . . . . . . . . . . . . . . . . . . . . . . . . . . . . . . . 1283.96 Where Do You Use Synthetic Marijuana . . . . . . . . . . . . . . . . . . . . . . . . . . . . . . . . . . . . . . . . . . . . . . . . . . . . . . . . . 1293.97 Where Do You Use Bath Salts . . . . . . . . . . . . . . . . . . . . . . . . . . . . . . . . . . . . . . . . . . . . . . . . . . . . . . . . . . . . . . 1303.98 Where Do You Use Prescription Drugs . . . . . . . . . . . . . . . . . . . . . . . . . . . . . . . . . . . . . . . . . . . . . . . . . . . . . . . . . . 1313.99 Where Do You Use Over-the-Counter . . . . . . . . . . . . . . . . . . . . . . . . . . . . . . . . . . . . . . . . . . . . . . . . . . . . . . . . . . 1323.100 Where Do You Use Heroin . . . . . . . . . . . . . . . . . . . . . . . . . . . . . . . . . . . . . . . . . . . . . . . . . . . . . . . . . . . . . . . . 1333.101 Where Do You Use Cocaine . . . . . . . . . . . . . . . . . . . . . . . . . . . . . . . . . . . . . . . . . . . . . . . . . . . . . . . . . . . . . . . 1343.102 Where Do You Use Inhalants . . . . . . . . . . . . . . . . . . . . . . . . . . . . . . . . . . . . . . . . . . . . . . . . . . . . . . . . . . . . . . . 135

2017-18 Warren County Warren, OH
3.103 Where Do You Use Hallucinogens . . . . . . . . . . . . . . . . . . . . . . . . . . . . . . . . . . . . . . . . . . . . . . . . . . . . . . . . . . . . 1363.104 Where Do You Use Steroids . . . . . . . . . . . . . . . . . . . . . . . . . . . . . . . . . . . . . . . . . . . . . . . . . . . . . . . . . . . . . . . 1373.105 Where Do You Use Ecstasy . . . . . . . . . . . . . . . . . . . . . . . . . . . . . . . . . . . . . . . . . . . . . . . . . . . . . . . . . . . . . . . 1383.106 Where Do You Use Meth . . . . . . . . . . . . . . . . . . . . . . . . . . . . . . . . . . . . . . . . . . . . . . . . . . . . . . . . . . . . . . . . . 1393.107 When Do You Use Any Tobacco . . . . . . . . . . . . . . . . . . . . . . . . . . . . . . . . . . . . . . . . . . . . . . . . . . . . . . . . . . . . . 1413.108 When Do You Use Any Alcohol . . . . . . . . . . . . . . . . . . . . . . . . . . . . . . . . . . . . . . . . . . . . . . . . . . . . . . . . . . . . . . 1423.109 When Do You Use Any Illicit Drug . . . . . . . . . . . . . . . . . . . . . . . . . . . . . . . . . . . . . . . . . . . . . . . . . . . . . . . . . . . . 1433.110 When Do You Use Cigarettes . . . . . . . . . . . . . . . . . . . . . . . . . . . . . . . . . . . . . . . . . . . . . . . . . . . . . . . . . . . . . . 1443.111 When Do You Use Smokeless Tobacco . . . . . . . . . . . . . . . . . . . . . . . . . . . . . . . . . . . . . . . . . . . . . . . . . . . . . . . . . 1453.112 When Do You Use Cigars . . . . . . . . . . . . . . . . . . . . . . . . . . . . . . . . . . . . . . . . . . . . . . . . . . . . . . . . . . . . . . . . 1463.113 When Do You Use Electronic Vapor Products . . . . . . . . . . . . . . . . . . . . . . . . . . . . . . . . . . . . . . . . . . . . . . . . . . . . . . 1473.114 When Do You Use Beer . . . . . . . . . . . . . . . . . . . . . . . . . . . . . . . . . . . . . . . . . . . . . . . . . . . . . . . . . . . . . . . . . 1483.115 When Do You Use Coolers, Hard Lemonade, etc. . . . . . . . . . . . . . . . . . . . . . . . . . . . . . . . . . . . . . . . . . . . . . . . . . . . . 1493.116 When Do You Use Liquor . . . . . . . . . . . . . . . . . . . . . . . . . . . . . . . . . . . . . . . . . . . . . . . . . . . . . . . . . . . . . . . . . 1503.117 When Do You Use Marijuana . . . . . . . . . . . . . . . . . . . . . . . . . . . . . . . . . . . . . . . . . . . . . . . . . . . . . . . . . . . . . . . 1513.118 When Do You Use Synthetic Marijuana . . . . . . . . . . . . . . . . . . . . . . . . . . . . . . . . . . . . . . . . . . . . . . . . . . . . . . . . . 1523.119 When Do You Use Bath Salts . . . . . . . . . . . . . . . . . . . . . . . . . . . . . . . . . . . . . . . . . . . . . . . . . . . . . . . . . . . . . . 1533.120 When Do You Use Prescription Drugs . . . . . . . . . . . . . . . . . . . . . . . . . . . . . . . . . . . . . . . . . . . . . . . . . . . . . . . . . . 1543.121 When Do You Use Over-the-Counter . . . . . . . . . . . . . . . . . . . . . . . . . . . . . . . . . . . . . . . . . . . . . . . . . . . . . . . . . . . 1553.122 When Do You Use Heroin . . . . . . . . . . . . . . . . . . . . . . . . . . . . . . . . . . . . . . . . . . . . . . . . . . . . . . . . . . . . . . . . 1563.123 When Do You Use Cocaine . . . . . . . . . . . . . . . . . . . . . . . . . . . . . . . . . . . . . . . . . . . . . . . . . . . . . . . . . . . . . . . . 1573.124 When Do You Use Inhalants . . . . . . . . . . . . . . . . . . . . . . . . . . . . . . . . . . . . . . . . . . . . . . . . . . . . . . . . . . . . . . . 1583.125 When Do You Use Hallucinogens . . . . . . . . . . . . . . . . . . . . . . . . . . . . . . . . . . . . . . . . . . . . . . . . . . . . . . . . . . . . 1593.126 When Do You Use Steroids . . . . . . . . . . . . . . . . . . . . . . . . . . . . . . . . . . . . . . . . . . . . . . . . . . . . . . . . . . . . . . . . 1603.127 When Do You Use Ecstasy . . . . . . . . . . . . . . . . . . . . . . . . . . . . . . . . . . . . . . . . . . . . . . . . . . . . . . . . . . . . . . . . 1613.128 When Do You Use Meth . . . . . . . . . . . . . . . . . . . . . . . . . . . . . . . . . . . . . . . . . . . . . . . . . . . . . . . . . . . . . . . . . 1623.129 Annual Use of Any Tobacco by Gender . . . . . . . . . . . . . . . . . . . . . . . . . . . . . . . . . . . . . . . . . . . . . . . . . . . . . . . . . 1643.130 Annual Use of Cigarettes by Gender . . . . . . . . . . . . . . . . . . . . . . . . . . . . . . . . . . . . . . . . . . . . . . . . . . . . . . . . . . . 1653.131 Annual Use of Smokeless Tobacco by Gender . . . . . . . . . . . . . . . . . . . . . . . . . . . . . . . . . . . . . . . . . . . . . . . . . . . . . 1663.132 Annual Use of Cigars by Gender . . . . . . . . . . . . . . . . . . . . . . . . . . . . . . . . . . . . . . . . . . . . . . . . . . . . . . . . . . . . . 1673.133 Annual Use of Electronic Vapor Products by Gender . . . . . . . . . . . . . . . . . . . . . . . . . . . . . . . . . . . . . . . . . . . . . . . . . . 1683.134 Annual Use of Any Alcohol by Gender . . . . . . . . . . . . . . . . . . . . . . . . . . . . . . . . . . . . . . . . . . . . . . . . . . . . . . . . . . 1693.135 Annual Use of Beer by Gender . . . . . . . . . . . . . . . . . . . . . . . . . . . . . . . . . . . . . . . . . . . . . . . . . . . . . . . . . . . . . . 1703.136 Annual Use of Coolers, Hard Lemonade, etc. by Gender . . . . . . . . . . . . . . . . . . . . . . . . . . . . . . . . . . . . . . . . . . . . . . . . 1713.137 Annual Use of Liquor by Gender . . . . . . . . . . . . . . . . . . . . . . . . . . . . . . . . . . . . . . . . . . . . . . . . . . . . . . . . . . . . . 1723.138 Annual Use of Any Illicit Drug by Gender . . . . . . . . . . . . . . . . . . . . . . . . . . . . . . . . . . . . . . . . . . . . . . . . . . . . . . . . 1733.139 Annual Use of Marijuana by Gender . . . . . . . . . . . . . . . . . . . . . . . . . . . . . . . . . . . . . . . . . . . . . . . . . . . . . . . . . . . 174

2017-18 Warren County Warren, OH
3.140 Annual Use of Synthetic Marijuana by Gender . . . . . . . . . . . . . . . . . . . . . . . . . . . . . . . . . . . . . . . . . . . . . . . . . . . . . . 1753.141 Annual Use of Bath Salts by Gender . . . . . . . . . . . . . . . . . . . . . . . . . . . . . . . . . . . . . . . . . . . . . . . . . . . . . . . . . . . 1763.142 Annual Use of Pain Meds. by Gender . . . . . . . . . . . . . . . . . . . . . . . . . . . . . . . . . . . . . . . . . . . . . . . . . . . . . . . . . . 1773.143 Annual Use of Stimulants by Gender . . . . . . . . . . . . . . . . . . . . . . . . . . . . . . . . . . . . . . . . . . . . . . . . . . . . . . . . . . . 1783.144 Annual Use of Sleeping Meds. by Gender . . . . . . . . . . . . . . . . . . . . . . . . . . . . . . . . . . . . . . . . . . . . . . . . . . . . . . . . 1793.145 Annual Use of Sedatives by Gender . . . . . . . . . . . . . . . . . . . . . . . . . . . . . . . . . . . . . . . . . . . . . . . . . . . . . . . . . . . 1803.146 Annual Use of Over-the-Counter by Gender . . . . . . . . . . . . . . . . . . . . . . . . . . . . . . . . . . . . . . . . . . . . . . . . . . . . . . . 1813.147 Annual Use of Heroin by Gender . . . . . . . . . . . . . . . . . . . . . . . . . . . . . . . . . . . . . . . . . . . . . . . . . . . . . . . . . . . . . 1823.148 Annual Use of Cocaine by Gender . . . . . . . . . . . . . . . . . . . . . . . . . . . . . . . . . . . . . . . . . . . . . . . . . . . . . . . . . . . . 1833.149 Annual Use of Inhalants by Gender . . . . . . . . . . . . . . . . . . . . . . . . . . . . . . . . . . . . . . . . . . . . . . . . . . . . . . . . . . . 1843.150 Annual Use of Hallucinogens by Gender . . . . . . . . . . . . . . . . . . . . . . . . . . . . . . . . . . . . . . . . . . . . . . . . . . . . . . . . . 1853.151 Annual Use of Steroids by Gender . . . . . . . . . . . . . . . . . . . . . . . . . . . . . . . . . . . . . . . . . . . . . . . . . . . . . . . . . . . . 1863.152 Annual Use of Ecstasy by Gender . . . . . . . . . . . . . . . . . . . . . . . . . . . . . . . . . . . . . . . . . . . . . . . . . . . . . . . . . . . . 1873.153 Annual Use of Meth by Gender . . . . . . . . . . . . . . . . . . . . . . . . . . . . . . . . . . . . . . . . . . . . . . . . . . . . . . . . . . . . . . 1883.154 Attend Church or Synagogue . . . . . . . . . . . . . . . . . . . . . . . . . . . . . . . . . . . . . . . . . . . . . . . . . . . . . . . . . . . . . . . 1903.155 Take Part in Community Activities . . . . . . . . . . . . . . . . . . . . . . . . . . . . . . . . . . . . . . . . . . . . . . . . . . . . . . . . . . . . 1913.156 Make Good Grades . . . . . . . . . . . . . . . . . . . . . . . . . . . . . . . . . . . . . . . . . . . . . . . . . . . . . . . . . . . . . . . . . . . . 1923.157 Take Part in Sports Teams . . . . . . . . . . . . . . . . . . . . . . . . . . . . . . . . . . . . . . . . . . . . . . . . . . . . . . . . . . . . . . . . 1933.158 Take Part in School Activities . . . . . . . . . . . . . . . . . . . . . . . . . . . . . . . . . . . . . . . . . . . . . . . . . . . . . . . . . . . . . . . 1943.159 Get Into Trouble at School . . . . . . . . . . . . . . . . . . . . . . . . . . . . . . . . . . . . . . . . . . . . . . . . . . . . . . . . . . . . . . . . 1953.160 Teachers Talk About Dangers of Drugs . . . . . . . . . . . . . . . . . . . . . . . . . . . . . . . . . . . . . . . . . . . . . . . . . . . . . . . . . 1963.161 Parents Talk About Dangers of Drugs . . . . . . . . . . . . . . . . . . . . . . . . . . . . . . . . . . . . . . . . . . . . . . . . . . . . . . . . . . 1973.162 Parents Set Clear Rules . . . . . . . . . . . . . . . . . . . . . . . . . . . . . . . . . . . . . . . . . . . . . . . . . . . . . . . . . . . . . . . . . 1983.163 Parents Punish for Breaking Rules . . . . . . . . . . . . . . . . . . . . . . . . . . . . . . . . . . . . . . . . . . . . . . . . . . . . . . . . . . . . 1993.164 Drug Use of Students Who Reported Carrying a Gun to School . . . . . . . . . . . . . . . . . . . . . . . . . . . . . . . . . . . . . . . . . . . . 2013.165 Drug Use of Students Who Reported Involvement in Gangs . . . . . . . . . . . . . . . . . . . . . . . . . . . . . . . . . . . . . . . . . . . . . . 2023.166 Drug Use of Students Who Reported Threatening/Harmful Behaviors . . . . . . . . . . . . . . . . . . . . . . . . . . . . . . . . . . . . . . . . . 2033.167 Drug Use of Students Who Reported Trouble with Police . . . . . . . . . . . . . . . . . . . . . . . . . . . . . . . . . . . . . . . . . . . . . . . . 2043.168 Where Do You Usually Gamble . . . . . . . . . . . . . . . . . . . . . . . . . . . . . . . . . . . . . . . . . . . . . . . . . . . . . . . . . . . . . . 2073.169 Where Do You Usually Gamble (continued) . . . . . . . . . . . . . . . . . . . . . . . . . . . . . . . . . . . . . . . . . . . . . . . . . . . . . . . 208

Chapter 1
Introduction
This report contains data collected in your school(s) using the Prevention-FIRST! Survey developed in conjunction with Pride Surveys. Your reports areorganized as follows:
1. A Summary that provides you with the fundamental findings in an ab-breviated and easy to read fashion.
2. Color Graphs that provide more expansive results from the survey inpictorial fashion.
3. A List of Tables which contains the complete findings of the survey. Thissection itemizes student responses by each grade level and each itemscale (for example: never, seldom, sometimes, often and a lot).
4. A Narrative Report which includes both text and graphic images. Thissection also includes a sample news release.
Additionally, the report contains a special section entitled Drug Free Com-munities Support Program. This section was developed to provide the dataneeded to satisfy core measures required by the Drug Free Communities Sup-port Program, administered by the Substance Abuse and Mental Health Ser-vices Administration. NOTE: Federal requirements have changed in regard towhat questions should be used for reporting purposes. In particular, Past 30Day Use is now calculated using a different question than has been used inthe past. All references to past 30 day use will be based on the new questions.
It should also be noted that perception of harm and perception of risk mea-sures similar constructs. Both of these sets of questions have been includedin this survey to make it possible to compare to past data.
This year, Pride Surveys in consultation with PreventionFIRST! has madechanges to the dubious and discrepancy checks (honesty checks) for theCincinnati PreventionFIRST! survey. You will notice some significant changesin student data from previous years and should note that longitudinal data willnot be reflective of actual changes in use over time. This change was madeto improve the quality of the data and is a more accurate reflection of actualuse since more dishonest surveys have been excluded from the data set thanin previous years.
This year’s data can be considered a new "baseline" moving forward andwill improve the accuracy of the results overall for all participants and stake-holders. If you would like more information about what the checks are and howthe dishonest threshold is calculated please email [email protected].
18

Pride Surveys Report: 2017-18 Warren County
1.1 How To Use Your Data
• Meet the accountability requirements of federal and state agencies thatyour programs be evidence-based.
• Establish a needs assessment to design and secure funding for newprograms.
• Conduct periodic performance evaluations for continuing programs.
• Encourage community-wide support for your programs.
• Determine why negative student behaviors occur by examining risk andprotective factors.
Table 1.1: Number of Students SurveyedGrade Grade Total Male Female7 1419 682 7208 1490 749 7189 1095 560 52010 770 385 37211 490 225 25712 470 251 2107-8 2909 1431 14389-12 2825 1421 1359Total 5734 2852 2797
We recommend that you share the findings of your survey with staff/faculty,administration, boards of education, elected officials, parents, community or-ganizations and the news media.
While the findings are likely to show that certain problems exist within yourstudent population, the overriding message will be that you are taking a fact-based approach to understand and solve these problems.
If you have questions about this report or if you wish to have informationon other Pride Surveys services and products, please contact:
Pride Surveys2140 Newmarket Pkwy SESuite 116Marietta, GA [email protected] Site: www.pridesurveys.com
Introduction 19
Pride Surveys Report: 2017-18 Warren County
The following information is for Pride Surveys internal use only.
• Data Files: cc170001,2,3,7,29,5007,5025,5029,5032,5037,5038,5039
• Filter:
Introduction 20
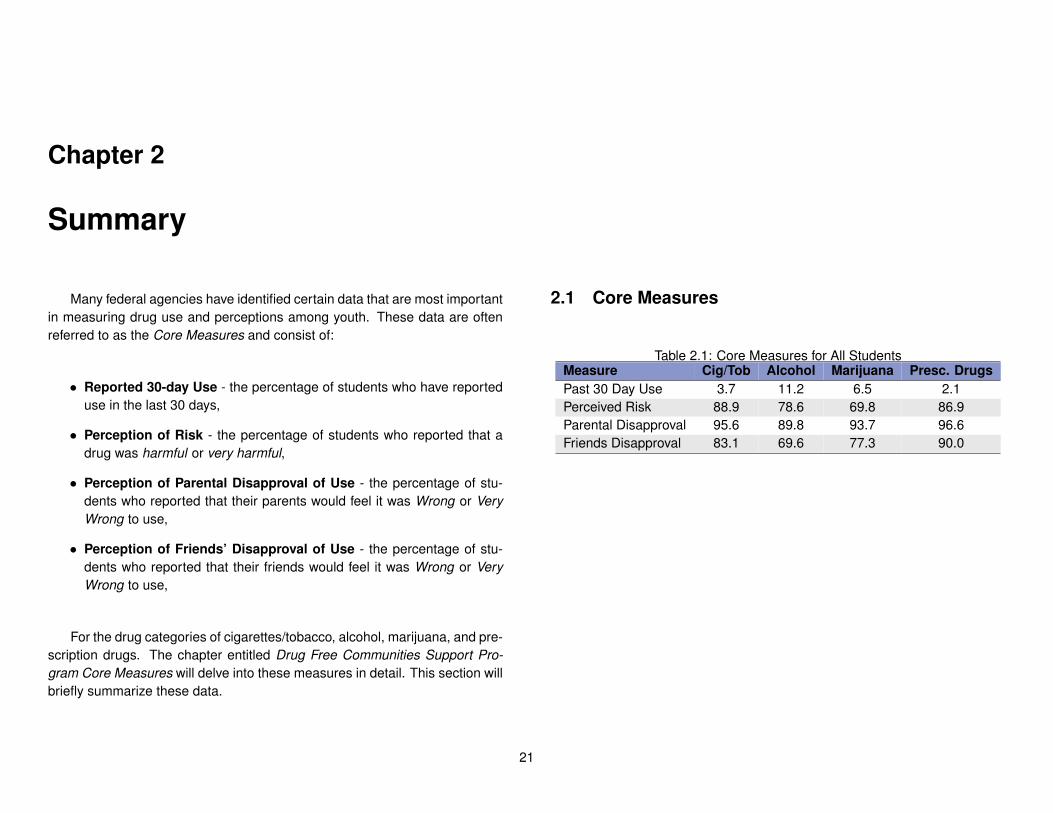
Chapter 2
Summary
Many federal agencies have identified certain data that are most importantin measuring drug use and perceptions among youth. These data are oftenreferred to as the Core Measures and consist of:
• Reported 30-day Use - the percentage of students who have reporteduse in the last 30 days,
• Perception of Risk - the percentage of students who reported that adrug was harmful or very harmful,
• Perception of Parental Disapproval of Use - the percentage of stu-dents who reported that their parents would feel it was Wrong or VeryWrong to use,
• Perception of Friends’ Disapproval of Use - the percentage of stu-dents who reported that their friends would feel it was Wrong or VeryWrong to use,
For the drug categories of cigarettes/tobacco, alcohol, marijuana, and pre-scription drugs. The chapter entitled Drug Free Communities Support Pro-gram Core Measures will delve into these measures in detail. This section willbriefly summarize these data.
2.1 Core Measures
Table 2.1: Core Measures for All StudentsMeasure Cig/Tob Alcohol Marijuana Presc. DrugsPast 30 Day Use 3.7 11.2 6.5 2.1Perceived Risk 88.9 78.6 69.8 86.9Parental Disapproval 95.6 89.8 93.7 96.6Friends Disapproval 83.1 69.6 77.3 90.0
21

Pride Surveys Report: 2017-18 Warren County
2.2 Annual Use
This is the percentage of students who reported any use in the past year.
Table 2.2: Percentage of Students Who Report Using DrugsDRUG ANNUALAny Tobacco 8.7Cigarettes 5.7Smokeless Tobacco 3.7Cigars 4.5Electronic Vapor Products 16.2Any Alcohol 23.0Beer 17.6Coolers, Hard Lemonade, etc. 15.4Liquor 16.3Any Illicit Drug 15.4Marijuana 10.0Synthetic Marijuana 1.6Bath Salts 0.8Pain Meds. 2.9Stimulants 2.4Sleeping Meds. 3.8Sedatives 2.4Over-the-Counter 1.1Heroin 0.2Cocaine 0.7Inhalants 1.1Hallucinogens 1.2Steroids 1.3Ecstasy 0.6Meth 0.3Prescription Drugs 7.2
2.3 Where Students Use
Table 2.3: Where Do Students Report UsingAT AT IN A FRIENDS’
DRUG HOME SCHOOL CAR HOUSE PARTIES OTHERTobacco 3.0 0.4 1.7 3.6 2.2 2.1Alcohol 8.9 0.4 0.7 8.6 7.6 2.4Marijuana 3.1 0.5 2.6 5.7 3.9 2.1Presc Drugs 1.8 0.3 0.3 0.5 0.2 0.5Vapor 6.4 1.9 5.1 8.4 5.5 3.3
2.4 When Students Use
Table 2.4: When Do Students Report UsingBEFORE DURING AFTER WEEK WEEK
DRUG SCHOOL SCHOOL SCHOOL NIGHT ENDTobacco 0.8 0.4 2.2 1.7 4.2Alcohol 0.3 0.2 1.6 1.6 12.7Marijuana 1.0 0.2 2.3 2.5 6.5Presc Drugs 0.5 0.2 0.8 0.7 1.0Vapor 2.1 1.5 5.6 4.0 9.0
Summary 22
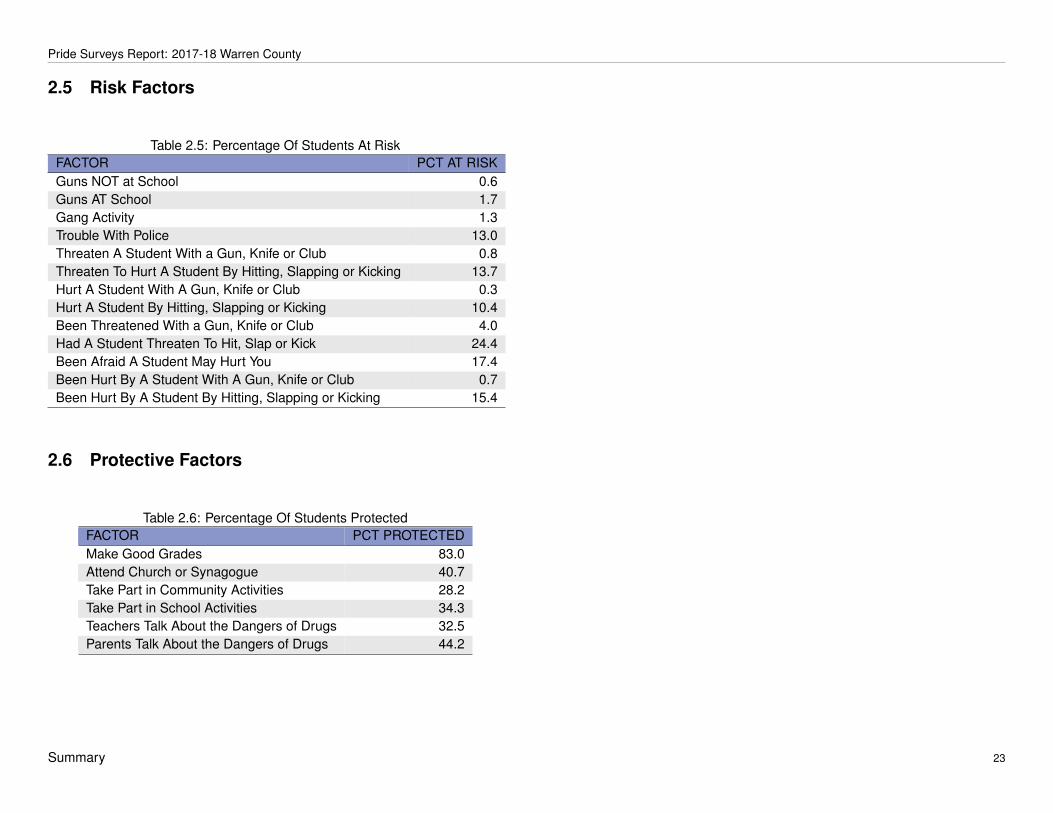
Pride Surveys Report: 2017-18 Warren County
2.5 Risk Factors
Table 2.5: Percentage Of Students At RiskFACTOR PCT AT RISKGuns NOT at School 0.6Guns AT School 1.7Gang Activity 1.3Trouble With Police 13.0Threaten A Student With a Gun, Knife or Club 0.8Threaten To Hurt A Student By Hitting, Slapping or Kicking 13.7Hurt A Student With A Gun, Knife or Club 0.3Hurt A Student By Hitting, Slapping or Kicking 10.4Been Threatened With a Gun, Knife or Club 4.0Had A Student Threaten To Hit, Slap or Kick 24.4Been Afraid A Student May Hurt You 17.4Been Hurt By A Student With A Gun, Knife or Club 0.7Been Hurt By A Student By Hitting, Slapping or Kicking 15.4
2.6 Protective Factors
Table 2.6: Percentage Of Students ProtectedFACTOR PCT PROTECTEDMake Good Grades 83.0Attend Church or Synagogue 40.7Take Part in Community Activities 28.2Take Part in School Activities 34.3Teachers Talk About the Dangers of Drugs 32.5Parents Talk About the Dangers of Drugs 44.2
Summary 23

Chapter 3
Graphics
The following graphs will assist you in understanding the relationship ofstudent behavior to alcohol and other drug usage. You are encouraged tomake overheads or slides from the graphs for presentations to school faculty,parents, media, and other audiences in the community.
The Location and Time of drug use graphs will be helpful in understandingthe need for a commitment to drug abuse prevention by parents and the largercommunity - not just by schools. Student alcohol and other drug use occursmost often outside the school and at times when school is not in session.
The Perceived Harm of alcohol and other drugs will assist with under-standing how the false assumptions concerning harm are related to drug use.When drugs are perceived as harmless, the probability of use increases.
Research indicates that easy access, Availability, to drugs increases theprobability of use. Availability of alcohol and other drugs normally increasesat higher grade levels.
24

Pride Surveys Report: 2017-18 Warren County
3.1 Frequency of Use
3.1.1 Annual Use
The following charts show how students responded to questions about use in the past year. The specific text of the question began with the header, "Within the pastyear how often have you..." and continued with various behaviors including substance use and abuse as well as factors relating to vehicle safety.
Graphics 25

Pride Surveys Report: 2017-18 Warren County
Annual Use of Any Tobacco, Any Alcohol and Any Illicit Drug
Annual Use of Any Tobacco, Any Alcohol and Any Illicit Drug
Source: Pride Surveys
Any Tobacco Any Alcohol Any Illicit Drug
7th 8th 9th 10th 11th 12th
1.7
5.7
9.4
12.
5 14.
7
25.
7
7.8
16.
2
23.
4
33.
0
42.
6
52.
4
7.6
12.
1 14.
8
19.
9
26.
8
32.
4
Graphics 26

Pride Surveys Report: 2017-18 Warren County
Annual Use of Cigarettes, Smokeless Tobacco, Cigars and Vapor Products
Annual Use of Cigarettes, Smokeless Tobacco, Cigars and Vapor Products
Source: Pride Surveys
Cigarettes Smokeless Tobacco Cigars Vapor Products
7th 8th 9th 10th 11th 12th
1.3
4.3
6.8 7
.5 9
.6
13.
6
0.6 2
.1 4
.5 6.0
5.8
10.
3
0.4
2.1 3
.5
6.9
8.6
18.
7
3.7
11.
7
18.
0
23.
4
30.
4
38.
2
Graphics 27
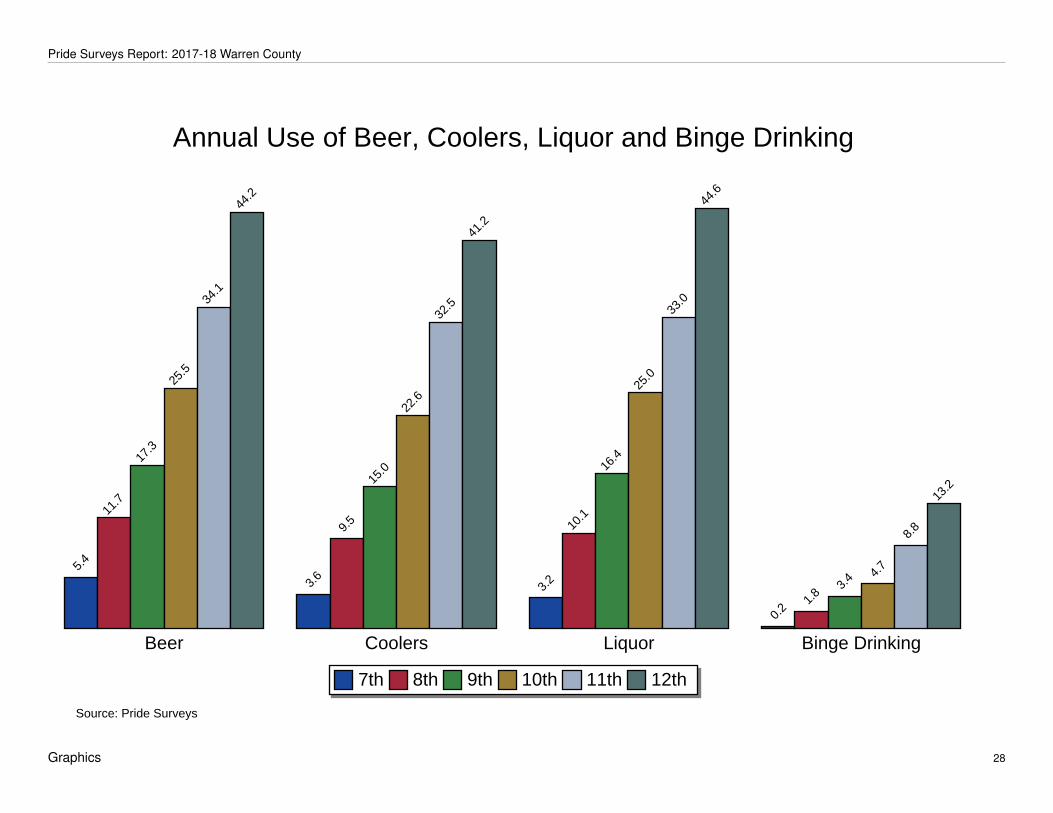
Pride Surveys Report: 2017-18 Warren County
Annual Use of Beer, Coolers, Liquor and Binge Drinking
Annual Use of Beer, Coolers, Liquor and Binge Drinking
Source: Pride Surveys
Beer Coolers Liquor Binge Drinking
7th 8th 9th 10th 11th 12th
5.4
11.
7
17.
3
25.
5
34.
1
44.
2
3.6
9.5
15.
0
22.
6
32.
5
41.
2
3.2
10.
1
16.
4
25.
0
33.
0
44.
6
0.2 1
.8 3.4 4
.7
8.8
13.
2
Graphics 28

Pride Surveys Report: 2017-18 Warren County
Annual Use of Marijuana, Synthetic Marijuana and Bath Salts
Annual Use of Marijuana, Synthetic Marijuana and Bath Salts
Source: Pride Surveys
Marijuana Synthetic Marijuana Bath Salts
7th 8th 9th 10th 11th 12th
1.1
5.5
9.7
15.
3
24.
2
29.
2
0.3 0
.8 2
.0 2
.0
4.3
3.2
0.2 0
.9 1
.0 0
.8 1.5
0.9
Graphics 29

Pride Surveys Report: 2017-18 Warren County
Annual Use of Pain Medication, Stimulants,
Annual Use of Pain Medication, Stimulants,Sleeping Medication, Sedatives, and Over the Counter
Source: Pride Surveys
Pain Medication Stimulants Sleeping Medication Sedatives Over the Counter
7th 8th 9th 10th 11th 12th
1.6
2.4
3.3
3.2
6.0
4.0
1.0
1.4
2.1
2.9
5.4
6.5
2.7
4.6
4.5
3.1
4.1
3.8
0.8
2.3
2.3
2.9
5.6
3.8
0.1
1.4
1.3 1
.5 1.7
1.1
Graphics 30

Pride Surveys Report: 2017-18 Warren County
Annual Use of Heroin, Cocaine, Inhalants and Hallucinogens
Annual Use of Heroin, Cocaine, Inhalants and Hallucinogens
Source: Pride Surveys
Heroin Cocaine Inhalants Hallucinogens
7th 8th 9th 10th 11th 12th
0.0 0
.1 0.2 0
.4
0.9
0.7
0.0
0.6
0.6
1.1
1.7
2.3
0.5
1.4
1.1
1.4 1
.5
1.4
0.1
0.4
1.5
2.5
2.2
3.9
Graphics 31

Pride Surveys Report: 2017-18 Warren County
Annual Use of Steroids, Ecstasy and Meth
Annual Use of Steroids, Ecstasy and Meth
Source: Pride Surveys
Steroids Ecstasy Meth
7th 8th 9th 10th 11th 12th
1.6
0.8
0.7
2.3
2.0
1.4
0.1 0
.3 0.4
1.4
0.9
1.4
0.1 0
.3
0.2 0
.3
0.9
0.7
Graphics 32
Pride Surveys Report: 2017-18 Warren County
3.1.2 Past 30-Day Use
We calculate 30-day use from various questions including a subset of "Within the past year..." as well as DFC specific questions about use in the past 30 days.
Graphics 33

Pride Surveys Report: 2017-18 Warren County
30-Day Use of Cigarettes, Alcohol, Marijuana and Prescription Drugs
30-Day Use of Cigarettes, Alcohol, Marijuana and Prescription Drugs
Source: Pride Surveys
Cigarettes Alcohol Marijuana Prescription Drugs
7th 8th 9th 10th 11th 12th
0.8
3.2
4.6 4
.9 6
.2 7.3
3.0
6.2
10.
7
16.
3
23.
2
32.
5
0.9
3.3
5.7
9.9
17.
0
20.
1
1.2 2
.3 2
.1 2.3 2
.5 3.7
Graphics 34

Pride Surveys Report: 2017-18 Warren County
3.2 Perception of Harm
An adolescent’s perception of the risks associated with substance use is an important determinant of whether he or she engages in substance use. For example,youths who perceive high risk of harm are less likely to use drugs than youths who perceive low risk of harm. *
Students are asked about their perception of harm of any use of various drugs with the possible responses being No Harm, Some Harm, Harmful or VeryHarmful. Past analysis of national statistics indicates that as students’ perception of harm increases, use of substances decreases. It is also typical for theperception of harm (Harmful or Very Harmful) to decrease as a child gets older. Your students. responses are detailed in the following pages.
*Source: http://archive.samhsa.gov/data/2k13/NSDUH099a/sr099a-risk-perception-trends.pdf
Graphics 35

Pride Surveys Report: 2017-18 Warren County
Perception of Harm -- Cigarettes
Perception of Harm -- Cigarettes
Source: Pride Surveys
No Harm Some Harm Harmful Very Harmful
7 8 9 10 11 12
9.4
7.0
4.2
4.5
3.9 4
.8 4
.2 5.2 5
.7 5
.2 5
.0
3.0
22.
7 2
3.4
23.
1
22.
0 23.
3
19.
2
63.
8 6
4.3 6
7.0 6
8.3
67.
8 7
3.1
Graphics 36

Pride Surveys Report: 2017-18 Warren County
Perception of Harm -- Smokeless Tobacco
Perception of Harm -- Smokeless Tobacco
Source: Pride Surveys
No Harm Some Harm Harmful Very Harmful
7 8 9 10 11 12
10.
1
8.1
4.9 6
.2
4.8 5
.9
11.
9 1
1.8
12.
0
11.
3 1
2.1
9.8
24.
9
29.
9 3
0.9
28.
1 2
7.9
26.
5
53.
0
50.
2 52.
2 54.
4 5
5.2 5
7.8
Graphics 37
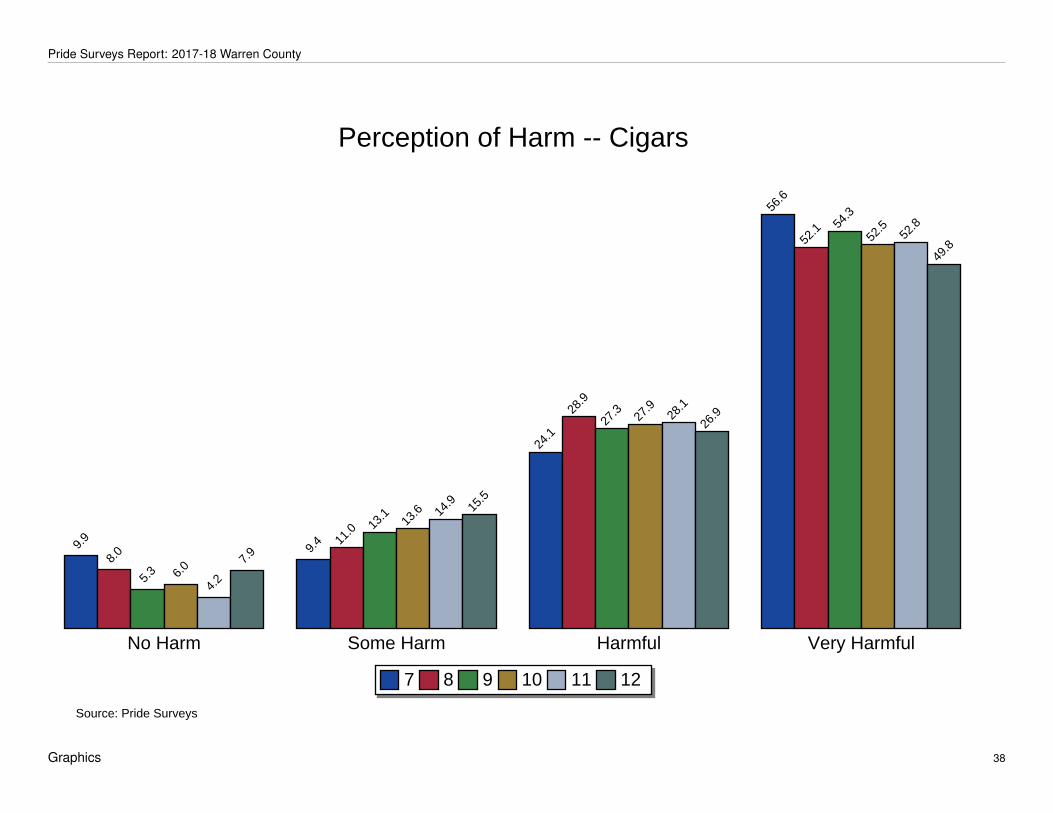
Pride Surveys Report: 2017-18 Warren County
Perception of Harm -- Cigars
Perception of Harm -- Cigars
Source: Pride Surveys
No Harm Some Harm Harmful Very Harmful
7 8 9 10 11 12
9.9
8.0
5.3 6
.0
4.2
7.9 9
.4 11.
0 13.
1 1
3.6 1
4.9
15.
5
24.
1
28.
9
27.
3 2
7.9
28.
1
26.
9
56.
6
52.
1 54.
3
52.
5 5
2.8
49.
8
Graphics 38

Pride Surveys Report: 2017-18 Warren County
Perception of Harm -- Electronic Vapor Products
Perception of Harm -- Electronic Vapor Products
Source: Pride Surveys
No Harm Some Harm Harmful Very Harmful
7 8 9 10 11 12
15.
0 16.
8
14.
6
19.
7 1
9.8
20.
0
23.
9
31.
2 32.
3 3
2.5
37.
4
41.
8
21.
3 2
1.7
20.
3
18.
3
17.
2
14.
4
39.
8
30.
3 3
2.8
29.
5
25.
6
23.
9
Graphics 39

Pride Surveys Report: 2017-18 Warren County
Perception of Harm -- Beer
Perception of Harm -- Beer
Source: Pride Surveys
No Harm Some Harm Harmful Very Harmful
7 8 9 10 11 12
12.
5
11.
7
9.1
9.3
9.4
15.
1
31.
1
35.
9 3
8.7
37.
8 39.
5
46.
6
22.
7 24.
7 2
5.3
26.
1 2
6.8
18.
3
33.
6
27.
6
27.
0 2
6.8
24.
3
20.
0
Graphics 40

Pride Surveys Report: 2017-18 Warren County
Perception of Harm -- Coolers, Hard Lemonade, etc.
Perception of Harm -- Coolers, Hard Lemonade, etc.
Source: Pride Surveys
No Harm Some Harm Harmful Very Harmful
7 8 9 10 11 12
13.
7 1
3.9
11.
3
10.
8 12.
7 1
6.1
30.
6
36.
0 3
9.1
42.
1
41.
2
47.
6
21.
3 2
3.8
23.
0
22.
6 2
2.6
16.
8
34.
4
26.
3 2
6.6
24.
5
23.
5
19.
6
Graphics 41

Pride Surveys Report: 2017-18 Warren County
Perception of Harm -- Liquor
Perception of Harm -- Liquor
Source: Pride Surveys
No Harm Some Harm Harmful Very Harmful
7 8 9 10 11 12
11.
1
9.2
6.7
8.5
7.9
12.
8
22.
4
29.
1 30.
0
29.
2 3
2.2
38.
7
26.
3 2
9.3
28.
6 3
1.1
31.
3
24.
2
40.
2
32.
5 3
4.8
31.
2
28.
6
24.
2
Graphics 42

Pride Surveys Report: 2017-18 Warren County
Perception of Harm -- Marijuana
Perception of Harm -- Marijuana
Source: Pride Surveys
No Harm Some Harm Harmful Very Harmful
7 8 9 10 11 12
12.
6 13.
9 1
4.4
20.
6 2
5.3
29.
6
6.1
14.
9 17.
3 2
2.4
26.
6 28.
2
14.
6 1
9.6
19.
9
18.
1
17.
4
14.
8
66.
6
51.
5
48.
5
38.
9
30.
8
27.
5
Graphics 43

Pride Surveys Report: 2017-18 Warren County
Perception of Harm -- Synthetic Marijuana
Perception of Harm -- Synthetic Marijuana
Source: Pride Surveys
No Harm Some Harm Harmful Very Harmful
7 8 9 10 11 12
11.
7
10.
1 1
0.0 1
3.0
13.
2 15.
2
6.7
13.
8 15.
5 17.
1
23.
3 2
2.9
16.
3
23.
5 2
3.1
22.
0 2
2.9
23.
4
65.
3
52.
7
51.
4
47.
9
40.
7
38.
6
Graphics 44

Pride Surveys Report: 2017-18 Warren County
Perception of Harm -- Bath Salts
Perception of Harm -- Bath Salts
Source: Pride Surveys
No Harm Some Harm Harmful Very Harmful
7 8 9 10 11 12
9.4
7.0
4.9
5.0
4.4 5
.4 4
.5 6.0
5.2
3.6 4
.6 4
.4
17.
3 21.
0
19.
5 22.
6
16.
6 18.
7
68.
8
66.
0 7
0.4
68.
8 7
4.5
71.
4
Graphics 45

Pride Surveys Report: 2017-18 Warren County
Perception of Harm -- Prescription Drugs
Perception of Harm -- Prescription Drugs
Source: Pride Surveys
No Harm Some Harm Harmful Very Harmful
7 8 9 10 11 12
9.3
7.2
4.5 5
.1 4
.6 6.3
6.3 7
.7
5.9
5.3
4.8 6
.3
16.
8
23.
4
20.
3 2
4.9
19.
2 2
0.0
67.
5
61.
7
69.
3
64.
7
71.
4
67.
4
Graphics 46

Pride Surveys Report: 2017-18 Warren County
Perception of Harm -- Over-the-Counter
Perception of Harm -- Over-the-Counter
Source: Pride Surveys
No Harm Some Harm Harmful Very Harmful
7 8 9 10 11 12
9.2
7.0
4.7 5
.3
4.1 5
.6
3.3
6.5
5.0 5
.5 5
.7 6.7
18.
5
24.
1 2
4.7
24.
5
21.
0 24.
1
69.
0
62.
4 65.
7
64.
7 6
9.2
63.
6
Graphics 47

Pride Surveys Report: 2017-18 Warren County
Perception of Harm -- Heroin
Perception of Harm -- Heroin
Source: Pride Surveys
No Harm Some Harm Harmful Very Harmful
7 8 9 10 11 12
9.1
6.8
4.2 4
.8 4
.4 4
.7
1.1
0.8
1.0
0.9
0.9
0.5
6.6 7
.5
6.1
6.3
3.3 5
.4
83.
2 8
4.8 8
8.7
88.
0 91.
3
89.
5
Graphics 48

Pride Surveys Report: 2017-18 Warren County
Perception of Harm -- Cocaine
Perception of Harm -- Cocaine
Source: Pride Surveys
No Harm Some Harm Harmful Very Harmful
7 8 9 10 11 12
9.2
6.7
4.4
4.8
4.5
4.7
1.0 1
.6 1
.2 0
.9 1.8
1.4
7.2 9
.3
7.7 1
0.4
6.0 9
.4
82.
6 8
2.4 8
6.7
84.
0 87.
7
84.
5
Graphics 49

Pride Surveys Report: 2017-18 Warren County
Perception of Harm -- Inhalants
Perception of Harm -- Inhalants
Source: Pride Surveys
No Harm Some Harm Harmful Very Harmful
7 8 9 10 11 12
9.4
7.1
4.3 4
.9 4
.0 4.7
2.5
2.5
2.6
1.6 2
.4 2
.6
10.
9 14.
5
10.
8 12.
8
8.5 1
1.3
77.
2
75.
9 8
2.3
80.
8 85.
1
81.
5
Graphics 50
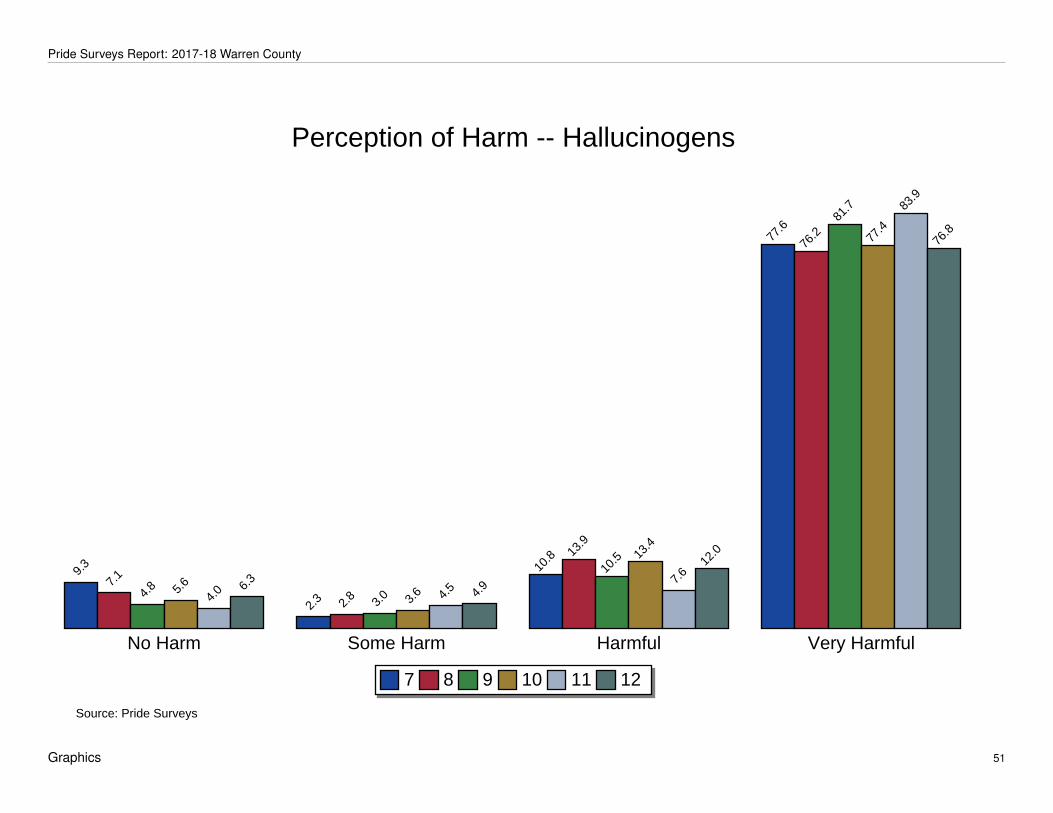
Pride Surveys Report: 2017-18 Warren County
Perception of Harm -- Hallucinogens
Perception of Harm -- Hallucinogens
Source: Pride Surveys
No Harm Some Harm Harmful Very Harmful
7 8 9 10 11 12
9.3
7.1
4.8 5
.6
4.0 6
.3
2.3
2.8
3.0 3
.6 4.5
4.9
10.
8 13.
9
10.
5 13.
4
7.6
12.
0
77.
6
76.
2 8
1.7
77.
4
83.
9
76.
8
Graphics 51
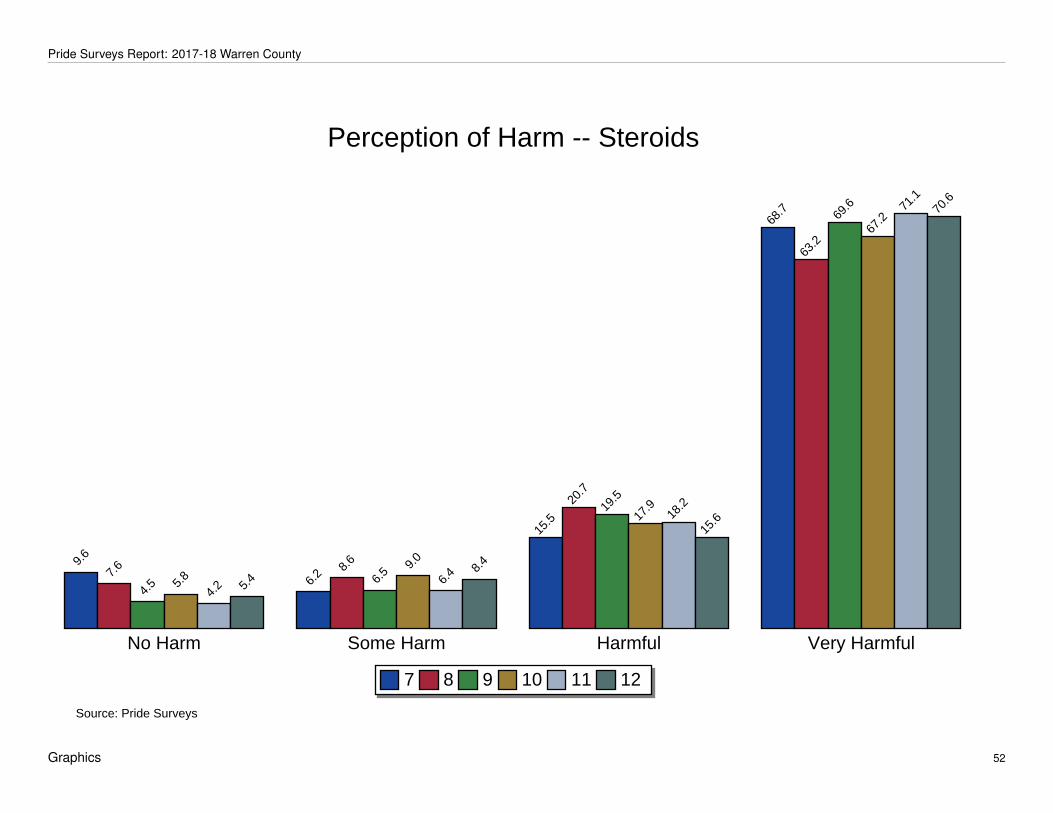
Pride Surveys Report: 2017-18 Warren County
Perception of Harm -- Steroids
Perception of Harm -- Steroids
Source: Pride Surveys
No Harm Some Harm Harmful Very Harmful
7 8 9 10 11 12
9.6
7.6
4.5 5
.8
4.2 5
.4 6.2 8
.6
6.5 9
.0
6.4 8
.4
15.
5 2
0.7
19.
5
17.
9 1
8.2
15.
6
68.
7
63.
2
69.
6
67.
2 7
1.1
70.
6
Graphics 52

Pride Surveys Report: 2017-18 Warren County
Perception of Harm -- Ecstasy
Perception of Harm -- Ecstasy
Source: Pride Surveys
No Harm Some Harm Harmful Very Harmful
7 8 9 10 11 12
9.2
7.0
4.2 5
.0 4
.2 5.6
2.7
3.0
2.5
2.3 3
.5 5.1
11.
0 14.
4
11.
7 14.
6
8.0 1
0.7
77.
1
75.
6 8
1.5
78.
1 8
4.3
78.
7
Graphics 53
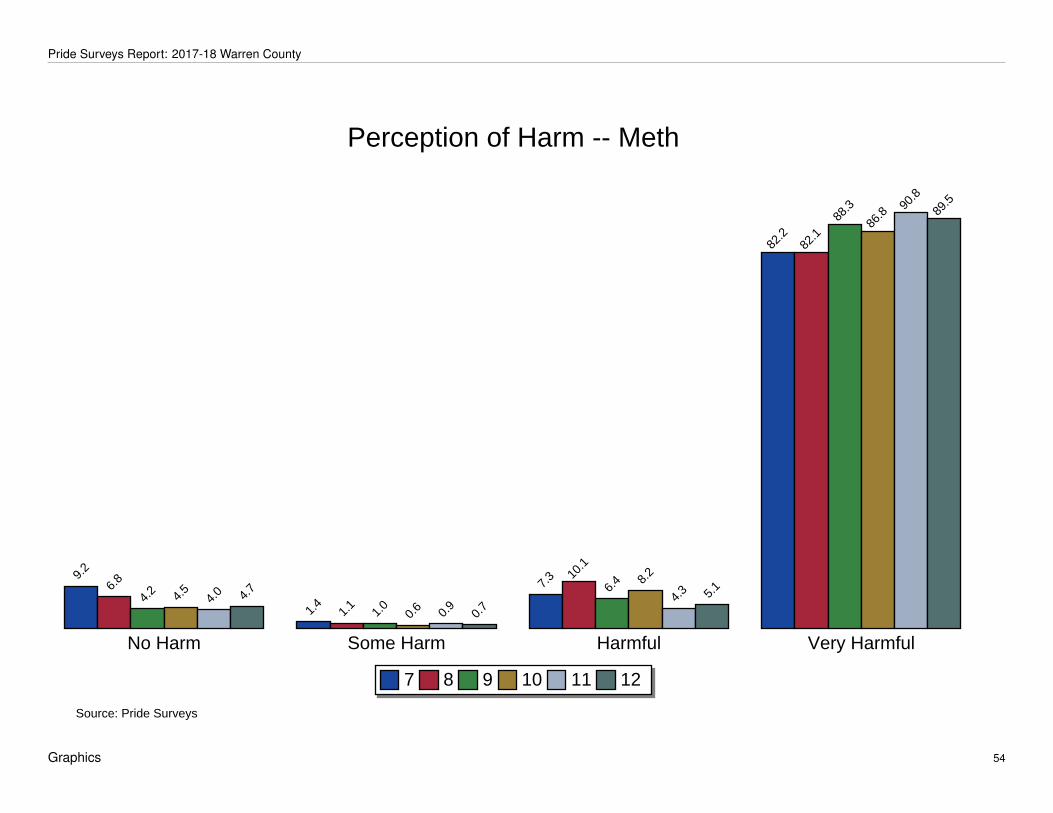
Pride Surveys Report: 2017-18 Warren County
Perception of Harm -- Meth
Perception of Harm -- Meth
Source: Pride Surveys
No Harm Some Harm Harmful Very Harmful
7 8 9 10 11 12
9.2
6.8
4.2
4.5
4.0 4
.7
1.4
1.1
1.0
0.6
0.9
0.7
7.3 1
0.1
6.4 8
.2
4.3 5
.1
82.
2 8
2.1
88.
3
86.
8 90.
8
89.
5
Graphics 54

Pride Surveys Report: 2017-18 Warren County
3.3 Perception of Parental Disapproval
Similar to the Perception of Harm, we can see an impact on adolescents if their parents strongly disapprove of drugs and drug use. You can see the cross tabs inyour own data in section 3.11
Graphics 55

Pride Surveys Report: 2017-18 Warren County
Perception of Parental Disapproval -- Use Alcohol
Perception of Parental Disapproval -- Use Alcohol
Source: Pride Surveys
Not At All Wrong A Little Bit Wrong Wrong Very Wrong
7 8 9 10 11 12
3.2
1.6 3
.1 3
.2 6.2
10.
0
3.2 4
.4 7.1 8
.2 9.7
16.
7
8.0 9
.8 9
.8 1
4.1 1
6.1 1
8.8
85.
6
84.
1
80.
0
74.
5
68.
0
54.
6
Graphics 56

Pride Surveys Report: 2017-18 Warren County
Perception of Parental Disapproval -- Binge Alcohol
Perception of Parental Disapproval -- Binge Alcohol
Source: Pride Surveys
Not At All Wrong A Little Bit Wrong Wrong Very Wrong
7 8 9 10 11 12
1.9
1.3 1
.9 1
.7 3.0
3.2
2.6
2.7
2.9
3.0
3.4 5
.8 5
.9 7.3
7.0 8
.6 10.
8 1
2.3
89.
6
88.
7 8
8.3
86.
6
82.
8
78.
7
Graphics 57

Pride Surveys Report: 2017-18 Warren County
Perception of Parental Disapproval -- Use Any Tobacco
Perception of Parental Disapproval -- Use Any Tobacco
Source: Pride Surveys
Not At All Wrong A Little Bit Wrong Wrong Very Wrong
7 8 9 10 11 12
2.2
1.1 1
.8 1
.7 2
.2 4.9
1.6
1.4 2
.7 3.3 5
.0 8.1
5.2 7
.4
6.0 8
.7 10.
6 14.
2
91.
0
90.
1 8
9.5
86.
2
82.
3
72.
9
Graphics 58

Pride Surveys Report: 2017-18 Warren County
Perception of Parental Disapproval -- Smoke Tobacco
Perception of Parental Disapproval -- Smoke Tobacco
Source: Pride Surveys
Not At All Wrong A Little Bit Wrong Wrong Very Wrong
7 8 9 10 11 12
1.9
1.1
1.6
1.5 2
.4 4.9
1.5
1.3 3
.1 2
.5 4.1 7
.4
4.5 6
.9
5.6 9
.1 11.
0 13.
7
92.
1
90.
7
89.
7
87.
0
82.
6
74.
1
Graphics 59

Pride Surveys Report: 2017-18 Warren County
Perception of Parental Disapproval -- Use electronic vapor products
Perception of Parental Disapproval -- Use electronic vapor products
Source: Pride Surveys
Not At All Wrong A Little Bit Wrong Wrong Very Wrong
7 8 9 10 11 12
3.2
2.3 3
.2 3
.5 5.4 8
.1
2.9 5
.3 6.3 7
.7 7
.5
14.
5
7.3 9
.9 8
.8 11.
5 14.
7 16.
4
86.
6
82.
5
81.
7
77.
2
72.
4
61.
0
Graphics 60

Pride Surveys Report: 2017-18 Warren County
Perception of Parental Disapproval -- Smoke Marijuana
Perception of Parental Disapproval -- Smoke Marijuana
Source: Pride Surveys
Not At All Wrong A Little Bit Wrong Wrong Very Wrong
7 8 9 10 11 12
1.9
2.0
2.3 3
.1 5.0 7
.0
1.2 1
.9 3.6 4
.7 7.6 8
.8
3.6 5
.9 5
.6 9.2
8.9 1
1.4
93.
3
90.
2
88.
5
83.
1
78.
6
72.
9
Graphics 61

Pride Surveys Report: 2017-18 Warren County
Perception of Parental Disapproval -- Use Prescription Drugs
Perception of Parental Disapproval -- Use Prescription Drugs
Source: Pride Surveys
Not At All Wrong A Little Bit Wrong Wrong Very Wrong
7 8 9 10 11 12
1.9
1.3
1.4
1.3 2
.4 2
.1 1
.6 1
.3 2.2
1.5 3
.0 2
.3 4.7
5.2
4.2 5
.4 6.9 7
.7
91.
8 9
2.2
92.
2 9
1.8
87.
6 8
7.9
Graphics 62

Pride Surveys Report: 2017-18 Warren County
Perception of Parental Disapproval -- Use Other Illicit Drugs
Perception of Parental Disapproval -- Use Other Illicit Drugs
Source: Pride Surveys
Not At All Wrong A Little Bit Wrong Wrong Very Wrong
7 8 9 10 11 12
1.5
1.1
1.1
1.2
1.7
1.9
0.6
0.3 1
.2 1
.2 1
.7 0
.9 2.7 3
.9 3
.8 4.8 6
.1 6.8
95.
1 9
4.8
93.
9
92.
8
90.
5 9
0.4
Graphics 63

Pride Surveys Report: 2017-18 Warren County
Perception of Parental Disapproval -- Gamble anything of value
Perception of Parental Disapproval -- Gamble anything of value
Source: Pride Surveys
Not At All Wrong A Little Bit Wrong Wrong Very Wrong
7 8 9 10 11 12
2.7
1.7 2
.4 2
.3 4.1 5
.6
3.6 4
.8
3.5
3.7 5
.8 6
.3 8.5 1
1.7
9.2 1
0.3
9.5 1
2.6
85.
2
81.
8 84.
9
83.
7
80.
5
75.
5
Graphics 64

Pride Surveys Report: 2017-18 Warren County
3.4 Perception of Friends Disapproval
Similar to other categories of disapproval friends have influence over one another’s behaviors. You can see more about this in the cross tabs section 3.11. Typically,students perceive a decreasing amount of disapproval from their friends as they grow older. This is helpful in understanding peer pressure. The following pagesdetail your students’ responses to their friends’ disapproval.
Graphics 65

Pride Surveys Report: 2017-18 Warren County
Perception of Friends Disapproval -- Use Alcohol
Perception of Friends Disapproval -- Use Alcohol
Source: Pride Surveys
Not At All Wrong A Little Bit Wrong Wrong Very Wrong
7 8 9 10 11 12
6.2 6
.9 1
0.8
18.
8
25.
9
38.
9
9.2
14.
7 1
8.2
23.
4
28.
5
23.
9
19.
2 2
4.0
23.
0
22.
3
18.
4 1
7.9
65.
4
54.
5
48.
0
35.
5
27.
2
19.
3
Graphics 66

Pride Surveys Report: 2017-18 Warren County
Perception of Friends Disapproval -- Binge Alcohol
Perception of Friends Disapproval -- Binge Alcohol
Source: Pride Surveys
Not At All Wrong A Little Bit Wrong Wrong Very Wrong
7 8 9 10 11 12
3.5
3.8 4
.7 7.3 8
.2 10.
6
6.2
10.
6 1
1.0
15.
2 16.
8 18.
5
17.
8 2
3.0
23.
2 26.
3 2
6.3 2
7.7
72.
4
62.
7
61.
2
51.
2
48.
7
43.
2
Graphics 67

Pride Surveys Report: 2017-18 Warren County
Perception of Friends Disapproval -- Use Any Tobacco
Perception of Friends Disapproval -- Use Any Tobacco
Source: Pride Surveys
Not At All Wrong A Little Bit Wrong Wrong Very Wrong
7 8 9 10 11 12
4.0 5
.1 5
.5 9
.5 1
3.8
20.
0
5.8 7
.9 1
1.8
16.
0 2
0.3
20.
7
15.
7 2
1.3 2
2.8
23.
3 2
3.9
23.
5
74.
5
65.
7
59.
9
51.
2
42.
0
35.
7
Graphics 68

Pride Surveys Report: 2017-18 Warren County
Perception of Friends Disapproval -- Smoke Tobacco
Perception of Friends Disapproval -- Smoke Tobacco
Source: Pride Surveys
Not At All Wrong A Little Bit Wrong Wrong Very Wrong
7 8 9 10 11 12
3.9 4
.8 4
.6 8
.5 1
2.1
17.
5
4.6 6
.4 1
1.5 1
4.5
19.
1 2
0.0
15.
0
21.
3 2
0.8 2
3.7 2
5.2
25.
3
76.
6
67.
4
63.
0
53.
2
43.
6
37.
1
Graphics 69
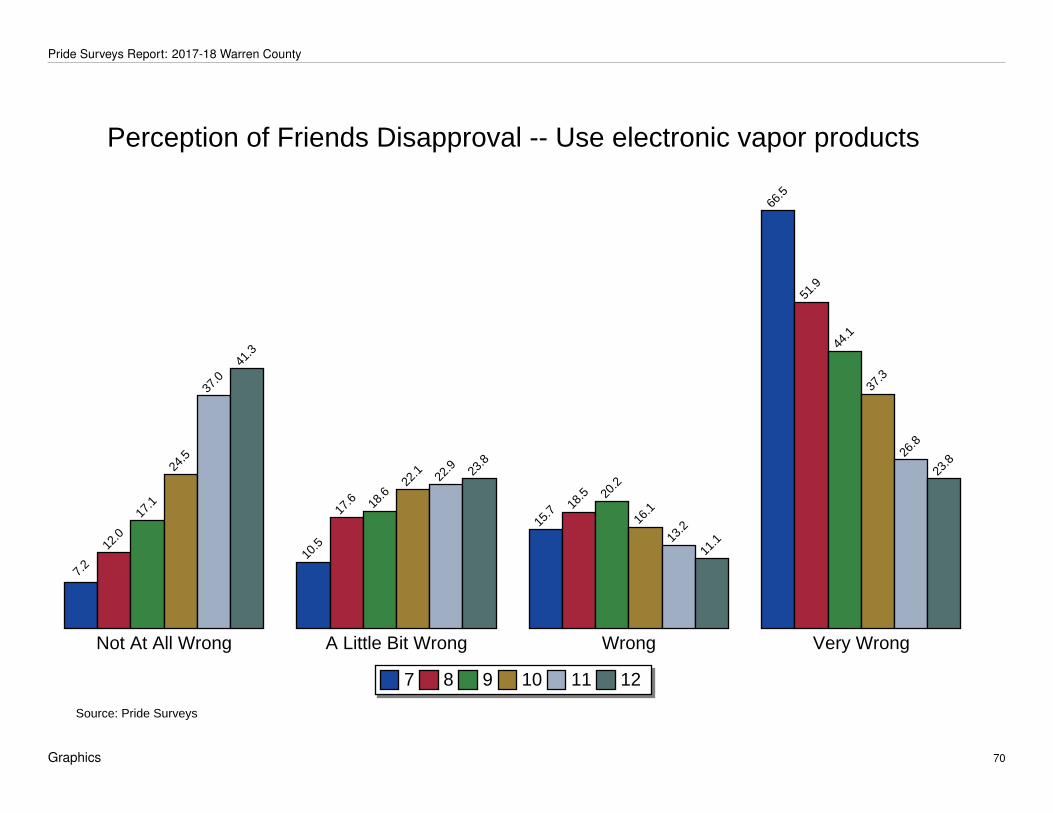
Pride Surveys Report: 2017-18 Warren County
Perception of Friends Disapproval -- Use electronic vapor products
Perception of Friends Disapproval -- Use electronic vapor products
Source: Pride Surveys
Not At All Wrong A Little Bit Wrong Wrong Very Wrong
7 8 9 10 11 12
7.2
12.
0 1
7.1
24.
5
37.
0 4
1.3
10.
5
17.
6 1
8.6
22.
1 2
2.9
23.
8
15.
7 18.
5 20.
2
16.
1
13.
2
11.
1
66.
5
51.
9
44.
1
37.
3
26.
8
23.
8
Graphics 70

Pride Surveys Report: 2017-18 Warren County
Perception of Friends Disapproval -- Smoke Marijuana
Perception of Friends Disapproval -- Smoke Marijuana
Source: Pride Surveys
Not At All Wrong A Little Bit Wrong Wrong Very Wrong
7 8 9 10 11 12
3.9 6
.2 1
0.7
16.
8
26.
9 3
3.1
3.4
8.2
12.
5 15.
7 2
0.6
19.
3
10.
1 1
5.2
14.
2
20.
7
17.
0 1
7.5
82.
7
70.
3
62.
6
46.
8
35.
5
30.
1
Graphics 71

Pride Surveys Report: 2017-18 Warren County
Perception of Friends Disapproval -- Use Prescription Drugs
Perception of Friends Disapproval -- Use Prescription Drugs
Source: Pride Surveys
Not At All Wrong A Little Bit Wrong Wrong Very Wrong
7 8 9 10 11 12
3.2
2.8 3
.8 3
.9 5.2 6
.3
3.7 5
.5 6.3 7
.5 1
1.1
9.0
13.
9 16.
8
15.
2 1
9.3 2
0.9 2
3.4
79.
2
74.
9 7
4.7
69.
3
62.
7
61.
3
Graphics 72

Pride Surveys Report: 2017-18 Warren County
Perception of Friends Disapproval -- Use Other Illicit Drugs
Perception of Friends Disapproval -- Use Other Illicit Drugs
Source: Pride Surveys
Not At All Wrong A Little Bit Wrong Wrong Very Wrong
7 8 9 10 11 12
2.4
2.3 3
.1 3.7 4
.5 4
.6
2.2
2.7 5
.0 5
.5 8.6
4.9
10.
2 1
5.1
13.
3 17.
3
15.
8 2
2.2
85.
3
79.
9
78.
5
73.
5
71.
1
68.
3
Graphics 73

Pride Surveys Report: 2017-18 Warren County
Perception of Friends Disapproval -- Gamble anything of value
Perception of Friends Disapproval -- Gamble anything of value
Source: Pride Surveys
Not At All Wrong A Little Bit Wrong Wrong Very Wrong
7 8 9 10 11 12
5.7
5.7
9.0
8.8
13.
4 1
3.9
9.8
17.
1
14.
7 1
5.5
19.
7 21.
3
20.
8
26.
2
23.
7 2
4.7
21.
5 23.
8
63.
7
51.
0 52.
6
50.
9
45.
3
41.
0
Graphics 74

Pride Surveys Report: 2017-18 Warren County
3.5 Average Age of Onset of Use
The question "At what age did you first use..." is used to measure this statistic. The possible responses to this question range from 10 or Under, to 17 or Older, andNever Used. The table shows the average age of first use for those students who answered the question with a response other than Never Used.
Graphics 75

Pride Surveys Report: 2017-18 Warren County
Average Age of Onset of Use of Any Tobacco
Average Age of Onset of Use of Any Tobacco
Source: Pride Surveys
7 8 9 10 11 12
Average Age of Onset of Use
10.
8 1
1.8 1
2.4
13.
2 1
4.2 1
4.8
Graphics 76
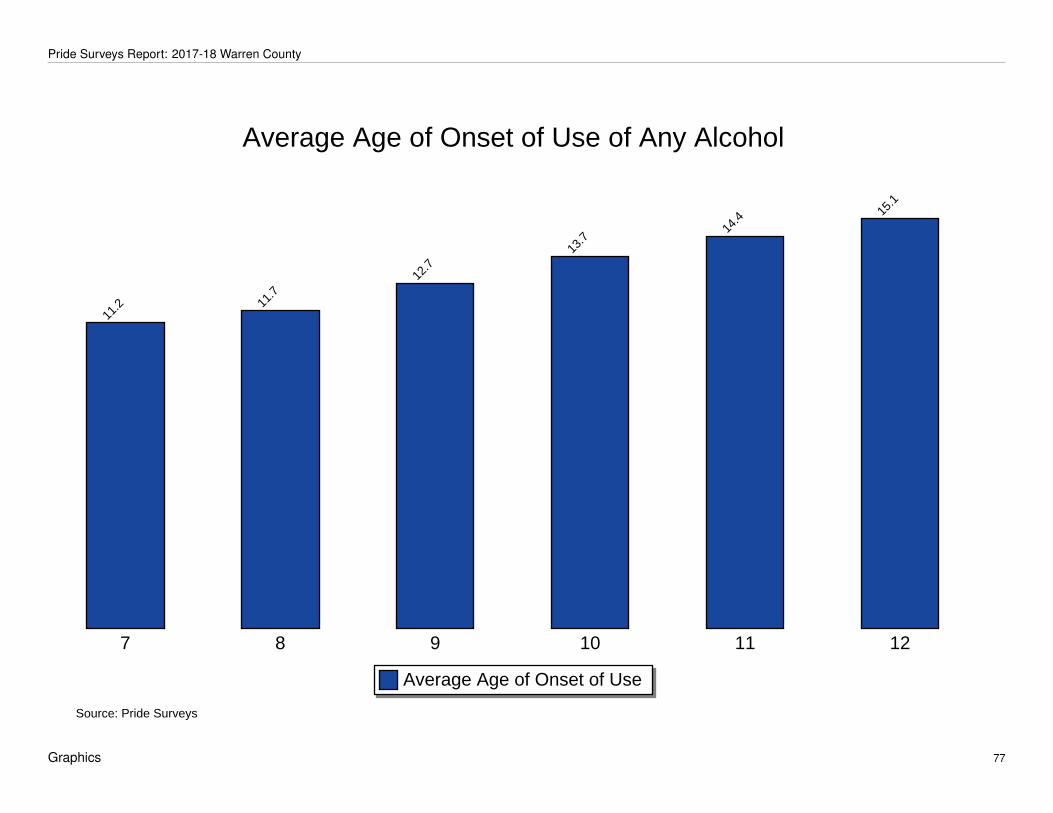
Pride Surveys Report: 2017-18 Warren County
Average Age of Onset of Use of Any Alcohol
Average Age of Onset of Use of Any Alcohol
Source: Pride Surveys
7 8 9 10 11 12
Average Age of Onset of Use
11.
2 11.
7 1
2.7
13.
7 14.
4 15.
1
Graphics 77

Pride Surveys Report: 2017-18 Warren County
Average Age of Onset of Use of Any Illicit Drug
Average Age of Onset of Use of Any Illicit Drug
Source: Pride Surveys
7 8 9 10 11 12
Average Age of Onset of Use
10.
9 1
2.1
13.
1 13.
7 1
4.6 1
5.1
Graphics 78

Pride Surveys Report: 2017-18 Warren County
Average Age of Onset of Use of Cigarettes
Average Age of Onset of Use of Cigarettes
Source: Pride Surveys
7 8 9 10 11 12
Average Age of Onset of Use
10.
9 1
1.9 1
2.2
13.
0 1
3.8 1
4.4
Graphics 79

Pride Surveys Report: 2017-18 Warren County
Average Age of Onset of Use of Smokeless Tobacco
Average Age of Onset of Use of Smokeless Tobacco
Source: Pride Surveys
7 8 9 10 11 12
Average Age of Onset of Use
10.
7 11.
5
13.
0 1
3.2
14.
6 15.
0
Graphics 80

Pride Surveys Report: 2017-18 Warren County
Average Age of Onset of Use of Cigars
Average Age of Onset of Use of Cigars
Source: Pride Surveys
7 8 9 10 11 12
Average Age of Onset of Use
11.
0 1
2.0
12.
9 13.
6 14.
4
15.
9
Graphics 81

Pride Surveys Report: 2017-18 Warren County
Average Age of Onset of Use of Electronic Vapor Products
Average Age of Onset of Use of Electronic Vapor Products
Source: Pride Surveys
7 8 9 10 11 12
Average Age of Onset of Use
11.
5 1
2.5
13.
4 14.
0
15.
3 15.
8
Graphics 82

Pride Surveys Report: 2017-18 Warren County
Average Age of Onset of Use of Beer
Average Age of Onset of Use of Beer
Source: Pride Surveys
7 8 9 10 11 12
Average Age of Onset of Use
11.
2 11.
7 1
2.6
13.
6 1
4.4 1
5.1
Graphics 83
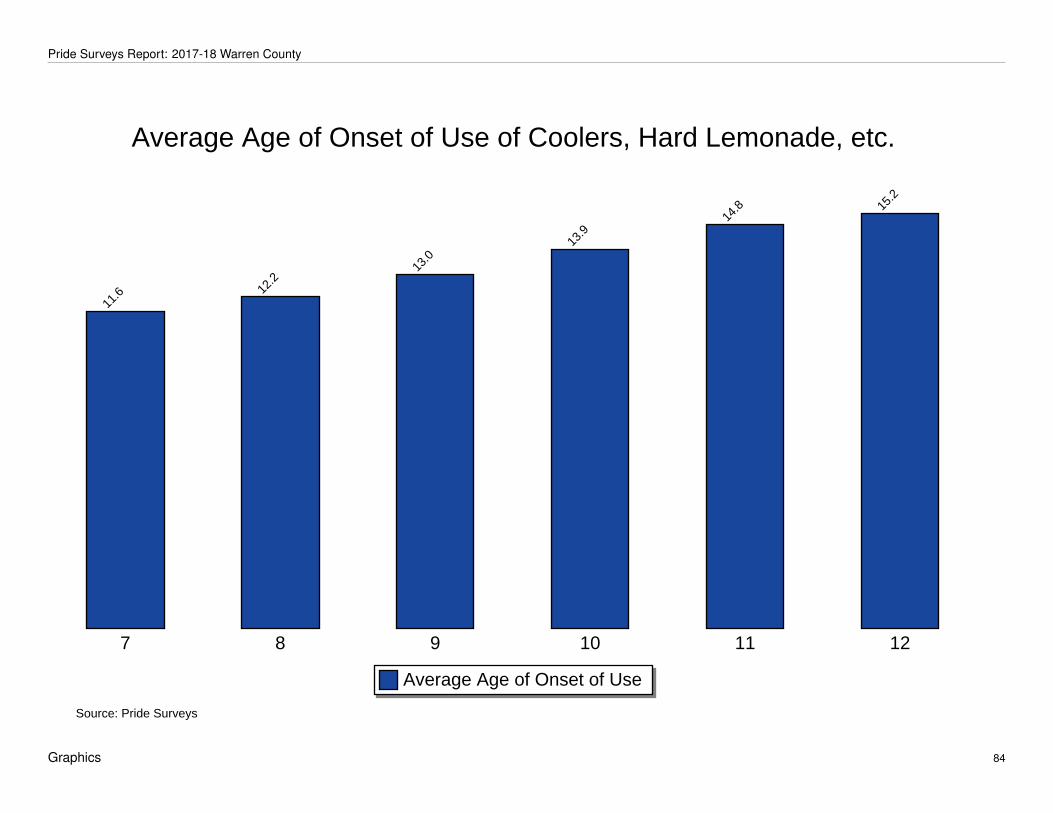
Pride Surveys Report: 2017-18 Warren County
Average Age of Onset of Use of Coolers, Hard Lemonade, etc.
Average Age of Onset of Use of Coolers, Hard Lemonade, etc.
Source: Pride Surveys
7 8 9 10 11 12
Average Age of Onset of Use
11.
6 12.
2 1
3.0
13.
9 1
4.8 1
5.2
Graphics 84

Pride Surveys Report: 2017-18 Warren County
Average Age of Onset of Use of Liquor
Average Age of Onset of Use of Liquor
Source: Pride Surveys
7 8 9 10 11 12
Average Age of Onset of Use
11.
7 12.
2 1
3.2
14.
0 14.
7 15.
4
Graphics 85

Pride Surveys Report: 2017-18 Warren County
Average Age of Onset of Use of Marijuana
Average Age of Onset of Use of Marijuana
Source: Pride Surveys
7 8 9 10 11 12
Average Age of Onset of Use
11.
1
12.
4 1
3.3 1
3.8
15.
0 1
5.3
Graphics 86

Pride Surveys Report: 2017-18 Warren County
Average Age of Onset of Use of Synthetic Marijuana
Average Age of Onset of Use of Synthetic Marijuana
Source: Pride Surveys
7 8 9 10 11 12
Average Age of Onset of Use
11.
3
12.
6 1
2.7
12.
9
15.
1 15.
4
Graphics 87

Pride Surveys Report: 2017-18 Warren County
Average Age of Onset of Use of Bath Salts
Average Age of Onset of Use of Bath Salts
Source: Pride Surveys
7 8 9 10 11 12
Average Age of Onset of Use
10.
8
13.
0 1
2.9
11.
9
13.
5 1
4.5
Graphics 88

Pride Surveys Report: 2017-18 Warren County
Average Age of Onset of Use of Prescription Drugs
Average Age of Onset of Use of Prescription Drugs
Source: Pride Surveys
7 8 9 10 11 12
Average Age of Onset of Use
10.
9 11.
5
12.
9 13.
6 1
4.4 1
4.8
Graphics 89

Pride Surveys Report: 2017-18 Warren County
Average Age of Onset of Use of Over-the-Counter
Average Age of Onset of Use of Over-the-Counter
Source: Pride Surveys
7 8 9 10 11 12
Average Age of Onset of Use
12.
0 12.
5 1
2.7
12.
5
14.
5
14.
3
Graphics 90
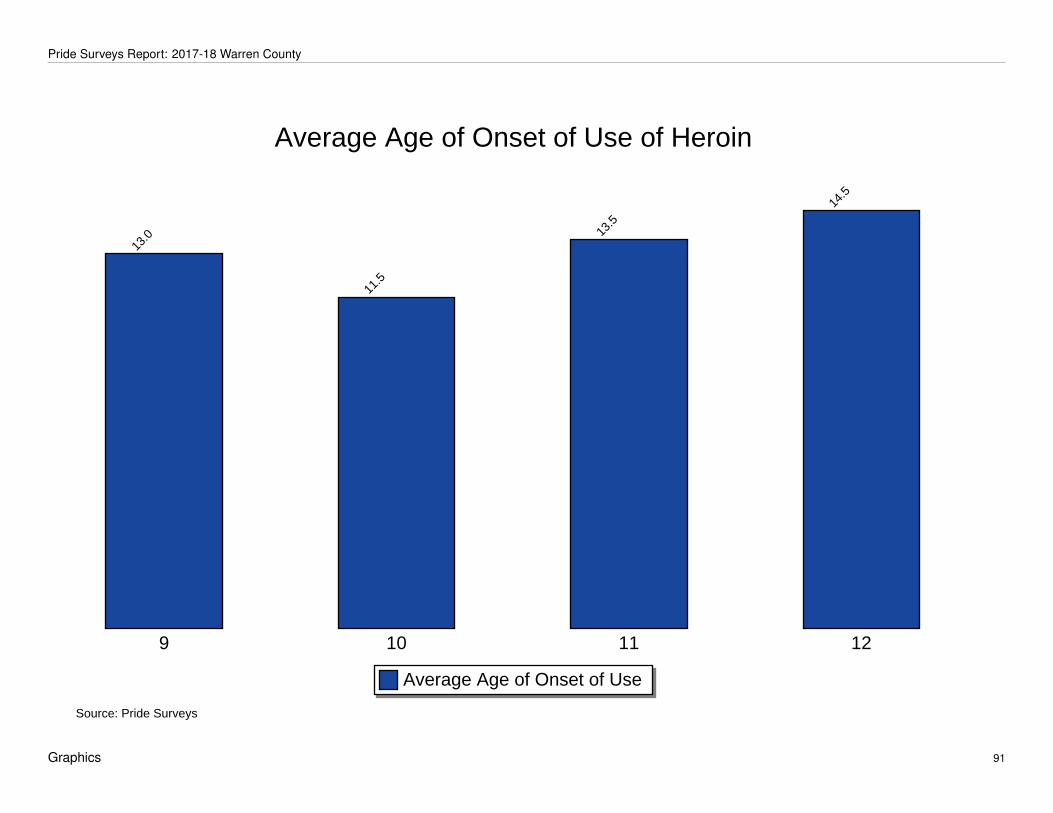
Pride Surveys Report: 2017-18 Warren County
Average Age of Onset of Use of Heroin
Average Age of Onset of Use of Heroin
Source: Pride Surveys
9 10 11 12
Average Age of Onset of Use
13.
0
11.
5
13.
5 1
4.5
Graphics 91

Pride Surveys Report: 2017-18 Warren County
Average Age of Onset of Use of Cocaine
Average Age of Onset of Use of Cocaine
Source: Pride Surveys
8 9 10 11 12
Average Age of Onset of Use
12.
0
14.
3
12.
1
15.
2 15.
7
Graphics 92

Pride Surveys Report: 2017-18 Warren County
Average Age of Onset of Use of Inhalants
Average Age of Onset of Use of Inhalants
Source: Pride Surveys
7 8 9 10 11 12
Average Age of Onset of Use
10.
7 1
1.7
12.
5
12.
0
13.
2 13.
5
Graphics 93

Pride Surveys Report: 2017-18 Warren County
Average Age of Onset of Use of Hallucinogens
Average Age of Onset of Use of Hallucinogens
Source: Pride Surveys
7 8 9 10 11 12
Average Age of Onset of Use
12.
0 1
3.0 1
3.5
12.
8
15.
4 1
5.4
Graphics 94

Pride Surveys Report: 2017-18 Warren County
Average Age of Onset of Use of Steroids
Average Age of Onset of Use of Steroids
Source: Pride Surveys
7 8 9 10 11 12
Average Age of Onset of Use
11.
5 12.
0 12.
5
11.
8
13.
4 14.
1
Graphics 95

Pride Surveys Report: 2017-18 Warren County
Average Age of Onset of Use of Ecstasy
Average Age of Onset of Use of Ecstasy
Source: Pride Surveys
7 8 9 10 11 12
Average Age of Onset of Use
12.
0
16.
0
12.
8
12.
3
14.
3 14.
8
Graphics 96

Pride Surveys Report: 2017-18 Warren County
Average Age of Onset of Use of Meth
Average Age of Onset of Use of Meth
Source: Pride Surveys
7 8 9 10 11 12
Average Age of Onset of Use
10.
0
13.
0 13.
7
10.
8
16.
0
14.
7
Graphics 97

Pride Surveys Report: 2017-18 Warren County
3.6 Student Information
The student information section asks a variety of information about the students that gives us further insight into their home and school lives.
Graphics 98

Pride Surveys Report: 2017-18 Warren County
Attend Church or Synagogue
Attend Church or Synagogue
Source: Pride Surveys
Never Seldom Sometimes Often A Lot
7 8 9 10 11 12
21.
6 22.
4 24.
1
27.
0
34.
7
30.
2
12.
6 13.
3 1
3.9
16.
3
13.
5
17.
2
22.
7
21.
2
19.
7
17.
9 1
7.8
20.
0
17.
2
16.
5
15.
2
14.
3
12.
9
12.
3
25.
9 26.
7 2
7.0
24.
4
21.
1
20.
3
Graphics 99

Pride Surveys Report: 2017-18 Warren County
Take Part in Community Activities
Take Part in Community Activities
Source: Pride Surveys
Never Seldom Sometimes Often A Lot
7 8 9 10 11 12
39.
9
39.
2
32.
2
36.
1
35.
2 3
8.0
13.
8 1
6.7
19.
4
18.
4
15.
2 1
7.4
16.
3 1
6.8
19.
0 21.
0
18.
4 1
8.7
13.
1 1
3.4 1
5.3
13.
4 1
5.8
11.
4
16.
8
13.
9 1
4.1
11.
1
15.
4
14.
5
Graphics 100

Pride Surveys Report: 2017-18 Warren County
Make Good Grades
Make Good Grades
Source: Pride Surveys
Never Seldom Sometimes Often A Lot
7 8 9 10 11 12
0.1
0.1 0
.6 1.2
0.4 1
.3 0
.9 1.3
1.2 2
.8 2
.3 2
.4
13.
1 15.
3 1
5.8 1
7.4
15.
0
13.
5
37.
3 38.
3
36.
5 3
9.4
32.
7
38.
6
48.
6
45.
0 46.
0
39.
1
49.
6
44.
2
Graphics 101

Pride Surveys Report: 2017-18 Warren County
Take Part in Sports Teams
Take Part in Sports Teams
Source: Pride Surveys
Never Seldom Sometimes Often A Lot
7 8 9 10 11 12
29.
2
28.
3
21.
9 23.
8
31.
4
29.
3
8.9 1
0.1
9.4
9.3
7.8
12.
3 1
4.9
13.
5
12.
4 1
2.2
12.
0 12.
7 1
5.3
17.
7 19.
1 20.
7
18.
1
17.
3
31.
6
30.
4
37.
1
34.
0
30.
7
28.
4
Graphics 102

Pride Surveys Report: 2017-18 Warren County
Take Part in School Activities
Take Part in School Activities
Source: Pride Surveys
Never Seldom Sometimes Often A Lot
7 8 9 10 11 12
32.
5 33.
7
29.
0 30.
4 31.
4
27.
1
13.
9 1
6.2 1
6.9
16.
5
15.
1
14.
4
18.
8 1
8.9 1
9.8
19.
4
15.
3
19.
5
15.
3
15.
0 1
5.4 1
6.1
16.
4
15.
5
19.
6
16.
3
19.
0
17.
6
21.
8 23.
4
Graphics 103

Pride Surveys Report: 2017-18 Warren County
Get in Trouble at School
Get in Trouble at School
Source: Pride Surveys
Never Seldom Sometimes Often A Lot
7 8 9 10 11 12
51.
5
45.
8
53.
4 5
7.4
67.
6 69.
6
33.
4 35.
2
34.
5
30.
6
25.
1
23.
0
12.
4 15.
9
9.2
8.1
5.3
5.0
2.0
2.1
1.7 2
.2 1
.5 1
.3 0
.7 1
.1 1
.3 1.8
0.6 1
.1
Graphics 104

Pride Surveys Report: 2017-18 Warren County
Teachers Talk About the Dangers of Drugs
Teachers Talk About the Dangers of Drugs
Source: Pride Surveys
Never Seldom Sometimes Often A Lot
7 8 9 10 11 12
13.
3
9.7
8.5
11.
2
16.
7
20.
4
18.
3
21.
2
20.
5
27.
4 2
9.4
32.
7
29.
5
35.
3
33.
2
32.
5
31.
8 32.
9
22.
4
21.
0
24.
1
17.
7
14.
6
9.6
16.
6
12.
8 13.
7
11.
2
7.4
4.4
Graphics 105

Pride Surveys Report: 2017-18 Warren County
Parents Talk About the Dangers of Drugs
Parents Talk About the Dangers of Drugs
Source: Pride Surveys
Never Seldom Sometimes Often A Lot
7 8 9 10 11 12
7.2 7
.6
7.1 7
.8
10.
7
14.
4
11.
0 1
3.6
15.
7 17.
4 18.
6
23.
2
31.
3 32.
7
31.
6 33.
1
32.
4
36.
1
24.
6 2
4.7
24.
6
23.
3
22.
8
16.
8
25.
8
21.
4
21.
0
18.
4
15.
5
9.4
Graphics 106

Pride Surveys Report: 2017-18 Warren County
Parents Set Clear Rules
Parents Set Clear Rules
Source: Pride Surveys
Never Seldom Sometimes Often A Lot
7 8 9 10 11 12
4.6
5.0
5.0
5.1
5.1
10.
4
3.1 5
.5 5
.2
4.3 6
.2 1
0.0
7.5 9
.5 9
.7 1
3.5 1
5.5 1
8.4
19.
4 22.
2 2
2.9
22.
2 24.
2 26.
3
65.
5
57.
8 5
7.3
54.
9
49.
0
35.
0
Graphics 107

Pride Surveys Report: 2017-18 Warren County
Parents Punish for Breaking Rules
Parents Punish for Breaking Rules
Source: Pride Surveys
Never Seldom Sometimes Often A Lot
7 8 9 10 11 12
16.
7 1
6.2
14.
8 1
4.7 1
6.2
24.
1
2.8
2.8 4
.2 5.2 6
.3 1
0.1
3.2 5
.0 7
.9 9.8
13.
8 1
4.6
11.
3 14.
6 1
4.2
18.
1
16.
8 2
0.5
66.
0
61.
5
58.
9
52.
1
46.
9
30.
6
Graphics 108

Pride Surveys Report: 2017-18 Warren County
How Often Do You Experience Stress In Your Life
How Often Do You Experience Stress In Your Life
Source: Pride Surveys
Never Seldom Sometimes Often A Lot
7 8 9 10 11 12
8.1
5.4
3.4
5.5
4.3
7.2
24.
9
16.
9
11.
7 1
1.6
6.0
10.
8
31.
6
30.
2
25.
3
22.
9
20.
8 2
1.3
19.
7
23.
1
28.
8
24.
8 26.
0
24.
7
15.
7
24.
4
30.
9
35.
2
42.
9
36.
1
Graphics 109
Pride Surveys Report: 2017-18 Warren County
3.7 Availability
This section is related to the question "How easy is it to get..." various substances.
Graphics 110

Pride Surveys Report: 2017-18 Warren County
Availability -- Any Tobacco
Availability -- Any Tobacco
Source: Pride Surveys
Don't Know Very Difficult to Get Fairly Difficult to Get Fairly Easy to Get Very Easy to Get
7 8 9 10 11 12
70.
0
57.
7
54.
9
45.
4 4
5.6
31.
9
2.6 3
.4
2.4
1.8
1.7
1.6 4
.2 6.7 8
.4 9.9
6.9
3.4
11.
2 1
5.9 1
8.2
23.
3
21.
3 2
0.9
11.
9 1
6.3
16.
0 19.
6 2
4.5
42.
2
Graphics 111
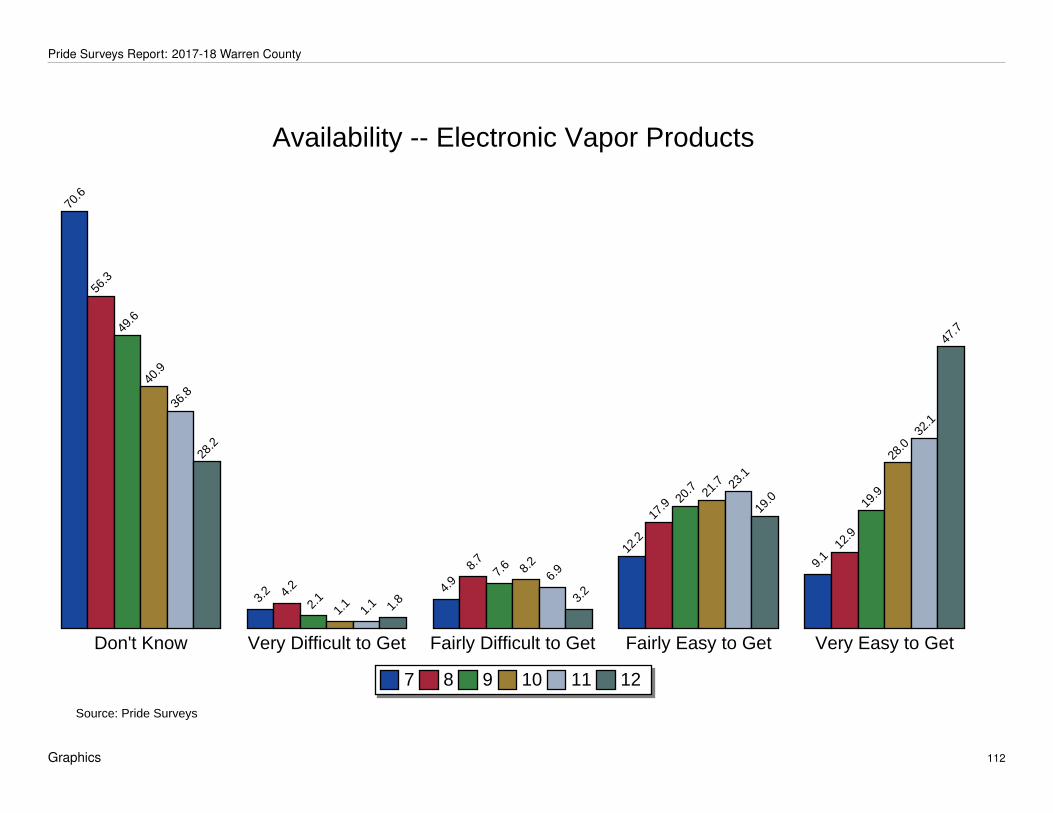
Pride Surveys Report: 2017-18 Warren County
Availability -- Electronic Vapor Products
Availability -- Electronic Vapor Products
Source: Pride Surveys
Don't Know Very Difficult to Get Fairly Difficult to Get Fairly Easy to Get Very Easy to Get
7 8 9 10 11 12
70.
6
56.
3
49.
6
40.
9
36.
8
28.
2
3.2 4
.2
2.1
1.1
1.1 1
.8 4
.9 8
.7
7.6 8
.2
6.9
3.2
12.
2
17.
9 20.
7 2
1.7 2
3.1
19.
0
9.1
12.
9
19.
9
28.
0 3
2.1
47.
7
Graphics 112

Pride Surveys Report: 2017-18 Warren County
Availability -- Any Alcohol
Availability -- Any Alcohol
Source: Pride Surveys
Don't Know Very Difficult to Get Fairly Difficult to Get Fairly Easy to Get Very Easy to Get
7 8 9 10 11 12
65.
4
51.
1
45.
4
38.
8
34.
2
25.
3
3.1 5
.4
3.0
3.3
2.8 4
.4 6.1
10.
4 11.
7 1
1.2 1
4.4
12.
2
11.
4 1
6.4 1
8.3
25.
0
22.
6 2
6.4
14.
0 16.
8 2
1.6
21.
8 2
6.0
31.
7
Graphics 113

Pride Surveys Report: 2017-18 Warren County
Availability -- Marijuana
Availability -- Marijuana
Source: Pride Surveys
Don't Know Very Difficult to Get Fairly Difficult to Get Fairly Easy to Get Very Easy to Get
7 8 9 10 11 12
78.
3
66.
4
59.
3
47.
4
43.
5
33.
3
6.9 8
.2
4.1 4
.7
2.4 3
.4 6.2 8
.5 1
3.0
11.
4
9.7
10.
3
5.1
9.7 1
3.0
20.
0 1
9.6 2
3.1
3.5
7.2
10.
6 1
6.4
24.
8 2
9.9
Graphics 114

Pride Surveys Report: 2017-18 Warren County
Availability -- Prescription Drugs
Availability -- Prescription Drugs
Source: Pride Surveys
Don't Know Very Difficult to Get Fairly Difficult to Get Fairly Easy to Get Very Easy to Get
7 8 9 10 11 12
71.
2
59.
4 5
9.6
53.
7 55.
0 5
4.8
6.0 6
.5 7.7
7.5
5.4 5
.9 5
.4 9
.4 9
.2
14.
9
11.
7 13.
0
9.1
13.
0
10.
5 12.
6 1
3.2
11.
6
8.2
11.
7 1
2.9
11.
3 14.
7 1
4.6
Graphics 115

Pride Surveys Report: 2017-18 Warren County
Availability -- Other Illicit Drugs
Availability -- Other Illicit Drugs
Source: Pride Surveys
Don't Know Very Difficult to Get Fairly Difficult to Get Fairly Easy to Get Very Easy to Get
7 8 9 10 11 12
81.
5
75.
4
69.
3
61.
6 65.
0
62.
2
5.2 8
.0 8.9
9.0
6.4 7
.1
5.8 7
.4 8.2
14.
9
11.
2 1
2.2
3.7 5
.1 7.3 8
.0 8
.4 8
.7
3.8
4.2 6
.3 6
.5 9.0 9
.9
Graphics 116

Pride Surveys Report: 2017-18 Warren County
3.8 Where Do You Use
We ask the students "Where do you usually..." Possible responses include do not use (which we do not include in the chart), at home, at school, in a car, friend’shouse, parties, and other.
Graphics 117

Pride Surveys Report: 2017-18 Warren County
Where Do You Use Any Tobacco
Where Do You Use Any Tobacco
Source: Pride Surveys
At Home At School In a Car Friend's House Party Other
7 8 9 101112 7 8 9 101112 7 8 9 101112 7 8 9 101112 7 8 9 101112 7 8 9 101112
0.8
2.8 3
.0
4.4
4.3
6.4
0.1 0
.3 0.6 0
.8
0.6
0.6
0.1
0.7
1.5
2.5
3.5
7.7
0.7
2.7
3.7
4.8
5.5
10.
6
0.3
1.2
1.8
2.5
3.3
10.
0
0.8
1.9
2.4
2.1
2.9
5.5
Graphics 118

Pride Surveys Report: 2017-18 Warren County
Where Do You Use Any Alcohol
Where Do You Use Any Alcohol
Source: Pride Surveys
At Home At School In a Car Friend's House Party Other
7 8 9 101112 7 8 9 101112 7 8 9 101112 7 8 9 101112 7 8 9 101112 7 8 9 101112
3.3
7.0
8.1
12.
9
15.
7
19.
6
0.1
0.1 0
.5 0.9
0.2
1.5
0.0 0
.3 0.7 1
.4 1
.4 1
.5 1
.2
5.0
7.9
13.
6
19.
2
24.
3
1.6
3.7
5.8
10.
8
19.
2
25.
1
1.1 2
.1 2.6
2.6
4.1 4
.7
Graphics 119

Pride Surveys Report: 2017-18 Warren County
Where Do You Use Any Illicit Drug
Where Do You Use Any Illicit Drug
Source: Pride Surveys
At Home At School In a Car Friend's House Party Other
7 8 9 101112 7 8 9 101112 7 8 9 101112 7 8 9 101112 7 8 9 101112 7 8 9 101112
2.4
4.2 4
.8
6.6
10.
6 1
1.7
0.1 0
.3 1
.2 1.4
2.2
2.3
0.6 1
.0 2
.2
4.4
8.8
9.6
0.8
3.3
6.0
9.4
14.
1
18.
3
0.8
1.7
3.2
6.0
12.
2 1
3.2
1.2 1
.7 2
.9 3.6
5.9 6
.4
Graphics 120

Pride Surveys Report: 2017-18 Warren County
Where Do You Use Cigarettes
Where Do You Use Cigarettes
Source: Pride Surveys
At Home At School In a Car Friend's House Party Other
7 8 9 101112 7 8 9 101112 7 8 9 101112 7 8 9 101112 7 8 9 101112 7 8 9 101112
0.5
2.2 2
.4 2
.7
1.8
3.2
0.1
0.0 0
.2 0
.5 0.6
0.4
0.1
0.4
0.8
1.3
2.2
3.8
0.7
2.1
2.8
2.6
3.5
4.9
0.2
0.7
1.6 1
.8
2.9
5.1
0.7
1.6
1.6
1.0
2.0 2
.1
Graphics 121

Pride Surveys Report: 2017-18 Warren County
Where Do You Use Smokeless Tobacco
Where Do You Use Smokeless Tobacco
Source: Pride Surveys
At Home At School In a Car Friend's House Party Other
7 8 9 101112 7 8 9 101112 7 8 9 101112 7 8 9 101112 7 8 9 101112 7 8 9 101112
0.1
0.9
1.6
1.6
1.6
1.9
0.1 0
.2 0
.5 0.6
0.2
0.6
0.0
0.3
0.7
1.0
1.0
2.8
0.2
1.1
1.7 1
.9
1.8
3.2
0.1
0.8
0.7
1.0
0.4
3.6
0.3
0.6
1.1 1
.3
1.2
3.0
Graphics 122

Pride Surveys Report: 2017-18 Warren County
Where Do You Use Cigars
Where Do You Use Cigars
Source: Pride Surveys
At Home At School In a Car Friend's House Party Other
7 8 9 101112 7 8 9 101112 7 8 9 101112 7 8 9 101112 7 8 9 101112 7 8 9 101112
0.3
0.7
0.5
2.1
2.0
2.8
0.1
0.1
0.5 0
.6
0.0
0.4
0.0 0
.2 0
.6 1
.0
1.6
2.8
0.2
0.9
1.3
2.3
2.2
6.4
0.1 0
.3
0.2
1.2
1.6
5.5
0.4 0
.6
1.3
0.6
1.0
3.0
Graphics 123

Pride Surveys Report: 2017-18 Warren County
Where Do You Use Electronic Vapor Products
Where Do You Use Electronic Vapor Products
Source: Pride Surveys
At Home At School In a Car Friend's House Party Other
7 8 9 101112 7 8 9 101112 7 8 9 101112 7 8 9 101112 7 8 9 101112 7 8 9 101112
2.1
4.6
7.4
9.0
11.
4
13.
8
0.0 0
.3
2.2
3.2
5.3 6
.0
0.6
1.9
4.5
7.1
13.
7
17.
7
2.0
6.1
9.7
11.
8
16.
7 1
7.9
1.1
3.4
5.8
7.7
12.
7 13.
2
1.6
3.3 3
.7
2.6
5.9
6.8
Graphics 124

Pride Surveys Report: 2017-18 Warren County
Where Do You Use Beer
Where Do You Use Beer
Source: Pride Surveys
At Home At School In a Car Friend's House Party Other
7 8 9 101112 7 8 9 101112 7 8 9 101112 7 8 9 101112 7 8 9 101112 7 8 9 101112
2.7
5.6 6
.4
9.9
11.
2
14.
7
0.1
0.1 0
.4 0.8
0.0
1.3
0.0 0
.3 0.5 1
.0 1
.0 1
.1 0
.9
4.2
6.8
10.
1
15.
5
21.
7
1.0
2.9
4.8
8.3
16.
1
23.
6
0.8 1
.7 1
.8 1
.9 2.4
4.5
Graphics 125
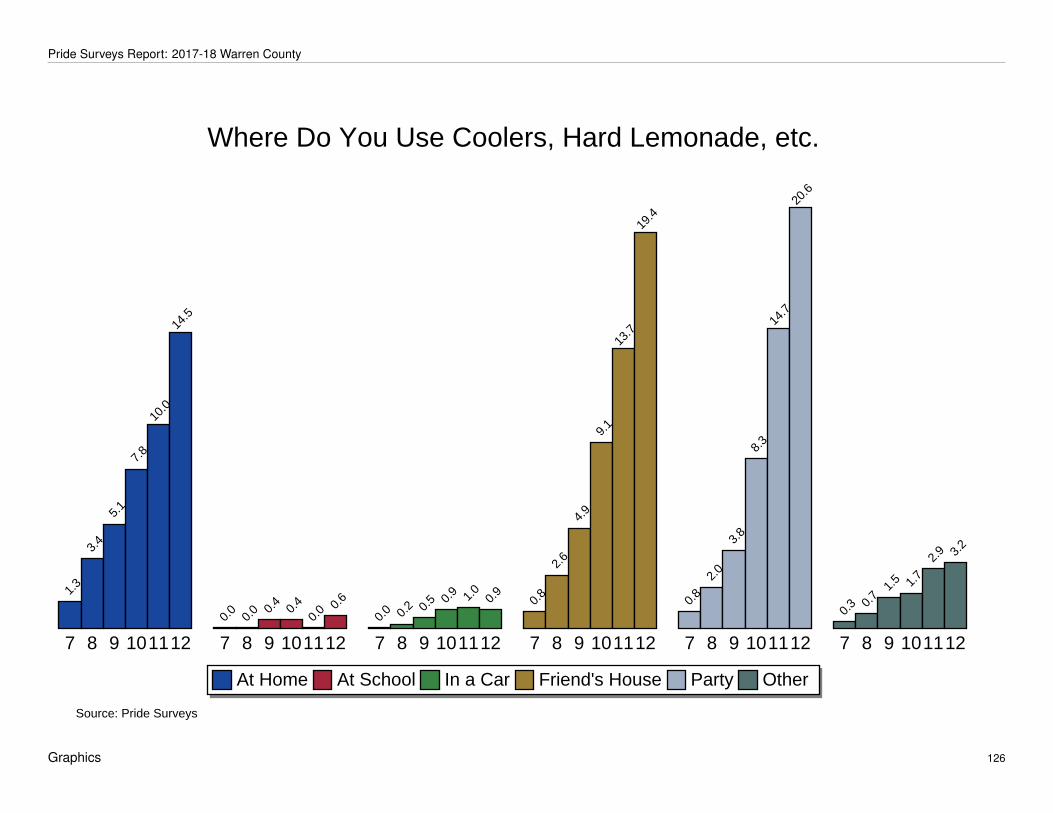
Pride Surveys Report: 2017-18 Warren County
Where Do You Use Coolers, Hard Lemonade, etc.
Where Do You Use Coolers, Hard Lemonade, etc.
Source: Pride Surveys
At Home At School In a Car Friend's House Party Other
7 8 9 101112 7 8 9 101112 7 8 9 101112 7 8 9 101112 7 8 9 101112 7 8 9 101112
1.3
3.4
5.1
7.8
10.
0
14.
5
0.0
0.0 0
.4 0
.4
0.0 0
.6
0.0 0
.2 0.5 0
.9 1
.0 0
.9 0
.8
2.6
4.9
9.1
13.
7
19.
4
0.8
2.0
3.8
8.3
14.
7
20.
6
0.3 0
.7 1.5 1
.7 2
.9 3.2
Graphics 126

Pride Surveys Report: 2017-18 Warren County
Where Do You Use Liquor
Where Do You Use Liquor
Source: Pride Surveys
At Home At School In a Car Friend's House Party Other
7 8 9 101112 7 8 9 101112 7 8 9 101112 7 8 9 101112 7 8 9 101112 7 8 9 101112
1.0
3.6
4.5
7.9
10.
6
14.
9
0.0
0.1 0
.4 0
.4 0
.2 1
.1
0.0
0.1 0
.5 0.9 1
.2
0.9
0.7
3.2
5.5
9.6
14.
3
20.
6
0.8
2.2
3.9
7.7
15.
7
21.
5
0.3
1.3
1.4 1
.9 2
.9 2
.8
Graphics 127

Pride Surveys Report: 2017-18 Warren County
Where Do You Use Marijuana
Where Do You Use Marijuana
Source: Pride Surveys
At Home At School In a Car Friend's House Party Other
7 8 9 101112 7 8 9 101112 7 8 9 101112 7 8 9 101112 7 8 9 101112 7 8 9 101112
0.6
1.5
2.7
4.8
7.1
9.1
0.0
0.1 0
.5 0
.5 1.2 1
.7
0.2 0
.9 1
.8
3.6
8.2
9.4
0.6
2.9
5.2
8.8
13.
3
17.
7
0.5
1.6
2.9
5.5
11.
6 1
2.6
0.7 1
.1 2
.1 2
.9
5.3
5.3
Graphics 128

Pride Surveys Report: 2017-18 Warren County
Where Do You Use Synthetic Marijuana
Where Do You Use Synthetic Marijuana
Source: Pride Surveys
At Home At School In a Car Friend's House Party Other
7 8 9 101112 7 8 9 101112 7 8 9 101112 7 8 9 101112 7 8 9 101112 7 8 9 101112
0.2 0
.3 0.5
0.8
0.6
0.4
0.0
0.0 0
.2 0.3
0.0
0.4
0.1 0
.2 0.3
0.3 0
.4
0.2
0.2
0.5
1.1 1
.2 1
.2 1
.5
0.1
0.4 0
.5
0.9
1.2
1.5
0.1 0
.3 0.5
0.3
0.6
1.1
Graphics 129

Pride Surveys Report: 2017-18 Warren County
Where Do You Use Bath Salts
Where Do You Use Bath Salts
Source: Pride Surveys
At Home At School In a Car Friend's House Party Other
7 8 9 101112 7 8 9 101112 7 8 9 101112 7 8 9 101112 7 8 9 101112 7 8 9 101112 0
.0 0.1 0
.3 0.5
0.2
0.0
0.0 0
.1 0
.1 0
.1
0.0
0.4
0.0
0.0 0
.1 0
.1
0.0
0.0
0.0 0
.1 0.2 0
.4
0.0
0.0
0.0 0
.1 0
.1 0
.1
0.0
0.6
0.1 0
.3
0.2 0
.3 0.4
0.9
Graphics 130

Pride Surveys Report: 2017-18 Warren County
Where Do You Use Prescription Drugs
Where Do You Use Prescription Drugs
Source: Pride Surveys
At Home At School In a Car Friend's House Party Other
7 8 9 101112 7 8 9 101112 7 8 9 101112 7 8 9 101112 7 8 9 101112 7 8 9 101112
1.3
2.0
1.6 1
.8
2.7
2.1
0.0
0.0
0.5
0.8
0.6
1.1
0.3
0.1
0.1
1.0
0.4
0.2
0.1
0.5
0.5
1.0
0.6
0.6
0.1
0.1
0.1
0.4
0.4
0.9
0.4
0.2
0.6
0.5 0
.6
1.1
Graphics 131

Pride Surveys Report: 2017-18 Warren County
Where Do You Use Over-the-Counter
Where Do You Use Over-the-Counter
Source: Pride Surveys
At Home At School In a Car Friend's House Party Other
7 8 9 101112 7 8 9 101112 7 8 9 101112 7 8 9 101112 7 8 9 101112 7 8 9 101112 0
.0
0.8
0.5
0.5 0
.6
1.1
0.0 0
.1 0
.4 0
.4
0.0 0
.2
0.0 0
.1 0.2 0
.3
0.2
0.0
0.0 0
.2 0
.2 0
.5
0.2
0.2
0.0 0
.1 0.2 0
.3 0.4
0.4
0.1
0.1
0.4
0.3 0
.4 0.6
Graphics 132

Pride Surveys Report: 2017-18 Warren County
Where Do You Use Heroin
Where Do You Use Heroin
Source: Pride Surveys
At Home At School In a Car Friend's House Party Other
7 8 9 101112 7 8 9 101112 7 8 9 101112 7 8 9 101112 7 8 9 101112 7 8 9 101112 0
.0 0.1
0.1
0.4
0.2
0.0
0.0
0.0 0
.1 0.3
0.2 0
.4
0.0 0
.1
0.0
0.3
0.2
0.0
0.0 0
.1 0.2 0
.3
0.2
0.0
0.0 0
.1
0.0
0.3
0.2 0
.4
0.1
0.0
0.3
0.3
0.6
0.9
Graphics 133

Pride Surveys Report: 2017-18 Warren County
Where Do You Use Cocaine
Where Do You Use Cocaine
Source: Pride Surveys
At Home At School In a Car Friend's House Party Other
7 8 9 101112 7 8 9 101112 7 8 9 101112 7 8 9 101112 7 8 9 101112 7 8 9 101112 0
.0 0.1 0
.3 0.4
0.0
0.4
0.0
0.0 0
.1
0.6
0.0
0.4
0.0 0
.1 0.2 0
.4
0.0 0
.2
0.0 0
.1 0
.1
0.5
0.4 0
.6
0.0 0
.1
0.0
0.4
0.4
1.1
0.1
0.0
0.3
0.3 0
.4
1.1
Graphics 134

Pride Surveys Report: 2017-18 Warren County
Where Do You Use Inhalants
Where Do You Use Inhalants
Source: Pride Surveys
At Home At School In a Car Friend's House Party Other
7 8 9 101112 7 8 9 101112 7 8 9 101112 7 8 9 101112 7 8 9 101112 7 8 9 101112
0.1 0
.3 0.5
0.5
0.4
0.2
0.1
0.1
0.5
0.4
0.0 0
.2
0.1
0.1
0.0
0.4
0.0 0
.2
0.1
0.1 0
.3 0
.3
0.2
0.0 0
.1 0
.1
0.0
0.3
0.0
0.4
0.2
0.0
0.3
0.3 0
.4 0.6
Graphics 135

Pride Surveys Report: 2017-18 Warren County
Where Do You Use Hallucinogens
Where Do You Use Hallucinogens
Source: Pride Surveys
At Home At School In a Car Friend's House Party Other
7 8 9 101112 7 8 9 101112 7 8 9 101112 7 8 9 101112 7 8 9 101112 7 8 9 101112
0.1 0
.2 0.3
1.3
0.4
1.1
0.0
0.0 0
.1
0.5
0.0 0
.2
0.0 0
.1 0.2
0.8
0.0
0.0
0.0
0.3
0.3
1.4
0.4
1.1
0.0 0
.1 0.3
0.8
0.6
0.6
0.1
0.0
0.5
0.5 0
.6 0
.9
Graphics 136
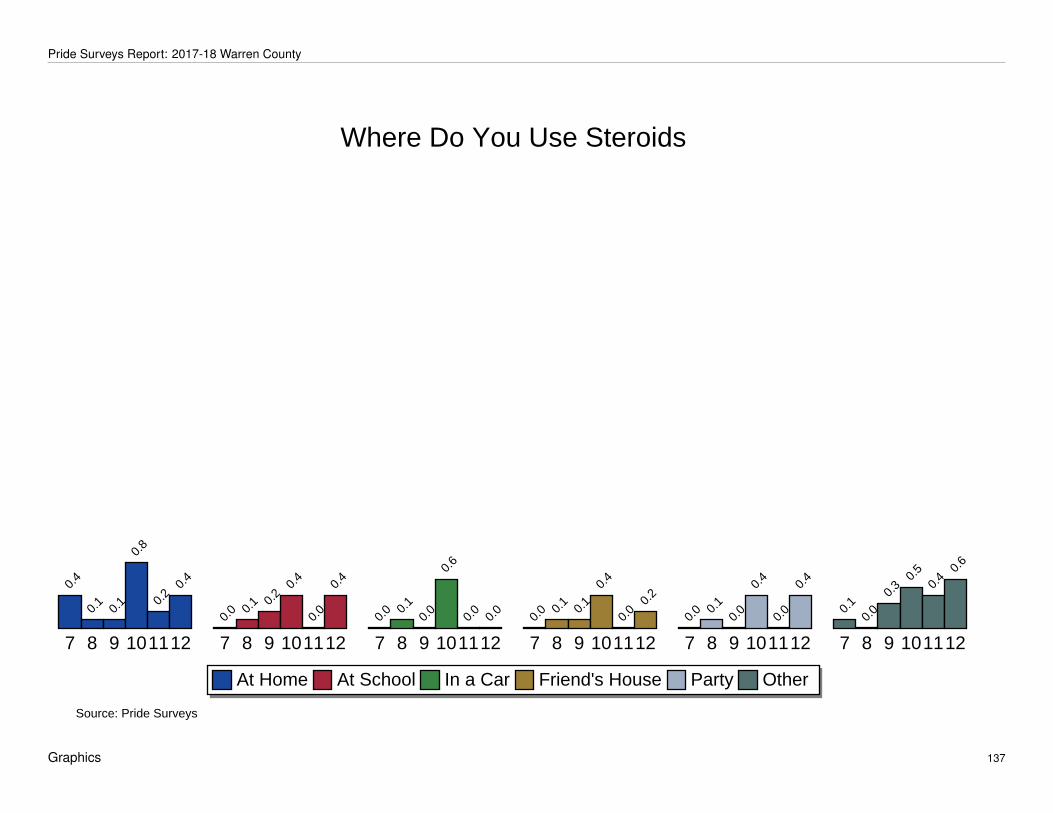
Pride Surveys Report: 2017-18 Warren County
Where Do You Use Steroids
Where Do You Use Steroids
Source: Pride Surveys
At Home At School In a Car Friend's House Party Other
7 8 9 101112 7 8 9 101112 7 8 9 101112 7 8 9 101112 7 8 9 101112 7 8 9 101112
0.4
0.1
0.1
0.8
0.2 0
.4
0.0 0
.1 0.2 0
.4
0.0
0.4
0.0 0
.1
0.0
0.6
0.0
0.0
0.0 0
.1 0
.1 0
.4
0.0 0
.2
0.0 0
.1
0.0
0.4
0.0
0.4
0.1
0.0
0.3 0
.5
0.4 0
.6
Graphics 137
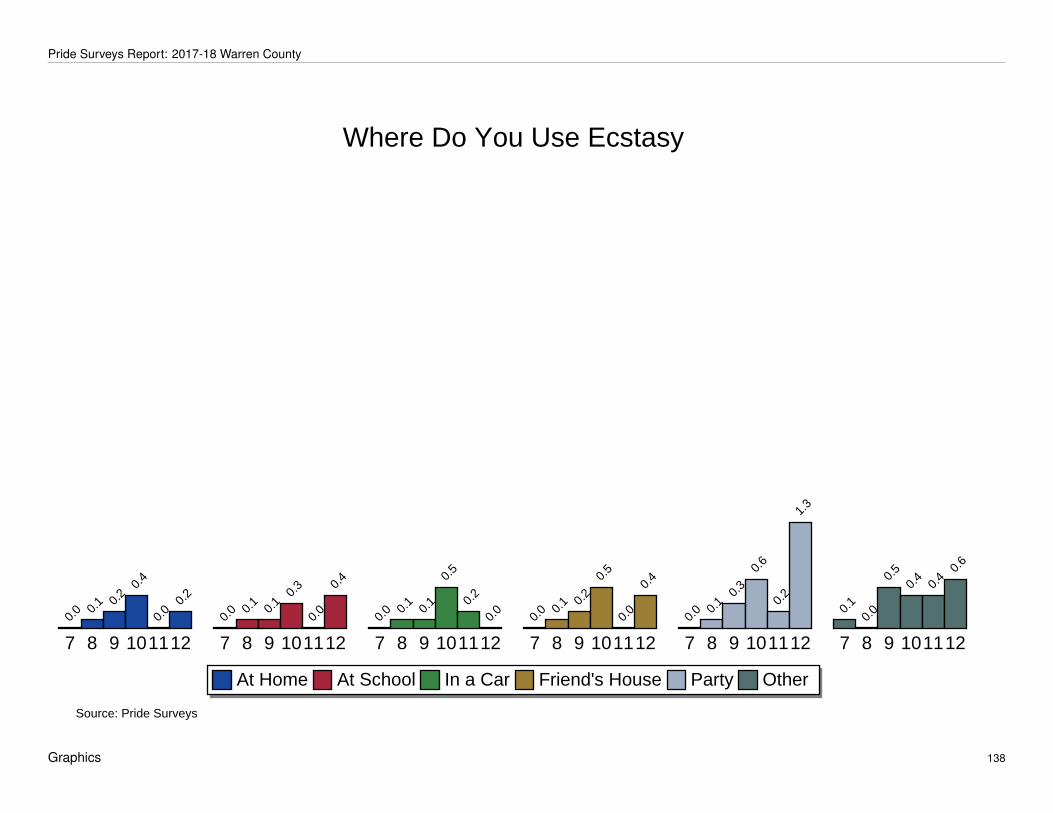
Pride Surveys Report: 2017-18 Warren County
Where Do You Use Ecstasy
Where Do You Use Ecstasy
Source: Pride Surveys
At Home At School In a Car Friend's House Party Other
7 8 9 101112 7 8 9 101112 7 8 9 101112 7 8 9 101112 7 8 9 101112 7 8 9 101112 0
.0 0.1 0
.2 0.4
0.0 0
.2
0.0 0
.1 0
.1 0.3
0.0
0.4
0.0 0
.1 0
.1
0.5
0.2
0.0
0.0 0
.1 0.2
0.5
0.0
0.4
0.0 0
.1 0.3
0.6
0.2
1.3
0.1
0.0
0.5
0.4
0.4 0
.6
Graphics 138
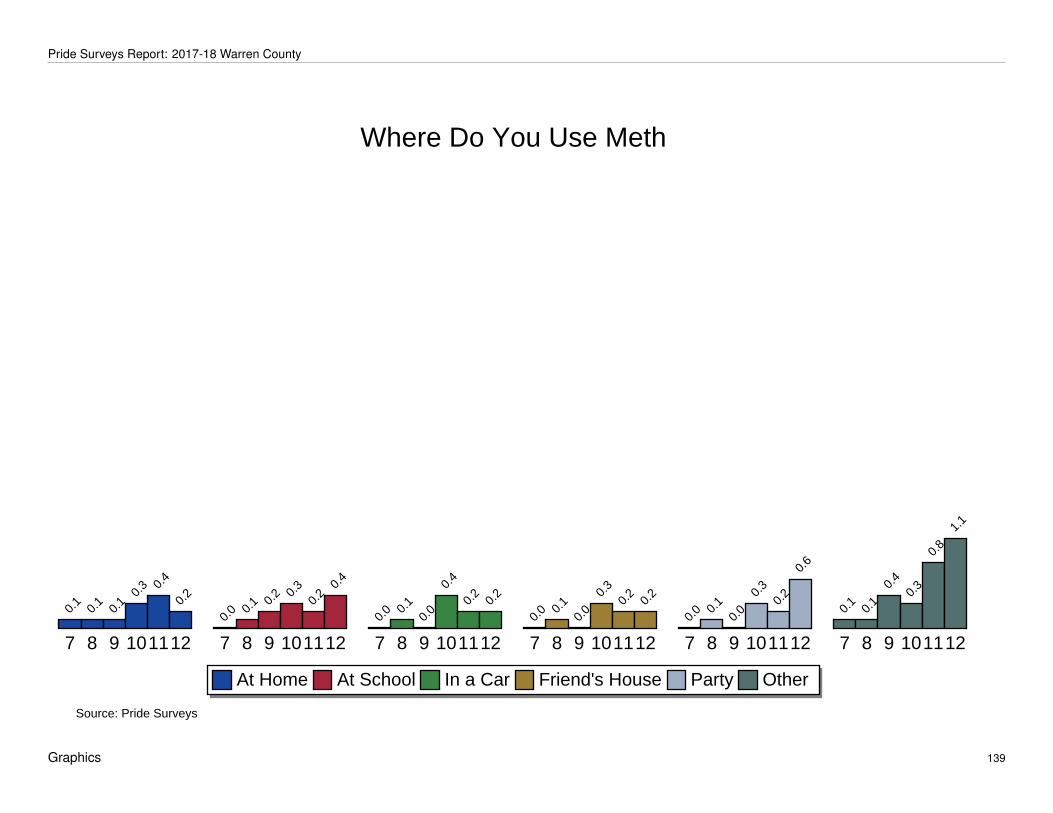
Pride Surveys Report: 2017-18 Warren County
Where Do You Use Meth
Where Do You Use Meth
Source: Pride Surveys
At Home At School In a Car Friend's House Party Other
7 8 9 101112 7 8 9 101112 7 8 9 101112 7 8 9 101112 7 8 9 101112 7 8 9 101112
0.1
0.1
0.1 0
.3 0.4
0.2
0.0 0
.1 0.2 0
.3
0.2 0
.4
0.0 0
.1
0.0
0.4
0.2
0.2
0.0 0
.1
0.0
0.3
0.2
0.2
0.0 0
.1
0.0
0.3
0.2
0.6
0.1
0.1
0.4
0.3
0.8
1.1
Graphics 139

Pride Surveys Report: 2017-18 Warren County
3.9 When Do You Use
We ask the students "When do you usually..." Possible responses include do not use (which we do not include in the chart), before, during, and after school,weeknights, and weekends. Past analysis of national statistics shows that during school is typically the least popular time of use.
Graphics 140

Pride Surveys Report: 2017-18 Warren County
When Do You Use Any Tobacco
When Do You Use Any Tobacco
Source: Pride Surveys
Before School During School After School Week Night Weekend
7 8 9 10 11 12 7 8 9 10 11 12 7 8 9 10 11 12 7 8 9 10 11 12 7 8 9 10 11 12
0.2 0
.6 0
.6 1
.3 1.4
2.1
0.1 0
.5 0
.5 0.6
0.2
1.1
0.6
1.8 2
.0
3.5 3
.7
5.7
0.4
1.5
1.2
2.2
1.8
6.2
1.0
3.4
4.2
5.3
5.3
13.
8
Graphics 141

Pride Surveys Report: 2017-18 Warren County
When Do You Use Any Alcohol
When Do You Use Any Alcohol
Source: Pride Surveys
Before School During School After School Week Night Weekend
7 8 9 10 11 12 7 8 9 10 11 12 7 8 9 10 11 12 7 8 9 10 11 12 7 8 9 10 11 12 0
.0 0.4
0.2 0
.5 0
.2 0.6
0.0 0
.3 0
.1 0.6
0.0 0
.6 0
.6 1.5
1.2
2.9
1.4
3.4
0.5 1
.7 1
.5 2.1
2.0
4.3
2.7
6.9
12.
5
18.
4
28.
2
36.
0
Graphics 142

Pride Surveys Report: 2017-18 Warren County
When Do You Use Any Illicit Drug
When Do You Use Any Illicit Drug
Source: Pride Surveys
Before School During School After School Week Night Weekend
7 8 9 10 11 12 7 8 9 10 11 12 7 8 9 10 11 12 7 8 9 10 11 12 7 8 9 10 11 12
0.8 1
.3 1.6
2.7
1.8
3.8
0.2
0.1 0
.4 0.6
0.4
1.5
1.1
2.5
3.4 4
.2 5
.3
8.1
1.5 2
.1 3
.3 4
.3 5
.5
9.1
1.6
4.3
7.1
10.
0
17.
8
20.
2
Graphics 143

Pride Surveys Report: 2017-18 Warren County
When Do You Use Cigarettes
When Do You Use Cigarettes
Source: Pride Surveys
Before School During School After School Week Night Weekend
7 8 9 10 11 12 7 8 9 10 11 12 7 8 9 10 11 12 7 8 9 10 11 12 7 8 9 10 11 12
0.1
0.5
0.4
1.0
0.8
1.1
0.0 0
.2 0
.2 0.3
0.2
0.6
0.5
1.6
1.5
2.5
2.4
3.6
0.4
1.1
0.7 0
.9
1.4
3.0
0.8
2.7
3.5
2.6
3.7
6.4
Graphics 144

Pride Surveys Report: 2017-18 Warren County
When Do You Use Smokeless Tobacco
When Do You Use Smokeless Tobacco
Source: Pride Surveys
Before School During School After School Week Night Weekend
7 8 9 10 11 12 7 8 9 10 11 12 7 8 9 10 11 12 7 8 9 10 11 12 7 8 9 10 11 12
0.1
0.4
0.4
0.4 0
.6 0
.6
0.0
0.4
0.3 0
.4
0.0
0.6
0.1
0.6 0
.8
1.3
1.2
1.5
0.1
0.5
0.5
0.8
0.6
2.3
0.2
1.2
1.6
2.2
1.4
5.5
Graphics 145

Pride Surveys Report: 2017-18 Warren County
When Do You Use Cigars
When Do You Use Cigars
Source: Pride Surveys
Before School During School After School Week Night Weekend
7 8 9 10 11 12 7 8 9 10 11 12 7 8 9 10 11 12 7 8 9 10 11 12 7 8 9 10 11 12 0
.0 0.1
0.0 0
.1 0
.0 0.4
0.1
0.1 0
.3 0
.3
0.0 0
.2
0.0
0.5 0
.6 0
.5 1
.0 1
.7
0.1 0
.5
0.3
1.0
0.4
2.6
0.2
1.4
1.2
2.2
2.9
10.
6
Graphics 146

Pride Surveys Report: 2017-18 Warren County
When Do You Use Electronic Vapor Products
When Do You Use Electronic Vapor Products
Source: Pride Surveys
Before School During School After School Week Night Weekend
7 8 9 10 11 12 7 8 9 10 11 12 7 8 9 10 11 12 7 8 9 10 11 12 7 8 9 10 11 12
0.6 0
.9 1.6
3.9
5.1
6.0
0.1
0.2
1.3
2.9
4.1 4
.9
1.5
3.3
5.8
7.3
12.
9
14.
9
1.2 1
.9
3.5
5.6
9.4
12.
3
2.8
7.2
10.
0 1
1.3
16.
5
20.
0
Graphics 147

Pride Surveys Report: 2017-18 Warren County
When Do You Use Beer
When Do You Use Beer
Source: Pride Surveys
Before School During School After School Week Night Weekend
7 8 9 10 11 12 7 8 9 10 11 12 7 8 9 10 11 12 7 8 9 10 11 12 7 8 9 10 11 12 0
.0 0.3
0.1 0
.4 0
.0 0.4
0.0 0
.2 0
.0 0.3
0.0 0
.2 0.4 1
.2 0
.8 2
.5
1.0
2.8
0.5 1
.1 0
.9 1.7
1.4
3.6
2.2
5.4
9.6
14.
8
22.
7
32.
1
Graphics 148

Pride Surveys Report: 2017-18 Warren County
When Do You Use Coolers, Hard Lemonade, etc.
When Do You Use Coolers, Hard Lemonade, etc.
Source: Pride Surveys
Before School During School After School Week Night Weekend
7 8 9 10 11 12 7 8 9 10 11 12 7 8 9 10 11 12 7 8 9 10 11 12 7 8 9 10 11 12 0
.0 0
.1 0
.1 0.3
0.0 0
.2 0
.0 0.2
0.0 0
.3 0
.0 0.4
0.3 0
.7 0
.8 2
.5
0.8
2.1
0.3 0
.8 1.0 1
.6 1
.4 2
.8
1.6
4.0
8.2
13.
9
22.
0
32.
3
Graphics 149

Pride Surveys Report: 2017-18 Warren County
When Do You Use Liquor
When Do You Use Liquor
Source: Pride Surveys
Before School During School After School Week Night Weekend
7 8 9 10 11 12 7 8 9 10 11 12 7 8 9 10 11 12 7 8 9 10 11 12 7 8 9 10 11 12 0
.0 0
.2 0
.1 0.4
0.2
0.4
0.0
0.1
0.1
0.3
0.0 0
.4 0
.1 1.0
0.6 1
.8 1
.4 2.1
0.3 1
.0 1
.0 1.6
1.4
2.8
1.2
4.6
8.2
13.
5
21.
6
33.
2
Graphics 150

Pride Surveys Report: 2017-18 Warren County
When Do You Use Marijuana
When Do You Use Marijuana
Source: Pride Surveys
Before School During School After School Week Night Weekend
7 8 9 10 11 12 7 8 9 10 11 12 7 8 9 10 11 12 7 8 9 10 11 12 7 8 9 10 11 12
0.2 0
.5 0.9
2.1
1.4
2.8
0.1
0.1
0.2
0.1
0.2 0
.9
0.6 1
.3 2
.3 3
.5 4
.5
6.6
0.6 1
.2 2
.2
3.6
5.5
7.4
0.8
3.4
6.0
9.1
17.
1
19.
4
Graphics 151
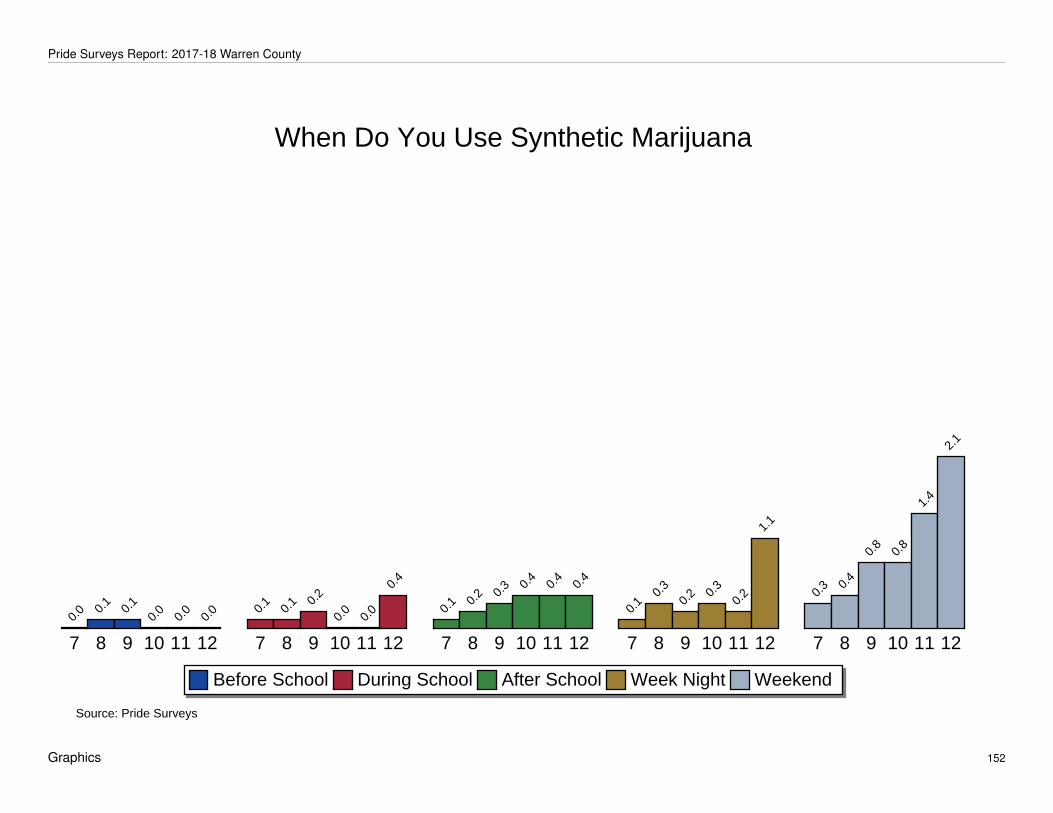
Pride Surveys Report: 2017-18 Warren County
When Do You Use Synthetic Marijuana
When Do You Use Synthetic Marijuana
Source: Pride Surveys
Before School During School After School Week Night Weekend
7 8 9 10 11 12 7 8 9 10 11 12 7 8 9 10 11 12 7 8 9 10 11 12 7 8 9 10 11 12 0
.0 0.1
0.1
0.0
0.0
0.0 0
.1 0
.1 0.2
0.0
0.0
0.4
0.1 0
.2 0.3 0
.4 0
.4 0
.4
0.1 0
.3
0.2 0
.3
0.2
1.1
0.3 0
.4
0.8
0.8
1.4
2.1
Graphics 152

Pride Surveys Report: 2017-18 Warren County
When Do You Use Bath Salts
When Do You Use Bath Salts
Source: Pride Surveys
Before School During School After School Week Night Weekend
7 8 9 11 12 7 8 9 11 12 7 8 9 11 12 7 8 9 11 12 7 8 9 11 12
0.1
0.1
0.0
0.0 0
.2
0.0 0
.1 0
.1
0.0 0
.2
0.0 0
.1 0.3
0.2
0.0
0.0
0.0
0.0
0.0 0
.2
0.0 0
.1 0
.4
0.0
0.4
Graphics 153
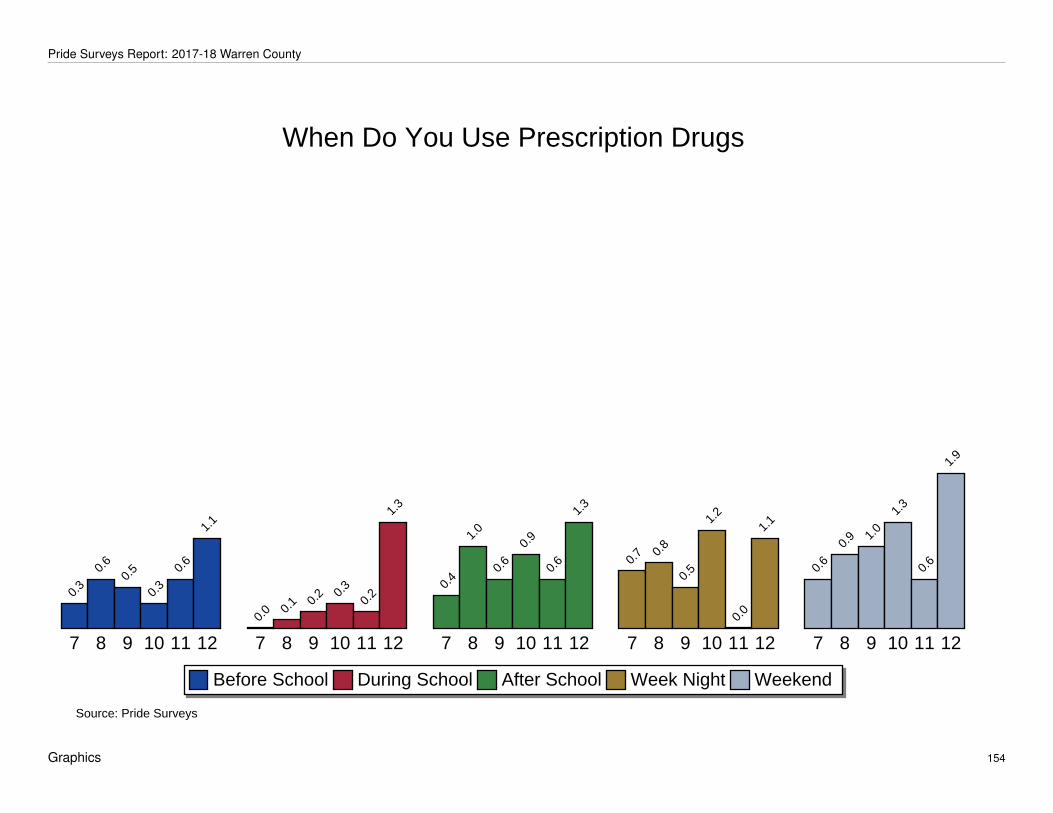
Pride Surveys Report: 2017-18 Warren County
When Do You Use Prescription Drugs
When Do You Use Prescription Drugs
Source: Pride Surveys
Before School During School After School Week Night Weekend
7 8 9 10 11 12 7 8 9 10 11 12 7 8 9 10 11 12 7 8 9 10 11 12 7 8 9 10 11 12
0.3
0.6
0.5
0.3
0.6
1.1
0.0 0
.1 0.2 0
.3
0.2
1.3
0.4
1.0
0.6
0.9
0.6
1.3
0.7 0
.8
0.5
1.2
0.0
1.1
0.6
0.9 1
.0 1
.3
0.6
1.9
Graphics 154

Pride Surveys Report: 2017-18 Warren County
When Do You Use Over-the-Counter
When Do You Use Over-the-Counter
Source: Pride Surveys
Before School During School After School Week Night Weekend
7 8 9 10 11 12 7 8 9 10 11 12 7 8 9 10 11 12 7 8 9 10 11 12 7 8 9 10 11 12
0.1
0.1 0
.3
0.0
0.0 0
.2
0.0 0
.1
0.0
0.0
0.0
0.4
0.0 0
.2 0
.5
0.1 0
.2 0
.2
0.0 0
.2 0.3
0.1
0.0
0.4
0.0
0.4 0
.6
0.3
0.6
0.9
Graphics 155

Pride Surveys Report: 2017-18 Warren County
When Do You Use Heroin
When Do You Use Heroin
Source: Pride Surveys
Before School During School After School Week Night Weekend
7 8 9 11 12 7 8 9 11 12 7 8 9 11 12 7 8 9 11 12 7 8 9 11 12 0
.0 0
.0 0.1
0.0
0.4
0.1
0.1
0.1
0.0 0
.2
0.0
0.0 0
.1 0.2
0.2
0.0
0.0
0.0
0.0 0
.2
0.0
0.0 0
.2 0
.2
0.6
Graphics 156
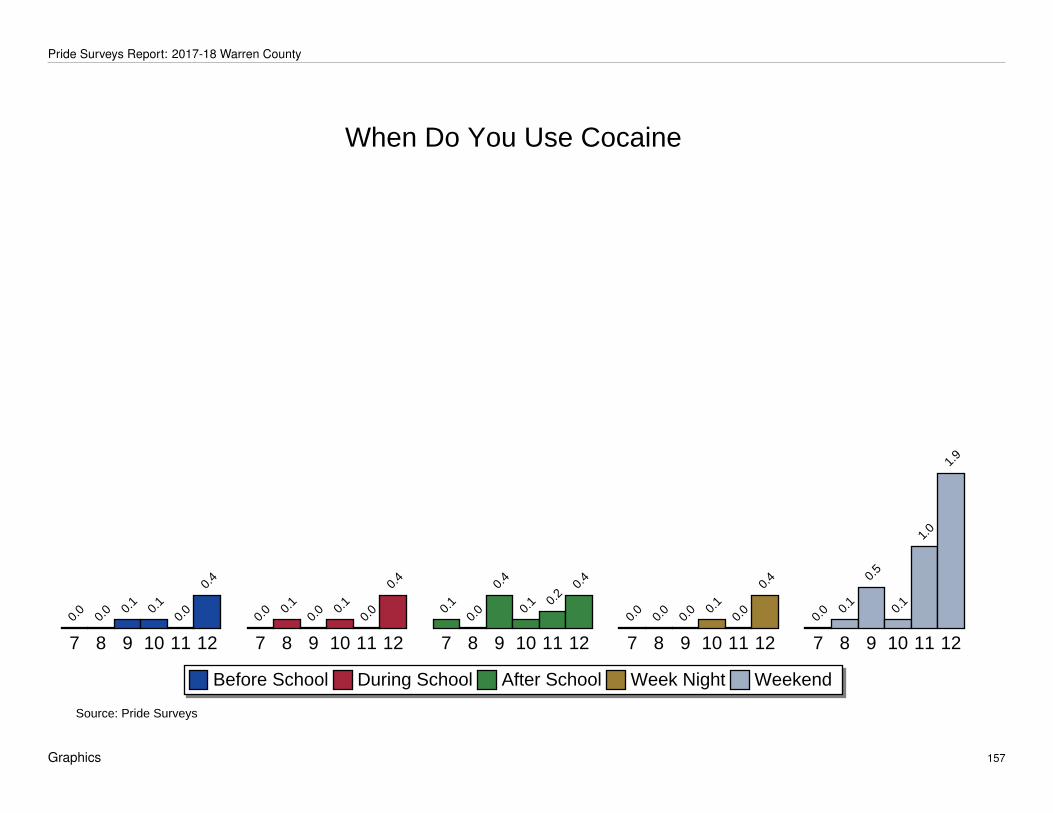
Pride Surveys Report: 2017-18 Warren County
When Do You Use Cocaine
When Do You Use Cocaine
Source: Pride Surveys
Before School During School After School Week Night Weekend
7 8 9 10 11 12 7 8 9 10 11 12 7 8 9 10 11 12 7 8 9 10 11 12 7 8 9 10 11 12 0
.0 0
.0 0.1
0.1
0.0
0.4
0.0 0
.1
0.0 0
.1
0.0
0.4
0.1
0.0
0.4
0.1 0
.2 0.4
0.0
0.0
0.0 0
.1
0.0
0.4
0.0 0
.1
0.5
0.1
1.0
1.9
Graphics 157

Pride Surveys Report: 2017-18 Warren County
When Do You Use Inhalants
When Do You Use Inhalants
Source: Pride Surveys
Before School During School After School Week Night Weekend
7 8 9 10 11 12 7 8 9 10 11 12 7 8 9 10 11 12 7 8 9 10 11 12 7 8 9 10 11 12 0
.0 0.1
0.1
0.1
0.0
0.4
0.1
0.1
0.1
0.0
0.0 0
.2
0.0
0.3
0.2
0.0
0.6
0.2
0.1
0.1 0
.3
0.0
0.0
0.0
0.0 0
.1 0
.4
0.1
0.6
0.6
Graphics 158

Pride Surveys Report: 2017-18 Warren County
When Do You Use Hallucinogens
When Do You Use Hallucinogens
Source: Pride Surveys
Before School During School After School Week Night Weekend
7 8 9 10 11 12 7 8 9 10 11 12 7 8 9 10 11 12 7 8 9 10 11 12 7 8 9 10 11 12 0
.0 0
.0 0
.0 0.1
0.0
0.4
0.0 0
.1
0.0
0.3
0.0 0
.2
0.0
0.0
0.5
0.4
0.2
0.2
0.0
0.0 0
.2 0.4
0.0
0.0 0
.1 0
.1
0.7
1.2
1.0
1.9
Graphics 159

Pride Surveys Report: 2017-18 Warren County
When Do You Use Steroids
When Do You Use Steroids
Source: Pride Surveys
Before School During School After School Week Night Weekend
7 8 9 10 11 12 7 8 9 10 11 12 7 8 9 10 11 12 7 8 9 10 11 12 7 8 9 10 11 12
0.1
0.0 0
.1 0
.4
0.0
0.4
0.0 0
.1
0.0 0
.1
0.0
0.4
0.1
0.0 0
.1 0.3 0
.4
0.0 0
.1
0.0 0
.1 0
.1
0.0 0
.2
0.0
0.0 0
.2
0.1 0
.2
0.6
Graphics 160

Pride Surveys Report: 2017-18 Warren County
When Do You Use Ecstasy
When Do You Use Ecstasy
Source: Pride Surveys
Before School During School After School Week Night Weekend
7 8 9 10 11 12 7 8 9 10 11 12 7 8 9 10 11 12 7 8 9 10 11 12 7 8 9 10 11 12 0
.0 0
.0 0
.0 0
.0 0
.0 0.2
0.0 0
.1
0.0
0.0
0.0 0
.2
0.1
0.0
0.3
0.1 0
.2 0
.2
0.0
0.0 0
.1 0
.1
0.0
0.0
0.0
0.0
0.4
0.3 0
.4
1.3
Graphics 161

Pride Surveys Report: 2017-18 Warren County
When Do You Use Meth
When Do You Use Meth
Source: Pride Surveys
Before School During School After School Week Night Weekend
7 8 9 10 11 12 7 8 9 10 11 12 7 8 9 10 11 12 7 8 9 10 11 12 7 8 9 10 11 12
0.1
0.0
0.0
0.0
0.0 0
.2
0.1
0.1
0.1
0.0
0.0
0.4
0.0
0.0 0
.1
0.0 0
.2 0.4
0.0 0
.1
0.0
0.0
0.0
0.0
0.0 0
.1 0.3
0.1 0
.2
0.9
Graphics 162

Pride Surveys Report: 2017-18 Warren County
3.10 Annual Drug Use by Gender
These charts break down the annual use that we have seen previously by male/female to examine the effect that gender has on certain categories of use.
Graphics 163

Pride Surveys Report: 2017-18 Warren County
Annual Use of Any Tobacco by Gender
Annual Use of Any Tobacco by Gender
Source: Pride Surveys
7 8 9 10 11 12
Male Female
2.2
1.3
6.6
4.5
10.
2
8.7
15.
2
10.
2
21.
9
8.7
31.
3
18.
3
Graphics 164

Pride Surveys Report: 2017-18 Warren County
Annual Use of Cigarettes by Gender
Annual Use of Cigarettes by Gender
Source: Pride Surveys
7 8 9 10 11 12
Male Female
1.4
1.3
4.8
3.7
5.7
7.9 8
.1
7.2
12.
9
6.8
12.
1
14.
5
Graphics 165

Pride Surveys Report: 2017-18 Warren County
Annual Use of Smokeless Tobacco by Gender
Annual Use of Smokeless Tobacco by Gender
Source: Pride Surveys
7 8 9 10 11 12
Male Female
0.9
0.3
2.6
1.4
6.3
2.6
10.
3
2.0
11.
0
1.6
15.
1
3.0
Graphics 166

Pride Surveys Report: 2017-18 Warren County
Annual Use of Cigars by Gender
Annual Use of Cigars by Gender
Source: Pride Surveys
7 8 9 10 11 12
Male Female
0.8
0.0
2.9
1.3
4.6
2.2
10.
6
3.3
15.
9
2.8
27.
5
8.6
Graphics 167

Pride Surveys Report: 2017-18 Warren County
Annual Use of Electronic Vapor Products by Gender
Annual Use of Electronic Vapor Products by Gender
Source: Pride Surveys
7 8 9 10 11 12
Male Female
5.4
2.1
12.
1
11.
1
19.
1
17.
0
25.
0
22.
6
33.
6
27.
8
46.
0
28.
0
Graphics 168

Pride Surveys Report: 2017-18 Warren County
Annual Use of Any Alcohol by Gender
Annual Use of Any Alcohol by Gender
Source: Pride Surveys
7 8 9 10 11 12
Male Female
9.3
6.4
14.
8 1
7.8
21.
8 2
5.4
32.
1 34.
1
40.
2 4
4.4
55.
2
48.
3
Graphics 169

Pride Surveys Report: 2017-18 Warren County
Annual Use of Beer by Gender
Annual Use of Beer by Gender
Source: Pride Surveys
7 8 9 10 11 12
Male Female
7.8
3.1
11.
8 1
1.8
17.
4 1
7.4
28.
1
22.
8
34.
6 3
4.4
50.
2
36.
3
Graphics 170

Pride Surveys Report: 2017-18 Warren County
Annual Use of Coolers, Hard Lemonade, etc. by Gender
Annual Use of Coolers, Hard Lemonade, etc. by Gender
Source: Pride Surveys
7 8 9 10 11 12
Male Female
3.9
3.0
8.1
10.
9 1
1.6
18.
9 1
9.2
26.
1 27.
8
36.
3 3
9.3
42.
5
Graphics 171
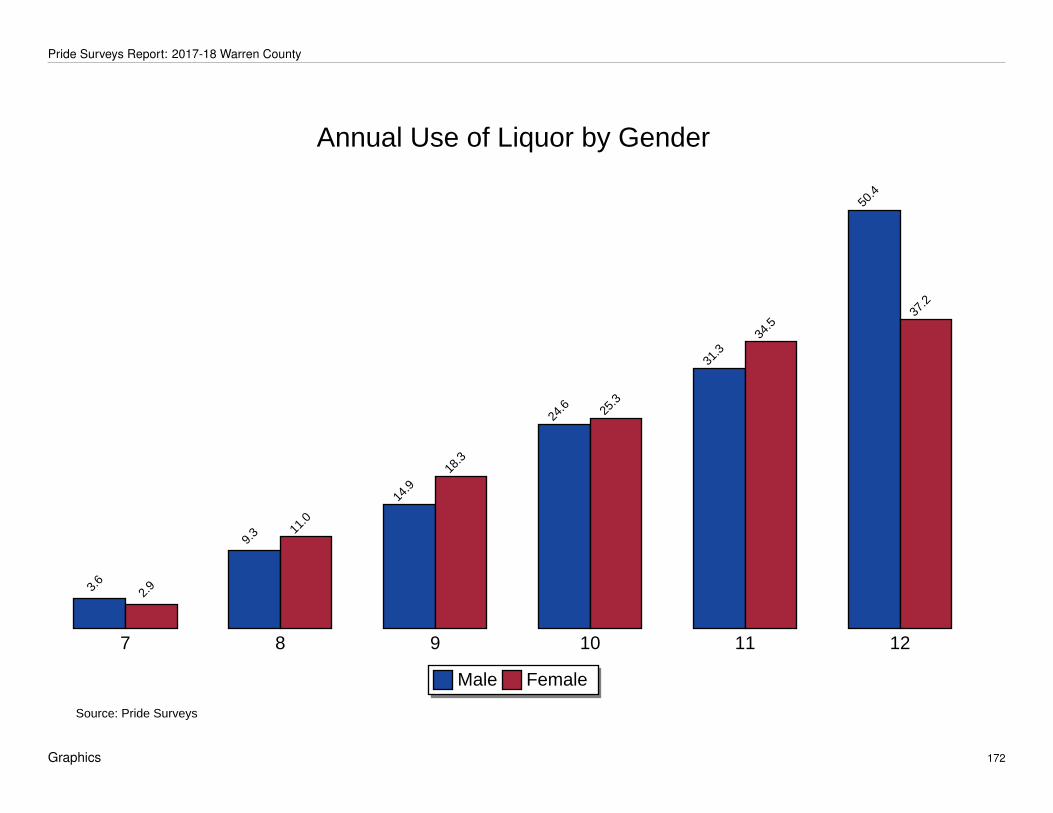
Pride Surveys Report: 2017-18 Warren County
Annual Use of Liquor by Gender
Annual Use of Liquor by Gender
Source: Pride Surveys
7 8 9 10 11 12
Male Female
3.6
2.9
9.3 1
1.0
14.
9 1
8.3
24.
6 2
5.3
31.
3 3
4.5
50.
4
37.
2
Graphics 172

Pride Surveys Report: 2017-18 Warren County
Annual Use of Any Illicit Drug by Gender
Annual Use of Any Illicit Drug by Gender
Source: Pride Surveys
7 8 9 10 11 12
Male Female
7.1 8
.1
11.
1 1
3.2 1
5.0
14.
8
23.
9
16.
3
30.
3
23.
8
37.
8
24.
5
Graphics 173

Pride Surveys Report: 2017-18 Warren County
Annual Use of Marijuana by Gender
Annual Use of Marijuana by Gender
Source: Pride Surveys
7 8 9 10 11 12
Male Female
1.4
0.9
5.4
5.5
10.
7
8.9
19.
5
11.
7
28.
8
20.
4
33.
3
22.
4
Graphics 174

Pride Surveys Report: 2017-18 Warren County
Annual Use of Synthetic Marijuana by Gender
Annual Use of Synthetic Marijuana by Gender
Source: Pride Surveys
7 8 9 10 11 12
Male Female
0.5
0.1
1.0
0.7
1.9
2.2
2.9
1.1
6.8
2.4
3.4
2.5
Graphics 175

Pride Surveys Report: 2017-18 Warren County
Annual Use of Bath Salts by Gender
Annual Use of Bath Salts by Gender
Source: Pride Surveys
7 8 9 10 11 12
Male Female
0.3
0.1
0.6
1.1
1.0
1.0
1.4
0.3
2.4
0.8
1.3
0.5
Graphics 176

Pride Surveys Report: 2017-18 Warren County
Annual Use of Pain Meds. by Gender
Annual Use of Pain Meds. by Gender
Source: Pride Surveys
7 8 9 10 11 12
Male Female
1.1
2.1
1.7
3.0
2.1
4.6
4.2
2.2
7.2
5.2
5.5
2.0
Graphics 177

Pride Surveys Report: 2017-18 Warren County
Annual Use of Stimulants by Gender
Annual Use of Stimulants by Gender
Source: Pride Surveys
7 8 9 10 11 12
Male Female
0.5
1.6
1.1
1.7
2.5
1.8
4.7
1.1
6.3
4.8
8.4
4.5
Graphics 178

Pride Surveys Report: 2017-18 Warren County
Annual Use of Sleeping Meds. by Gender
Annual Use of Sleeping Meds. by Gender
Source: Pride Surveys
7 8 9 10 11 12
Male Female
1.6
3.7
3.4
5.9
4.2
5.0
3.7
2.5
3.4
4.8
3.0
4.5
Graphics 179

Pride Surveys Report: 2017-18 Warren County
Annual Use of Sedatives by Gender
Annual Use of Sedatives by Gender
Source: Pride Surveys
7 8 9 10 11 12
Male Female
0.5
1.1
1.7
2.8
1.7
3.0 3
.1
2.8
7.2
4.4
3.4 3
.5
Graphics 180

Pride Surveys Report: 2017-18 Warren County
Annual Use of Over-the-Counter by Gender
Annual Use of Over-the-Counter by Gender
Source: Pride Surveys
7 8 9 10 11 12
Male Female
0.2
0.0
1.3 1
.4
1.0
1.8 2
.0
0.8
1.9
1.6
1.3
1.0
Graphics 181
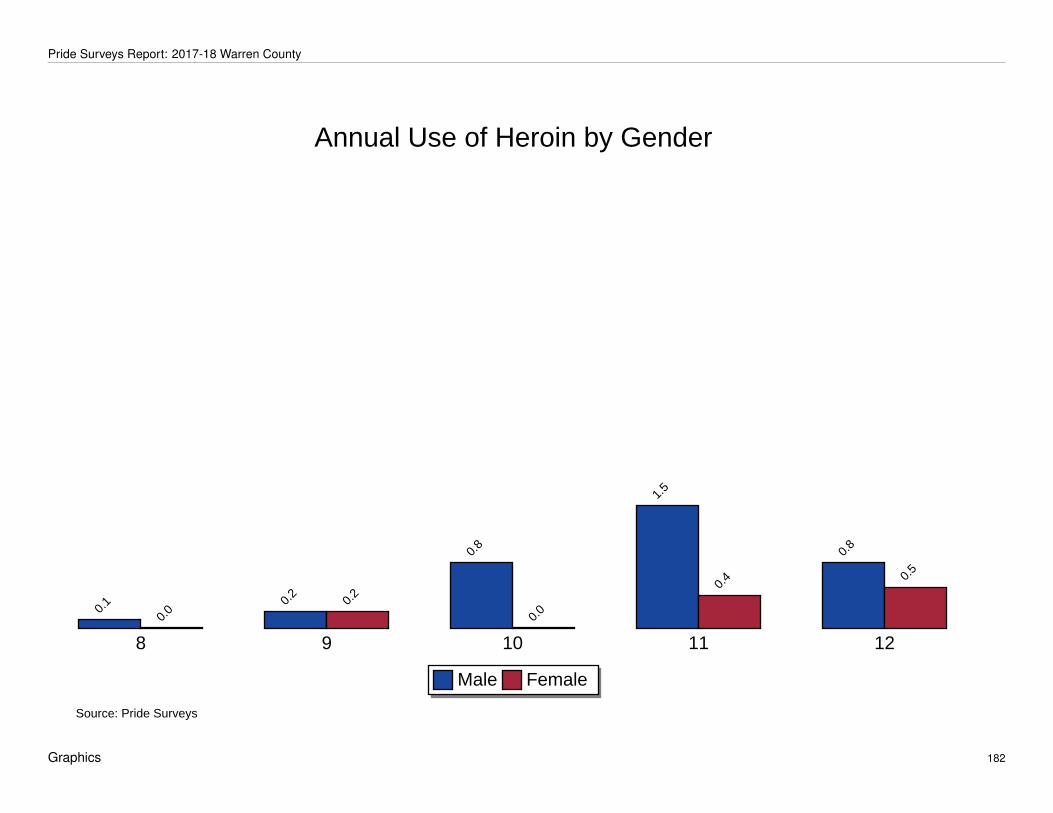
Pride Surveys Report: 2017-18 Warren County
Annual Use of Heroin by Gender
Annual Use of Heroin by Gender
Source: Pride Surveys
8 9 10 11 12
Male Female
0.1
0.0 0
.2 0
.2
0.8
0.0
1.5
0.4
0.8
0.5
Graphics 182

Pride Surveys Report: 2017-18 Warren County
Annual Use of Cocaine by Gender
Annual Use of Cocaine by Gender
Source: Pride Surveys
8 9 10 11 12
Male Female
0.6
0.6
0.6
0.6
2.3
0.0
2.4
1.2
2.6
1.5
Graphics 183

Pride Surveys Report: 2017-18 Warren County
Annual Use of Inhalants by Gender
Annual Use of Inhalants by Gender
Source: Pride Surveys
7 8 9 10 11 12
Male Female
0.5 0
.6
1.3 1
.4
0.8
1.6
2.0
0.8
2.4
0.8
0.8
1.5
Graphics 184
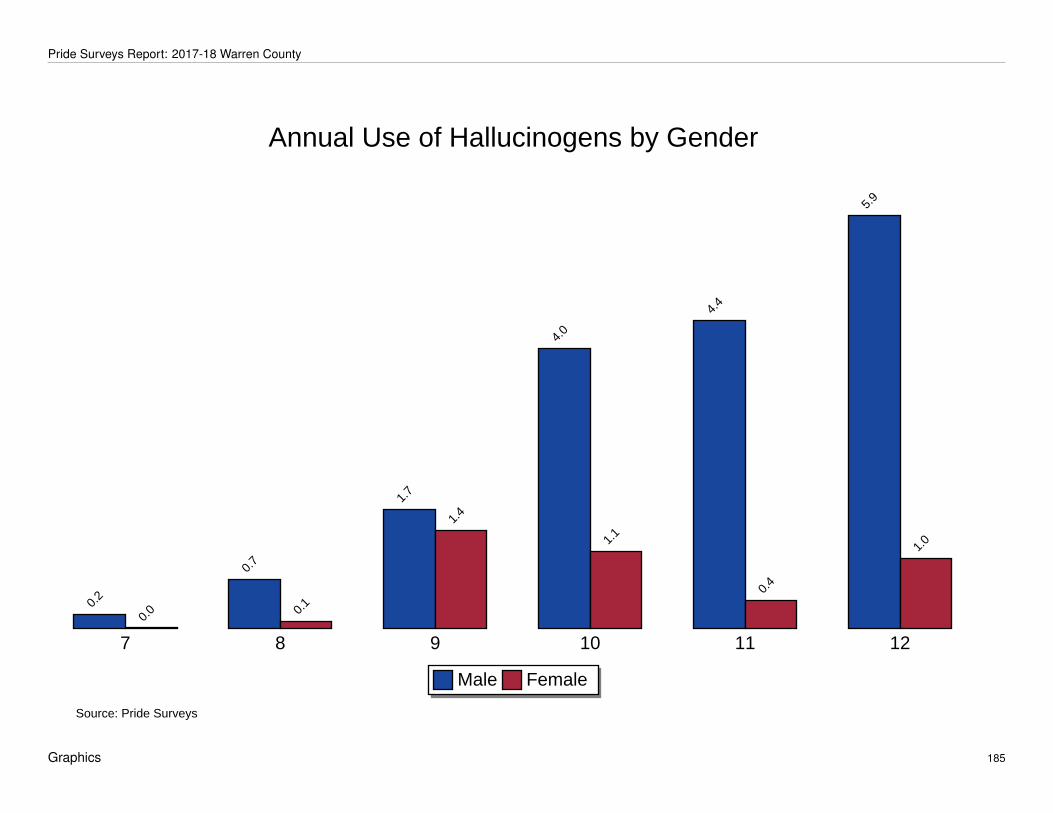
Pride Surveys Report: 2017-18 Warren County
Annual Use of Hallucinogens by Gender
Annual Use of Hallucinogens by Gender
Source: Pride Surveys
7 8 9 10 11 12
Male Female
0.2
0.0
0.7
0.1
1.7
1.4
4.0
1.1
4.4
0.4
5.9
1.0
Graphics 185

Pride Surveys Report: 2017-18 Warren County
Annual Use of Steroids by Gender
Annual Use of Steroids by Gender
Source: Pride Surveys
7 8 9 10 11 12
Male Female
1.9
1.4
1.3
0.1
1.0
0.2
3.1
1.7 1
.9 2.0
1.7
1.0
Graphics 186

Pride Surveys Report: 2017-18 Warren County
Annual Use of Ecstasy by Gender
Annual Use of Ecstasy by Gender
Source: Pride Surveys
7 8 9 10 11 12
Male Female
0.3
0.0
0.4
0.0
0.4
0.4
2.8
0.0
1.5
0.4
1.7
1.0
Graphics 187

Pride Surveys Report: 2017-18 Warren County
Annual Use of Meth by Gender
Annual Use of Meth by Gender
Source: Pride Surveys
7 8 9 10 11 12
Male Female
0.2
0.0
0.3
0.3 0
.4
0.0
0.6
0.0
1.5
0.4
0.9
0.5
Graphics 188

Pride Surveys Report: 2017-18 Warren County
3.11 Risk and Protective Factors – Cross Tabulations
This section looks at the following questions:
• Attend Church or Synagogue
• Take Part in Community Activities
• Make Good Grades
• Take Part in Sports Teams
• Take Part in School Activities
• Get Into Trouble at School
• Teachers Talk About Dangers of Drugs
• Parents Talk About Dangers of Drugs
• Parents Set Clear Rules
• Parents Punish for Breaking Rules
How students responded to each question is presented in table form. Stu-dents are then grouped based on how they responded to each question. Thepercent of illicit drug use for each subgroup is calculated and presented ingraphic form. For example, if the bar for Never is at 40%, this means 40% ofthe students who marked Never reported using an illicit drug.
Graphics 189

Pride Surveys Report: 2017-18 Warren County
3.11.1 Attend Church or Synagogue
Students could respond to this question by marking Never, Seldom, Some-times, Often or A Lot. The following table shows what percent of all studentsresponded Never, what percent responded Sometimes, etc.
Table 3.1: Attend Church or SynagogueRESPONSE PCTNever 24.8Seldom 14.0Sometimes 20.5Often 15.5A Lot 25.3
Students are grouped based on how they responded to the question andthe percent of illicit drug use in the past year is calculated for each group. Forexample, if the bar for Never is at 40% this means 40% of the students whomarked Never reported using an illicit drug.
Attend Church or Synagogue
Attend Church or Synagogue
Source: Pride Surveys
Never Seldom Sometimes Often A Lot
Percent of Annual Use of Any Illicit Drug
22.
0
17.
5
15.
0
12.
1
10.
5
Graphics 190

Pride Surveys Report: 2017-18 Warren County
3.11.2 Take Part in Community Activities
Students could respond to this question by marking Never, Seldom, Some-times, Often or A Lot. The following table shows what percent of all studentsresponded Never, what percent responded Sometimes, etc.
Table 3.2: Take Part in Community ActivitiesRESPONSE PCTNever 37.2Seldom 16.7Sometimes 17.9Often 13.8A Lot 14.5
Students are grouped based on how they responded to the question andthe percent of illicit drug use in the past year is calculated for each group. Forexample, if the bar for Never is at 40% this means 40% of the students whomarked Never reported using an illicit drug.
Take Part in Community Activities
Take Part in Community Activities
Source: Pride Surveys
Never Seldom Sometimes Often A Lot
Percent of Annual Use of Any Illicit Drug
18.
7
14.
9
13.
7 1
3.5
11.
2
Graphics 191

Pride Surveys Report: 2017-18 Warren County
3.11.3 Make Good Grades
Students could respond to this question by marking Never, Seldom, Some-times, Often or A Lot. The following table shows what percent of all studentsresponded Never, what percent responded Sometimes, etc.
Table 3.3: Make Good GradesRESPONSE PCTNever 0.5Seldom 1.6Sometimes 15.0Often 37.4A Lot 45.6
Students are grouped based on how they responded to the question andthe percent of illicit drug use in the past year is calculated for each group. Forexample, if the bar for Never is at 40% this means 40% of the students whomarked Never reported using an illicit drug.
Make Good Grades
Make Good Grades
Source: Pride Surveys
Never Seldom Sometimes Often A Lot
Percent of Annual Use of Any Illicit Drug
56.
5
48.
8
27.
4
16.
1
9.4
Graphics 192

Pride Surveys Report: 2017-18 Warren County
3.11.4 Take Part in Sports Teams
Students could respond to this question by marking Never, Seldom, Some-times, Often or A Lot. The following table shows what percent of all studentsresponded Never, what percent responded Sometimes, etc.
Table 3.4: Take Part in Sports TeamsRESPONSE PCTNever 27.1Seldom 9.6Sometimes 13.3Often 17.8A Lot 32.3
Students are grouped based on how they responded to the question andthe percent of illicit drug use in the past year is calculated for each group. Forexample, if the bar for Never is at 40% this means 40% of the students whomarked Never reported using an illicit drug.
Take Part in Sports Teams
Take Part in Sports Teams
Source: Pride Surveys
Never Seldom Sometimes Often A Lot
Percent of Annual Use of Any Illicit Drug
16.
8
20.
9
15.
0 15.
9
12.
6
Graphics 193

Pride Surveys Report: 2017-18 Warren County
3.11.5 Take Part in School Activities
Students could respond to this question by marking Never, Seldom, Some-times, Often or A Lot. The following table shows what percent of all studentsresponded Never, what percent responded Sometimes, etc.
Table 3.5: Take Part in School ActivitiesRESPONSE PCTNever 31.3Seldom 15.5Sometimes 18.8Often 15.4A Lot 18.9
Students are grouped based on how they responded to the question andthe percent of illicit drug use in the past year is calculated for each group. Forexample, if the bar for Never is at 40% this means 40% of the students whomarked Never reported using an illicit drug.
Take Part in School Activities
Take Part in School Activities
Source: Pride Surveys
Never Seldom Sometimes Often A Lot
Percent of Annual Use of Any Illicit Drug
18.
5
18.
0
12.
7 1
2.7
13.
2
Graphics 194

Pride Surveys Report: 2017-18 Warren County
3.11.6 Get Into Trouble at School
Students could respond to this question by marking Never, Seldom, Some-times, Often or A Lot. The following table shows what percent of all studentsresponded Never, what percent responded Sometimes, etc.
Table 3.6: Get Into Trouble at SchoolRESPONSE PCTNever 54.0Seldom 32.1Sometimes 10.9Often 1.9A Lot 1.1
Students are grouped based on how they responded to the question andthe percent of illicit drug use in the past year is calculated for each group. Forexample, if the bar for Never is at 40% this means 40% of the students whomarked Never reported using an illicit drug.
Get Into Trouble at School
Get Into Trouble at School
Source: Pride Surveys
Never Seldom Sometimes Often A Lot
Percent of Annual Use of Any Illicit Drug
10.
3
18.
5
27.
1 3
0.7
34.
5
Graphics 195
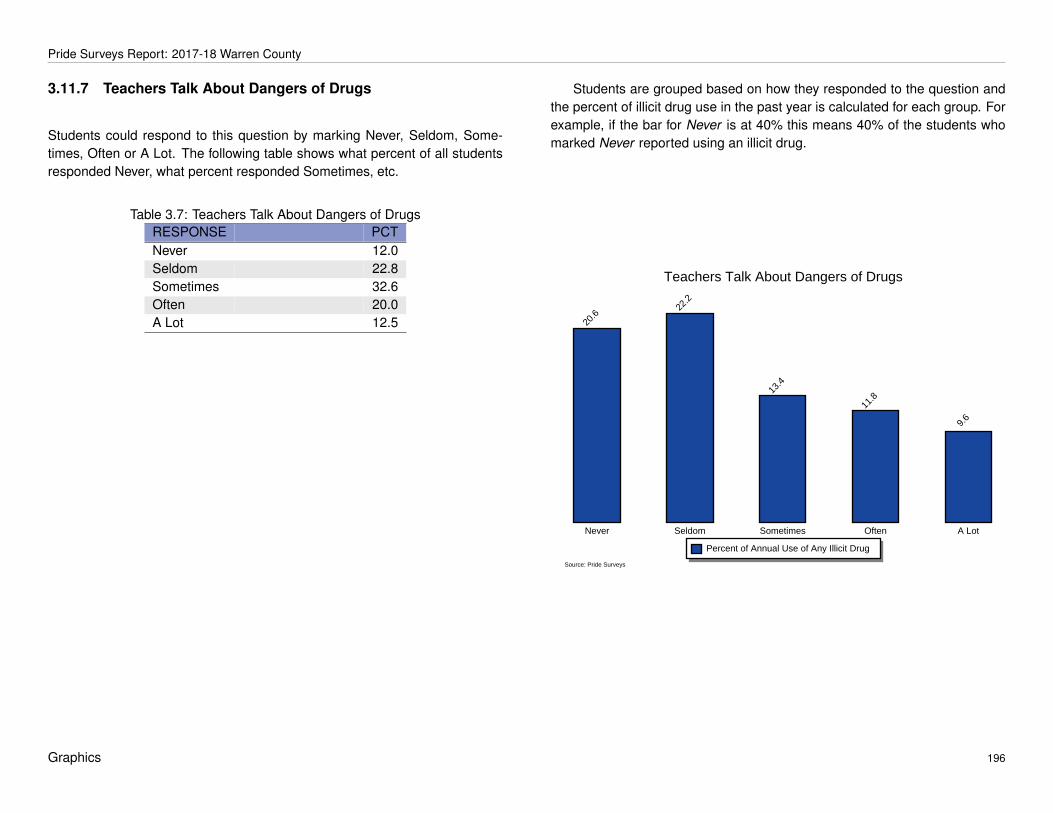
Pride Surveys Report: 2017-18 Warren County
3.11.7 Teachers Talk About Dangers of Drugs
Students could respond to this question by marking Never, Seldom, Some-times, Often or A Lot. The following table shows what percent of all studentsresponded Never, what percent responded Sometimes, etc.
Table 3.7: Teachers Talk About Dangers of DrugsRESPONSE PCTNever 12.0Seldom 22.8Sometimes 32.6Often 20.0A Lot 12.5
Students are grouped based on how they responded to the question andthe percent of illicit drug use in the past year is calculated for each group. Forexample, if the bar for Never is at 40% this means 40% of the students whomarked Never reported using an illicit drug.
Teachers Talk About Dangers of Drugs
Teachers Talk About Dangers of Drugs
Source: Pride Surveys
Never Seldom Sometimes Often A Lot
Percent of Annual Use of Any Illicit Drug
20.
6 22.
2
13.
4
11.
8
9.6
Graphics 196

Pride Surveys Report: 2017-18 Warren County
3.11.8 Parents Talk About Dangers of Drugs
Students could respond to this question by marking Never, Seldom, Some-times, Often or A Lot. The following table shows what percent of all studentsresponded Never, what percent responded Sometimes, etc.
Table 3.8: Parents Talk About Dangers of DrugsRESPONSE PCTNever 8.3Seldom 15.1Sometimes 32.4Often 23.7A Lot 20.5
Students are grouped based on how they responded to the question andthe percent of illicit drug use in the past year is calculated for each group. Forexample, if the bar for Never is at 40% this means 40% of the students whomarked Never reported using an illicit drug.
Parents Talk About Dangers of Drugs
Parents Talk About Dangers of Drugs
Source: Pride Surveys
Never Seldom Sometimes Often A Lot
Percent of Annual Use of Any Illicit Drug
22.
0 23.
2
15.
8
12.
1
10.
5
Graphics 197

Pride Surveys Report: 2017-18 Warren County
3.11.9 Parents Set Clear Rules
Students could respond to this question by marking Never, Seldom, Some-times, Often or A Lot. The following table shows what percent of all studentsresponded Never, what percent responded Sometimes, etc.
Table 3.9: Parents Set Clear RulesRESPONSE PCTNever 5.4Seldom 5.1Sometimes 10.8Often 22.1A Lot 56.6
Students are grouped based on how they responded to the question andthe percent of illicit drug use in the past year is calculated for each group. Forexample, if the bar for Never is at 40% this means 40% of the students whomarked Never reported using an illicit drug.
Parents Set Clear Rules
Parents Set Clear Rules
Source: Pride Surveys
Never Seldom Sometimes Often A Lot
Percent of Annual Use of Any Illicit Drug
23.
4
31.
7
29.
0
19.
3
9.2
Graphics 198

Pride Surveys Report: 2017-18 Warren County
3.11.10 Parents Punish for Breaking Rules
Students could respond to this question by marking Never, Seldom, Some-times, Often or A Lot. The following table shows what percent of all studentsresponded Never, what percent responded Sometimes, etc.
Table 3.10: Parents Punish for Breaking RulesRESPONSE PCTNever 16.5Seldom 4.3Sometimes 7.3Often 14.9A Lot 57.0
Students are grouped based on how they responded to the question andthe percent of illicit drug use in the past year is calculated for each group. Forexample, if the bar for Never is at 40% this means 40% of the students whomarked Never reported using an illicit drug.
Parents Punish for Breaking Rules
Parents Punish for Breaking Rules
Source: Pride Surveys
Never Seldom Sometimes Often A Lot
Percent of Annual Use of Any Illicit Drug
13.
8
40.
4
36.
9
21.
6
10.
2
Graphics 199

Pride Surveys Report: 2017-18 Warren County
3.12 Safety and Health – Cross Tabulations
The following graphs and tables summarize some of the Student Informationquestions regarding drug use. These data are calculated by examining spe-cific subsets of your population. For example, a percentage is calculated forstudents who report carrying a gun and their liquor use. This percentage iscalculated as follows:
Number of those reporting carrying agun to school and claiming to use liquor
Number of those reporting carrying a gun and validlyresponding to the question How Often Do You Use Liquor
The Ratio describes the relationship between the groups examined oneach graph. For example, in looking at Guns vs. No Guns if the cocaine ratiowere 5.3, this would mean the percentage of students who report cocaineuse was 5.3 times higher for students who report bringing a gun to schoolcompared to those who don’t.
Graphics 200

Pride Surveys Report: 2017-18 Warren County
3.13 Carrying a Gun to School
Total number of students surveyed = 5734
Total number who responded to this question = 5124
85 students reported carrying a gun to school. (1.7% of total responding)
Of the 85 students who reported carrying a gun to school,
31 report using liquor (39.2%),
18 report using marijuana (23.1%),
2 report using cocaine (2.5%),
1 report using Meth (1.3%).
NOTE: Results based on students who reported oneor more instances of carrying a gun to school
Drug Gun No Gun RatioLiquor 39.2% 15.2% 2.6Marijuana 23.1% 9.1% 2.5Cocaine 2.5% 0.6% 4.2Meth 1.3% 0.3% 4.3N of Students 85 5039
Drug Use of Students Who Reported Carrying a Gun to School
Drug Use of Students Who Reported Carrying a Gun to Schoolvs. Students Who Did Not
Source: Pride Surveys
Liquor Marijuana Cocaine Meth
Gun No Gun
39.
2
15.
2
23.
1
9.1
2.5
0.6 1
.3
0.3
Graphics 201

Pride Surveys Report: 2017-18 Warren County
3.14 Involvement in Gangs
Total number of students surveyed = 5734
Total number who responded to this question = 5547
259 students reported involvement in gangs. (4.7% of total responding)
Of the 259 students who reported involvement in gangs,
94 report using liquor (39.5%),
88 report using marijuana (36.4%),
24 report using cocaine (10.0%),
12 report using Meth (5.0%).
NOTE: Results based on students who reported any involvement with gangs
Drug Gang No Gang RatioLiquor 39.5% 15.1% 2.6Marijuana 36.4% 8.7% 4.2Cocaine 10.0% 0.3% 33.3Meth 5.0% 0.1% 50.0N of Students 259 5288
Drug Use of Students Who Reported Involvement in Gangs
Drug Use of Students Who Reported Involvement in Gangsvs. Students Who Did Not
Source: Pride Surveys
Liquor Marijuana Cocaine Meth
Gang No Gang
39.
5
15.
1
36.
4
8.7 1
0.0
0.3
5.0
0.1
Graphics 202
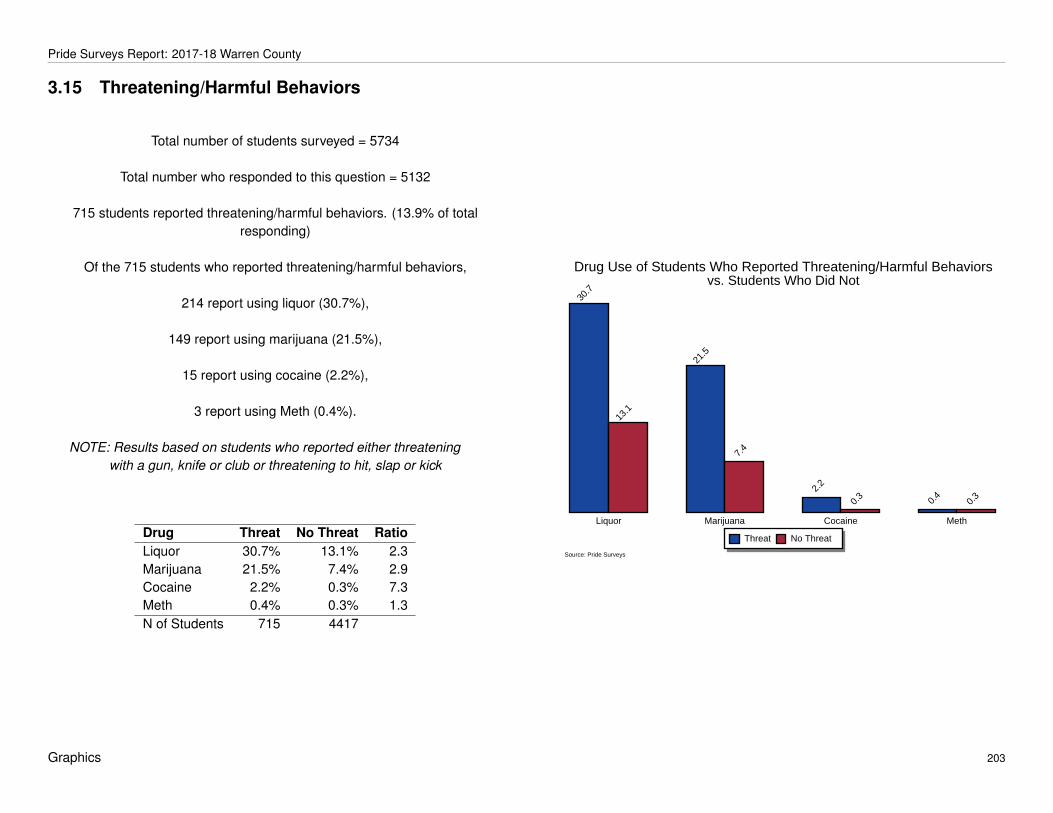
Pride Surveys Report: 2017-18 Warren County
3.15 Threatening/Harmful Behaviors
Total number of students surveyed = 5734
Total number who responded to this question = 5132
715 students reported threatening/harmful behaviors. (13.9% of totalresponding)
Of the 715 students who reported threatening/harmful behaviors,
214 report using liquor (30.7%),
149 report using marijuana (21.5%),
15 report using cocaine (2.2%),
3 report using Meth (0.4%).
NOTE: Results based on students who reported either threateningwith a gun, knife or club or threatening to hit, slap or kick
Drug Threat No Threat RatioLiquor 30.7% 13.1% 2.3Marijuana 21.5% 7.4% 2.9Cocaine 2.2% 0.3% 7.3Meth 0.4% 0.3% 1.3N of Students 715 4417
Drug Use of Students Who Reported Threatening/Harmful Behaviors
Drug Use of Students Who Reported Threatening/Harmful Behaviorsvs. Students Who Did Not
Source: Pride Surveys
Liquor Marijuana Cocaine Meth
Threat No Threat
30.
7
13.
1
21.
5
7.4
2.2
0.3
0.4
0.3
Graphics 203
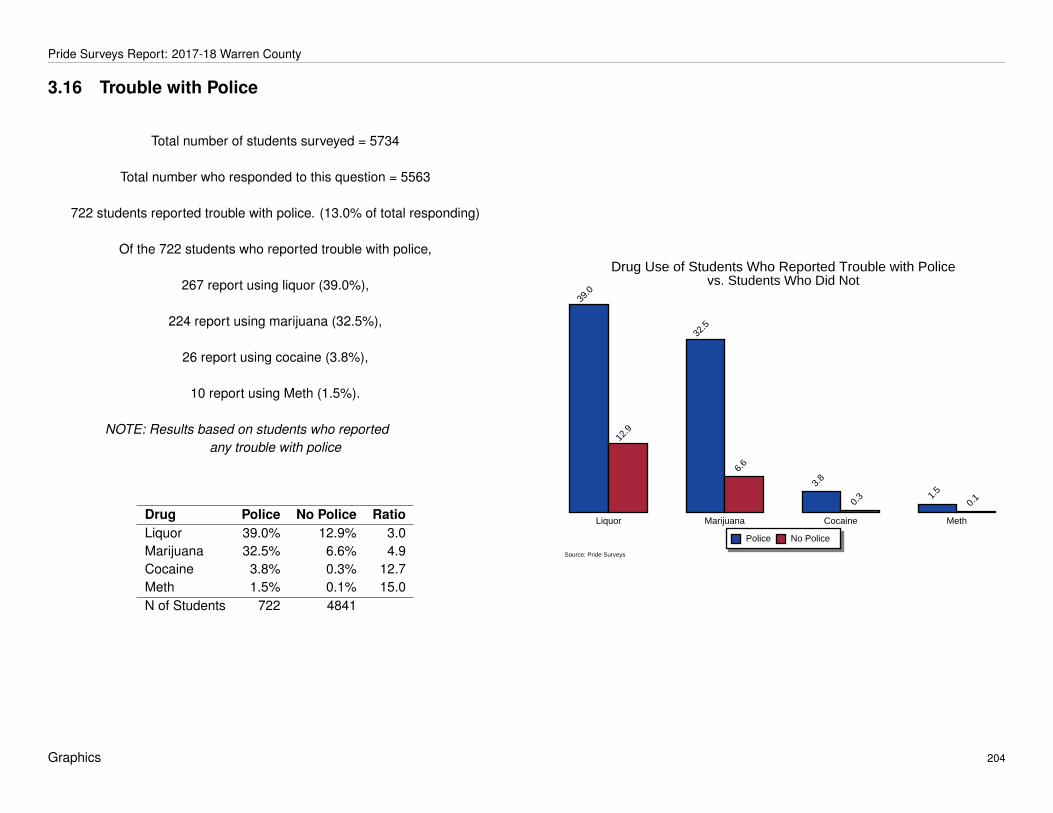
Pride Surveys Report: 2017-18 Warren County
3.16 Trouble with Police
Total number of students surveyed = 5734
Total number who responded to this question = 5563
722 students reported trouble with police. (13.0% of total responding)
Of the 722 students who reported trouble with police,
267 report using liquor (39.0%),
224 report using marijuana (32.5%),
26 report using cocaine (3.8%),
10 report using Meth (1.5%).
NOTE: Results based on students who reportedany trouble with police
Drug Police No Police RatioLiquor 39.0% 12.9% 3.0Marijuana 32.5% 6.6% 4.9Cocaine 3.8% 0.3% 12.7Meth 1.5% 0.1% 15.0N of Students 722 4841
Drug Use of Students Who Reported Trouble with Police
Drug Use of Students Who Reported Trouble with Policevs. Students Who Did Not
Source: Pride Surveys
Liquor Marijuana Cocaine Meth
Police No Police
39.
0
12.
9
32.
5
6.6
3.8
0.3 1
.5
0.1
Graphics 204

Pride Surveys Report: 2017-18 Warren County
3.17 Personal Safety
Total number of students surveyed = 5734
886 students report being afraid another student will hurt them at school.(17.4% of total responding)
Of these 886 students, 19 report carrying a gun to school (2.2%).
789 students report getting hurt at school. (15.4% of total responding)
Of these 789 students, 33 report carrying a gun to school (4.2%).
Graphics 205

Pride Surveys Report: 2017-18 Warren County
3.18 Gambling
Graphics 206

Pride Surveys Report: 2017-18 Warren County
Where Do You Usually Gamble
Where Do You Usually Gamble
Source: Pride Surveys
Internet Casino Harness racing Festival, concert, etc. My home Another's home
7 8 9 101112 7 8 9 101112 7 8 9 101112 7 8 9 101112 7 8 9 101112 7 8 9 101112
1.6
3.0 3
.8 4.4
4.3 4
.7
0.3
0.3 1
.0 0
.8 0
.6 0
.4 1.1
1.0 1
.2 1
.0 1.2
0.6
14.
0
24.
9
20.
1
19.
1 20.
2
17.
2
4.8
8.7
8.5
7.3
6.5
6.0
1.4
3.8
2.9
4.0
2.9
4.5
Graphics 207

Pride Surveys Report: 2017-18 Warren County
Where Do You Usually Gamble (continued)
Where Do You Usually Gamble (continued)
Source: Pride Surveys
Store Park, parking lot, etc. Sporting event School Other place Haven't gambled
7 8 9 101112 7 8 9 101112 7 8 9 101112 7 8 9 101112 7 8 9 101112 7 8 9 101112
2.7
5.9
4.3 6
.5
4.1 5
.5 5
.3 1
0.1
10.
2
8.6 9
.2 11.
1
0.9 1
.6 1
.5 1
.3 1.8
2.1
1.3
1.7 2
.8 2
.3 3.1
1.9 4
.2 5.9
5.6
4.8
4.1 6
.4
67.
3
60.
7 62.
1
57.
4 6
1.6
58.
3
Graphics 208
Chapter 4
Percentage Tables
This chapter contains your school survey results in tabular form. Eachtable corresponds to an item on the questionnaire. The tables contain per-centage data by grade level, grades 7 through 8 combined, grades 9 through12 combined, and all grades combined. The N of Valid column contains thenumber of students who responded to the question and the N of Missing col-umn contains the number of students who did not respond to the question.The remaining columns contain the percentages of students responding tothe particular response categories.
The percentage tables of the report appear in the same order as corre-sponding questions on the questionnaire. The Table of Contents contains thepercentage tables by section and gives the page number where each sectionis located. The List of Tables contains the location of each individual table.
209

Pride Surveys Report: 2017-18 Warren County
4.1 Personal & Family Information
Table 4.1: Ethnic Origin
RESPONSE 7th 8th 9th 10th 11th 12th 7-8th 9-12th TOTALWhite 87.0 86.8 87.1 88.2 91.3 89.2 86.9 88.5 87.7 -African American 3.1 3.1 2.4 3.3 2.1 2.4 3.1 2.6 2.8 -Native American 1.0 0.7 0.6 0.4 0.2 0.9 0.8 0.5 0.7 -Asian 2.6 2.7 2.4 1.4 1.4 1.5 2.6 1.8 2.2 -Native Hawaiian/Pacific Islndr 0.3 0.2 0.4 0.7 0.4 0.4 0.2 0.5 0.4 -Other 5.4 5.6 4.8 3.2 2.9 4.7 5.5 4.0 4.8 -Multi-Racial 0.6 1.0 2.3 2.9 1.6 0.9 0.8 2.1 1.4 -N of Valid 1405 1473 1086 760 485 465 2878 2796 5674N of Miss 14 17 9 10 5 5 31 29 60
Table 4.2: Are you Hispanic or Latino/Latina
RESPONSE 7th 8th 9th 10th 11th 12th 7-8th 9-12th TOTALYes 5.6 7.3 7.8 5.7 6.5 7.0 6.4 6.9 6.6 -No 94.4 92.7 92.2 94.3 93.5 93.0 93.6 93.1 93.4 -N of Valid 1351 1419 1018 720 462 455 2770 2655 5425N of Miss 68 71 77 50 28 15 139 170 309
Table 4.3: Sex
RESPONSE 7th 8th 9th 10th 11th 12th 7-8th 9-12th TOTALMale 48.6 51.1 51.9 50.9 46.7 54.4 49.9 51.1 50.5 -Female 51.4 48.9 48.1 49.1 53.3 45.6 50.1 48.9 49.5 -N of Valid 1402 1467 1080 757 482 461 2869 2780 5649N of Miss 17 23 15 13 8 9 40 45 85
Percentage Tables 210

Pride Surveys Report: 2017-18 Warren County
Table 4.4: Do you live with...
RESPONSE 7th 8th 9th 10th 11th 12th 7-8th 9-12th TOTALBoth Parents 63.9 60.6 64.6 66.1 60.7 63.8 62.2 64.2 63.2 -Mother Only 7.6 8.1 8.1 7.8 11.1 11.4 7.9 9.1 8.5 -Father Only 1.4 1.6 1.9 2.9 3.1 2.8 1.5 2.5 2.0 -Mother & Stepfather 7.1 7.8 9.4 7.8 12.1 8.8 7.5 9.3 8.4 -Father & Stepmother 2.3 2.8 1.7 3.0 2.5 3.9 2.6 2.6 2.6 -Extended Family 2.4 2.8 2.0 1.6 1.6 1.5 2.6 1.7 2.2 -Other 15.3 16.3 12.2 10.9 9.0 7.8 15.8 10.6 13.2 -N of Valid 1403 1481 1091 760 488 464 2884 2803 5687N of Miss 16 9 4 10 2 6 25 22 47
Table 4.5: Do you have a job?
RESPONSE 7th 8th 9th 10th 11th 12th 7-8th 9-12th TOTALYes, Full-time 0.7 0.2 0.6 0.4 1.9 2.6 0.5 1.1 0.8 -Yes, Part-time 6.4 8.4 12.3 27.3 49.4 63.8 7.4 31.4 19.2 -No 92.9 91.4 87.1 72.3 48.8 33.6 92.1 67.5 80.0 -N of Valid 1403 1471 1081 761 484 464 2874 2790 5664N of Miss 16 19 14 9 6 6 35 35 70
Table 4.6: Does your father have a job?
RESPONSE 7th 8th 9th 10th 11th 12th 7-8th 9-12th TOTALYes, Full-time 84.8 86.3 91.0 90.4 91.7 89.8 85.5 90.8 88.1 -Yes, Part-time 9.4 7.0 4.2 3.8 3.6 3.3 8.2 3.8 6.0 -No 5.8 6.7 4.8 5.8 4.7 6.9 6.3 5.4 5.8 -N of Valid 1347 1413 1046 739 468 450 2760 2703 5463N of Miss 72 77 49 31 22 20 149 122 271
Percentage Tables 211

Pride Surveys Report: 2017-18 Warren County
Table 4.7: Does your mother have a job?
RESPONSE 7th 8th 9th 10th 11th 12th 7-8th 9-12th TOTALYes, Full-time 64.4 65.3 69.7 66.4 72.3 72.9 64.9 69.8 67.3 -Yes, Part-time 21.9 19.1 18.5 16.4 15.4 14.7 20.5 16.7 18.6 -No 13.7 15.6 11.8 17.2 12.3 12.5 14.7 13.5 14.1 -N of Valid 1377 1446 1048 745 481 457 2823 2731 5554N of Miss 42 44 47 25 9 13 86 94 180
Table 4.8: What is the educational level of your father?
RESPONSE 7th 8th 9th 10th 11th 12th 7-8th 9-12th TOTALSome High School 5.7 6.0 6.6 6.3 3.3 6.2 5.8 5.9 5.9 -High School Graduate 19.5 21.4 21.1 22.5 26.8 23.1 20.4 22.8 21.6 -Some College 13.1 14.4 14.6 14.6 17.0 20.2 13.7 16.0 14.8 -College Graduate 61.8 58.3 57.6 56.6 52.9 50.4 60.0 55.3 57.7 -N of Valid 1309 1371 1008 726 459 450 2680 2643 5323N of Miss 110 119 87 44 31 20 229 182 411
Table 4.9: What is the educational level of your mother?
RESPONSE 7th 8th 9th 10th 11th 12th 7-8th 9-12th TOTALSome High School 3.5 4.4 4.2 4.6 1.7 4.2 4.0 3.9 3.9 -High School Graduate 13.5 15.9 15.9 15.0 19.1 13.3 14.7 15.8 15.2 -Some College 14.7 15.6 15.5 18.7 20.8 21.5 15.2 18.3 16.7 -College Graduate 68.2 64.2 64.5 61.7 58.4 61.1 66.1 62.1 64.1 -N of Valid 1336 1412 1027 738 466 452 2748 2683 5431N of Miss 83 78 68 32 24 18 161 142 303
Percentage Tables 212

Pride Surveys Report: 2017-18 Warren County
4.2 Student Information
Table 4.10: Do you make good grades?
RESPONSE 7th 8th 9th 10th 11th 12th 7-8th 9-12th TOTALNever 0.1 0.1 0.6 1.2 0.4 1.3 0.1 0.8 0.5 -Seldom 0.9 1.3 1.2 2.8 2.3 2.4 1.1 2.0 1.6 -Sometimes 13.1 15.3 15.8 17.4 15.0 13.5 14.3 15.7 15.0 -Often 37.3 38.3 36.5 39.4 32.7 38.6 37.8 37.0 37.4 -A Lot 48.6 45.0 46.0 39.1 49.6 44.2 46.7 44.5 45.6 -N of Valid 1386 1463 1079 751 486 459 2849 2775 5624N of Miss 33 27 16 19 4 11 60 50 110
Table 4.11: Do you get into trouble at school?
RESPONSE 7th 8th 9th 10th 11th 12th 7-8th 9-12th TOTALNever 51.5 45.8 53.4 57.4 67.6 69.6 48.5 59.6 54.0 -Seldom 33.4 35.2 34.5 30.6 25.1 23.0 34.3 29.9 32.1 -Sometimes 12.4 15.9 9.2 8.1 5.3 5.0 14.2 7.5 10.9 -Often 2.0 2.1 1.7 2.2 1.5 1.3 2.1 1.7 1.9 -A Lot 0.7 1.1 1.3 1.8 0.6 1.1 0.9 1.3 1.1 -N of Valid 1368 1442 1068 742 475 460 2810 2745 5555N of Miss 51 48 27 28 15 10 99 80 179
Table 4.12: Do you take part in school sports teams?
RESPONSE 7th 8th 9th 10th 11th 12th 7-8th 9-12th TOTALNever 29.2 28.3 21.9 23.8 31.4 29.3 28.8 25.3 27.1 -Seldom 8.9 10.1 9.4 9.3 7.8 12.3 9.5 9.6 9.6 -Sometimes 14.9 13.5 12.4 12.2 12.0 12.7 14.2 12.3 13.3 -Often 15.3 17.7 19.1 20.7 18.1 17.3 16.5 19.1 17.8 -A Lot 31.6 30.4 37.1 34.0 30.7 28.4 31.0 33.7 32.3 -N of Valid 1354 1433 1050 739 475 457 2787 2721 5508N of Miss 65 57 45 31 15 13 122 104 226
Percentage Tables 213

Pride Surveys Report: 2017-18 Warren County
Table 4.13: Do you take part in school activities such as band, clubs, etc.?
RESPONSE 7th 8th 9th 10th 11th 12th 7-8th 9-12th TOTALNever 32.5 33.7 29.0 30.4 31.4 27.1 33.1 29.5 31.3 -Seldom 13.9 16.2 16.9 16.5 15.1 14.4 15.0 16.1 15.5 -Sometimes 18.8 18.9 19.8 19.4 15.3 19.5 18.8 18.9 18.8 -Often 15.3 15.0 15.4 16.1 16.4 15.5 15.1 15.8 15.4 -A Lot 19.6 16.3 19.0 17.6 21.8 23.4 17.9 19.8 18.9 -N of Valid 1370 1455 1074 744 477 457 2825 2752 5577N of Miss 49 35 21 26 13 13 84 73 157
Table 4.14: Do you take part in community activities such as scouts, rec. teams, youth clubs, etc.?
RESPONSE 7th 8th 9th 10th 11th 12th 7-8th 9-12th TOTALNever 39.9 39.2 32.2 36.1 35.2 38.0 39.5 34.7 37.2 -Seldom 13.8 16.7 19.4 18.4 15.2 17.4 15.3 18.0 16.7 -Sometimes 16.3 16.8 19.0 21.0 18.4 18.7 16.5 19.4 17.9 -Often 13.1 13.4 15.3 13.4 15.8 11.4 13.3 14.2 13.8 -A Lot 16.8 13.9 14.1 11.1 15.4 14.5 15.3 13.6 14.5 -N of Valid 1367 1450 1069 739 474 455 2817 2737 5554N of Miss 52 40 26 31 16 15 92 88 180
Table 4.15: Do you attend church, synagogue, etc.?
RESPONSE 7th 8th 9th 10th 11th 12th 7-8th 9-12th TOTALNever 21.6 22.4 24.1 27.0 34.7 30.2 22.0 27.7 24.8 -Seldom 12.6 13.3 13.9 16.3 13.5 17.2 13.0 15.0 14.0 -Sometimes 22.7 21.2 19.7 17.9 17.8 20.0 21.9 19.0 20.5 -Often 17.2 16.5 15.2 14.3 12.9 12.3 16.8 14.1 15.5 -A Lot 25.9 26.7 27.0 24.4 21.1 20.3 26.3 24.2 25.3 -N of Valid 1363 1452 1065 741 473 454 2815 2733 5548N of Miss 56 38 30 29 17 16 94 92 186
Percentage Tables 214

Pride Surveys Report: 2017-18 Warren County
Table 4.16: Do your parents talk with you about the dangers of tobacco, alcohol and drug use?
RESPONSE 7th 8th 9th 10th 11th 12th 7-8th 9-12th TOTALNever 7.2 7.6 7.1 7.8 10.7 14.4 7.4 9.1 8.3 -Seldom 11.0 13.6 15.7 17.4 18.6 23.2 12.4 17.9 15.1 -Sometimes 31.3 32.7 31.6 33.1 32.4 36.1 32.0 32.9 32.4 -Often 24.6 24.7 24.6 23.3 22.8 16.8 24.7 22.7 23.7 -A Lot 25.8 21.4 21.0 18.4 15.5 9.4 23.5 17.4 20.5 -N of Valid 1368 1454 1072 746 478 457 2822 2753 5575N of Miss 51 36 23 24 12 13 87 72 159
Table 4.17: Do your teachers talk with you about the dangers of tobacco, alcohol and drug use?
RESPONSE 7th 8th 9th 10th 11th 12th 7-8th 9-12th TOTALNever 13.3 9.7 8.5 11.2 16.7 20.4 11.4 12.6 12.0 -Seldom 18.3 21.2 20.5 27.4 29.4 32.7 19.8 26.0 22.8 -Sometimes 29.5 35.3 33.2 32.5 31.8 32.9 32.5 32.7 32.6 -Often 22.4 21.0 24.1 17.7 14.6 9.6 21.6 18.3 20.0 -A Lot 16.6 12.8 13.7 11.2 7.4 4.4 14.6 10.4 12.5 -N of Valid 1363 1450 1067 744 472 456 2813 2739 5552N of Miss 56 40 28 26 18 14 96 86 182
Table 4.18: Does your school set clear rules on using alcohol and drugs during school and school functions?
RESPONSE 7th 8th 9th 10th 11th 12th 7-8th 9-12th TOTALNever 4.1 3.7 2.9 2.3 4.2 4.6 3.9 3.2 3.6 -Seldom 6.5 8.4 5.4 7.8 7.2 6.2 7.5 6.5 7.0 -Sometimes 8.7 12.1 12.8 16.6 16.9 18.2 10.5 15.5 12.9 -Often 23.1 27.0 26.9 29.1 32.4 30.1 25.1 29.0 27.0 -A Lot 57.6 48.9 52.0 44.2 39.2 40.9 53.1 45.8 49.5 -N of Valid 1362 1450 1075 740 472 455 2812 2742 5554N of Miss 57 40 20 30 18 15 97 83 180
Percentage Tables 215

Pride Surveys Report: 2017-18 Warren County
Table 4.19: Does your school punish you when you break the rules about using alcohol and drugs?
RESPONSE 7th 8th 9th 10th 11th 12th 7-8th 9-12th TOTALNever 10.6 7.7 6.0 5.6 8.3 8.7 9.1 6.7 7.9 -Seldom 3.0 3.2 2.5 4.8 5.3 6.0 3.1 4.2 3.7 -Sometimes 5.8 7.0 8.9 11.7 13.8 13.3 6.4 11.2 8.8 -Often 14.4 19.6 20.8 26.3 25.2 26.2 17.1 23.9 20.5 -A Lot 66.3 62.4 61.8 51.6 47.5 45.8 64.3 53.9 59.1 -N of Valid 1295 1406 1059 734 472 450 2701 2715 5416N of Miss 124 84 36 36 18 20 208 110 318
Table 4.20: Do your parents set clear rules for you about using alcohol and drugs?
RESPONSE 7th 8th 9th 10th 11th 12th 7-8th 9-12th TOTALNever 4.6 5.0 5.0 5.1 5.1 10.4 4.8 5.9 5.4 -Seldom 3.1 5.5 5.2 4.3 6.2 10.0 4.3 5.9 5.1 -Sometimes 7.5 9.5 9.7 13.5 15.5 18.4 8.5 13.2 10.8 -Often 19.4 22.2 22.9 22.2 24.2 26.3 20.8 23.5 22.1 -A Lot 65.5 57.8 57.3 54.9 49.0 35.0 61.5 51.5 56.6 -N of Valid 1359 1454 1065 740 471 452 2813 2728 5541N of Miss 60 36 30 30 19 18 96 97 193
Table 4.21: Do your parents punish you when you break the rules about using alcohol and drugs?
RESPONSE 7th 8th 9th 10th 11th 12th 7-8th 9-12th TOTALNever 16.7 16.2 14.8 14.7 16.2 24.1 16.4 16.6 16.5 -Seldom 2.8 2.8 4.2 5.2 6.3 10.1 2.8 5.8 4.3 -Sometimes 3.2 5.0 7.9 9.8 13.8 14.6 4.1 10.5 7.3 -Often 11.3 14.6 14.2 18.1 16.8 20.5 13.0 16.8 14.9 -A Lot 66.0 61.5 58.9 52.1 46.9 30.6 63.7 50.3 57.0 -N of Valid 1266 1372 1042 712 458 444 2638 2656 5294N of Miss 153 118 53 58 32 26 271 169 440
Percentage Tables 216

Pride Surveys Report: 2017-18 Warren County
Table 4.22: Have you been in trouble with the police?
RESPONSE 7th 8th 9th 10th 11th 12th 7-8th 9-12th TOTALNever 91.1 87.6 86.2 84.5 83.5 82.3 89.3 84.7 87.0 -Seldom 6.0 7.2 8.0 8.1 10.7 12.2 6.6 9.2 7.9 -Sometimes 2.2 3.3 4.4 4.3 3.8 4.4 2.8 4.3 3.5 -Often 0.3 1.0 0.8 1.2 0.9 0.7 0.7 0.9 0.8 -A Lot 0.4 0.9 0.6 1.9 1.1 0.4 0.6 1.0 0.8 -N of Valid 1374 1451 1074 744 468 452 2825 2738 5563N of Miss 45 39 21 26 22 18 84 87 171
Table 4.23: Do you take part in gang activities?
RESPONSE 7th 8th 9th 10th 11th 12th 7-8th 9-12th TOTALNever 96.1 94.4 95.9 94.8 95.1 96.0 95.2 95.5 95.3 -Seldom 1.7 2.8 2.2 1.6 1.9 1.3 2.3 1.8 2.1 -Sometimes 0.9 1.8 1.0 2.0 1.3 1.1 1.3 1.4 1.4 -Often 0.8 0.3 0.2 0.5 0.6 0.7 0.6 0.4 0.5 -A Lot 0.6 0.6 0.8 1.1 1.1 0.9 0.6 0.9 0.8 -N of Valid 1369 1450 1066 743 467 452 2819 2728 5547N of Miss 50 40 29 27 23 18 90 97 187
Table 4.24: Have you ever thought about committing suicide?
RESPONSE 7th 8th 9th 10th 11th 12th 7-8th 9-12th TOTALNever 79.0 70.7 63.4 59.5 59.5 63.5 74.7 61.7 68.3 -Seldom 11.7 12.3 15.2 15.7 15.8 13.6 12.0 15.2 13.6 -Sometimes 5.6 8.9 12.7 13.8 11.3 12.8 7.3 12.8 10.0 -Often 2.2 3.6 4.7 4.9 7.1 5.1 2.9 5.2 4.1 -A Lot 1.5 4.5 4.0 6.1 6.2 4.9 3.0 5.1 4.1 -N of Valid 1355 1433 1065 739 467 447 2788 2718 5506N of Miss 64 57 30 31 23 23 121 107 228
Percentage Tables 217

Pride Surveys Report: 2017-18 Warren County
Table 4.25: Do your friends use tobacco (cigarettes, etc.)?
RESPONSE 7th 8th 9th 10th 11th 12th 7-8th 9-12th TOTALNever 88.9 73.5 63.5 54.4 45.3 37.8 81.0 53.6 67.5 -Seldom 5.0 10.3 13.8 17.0 15.3 16.3 7.7 15.3 11.4 -Sometimes 4.0 9.8 12.5 15.5 20.0 25.5 7.0 16.8 11.8 -Often 1.2 3.6 5.5 6.6 10.3 11.0 2.4 7.5 4.9 -A Lot 1.0 2.8 4.8 6.6 9.1 9.5 1.9 6.8 4.3 -N of Valid 1365 1447 1059 730 464 455 2812 2708 5520N of Miss 54 43 36 40 26 15 97 117 214
Table 4.26: Do your friends use alcohol (beer, liquor, etc.)?
RESPONSE 7th 8th 9th 10th 11th 12th 7-8th 9-12th TOTALNever 90.4 73.2 54.9 40.9 26.9 22.6 81.6 40.9 61.6 -Seldom 5.3 11.4 16.9 19.8 17.7 13.7 8.4 17.3 12.8 -Sometimes 2.6 9.1 15.4 20.4 26.1 27.9 6.0 20.7 13.2 -Often 0.8 3.4 7.2 9.9 15.8 19.7 2.2 11.5 6.7 -A Lot 0.9 2.8 5.6 9.1 13.5 16.0 1.9 9.6 5.7 -N of Valid 1365 1450 1062 727 468 451 2815 2708 5523N of Miss 54 40 33 43 22 19 94 117 211
Table 4.27: Do your friends use marijuana (weed, chronic, dank, kush, etc.)?
RESPONSE 7th 8th 9th 10th 11th 12th 7-8th 9-12th TOTALNever 90.9 75.9 59.9 44.5 34.3 27.7 83.2 46.0 64.9 -Seldom 4.3 8.9 14.2 17.6 16.1 15.7 6.7 15.7 11.1 -Sometimes 2.3 8.0 14.0 17.3 19.7 22.6 5.3 17.3 11.2 -Often 1.3 3.6 5.6 9.3 14.8 17.9 2.5 10.2 6.3 -A Lot 1.2 3.6 6.3 11.4 15.2 16.2 2.4 10.8 6.6 -N of Valid 1368 1449 1068 735 467 452 2817 2722 5539N of Miss 51 41 27 35 23 18 92 103 195
Percentage Tables 218

Pride Surveys Report: 2017-18 Warren County
Table 4.28: In the past 3 months, have you been at a party where alcohol was available?
RESPONSE 7th 8th 9th 10th 11th 12th 7-8th 9-12th TOTALNever 81.0 82.4 75.5 67.3 53.1 48.0 81.7 64.9 73.4 -Seldom 7.4 6.4 8.0 8.5 9.8 10.1 6.9 8.8 7.8 -Sometimes 6.3 5.2 7.4 10.4 13.6 15.0 5.7 10.6 8.1 -Often 2.9 3.5 4.8 6.1 11.1 13.4 3.2 7.7 5.4 -A Lot 2.4 2.5 4.3 7.6 12.4 13.4 2.4 8.1 5.2 -N of Valid 1365 1456 1066 738 469 454 2821 2727 5548N of Miss 54 34 29 32 21 16 88 98 186
Table 4.29: In the past 3 months, have you been at a party where marijuana or other illicit drugs were available?
RESPONSE 7th 8th 9th 10th 11th 12th 7-8th 9-12th TOTALNever 97.4 92.3 85.9 76.2 63.6 60.3 94.8 75.2 85.2 -Seldom 1.5 2.8 4.1 6.0 7.3 9.1 2.1 6.0 4.0 -Sometimes 0.5 2.3 3.6 5.8 9.0 10.2 1.4 6.2 3.8 -Often 0.1 1.5 2.8 6.0 8.4 9.3 0.9 5.7 3.2 -A Lot 0.4 1.2 3.6 6.1 11.8 11.1 0.8 6.9 3.8 -N of Valid 1364 1453 1070 738 467 451 2817 2726 5543N of Miss 55 37 25 32 23 19 92 99 191
Percentage Tables 219

Pride Surveys Report: 2017-18 Warren County
Table 4.30: In the past 3 months, have you been at a party where prescription drugs, not prescribed to you, were available?
RESPONSE 7th 8th 9th 10th 11th 12th 7-8th 9-12th TOTALNever 95.6 94.6 92.2 90.0 83.0 85.4 95.1 88.9 92.1 -Seldom 2.0 2.6 2.9 4.5 5.4 6.1 2.3 4.3 3.3 -Sometimes 1.7 1.5 2.4 2.3 5.0 4.5 1.6 3.2 2.4 -Often 0.4 0.6 1.4 1.6 3.0 0.9 0.5 1.7 1.1 -A Lot 0.3 0.6 1.0 1.5 3.5 3.2 0.5 1.9 1.2 -N of Valid 1356 1444 1067 729 460 444 2800 2700 5500N of Miss 63 46 28 41 30 26 109 125 234
Table 4.31: In general, how often do you experience stress in your daily life?
RESPONSE 7th 8th 9th 10th 11th 12th 7-8th 9-12th TOTALNever 8.1 5.4 3.4 5.5 4.3 7.2 6.7 4.8 5.7 -Seldom 24.9 16.9 11.7 11.6 6.0 10.8 20.8 10.5 15.8 -Sometimes 31.6 30.2 25.3 22.9 20.8 21.3 30.9 23.2 27.1 -Often 19.7 23.1 28.8 24.8 26.0 24.7 21.5 26.5 24.0 -A Lot 15.7 24.4 30.9 35.2 42.9 36.1 20.2 35.0 27.5 -N of Valid 1364 1449 1064 739 466 446 2813 2715 5528N of Miss 55 41 31 31 24 24 96 110 206
Table 4.32: Does your school ask any students to take a drug test?
RESPONSE 7th 8th 9th 10th 11th 12th 7-8th 9-12th TOTALYes 11.2 14.9 29.8 33.3 27.6 22.4 13.2 29.2 21.1 -No 88.8 85.1 70.2 66.7 72.4 77.6 86.8 70.8 78.9 -N of Valid 1325 1425 1050 741 471 451 2750 2713 5463N of Miss 94 65 45 29 19 19 159 112 271
Table 4.33: Have you bought or sold drugs AT school?
RESPONSE 7th 8th 9th 10th 11th 12th 7-8th 9-12th TOTALYes 0.7 0.9 1.6 3.9 2.3 3.5 0.8 2.7 1.7 -No 99.3 99.1 98.4 96.1 97.7 96.5 99.2 97.3 98.3 -N of Valid 1375 1461 1069 742 472 451 2836 2734 5570N of Miss 44 29 26 28 18 19 73 91 164
Percentage Tables 220
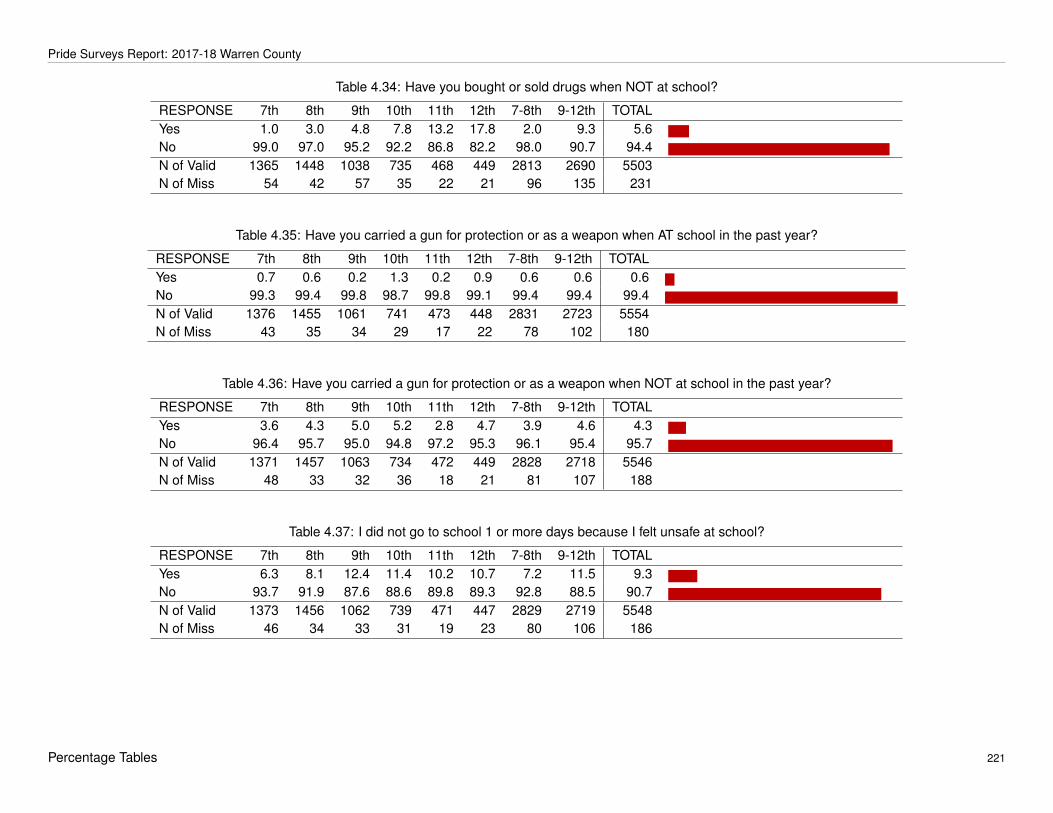
Pride Surveys Report: 2017-18 Warren County
Table 4.34: Have you bought or sold drugs when NOT at school?
RESPONSE 7th 8th 9th 10th 11th 12th 7-8th 9-12th TOTALYes 1.0 3.0 4.8 7.8 13.2 17.8 2.0 9.3 5.6 -No 99.0 97.0 95.2 92.2 86.8 82.2 98.0 90.7 94.4 -N of Valid 1365 1448 1038 735 468 449 2813 2690 5503N of Miss 54 42 57 35 22 21 96 135 231
Table 4.35: Have you carried a gun for protection or as a weapon when AT school in the past year?
RESPONSE 7th 8th 9th 10th 11th 12th 7-8th 9-12th TOTALYes 0.7 0.6 0.2 1.3 0.2 0.9 0.6 0.6 0.6 -No 99.3 99.4 99.8 98.7 99.8 99.1 99.4 99.4 99.4 -N of Valid 1376 1455 1061 741 473 448 2831 2723 5554N of Miss 43 35 34 29 17 22 78 102 180
Table 4.36: Have you carried a gun for protection or as a weapon when NOT at school in the past year?
RESPONSE 7th 8th 9th 10th 11th 12th 7-8th 9-12th TOTALYes 3.6 4.3 5.0 5.2 2.8 4.7 3.9 4.6 4.3 -No 96.4 95.7 95.0 94.8 97.2 95.3 96.1 95.4 95.7 -N of Valid 1371 1457 1063 734 472 449 2828 2718 5546N of Miss 48 33 32 36 18 21 81 107 188
Table 4.37: I did not go to school 1 or more days because I felt unsafe at school?
RESPONSE 7th 8th 9th 10th 11th 12th 7-8th 9-12th TOTALYes 6.3 8.1 12.4 11.4 10.2 10.7 7.2 11.5 9.3 -No 93.7 91.9 87.6 88.6 89.8 89.3 92.8 88.5 90.7 -N of Valid 1373 1456 1062 739 471 447 2829 2719 5548N of Miss 46 34 33 31 19 23 80 106 186
Percentage Tables 221

Pride Surveys Report: 2017-18 Warren County
Table 4.38: I did not go to school 1 or more days because I felt unsafe on my way to or from school?
RESPONSE 7th 8th 9th 10th 11th 12th 7-8th 9-12th TOTALYes 2.8 3.2 3.9 3.1 1.7 2.9 3.0 3.1 3.1 -No 97.2 96.8 96.1 96.9 98.3 97.1 97.0 96.9 96.9 -N of Valid 1367 1452 1058 732 467 451 2819 2708 5527N of Miss 52 38 37 38 23 19 90 117 207
Table 4.39: Are you aware of a drug prevention coalition in your neighborhood?
RESPONSE 7th 8th 9th 10th 11th 12th 7-8th 9-12th TOTALYes 23.2 22.0 18.0 15.7 9.8 11.7 22.6 14.9 18.8 -No 76.8 78.0 82.0 84.3 90.2 88.3 77.4 85.1 81.2 -N of Valid 1322 1438 1056 738 469 443 2760 2706 5466N of Miss 97 52 39 32 21 27 149 119 268
Table 4.40: Are you involved in an extracurricular activity where the primary purpose of the group is to organize activities aroundthe prevention of drug and alcohol use in your community??
RESPONSE 7th 8th 9th 10th 11th 12th 7-8th 9-12th TOTALYes 5.6 4.7 4.8 4.5 3.8 4.3 5.1 4.5 4.8 -No 94.4 95.3 95.2 95.5 96.2 95.7 94.9 95.5 95.2 -N of Valid 1342 1447 1058 741 468 445 2789 2712 5501N of Miss 77 43 37 29 22 25 120 113 233
Table 4.41: During the past 7 days, how many times did you exercise, play a sport, or participate in a physical activity for at least20 minutes that made you sweat and breathe hard?
RESPONSE 7th 8th 9th 10th 11th 12th 7-8th 9-12th TOTAL0 Days 10.5 10.8 9.2 12.9 15.1 14.0 10.6 12.0 11.3 -1-3 Days 27.9 28.4 23.4 27.0 28.1 30.4 28.2 26.3 27.3 -4-6 Days 31.2 34.2 36.3 35.2 33.0 37.8 32.8 35.7 34.2 -7 Days 30.4 26.6 31.1 24.9 23.8 17.8 28.4 26.0 27.2 -N of Valid 1213 1380 980 651 445 415 2593 2491 5084N of Miss 206 110 115 119 45 55 316 334 650
Percentage Tables 222
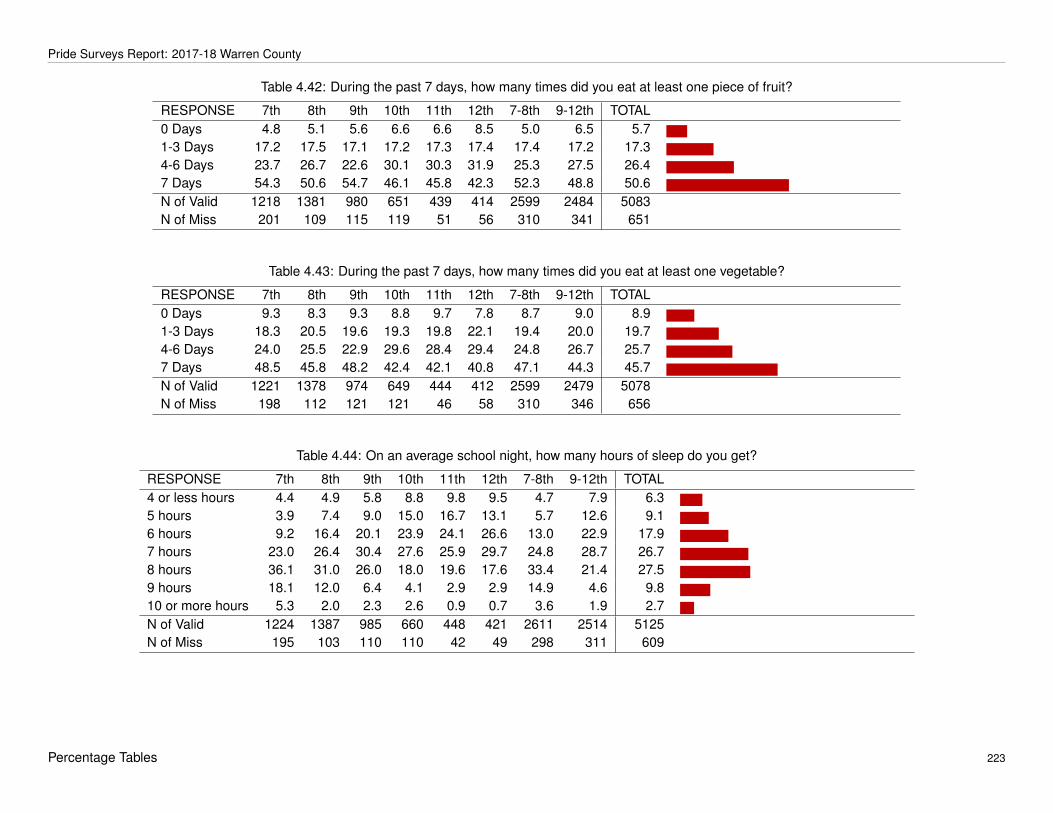
Pride Surveys Report: 2017-18 Warren County
Table 4.42: During the past 7 days, how many times did you eat at least one piece of fruit?
RESPONSE 7th 8th 9th 10th 11th 12th 7-8th 9-12th TOTAL0 Days 4.8 5.1 5.6 6.6 6.6 8.5 5.0 6.5 5.7 -1-3 Days 17.2 17.5 17.1 17.2 17.3 17.4 17.4 17.2 17.3 -4-6 Days 23.7 26.7 22.6 30.1 30.3 31.9 25.3 27.5 26.4 -7 Days 54.3 50.6 54.7 46.1 45.8 42.3 52.3 48.8 50.6 -N of Valid 1218 1381 980 651 439 414 2599 2484 5083N of Miss 201 109 115 119 51 56 310 341 651
Table 4.43: During the past 7 days, how many times did you eat at least one vegetable?
RESPONSE 7th 8th 9th 10th 11th 12th 7-8th 9-12th TOTAL0 Days 9.3 8.3 9.3 8.8 9.7 7.8 8.7 9.0 8.9 -1-3 Days 18.3 20.5 19.6 19.3 19.8 22.1 19.4 20.0 19.7 -4-6 Days 24.0 25.5 22.9 29.6 28.4 29.4 24.8 26.7 25.7 -7 Days 48.5 45.8 48.2 42.4 42.1 40.8 47.1 44.3 45.7 -N of Valid 1221 1378 974 649 444 412 2599 2479 5078N of Miss 198 112 121 121 46 58 310 346 656
Table 4.44: On an average school night, how many hours of sleep do you get?
RESPONSE 7th 8th 9th 10th 11th 12th 7-8th 9-12th TOTAL4 or less hours 4.4 4.9 5.8 8.8 9.8 9.5 4.7 7.9 6.3 -5 hours 3.9 7.4 9.0 15.0 16.7 13.1 5.7 12.6 9.1 -6 hours 9.2 16.4 20.1 23.9 24.1 26.6 13.0 22.9 17.9 -7 hours 23.0 26.4 30.4 27.6 25.9 29.7 24.8 28.7 26.7 -8 hours 36.1 31.0 26.0 18.0 19.6 17.6 33.4 21.4 27.5 -9 hours 18.1 12.0 6.4 4.1 2.9 2.9 14.9 4.6 9.8 -10 or more hours 5.3 2.0 2.3 2.6 0.9 0.7 3.6 1.9 2.7 -N of Valid 1224 1387 985 660 448 421 2611 2514 5125N of Miss 195 103 110 110 42 49 298 311 609
Percentage Tables 223

Pride Surveys Report: 2017-18 Warren County
Table 4.45: Within the past year, as a result of drinking, I did something I later regretted?
RESPONSE 7th 8th 9th 10th 11th 12th 7-8th 9-12th TOTALYes 1.4 3.4 5.2 7.9 11.0 12.0 2.4 8.1 5.2 -No 7.6 10.7 16.6 22.0 28.3 37.0 9.2 23.4 16.2 -I do not drink 91.0 85.9 78.2 70.1 60.7 51.0 88.4 68.5 78.6 -N of Valid 1370 1454 1069 747 473 449 2824 2738 5562N of Miss 49 36 26 23 17 21 85 87 172
Table 4.46: On an average school day, how often do you play video or computer games or use a device for something that is notschool work? (Count time spent on things such as Xbox, Wii, tablets and smartphones)
RESPONSE 7th 8th 9th 10th 11th 12th 7-8th 9-12th TOTALNever 9.8 6.5 3.2 3.9 3.4 3.3 8.1 3.4 5.8 -Seldom 15.5 14.0 11.7 12.1 12.0 10.0 14.7 11.6 13.2 -Sometimes 28.5 24.7 24.5 28.2 22.8 22.0 26.6 24.8 25.7 -Often 27.7 31.3 34.3 30.7 34.6 33.0 29.6 33.2 31.3 -A Lot 18.6 23.5 26.4 25.1 27.2 31.7 21.1 27.1 24.0 -N of Valid 1372 1452 1071 742 474 451 2824 2738 5562N of Miss 47 38 24 28 16 19 85 87 172
Table 4.47: In the past 3 months, how often have you seen or heard anti-drug messages? (TV, Radio, Internet, Social Media Sites,Billboards, Movie Theaters)
RESPONSE 7th 8th 9th 10th 11th 12th 7-8th 9-12th TOTALNever 11.5 7.4 7.2 6.8 7.0 8.0 9.4 7.2 8.3 -Once/month 24.7 24.6 19.1 23.9 22.8 31.7 24.6 23.1 23.9 -1-3 times/month 38.5 38.6 37.9 39.3 39.5 30.4 38.5 37.3 37.9 -1-3 times/week 25.2 29.4 35.7 30.0 30.7 29.9 27.4 32.3 29.8 -N of Valid 1360 1450 1066 746 473 451 2810 2736 5546N of Miss 59 40 29 24 17 19 99 89 188
Percentage Tables 224
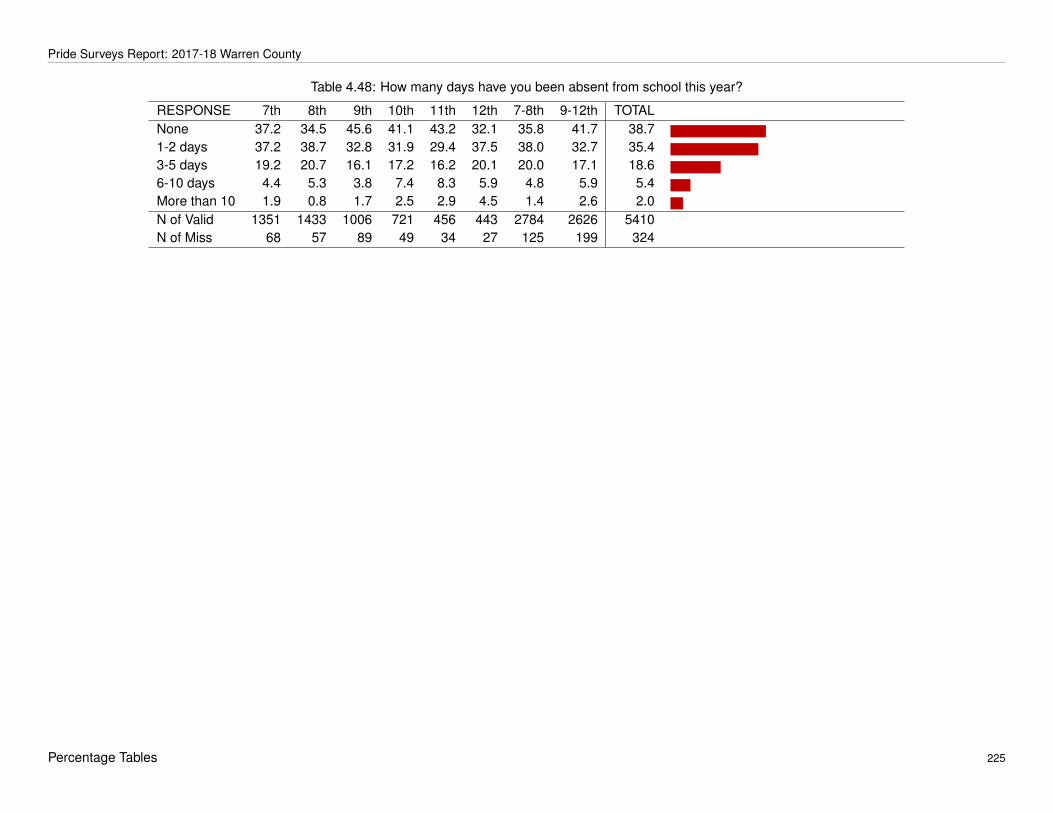
Pride Surveys Report: 2017-18 Warren County
Table 4.48: How many days have you been absent from school this year?
RESPONSE 7th 8th 9th 10th 11th 12th 7-8th 9-12th TOTALNone 37.2 34.5 45.6 41.1 43.2 32.1 35.8 41.7 38.7 -1-2 days 37.2 38.7 32.8 31.9 29.4 37.5 38.0 32.7 35.4 -3-5 days 19.2 20.7 16.1 17.2 16.2 20.1 20.0 17.1 18.6 -6-10 days 4.4 5.3 3.8 7.4 8.3 5.9 4.8 5.9 5.4 -More than 10 1.9 0.8 1.7 2.5 2.9 4.5 1.4 2.6 2.0 -N of Valid 1351 1433 1006 721 456 443 2784 2626 5410N of Miss 68 57 89 49 34 27 125 199 324
Percentage Tables 225

Pride Surveys Report: 2017-18 Warren County
4.3 Within The Past Year How Often Have You...
Table 4.49: Within the past year how often have you smoked cigarettes?
RESPONSE 7th 8th 9th 10th 11th 12th 7-8th 9-12th TOTALDoes not apply 98.7 95.7 93.2 92.5 90.4 86.4 97.2 91.4 94.3 -Once/year 0.9 1.9 2.7 1.9 2.6 6.7 1.4 3.1 2.2 -6 times/year 0.0 0.3 1.2 1.0 1.9 2.5 0.1 1.5 0.8 -Once/month 0.0 0.5 0.9 0.7 1.9 0.9 0.2 1.0 0.6 -Twice/month 0.1 0.6 0.7 0.8 0.6 0.7 0.4 0.7 0.5 -Once/week 0.0 0.7 0.4 1.1 1.1 1.1 0.4 0.8 0.6 -3 times/week 0.3 0.3 0.5 0.7 0.6 0.4 0.3 0.6 0.4 -Every day 0.0 0.1 0.5 1.4 0.9 1.3 0.1 0.9 0.5 -N of Valid 1364 1447 1045 731 468 448 2811 2692 5503N of Miss 55 43 50 39 22 22 98 133 231
Table 4.50: Within the past year how often have you used smokeless tobacco (chew, etc.)?
RESPONSE 7th 8th 9th 10th 11th 12th 7-8th 9-12th TOTALDoes not apply 99.4 97.9 95.5 94.0 94.2 89.7 98.6 93.9 96.3 -Once/year 0.4 1.1 3.0 2.3 2.6 4.0 0.7 2.9 1.8 -6 times/year 0.0 0.2 0.3 1.2 0.6 2.2 0.1 0.9 0.5 -Once/month 0.1 0.1 0.3 0.3 1.3 1.1 0.1 0.6 0.3 -Twice/month 0.0 0.1 0.3 0.4 0.2 0.7 0.0 0.4 0.2 -Once/week 0.0 0.3 0.2 0.4 0.2 0.9 0.2 0.4 0.3 -3 times/week 0.0 0.2 0.2 0.1 0.2 0.7 0.1 0.3 0.2 -Every day 0.1 0.1 0.3 1.2 0.6 0.7 0.1 0.7 0.4 -N of Valid 1362 1441 1046 728 466 446 2803 2686 5489N of Miss 57 49 49 42 24 24 106 139 245
Percentage Tables 226
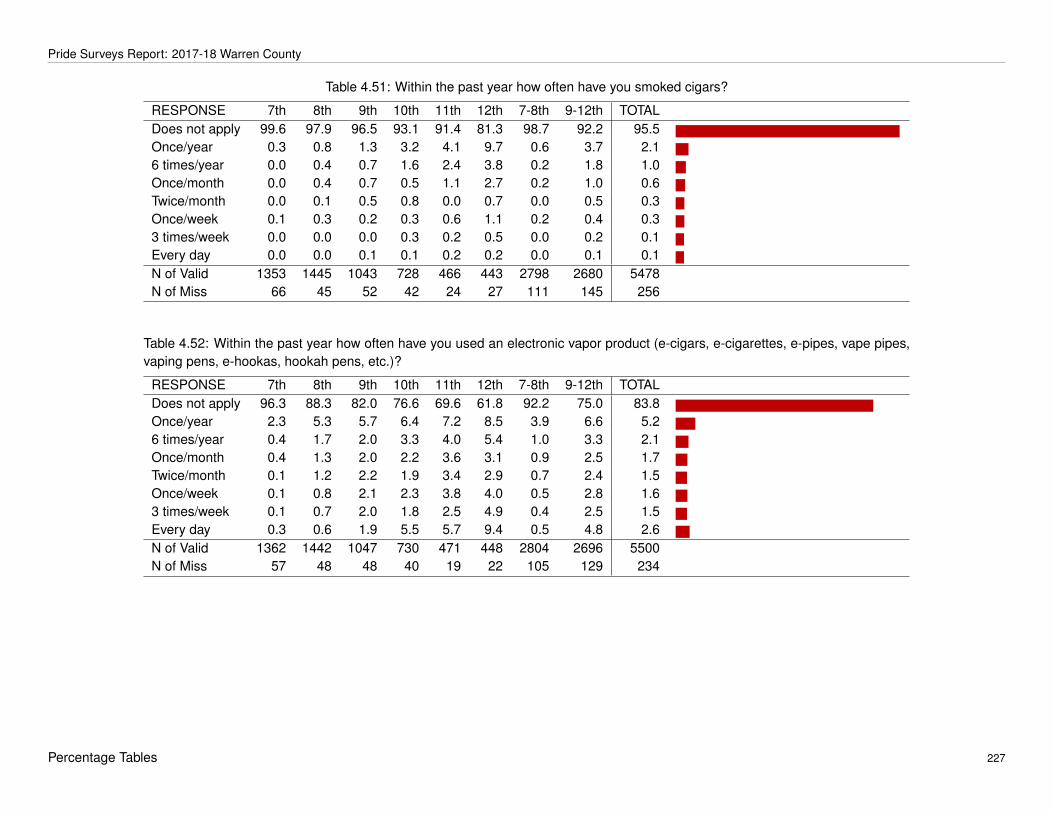
Pride Surveys Report: 2017-18 Warren County
Table 4.51: Within the past year how often have you smoked cigars?
RESPONSE 7th 8th 9th 10th 11th 12th 7-8th 9-12th TOTALDoes not apply 99.6 97.9 96.5 93.1 91.4 81.3 98.7 92.2 95.5 -Once/year 0.3 0.8 1.3 3.2 4.1 9.7 0.6 3.7 2.1 -6 times/year 0.0 0.4 0.7 1.6 2.4 3.8 0.2 1.8 1.0 -Once/month 0.0 0.4 0.7 0.5 1.1 2.7 0.2 1.0 0.6 -Twice/month 0.0 0.1 0.5 0.8 0.0 0.7 0.0 0.5 0.3 -Once/week 0.1 0.3 0.2 0.3 0.6 1.1 0.2 0.4 0.3 -3 times/week 0.0 0.0 0.0 0.3 0.2 0.5 0.0 0.2 0.1 -Every day 0.0 0.0 0.1 0.1 0.2 0.2 0.0 0.1 0.1 -N of Valid 1353 1445 1043 728 466 443 2798 2680 5478N of Miss 66 45 52 42 24 27 111 145 256
Table 4.52: Within the past year how often have you used an electronic vapor product (e-cigars, e-cigarettes, e-pipes, vape pipes,vaping pens, e-hookas, hookah pens, etc.)?
RESPONSE 7th 8th 9th 10th 11th 12th 7-8th 9-12th TOTALDoes not apply 96.3 88.3 82.0 76.6 69.6 61.8 92.2 75.0 83.8 -Once/year 2.3 5.3 5.7 6.4 7.2 8.5 3.9 6.6 5.2 -6 times/year 0.4 1.7 2.0 3.3 4.0 5.4 1.0 3.3 2.1 -Once/month 0.4 1.3 2.0 2.2 3.6 3.1 0.9 2.5 1.7 -Twice/month 0.1 1.2 2.2 1.9 3.4 2.9 0.7 2.4 1.5 -Once/week 0.1 0.8 2.1 2.3 3.8 4.0 0.5 2.8 1.6 -3 times/week 0.1 0.7 2.0 1.8 2.5 4.9 0.4 2.5 1.5 -Every day 0.3 0.6 1.9 5.5 5.7 9.4 0.5 4.8 2.6 -N of Valid 1362 1442 1047 730 471 448 2804 2696 5500N of Miss 57 48 48 40 19 22 105 129 234
Percentage Tables 227

Pride Surveys Report: 2017-18 Warren County
Table 4.53: Within the past year how often have you drank beer?
RESPONSE 7th 8th 9th 10th 11th 12th 7-8th 9-12th TOTALDoes not apply 94.6 88.3 82.7 74.5 65.9 55.8 91.3 73.1 82.4 -Once/year 3.8 8.0 9.0 9.7 13.1 11.2 6.0 10.2 8.1 -6 times/year 0.9 1.4 2.7 4.9 6.0 10.5 1.1 5.2 3.1 -Once/month 0.3 0.6 2.5 3.3 4.5 6.7 0.5 3.8 2.1 -Twice/month 0.2 0.8 2.1 4.7 6.2 7.8 0.5 4.5 2.5 -Once/week 0.1 0.4 1.0 1.6 3.6 7.1 0.3 2.6 1.4 -3 times/week 0.1 0.3 0.2 1.0 0.0 0.7 0.2 0.4 0.3 -Every day 0.0 0.1 0.0 0.3 0.6 0.2 0.1 0.2 0.1 -N of Valid 1360 1445 1049 730 466 448 2805 2693 5498N of Miss 59 45 46 40 24 22 104 132 236
Table 4.54: Within the past year how often have you drank coolers, hard lemonade, etc.?
RESPONSE 7th 8th 9th 10th 11th 12th 7-8th 9-12th TOTALDoes not apply 96.4 90.5 85.0 77.4 67.5 58.8 93.4 75.5 84.6 -Once/year 2.3 5.9 7.8 9.2 11.1 10.1 4.2 9.1 6.6 -6 times/year 0.6 1.4 2.6 3.7 7.7 10.5 1.0 5.1 3.0 -Once/month 0.3 1.1 2.4 3.3 3.6 6.9 0.7 3.6 2.1 -Twice/month 0.0 0.3 1.4 4.4 5.1 7.8 0.2 3.9 2.0 -Once/week 0.1 0.3 0.4 0.5 4.3 5.1 0.3 1.9 1.1 -3 times/week 0.1 0.2 0.4 1.2 0.0 0.4 0.2 0.6 0.4 -Every day 0.1 0.2 0.1 0.3 0.6 0.2 0.1 0.3 0.2 -N of Valid 1348 1437 1044 730 468 447 2785 2689 5474N of Miss 71 53 51 40 22 23 124 136 260
Percentage Tables 228
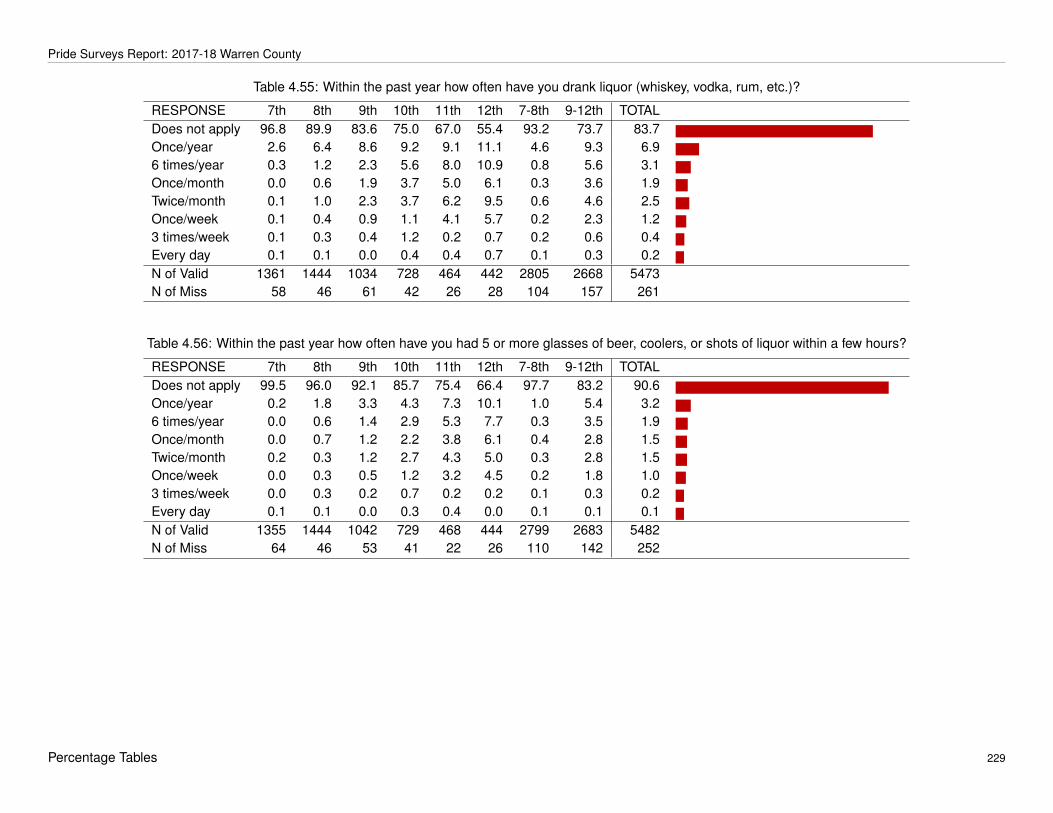
Pride Surveys Report: 2017-18 Warren County
Table 4.55: Within the past year how often have you drank liquor (whiskey, vodka, rum, etc.)?
RESPONSE 7th 8th 9th 10th 11th 12th 7-8th 9-12th TOTALDoes not apply 96.8 89.9 83.6 75.0 67.0 55.4 93.2 73.7 83.7 -Once/year 2.6 6.4 8.6 9.2 9.1 11.1 4.6 9.3 6.9 -6 times/year 0.3 1.2 2.3 5.6 8.0 10.9 0.8 5.6 3.1 -Once/month 0.0 0.6 1.9 3.7 5.0 6.1 0.3 3.6 1.9 -Twice/month 0.1 1.0 2.3 3.7 6.2 9.5 0.6 4.6 2.5 -Once/week 0.1 0.4 0.9 1.1 4.1 5.7 0.2 2.3 1.2 -3 times/week 0.1 0.3 0.4 1.2 0.2 0.7 0.2 0.6 0.4 -Every day 0.1 0.1 0.0 0.4 0.4 0.7 0.1 0.3 0.2 -N of Valid 1361 1444 1034 728 464 442 2805 2668 5473N of Miss 58 46 61 42 26 28 104 157 261
Table 4.56: Within the past year how often have you had 5 or more glasses of beer, coolers, or shots of liquor within a few hours?
RESPONSE 7th 8th 9th 10th 11th 12th 7-8th 9-12th TOTALDoes not apply 99.5 96.0 92.1 85.7 75.4 66.4 97.7 83.2 90.6 -Once/year 0.2 1.8 3.3 4.3 7.3 10.1 1.0 5.4 3.2 -6 times/year 0.0 0.6 1.4 2.9 5.3 7.7 0.3 3.5 1.9 -Once/month 0.0 0.7 1.2 2.2 3.8 6.1 0.4 2.8 1.5 -Twice/month 0.2 0.3 1.2 2.7 4.3 5.0 0.3 2.8 1.5 -Once/week 0.0 0.3 0.5 1.2 3.2 4.5 0.2 1.8 1.0 -3 times/week 0.0 0.3 0.2 0.7 0.2 0.2 0.1 0.3 0.2 -Every day 0.1 0.1 0.0 0.3 0.4 0.0 0.1 0.1 0.1 -N of Valid 1355 1444 1042 729 468 444 2799 2683 5482N of Miss 64 46 53 41 22 26 110 142 252
Percentage Tables 229

Pride Surveys Report: 2017-18 Warren County
Table 4.57: Within the past year how often have you smoked marijuana (weed, chronic, dank, kish, etc.?
RESPONSE 7th 8th 9th 10th 11th 12th 7-8th 9-12th TOTALDoes not apply 98.9 94.5 90.3 84.7 75.8 70.8 96.6 83.0 90.0 -Once/year 0.4 2.1 2.5 3.9 6.2 7.2 1.3 4.3 2.8 -6 times/year 0.1 0.8 2.2 2.9 4.3 4.3 0.5 3.1 1.8 -Once/month 0.1 0.5 0.9 0.8 3.9 3.8 0.3 1.9 1.1 -Twice/month 0.1 0.8 1.1 2.3 1.9 4.3 0.5 2.1 1.3 -Once/week 0.1 0.4 1.3 1.1 4.5 3.6 0.3 2.2 1.2 -3 times/week 0.1 0.6 0.8 1.8 1.7 2.5 0.3 1.5 0.9 -Every day 0.1 0.3 1.0 2.5 1.7 3.4 0.2 1.9 1.0 -N of Valid 1354 1445 1043 725 466 442 2799 2676 5475N of Miss 65 45 52 45 24 28 110 149 259
Table 4.58: Within the past year how often have you used synthetic marijuana (K2, spice)?
RESPONSE 7th 8th 9th 10th 11th 12th 7-8th 9-12th TOTALDoes not apply 99.7 99.2 98.0 98.0 95.7 96.8 99.4 97.4 98.4 -Once/year 0.1 0.3 0.6 0.8 1.9 1.1 0.2 1.0 0.6 -6 times/year 0.0 0.3 0.1 0.3 0.4 0.7 0.1 0.3 0.2 -Once/month 0.0 0.1 0.3 0.3 0.9 0.0 0.0 0.3 0.2 -Twice/month 0.0 0.1 0.4 0.3 0.4 0.5 0.0 0.4 0.2 -Once/week 0.1 0.0 0.1 0.1 0.4 0.2 0.1 0.2 0.1 -3 times/week 0.1 0.0 0.3 0.1 0.2 0.5 0.0 0.3 0.1 -Every day 0.0 0.1 0.3 0.0 0.0 0.2 0.1 0.2 0.1 -N of Valid 1348 1440 1032 716 463 441 2788 2652 5440N of Miss 71 50 63 54 27 29 121 173 294
Percentage Tables 230
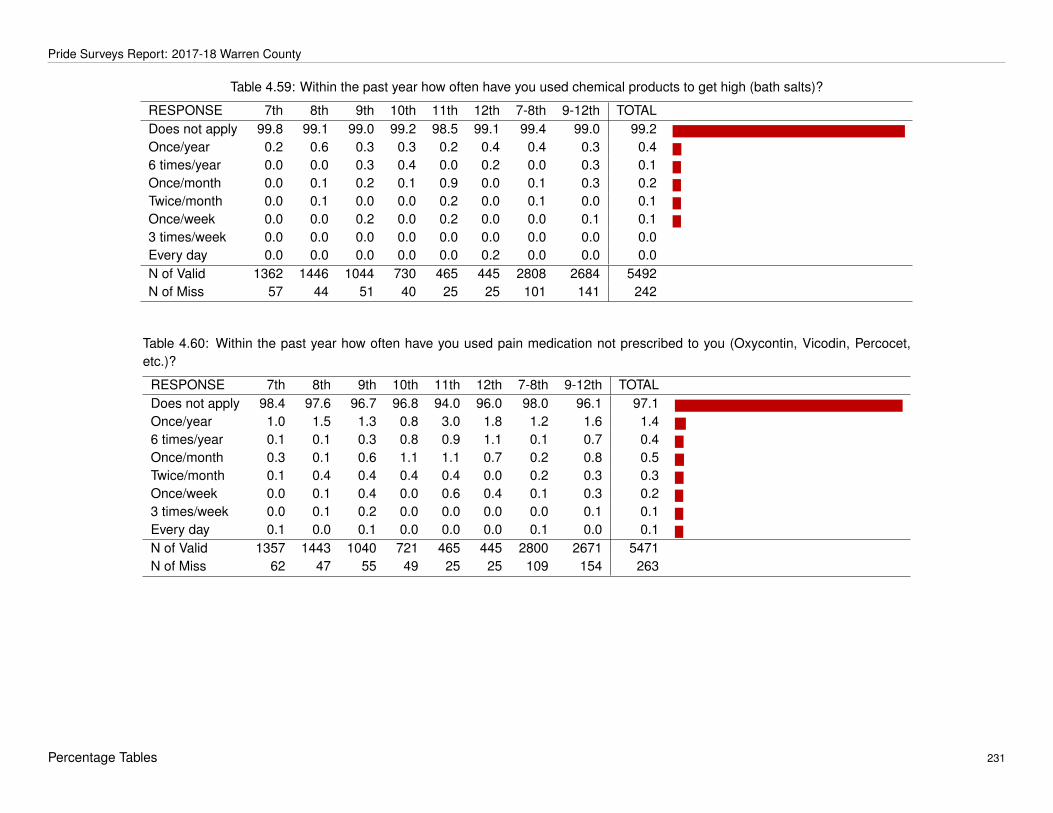
Pride Surveys Report: 2017-18 Warren County
Table 4.59: Within the past year how often have you used chemical products to get high (bath salts)?
RESPONSE 7th 8th 9th 10th 11th 12th 7-8th 9-12th TOTALDoes not apply 99.8 99.1 99.0 99.2 98.5 99.1 99.4 99.0 99.2 -Once/year 0.2 0.6 0.3 0.3 0.2 0.4 0.4 0.3 0.4 -6 times/year 0.0 0.0 0.3 0.4 0.0 0.2 0.0 0.3 0.1 -Once/month 0.0 0.1 0.2 0.1 0.9 0.0 0.1 0.3 0.2 -Twice/month 0.0 0.1 0.0 0.0 0.2 0.0 0.1 0.0 0.1 -Once/week 0.0 0.0 0.2 0.0 0.2 0.0 0.0 0.1 0.1 -3 times/week 0.0 0.0 0.0 0.0 0.0 0.0 0.0 0.0 0.0Every day 0.0 0.0 0.0 0.0 0.0 0.2 0.0 0.0 0.0N of Valid 1362 1446 1044 730 465 445 2808 2684 5492N of Miss 57 44 51 40 25 25 101 141 242
Table 4.60: Within the past year how often have you used pain medication not prescribed to you (Oxycontin, Vicodin, Percocet,etc.)?
RESPONSE 7th 8th 9th 10th 11th 12th 7-8th 9-12th TOTALDoes not apply 98.4 97.6 96.7 96.8 94.0 96.0 98.0 96.1 97.1 -Once/year 1.0 1.5 1.3 0.8 3.0 1.8 1.2 1.6 1.4 -6 times/year 0.1 0.1 0.3 0.8 0.9 1.1 0.1 0.7 0.4 -Once/month 0.3 0.1 0.6 1.1 1.1 0.7 0.2 0.8 0.5 -Twice/month 0.1 0.4 0.4 0.4 0.4 0.0 0.2 0.3 0.3 -Once/week 0.0 0.1 0.4 0.0 0.6 0.4 0.1 0.3 0.2 -3 times/week 0.0 0.1 0.2 0.0 0.0 0.0 0.0 0.1 0.1 -Every day 0.1 0.0 0.1 0.0 0.0 0.0 0.1 0.0 0.1 -N of Valid 1357 1443 1040 721 465 445 2800 2671 5471N of Miss 62 47 55 49 25 25 109 154 263
Percentage Tables 231

Pride Surveys Report: 2017-18 Warren County
Table 4.61: Within the past year how often have you used stimulant medication not prescribed to you (Adderall, Ritalin, Concerta,etc.)?
RESPONSE 7th 8th 9th 10th 11th 12th 7-8th 9-12th TOTALDoes not apply 99.0 98.6 97.9 97.1 94.6 93.5 98.8 96.4 97.6 -Once/year 0.6 0.5 0.8 0.5 2.6 2.9 0.5 1.4 0.9 -6 times/year 0.0 0.4 0.4 0.7 0.9 1.6 0.2 0.7 0.5 -Once/month 0.1 0.2 0.2 1.1 1.3 0.5 0.1 0.7 0.4 -Twice/month 0.1 0.1 0.5 0.1 0.2 0.7 0.1 0.4 0.2 -Once/week 0.0 0.1 0.2 0.3 0.4 0.5 0.0 0.3 0.2 -3 times/week 0.1 0.0 0.1 0.0 0.0 0.0 0.0 0.0 0.0Every day 0.2 0.1 0.0 0.1 0.0 0.5 0.2 0.1 0.1 -N of Valid 1353 1443 1041 729 465 444 2796 2679 5475N of Miss 66 47 54 41 25 26 113 146 259
Table 4.62: Within the past year how often have you used sleeping medication not prescribed to you (Ambien, Restoril, etc.)?
RESPONSE 7th 8th 9th 10th 11th 12th 7-8th 9-12th TOTALDoes not apply 97.3 95.4 95.5 96.9 95.9 96.2 96.3 96.1 96.2 -Once/year 1.4 2.8 1.6 1.0 1.5 1.1 2.1 1.4 1.7 -6 times/year 0.1 0.3 0.5 0.8 1.1 0.7 0.2 0.7 0.5 -Once/month 0.1 0.5 0.4 0.8 0.6 1.4 0.3 0.7 0.5 -Twice/month 0.2 0.3 0.7 0.1 0.4 0.0 0.3 0.4 0.3 -Once/week 0.1 0.3 0.5 0.0 0.2 0.5 0.2 0.3 0.3 -3 times/week 0.1 0.1 0.6 0.0 0.2 0.2 0.1 0.3 0.2 -Every day 0.5 0.3 0.3 0.3 0.0 0.0 0.4 0.2 0.3 -N of Valid 1354 1442 1036 721 463 442 2796 2662 5458N of Miss 65 48 59 49 27 28 113 163 276
Percentage Tables 232

Pride Surveys Report: 2017-18 Warren County
Table 4.63: Within the past year how often have you used sedative/anxiety medication not prescribed to you (Xanax, Valium, Ativan,etc.)?
RESPONSE 7th 8th 9th 10th 11th 12th 7-8th 9-12th TOTALDoes not apply 99.2 97.7 97.7 97.1 94.4 96.2 98.4 96.7 97.6 -Once/year 0.5 1.0 1.0 1.4 3.0 1.1 0.8 1.5 1.1 -6 times/year 0.1 0.5 0.1 0.7 0.9 1.4 0.3 0.6 0.4 -Once/month 0.1 0.3 0.2 0.4 0.9 0.7 0.2 0.4 0.3 -Twice/month 0.1 0.0 0.5 0.1 0.2 0.5 0.0 0.3 0.2 -Once/week 0.0 0.3 0.3 0.1 0.4 0.2 0.2 0.3 0.2 -3 times/week 0.0 0.0 0.1 0.0 0.2 0.0 0.0 0.1 0.0Every day 0.1 0.1 0.2 0.1 0.0 0.0 0.1 0.1 0.1 -N of Valid 1358 1445 1048 725 465 444 2803 2682 5485N of Miss 61 45 47 45 25 26 106 143 249
Table 4.64: Within the past year how often have you used over-the-counter drugs to get high?
RESPONSE 7th 8th 9th 10th 11th 12th 7-8th 9-12th TOTALDoes not apply 99.9 98.6 98.7 98.5 98.3 98.9 99.3 98.6 98.9 -Once/year 0.1 0.8 0.5 0.7 0.2 0.5 0.5 0.5 0.5 -6 times/year 0.0 0.3 0.2 0.3 0.2 0.5 0.2 0.3 0.2 -Once/month 0.0 0.1 0.2 0.1 0.6 0.0 0.0 0.2 0.1 -Twice/month 0.0 0.1 0.0 0.1 0.4 0.0 0.1 0.1 0.1 -Once/week 0.0 0.0 0.1 0.3 0.0 0.2 0.0 0.1 0.1 -3 times/week 0.0 0.0 0.3 0.0 0.2 0.0 0.0 0.1 0.1 -Every day 0.0 0.0 0.1 0.0 0.0 0.0 0.0 0.0 0.0N of Valid 1355 1447 1044 723 466 442 2802 2675 5477N of Miss 64 43 51 47 24 28 107 150 257
Percentage Tables 233
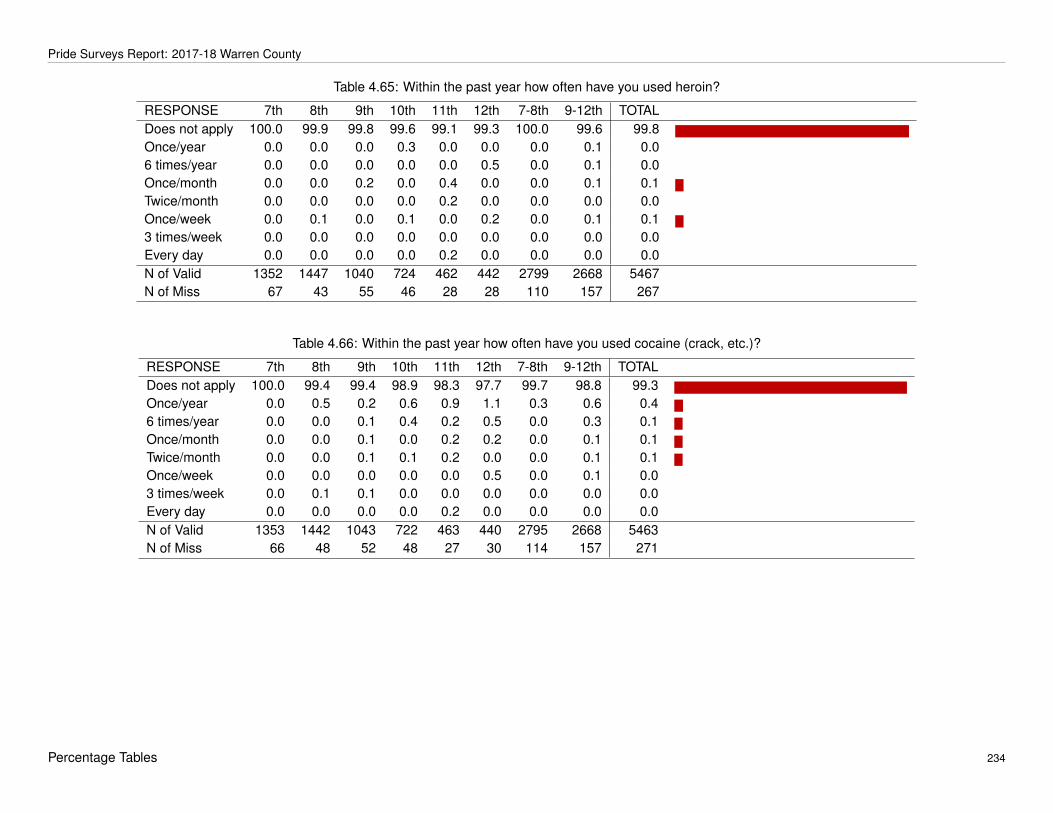
Pride Surveys Report: 2017-18 Warren County
Table 4.65: Within the past year how often have you used heroin?
RESPONSE 7th 8th 9th 10th 11th 12th 7-8th 9-12th TOTALDoes not apply 100.0 99.9 99.8 99.6 99.1 99.3 100.0 99.6 99.8 -Once/year 0.0 0.0 0.0 0.3 0.0 0.0 0.0 0.1 0.06 times/year 0.0 0.0 0.0 0.0 0.0 0.5 0.0 0.1 0.0Once/month 0.0 0.0 0.2 0.0 0.4 0.0 0.0 0.1 0.1 -Twice/month 0.0 0.0 0.0 0.0 0.2 0.0 0.0 0.0 0.0Once/week 0.0 0.1 0.0 0.1 0.0 0.2 0.0 0.1 0.1 -3 times/week 0.0 0.0 0.0 0.0 0.0 0.0 0.0 0.0 0.0Every day 0.0 0.0 0.0 0.0 0.2 0.0 0.0 0.0 0.0N of Valid 1352 1447 1040 724 462 442 2799 2668 5467N of Miss 67 43 55 46 28 28 110 157 267
Table 4.66: Within the past year how often have you used cocaine (crack, etc.)?
RESPONSE 7th 8th 9th 10th 11th 12th 7-8th 9-12th TOTALDoes not apply 100.0 99.4 99.4 98.9 98.3 97.7 99.7 98.8 99.3 -Once/year 0.0 0.5 0.2 0.6 0.9 1.1 0.3 0.6 0.4 -6 times/year 0.0 0.0 0.1 0.4 0.2 0.5 0.0 0.3 0.1 -Once/month 0.0 0.0 0.1 0.0 0.2 0.2 0.0 0.1 0.1 -Twice/month 0.0 0.0 0.1 0.1 0.2 0.0 0.0 0.1 0.1 -Once/week 0.0 0.0 0.0 0.0 0.0 0.5 0.0 0.1 0.03 times/week 0.0 0.1 0.1 0.0 0.0 0.0 0.0 0.0 0.0Every day 0.0 0.0 0.0 0.0 0.2 0.0 0.0 0.0 0.0N of Valid 1353 1442 1043 722 463 440 2795 2668 5463N of Miss 66 48 52 48 27 30 114 157 271
Percentage Tables 234

Pride Surveys Report: 2017-18 Warren County
Table 4.67: Within the past year how often have you used inhalants (glue, gas, etc.)?
RESPONSE 7th 8th 9th 10th 11th 12th 7-8th 9-12th TOTALDoes not apply 99.5 98.6 98.9 98.6 98.5 98.6 99.0 98.7 98.9 -Once/year 0.3 1.0 0.6 1.1 0.7 0.7 0.7 0.7 0.7 -6 times/year 0.1 0.1 0.3 0.1 0.2 0.5 0.1 0.3 0.2 -Once/month 0.0 0.1 0.2 0.1 0.2 0.0 0.0 0.1 0.1 -Twice/month 0.1 0.1 0.0 0.0 0.2 0.2 0.1 0.1 0.1 -Once/week 0.0 0.0 0.0 0.0 0.0 0.0 0.0 0.0 0.03 times/week 0.0 0.0 0.1 0.0 0.0 0.0 0.0 0.0 0.0Every day 0.1 0.1 0.0 0.0 0.2 0.0 0.1 0.0 0.1 -N of Valid 1344 1445 1045 720 460 442 2789 2667 5456N of Miss 75 45 50 50 30 28 120 158 278
Table 4.68: Within the past year how often have you used hallucinogens (PCP, LSD, etc.)?
RESPONSE 7th 8th 9th 10th 11th 12th 7-8th 9-12th TOTALDoes not apply 99.9 99.6 98.5 97.5 97.8 96.1 99.7 97.7 98.8 -Once/year 0.1 0.2 0.6 0.7 1.1 2.5 0.1 1.0 0.6 -6 times/year 0.0 0.0 0.4 0.8 0.2 0.7 0.0 0.5 0.3 -Once/month 0.0 0.1 0.2 0.6 0.4 0.2 0.1 0.3 0.2 -Twice/month 0.0 0.1 0.3 0.1 0.2 0.2 0.0 0.2 0.1 -Once/week 0.0 0.0 0.0 0.0 0.0 0.0 0.0 0.0 0.03 times/week 0.0 0.0 0.1 0.3 0.0 0.0 0.0 0.1 0.1 -Every day 0.0 0.0 0.0 0.0 0.2 0.2 0.0 0.1 0.0N of Valid 1346 1439 1040 717 461 438 2785 2656 5441N of Miss 73 51 55 53 29 32 124 169 293
Percentage Tables 235

Pride Surveys Report: 2017-18 Warren County
Table 4.69: Within the past year how often have you used steroids?
RESPONSE 7th 8th 9th 10th 11th 12th 7-8th 9-12th TOTALDoes not apply 98.4 99.2 99.3 97.7 98.0 98.6 98.8 98.5 98.7 -Once/year 1.1 0.4 0.3 0.8 0.7 0.9 0.8 0.6 0.7 -6 times/year 0.2 0.1 0.0 0.4 0.2 0.2 0.1 0.2 0.2 -Once/month 0.1 0.1 0.1 0.3 0.4 0.2 0.1 0.2 0.1 -Twice/month 0.0 0.1 0.0 0.1 0.0 0.0 0.1 0.0 0.1 -Once/week 0.1 0.0 0.0 0.3 0.2 0.0 0.0 0.1 0.1 -3 times/week 0.0 0.1 0.2 0.1 0.2 0.0 0.0 0.1 0.1 -Every day 0.1 0.0 0.1 0.3 0.2 0.0 0.1 0.1 0.1 -N of Valid 1346 1443 1045 724 460 442 2789 2671 5460N of Miss 73 47 50 46 30 28 120 154 274
Table 4.70: Within the past year how often have you used ecstasy (MDMA)?
RESPONSE 7th 8th 9th 10th 11th 12th 7-8th 9-12th TOTALDoes not apply 99.9 99.7 99.6 98.6 99.1 98.6 99.8 99.1 99.4 -Once/year 0.1 0.2 0.1 0.7 0.2 0.9 0.1 0.4 0.3 -6 times/year 0.0 0.0 0.1 0.1 0.0 0.2 0.0 0.1 0.1 -Once/month 0.0 0.0 0.1 0.1 0.7 0.0 0.0 0.2 0.1 -Twice/month 0.0 0.0 0.1 0.0 0.0 0.0 0.0 0.0 0.0Once/week 0.0 0.1 0.0 0.3 0.0 0.0 0.0 0.1 0.1 -3 times/week 0.0 0.0 0.0 0.1 0.0 0.2 0.0 0.1 0.0Every day 0.1 0.0 0.0 0.0 0.0 0.0 0.0 0.0 0.0N of Valid 1346 1444 1030 725 457 442 2790 2654 5444N of Miss 73 46 65 45 33 28 119 171 290
Percentage Tables 236

Pride Surveys Report: 2017-18 Warren County
Table 4.71: Within the past year how often have you used meth (crystal, ice, crank, etc.)?
RESPONSE 7th 8th 9th 10th 11th 12th 7-8th 9-12th TOTALDoes not apply 99.9 99.7 99.8 99.7 99.1 99.3 99.8 99.6 99.7 -Once/year 0.1 0.2 0.0 0.0 0.2 0.2 0.1 0.1 0.1 -6 times/year 0.0 0.1 0.0 0.1 0.0 0.2 0.0 0.1 0.1 -Once/month 0.0 0.0 0.1 0.0 0.7 0.0 0.0 0.2 0.1 -Twice/month 0.0 0.0 0.1 0.0 0.0 0.0 0.0 0.0 0.0Once/week 0.0 0.0 0.0 0.1 0.0 0.2 0.0 0.1 0.03 times/week 0.0 0.0 0.0 0.0 0.0 0.0 0.0 0.0 0.0Every day 0.0 0.0 0.0 0.0 0.0 0.0 0.0 0.0 0.0N of Valid 1349 1440 1035 724 458 439 2789 2656 5445N of Miss 70 50 60 46 32 31 120 169 289
Table 4.72: Within the past year how often have you ridden in a car with a driver who was drunk?
RESPONSE 7th 8th 9th 10th 11th 12th 7-8th 9-12th TOTALDoes not apply 91.6 85.9 86.4 86.0 84.3 89.3 88.6 86.4 87.6 -Once/year 5.6 9.3 8.4 8.3 8.6 6.2 7.6 8.0 7.8 -6 times/year 0.9 2.4 2.9 2.5 2.6 1.6 1.7 2.5 2.1 -Once/month 0.4 1.0 1.3 1.4 2.8 0.7 0.7 1.5 1.1 -Twice/month 0.8 0.4 0.5 0.8 1.5 0.7 0.6 0.8 0.7 -Once/week 0.4 0.5 0.2 0.7 0.2 1.4 0.5 0.5 0.5 -3 times/week 0.1 0.1 0.2 0.3 0.0 0.0 0.1 0.2 0.1 -Every day 0.1 0.3 0.1 0.0 0.0 0.2 0.3 0.1 0.2 -N of Valid 1348 1444 1040 719 465 438 2792 2662 5454N of Miss 71 46 55 51 25 32 117 163 280
Percentage Tables 237

Pride Surveys Report: 2017-18 Warren County
Table 4.73: Within the past year how often have you ridden in a car with a driver who was high?
RESPONSE 7th 8th 9th 10th 11th 12th 7-8th 9-12th TOTALDoes not apply 96.7 92.0 90.3 83.7 83.1 75.6 94.3 84.8 89.7 -Once/year 1.6 4.9 4.6 6.6 5.8 9.4 3.3 6.2 4.7 -6 times/year 0.4 1.1 1.4 3.7 2.8 4.6 0.8 2.8 1.8 -Once/month 0.2 0.4 1.3 1.9 2.6 1.6 0.3 1.8 1.0 -Twice/month 0.4 0.6 0.9 1.1 1.7 4.1 0.5 1.6 1.0 -Once/week 0.1 0.2 0.9 1.0 1.7 1.6 0.1 1.2 0.6 -3 times/week 0.3 0.3 0.3 1.1 0.9 2.1 0.3 0.9 0.6 -Every day 0.3 0.5 0.3 0.8 1.3 1.1 0.4 0.8 0.6 -N of Valid 1351 1444 1038 723 462 438 2795 2661 5456N of Miss 68 46 57 47 28 32 114 164 278
Table 4.74: Within the past year how often have you driven a car while drunk?
RESPONSE 7th 8th 9th 10th 11th 12th 7-8th 9-12th TOTALDoes not apply 100.0 99.3 98.9 98.8 95.8 94.1 99.6 97.6 98.6 -Once/year 0.0 0.4 0.8 0.7 2.4 3.6 0.2 1.5 0.8 -6 times/year 0.0 0.0 0.1 0.1 0.4 0.7 0.0 0.3 0.1 -Once/month 0.0 0.0 0.1 0.3 0.9 0.0 0.0 0.3 0.1 -Twice/month 0.0 0.1 0.1 0.0 0.2 0.7 0.1 0.2 0.1 -Once/week 0.0 0.1 0.0 0.0 0.0 0.7 0.0 0.1 0.1 -3 times/week 0.0 0.1 0.0 0.1 0.2 0.0 0.0 0.1 0.1 -Every day 0.0 0.0 0.0 0.0 0.0 0.2 0.0 0.0 0.0N of Valid 1352 1447 1033 723 457 443 2799 2656 5455N of Miss 67 43 62 47 33 27 110 169 279
Percentage Tables 238

Pride Surveys Report: 2017-18 Warren County
Table 4.75: Within the past year how often have you driven a car while high?
RESPONSE 7th 8th 9th 10th 11th 12th 7-8th 9-12th TOTALDoes not apply 99.8 99.2 98.5 96.1 91.3 85.5 99.5 94.5 97.0 -Once/year 0.0 0.4 0.7 1.4 3.0 5.2 0.2 2.0 1.1 -6 times/year 0.0 0.0 0.4 0.6 1.7 2.5 0.0 1.0 0.5 -Once/month 0.1 0.1 0.1 0.4 1.7 0.9 0.1 0.6 0.4 -Twice/month 0.1 0.1 0.1 0.3 0.9 1.1 0.1 0.5 0.3 -Once/week 0.0 0.1 0.0 0.3 0.4 1.6 0.1 0.4 0.2 -3 times/week 0.0 0.0 0.1 0.3 0.2 1.4 0.0 0.4 0.2 -Every day 0.0 0.1 0.1 0.7 0.7 1.8 0.0 0.6 0.3 -N of Valid 1349 1447 1030 718 461 441 2796 2650 5446N of Miss 70 43 65 52 29 29 113 175 288
Table 4.76: Within the past year how often have you used any tobacco?
RESPONSE 7th 8th 9th 10th 11th 12th 7-8th 9-12th TOTALDoes not apply 98.3 94.3 90.6 87.5 85.3 74.3 96.3 86.1 91.3 -Once/year 1.1 2.7 4.0 4.2 4.9 10.2 1.9 5.2 3.6 -6 times/year 0.0 0.5 1.6 2.3 2.8 5.3 0.2 2.6 1.4 -Once/month 0.0 0.6 1.1 0.4 2.6 3.1 0.3 1.5 0.9 -Twice/month 0.1 0.4 0.9 1.6 0.9 1.6 0.3 1.2 0.7 -Once/week 0.1 0.8 0.4 1.0 1.3 2.2 0.5 1.0 0.7 -3 times/week 0.2 0.5 0.6 0.7 0.9 1.6 0.4 0.8 0.6 -Every day 0.1 0.2 0.9 2.3 1.5 1.8 0.2 1.5 0.8 -N of Valid 1365 1449 1051 734 470 451 2814 2706 5520N of Miss 54 41 44 36 20 19 95 119 214
Percentage Tables 239

Pride Surveys Report: 2017-18 Warren County
Table 4.77: Within the past year how often have you used any alcohol?
RESPONSE 7th 8th 9th 10th 11th 12th 7-8th 9-12th TOTALDoes not apply 92.2 83.8 76.6 67.0 57.4 47.6 87.8 65.8 77.0 -Once/year 5.4 10.3 12.3 12.8 14.5 12.2 7.9 12.8 10.3 -6 times/year 1.4 2.1 3.9 7.2 9.0 12.9 1.8 7.2 4.4 -Once/month 0.4 1.1 2.5 4.0 5.8 7.1 0.7 4.2 2.4 -Twice/month 0.1 1.2 2.9 5.4 7.9 10.0 0.7 5.7 3.1 -Once/week 0.3 0.8 1.1 1.6 4.7 8.4 0.5 3.1 1.8 -3 times/week 0.2 0.5 0.6 1.4 0.2 1.1 0.4 0.8 0.6 -Every day 0.1 0.2 0.1 0.5 0.6 0.7 0.1 0.4 0.3 -N of Valid 1364 1449 1054 734 469 450 2813 2707 5520N of Miss 55 41 41 36 21 20 96 118 214
Table 4.78: Within the past year how often have you used any illicit drug?
RESPONSE 7th 8th 9th 10th 11th 12th 7-8th 9-12th TOTALDoes not apply 92.4 87.9 85.2 80.1 73.2 67.6 90.1 78.8 84.6 -Once/year 4.3 5.7 4.4 5.6 6.4 7.8 5.0 5.6 5.3 -6 times/year 0.7 1.4 2.6 4.0 5.3 4.7 1.0 3.8 2.4 -Once/month 0.7 1.2 1.1 1.8 3.4 5.1 0.9 2.4 1.6 -Twice/month 0.4 1.7 1.5 2.5 2.5 4.0 1.1 2.4 1.7 -Once/week 0.3 0.8 1.9 1.2 4.7 4.3 0.5 2.6 1.5 -3 times/week 0.2 0.6 1.7 1.8 2.5 2.9 0.4 2.1 1.2 -Every day 1.0 0.8 1.4 3.1 1.9 3.6 0.9 2.3 1.6 -N of Valid 1364 1450 1057 733 471 447 2814 2708 5522N of Miss 55 40 38 37 19 23 95 117 212
Percentage Tables 240
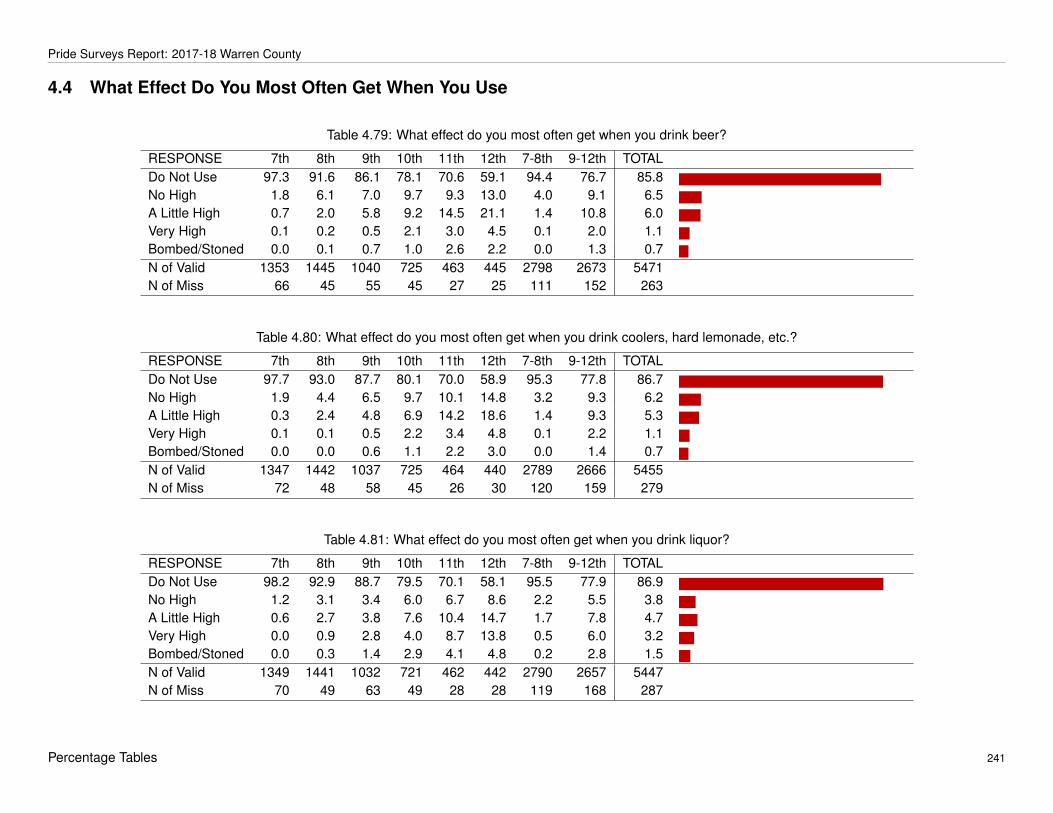
Pride Surveys Report: 2017-18 Warren County
4.4 What Effect Do You Most Often Get When You Use
Table 4.79: What effect do you most often get when you drink beer?
RESPONSE 7th 8th 9th 10th 11th 12th 7-8th 9-12th TOTALDo Not Use 97.3 91.6 86.1 78.1 70.6 59.1 94.4 76.7 85.8 -No High 1.8 6.1 7.0 9.7 9.3 13.0 4.0 9.1 6.5 -A Little High 0.7 2.0 5.8 9.2 14.5 21.1 1.4 10.8 6.0 -Very High 0.1 0.2 0.5 2.1 3.0 4.5 0.1 2.0 1.1 -Bombed/Stoned 0.0 0.1 0.7 1.0 2.6 2.2 0.0 1.3 0.7 -N of Valid 1353 1445 1040 725 463 445 2798 2673 5471N of Miss 66 45 55 45 27 25 111 152 263
Table 4.80: What effect do you most often get when you drink coolers, hard lemonade, etc.?
RESPONSE 7th 8th 9th 10th 11th 12th 7-8th 9-12th TOTALDo Not Use 97.7 93.0 87.7 80.1 70.0 58.9 95.3 77.8 86.7 -No High 1.9 4.4 6.5 9.7 10.1 14.8 3.2 9.3 6.2 -A Little High 0.3 2.4 4.8 6.9 14.2 18.6 1.4 9.3 5.3 -Very High 0.1 0.1 0.5 2.2 3.4 4.8 0.1 2.2 1.1 -Bombed/Stoned 0.0 0.0 0.6 1.1 2.2 3.0 0.0 1.4 0.7 -N of Valid 1347 1442 1037 725 464 440 2789 2666 5455N of Miss 72 48 58 45 26 30 120 159 279
Table 4.81: What effect do you most often get when you drink liquor?
RESPONSE 7th 8th 9th 10th 11th 12th 7-8th 9-12th TOTALDo Not Use 98.2 92.9 88.7 79.5 70.1 58.1 95.5 77.9 86.9 -No High 1.2 3.1 3.4 6.0 6.7 8.6 2.2 5.5 3.8 -A Little High 0.6 2.7 3.8 7.6 10.4 14.7 1.7 7.8 4.7 -Very High 0.0 0.9 2.8 4.0 8.7 13.8 0.5 6.0 3.2 -Bombed/Stoned 0.0 0.3 1.4 2.9 4.1 4.8 0.2 2.8 1.5 -N of Valid 1349 1441 1032 721 462 442 2790 2657 5447N of Miss 70 49 63 49 28 28 119 168 287
Percentage Tables 241
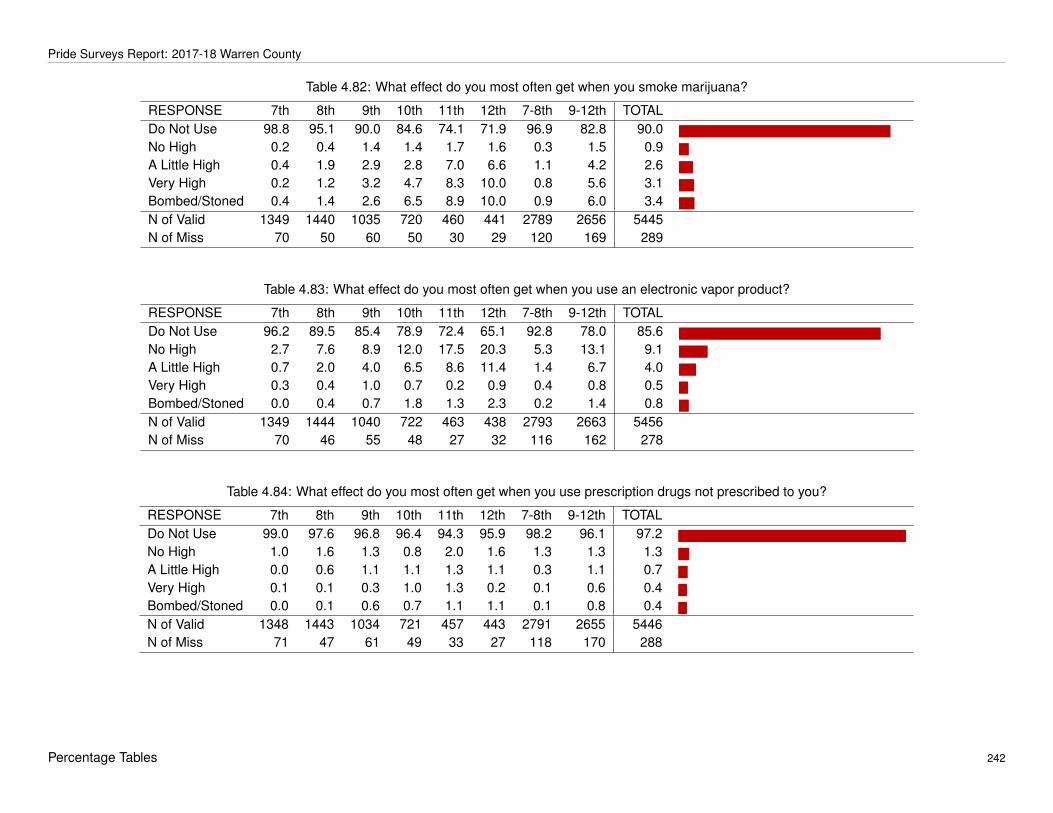
Pride Surveys Report: 2017-18 Warren County
Table 4.82: What effect do you most often get when you smoke marijuana?
RESPONSE 7th 8th 9th 10th 11th 12th 7-8th 9-12th TOTALDo Not Use 98.8 95.1 90.0 84.6 74.1 71.9 96.9 82.8 90.0 -No High 0.2 0.4 1.4 1.4 1.7 1.6 0.3 1.5 0.9 -A Little High 0.4 1.9 2.9 2.8 7.0 6.6 1.1 4.2 2.6 -Very High 0.2 1.2 3.2 4.7 8.3 10.0 0.8 5.6 3.1 -Bombed/Stoned 0.4 1.4 2.6 6.5 8.9 10.0 0.9 6.0 3.4 -N of Valid 1349 1440 1035 720 460 441 2789 2656 5445N of Miss 70 50 60 50 30 29 120 169 289
Table 4.83: What effect do you most often get when you use an electronic vapor product?
RESPONSE 7th 8th 9th 10th 11th 12th 7-8th 9-12th TOTALDo Not Use 96.2 89.5 85.4 78.9 72.4 65.1 92.8 78.0 85.6 -No High 2.7 7.6 8.9 12.0 17.5 20.3 5.3 13.1 9.1 -A Little High 0.7 2.0 4.0 6.5 8.6 11.4 1.4 6.7 4.0 -Very High 0.3 0.4 1.0 0.7 0.2 0.9 0.4 0.8 0.5 -Bombed/Stoned 0.0 0.4 0.7 1.8 1.3 2.3 0.2 1.4 0.8 -N of Valid 1349 1444 1040 722 463 438 2793 2663 5456N of Miss 70 46 55 48 27 32 116 162 278
Table 4.84: What effect do you most often get when you use prescription drugs not prescribed to you?
RESPONSE 7th 8th 9th 10th 11th 12th 7-8th 9-12th TOTALDo Not Use 99.0 97.6 96.8 96.4 94.3 95.9 98.2 96.1 97.2 -No High 1.0 1.6 1.3 0.8 2.0 1.6 1.3 1.3 1.3 -A Little High 0.0 0.6 1.1 1.1 1.3 1.1 0.3 1.1 0.7 -Very High 0.1 0.1 0.3 1.0 1.3 0.2 0.1 0.6 0.4 -Bombed/Stoned 0.0 0.1 0.6 0.7 1.1 1.1 0.1 0.8 0.4 -N of Valid 1348 1443 1034 721 457 443 2791 2655 5446N of Miss 71 47 61 49 33 27 118 170 288
Percentage Tables 242

Pride Surveys Report: 2017-18 Warren County
Table 4.85: What effect do you most often get when you use other illicit drugs?
RESPONSE 7th 8th 9th 10th 11th 12th 7-8th 9-12th TOTALDo Not Use 99.6 99.0 98.5 97.4 96.9 96.8 99.3 97.7 98.5 -No High 0.2 0.5 0.7 0.6 0.9 0.5 0.4 0.6 0.5 -A Little High 0.0 0.3 0.1 0.4 0.4 0.2 0.2 0.3 0.2 -Very High 0.1 0.1 0.4 0.6 0.9 1.1 0.1 0.6 0.3 -Bombed/Stoned 0.1 0.1 0.3 1.1 0.9 1.4 0.1 0.8 0.4 -N of Valid 1348 1442 1029 719 454 441 2790 2643 5433N of Miss 71 48 66 51 36 29 119 182 301
4.5 During the Past 30 Days?
Table 4.86: During the past 30 days did you drink one or more drinks of an alcoholic beverage?
RESPONSE 7th 8th 9th 10th 11th 12th 7-8th 9-12th TOTALYes 3.0 6.2 10.7 16.2 23.2 32.5 4.6 18.0 11.2 -No 97.0 93.8 89.3 83.8 76.8 67.5 95.4 82.0 88.8 -N of Valid 1341 1438 1021 720 457 440 2779 2638 5417N of Miss 78 52 74 50 33 30 130 187 317
Table 4.87: During the past 30 days did you smoke part or all of a cigarette?
RESPONSE 7th 8th 9th 10th 11th 12th 7-8th 9-12th TOTALYes 0.8 3.2 4.6 4.9 6.2 7.3 2.1 5.4 3.7 -No 99.2 96.8 95.4 95.1 93.8 92.7 97.9 94.6 96.3 -N of Valid 1342 1435 1015 718 455 439 2777 2627 5404N of Miss 77 55 80 52 35 31 132 198 330
Table 4.88: During the past 30 days have you used marijuana or hashish?
RESPONSE 7th 8th 9th 10th 11th 12th 7-8th 9-12th TOTALYes 0.9 3.3 5.7 9.9 17.0 20.1 2.1 11.2 6.5 -No 99.1 96.7 94.3 90.1 83.0 79.9 97.9 88.8 93.5 -N of Valid 1339 1429 1000 707 452 438 2768 2597 5365N of Miss 80 61 95 63 38 32 141 228 369
Percentage Tables 243

Pride Surveys Report: 2017-18 Warren County
Table 4.89: During the past 30 days have you used prescription drugs not prescribed to you?
RESPONSE 7th 8th 9th 10th 11th 12th 7-8th 9-12th TOTALYes 1.2 2.3 2.1 2.3 2.5 3.7 1.8 2.5 2.1 -No 98.8 97.7 97.9 97.7 97.5 96.3 98.2 97.5 97.9 -N of Valid 1339 1435 1007 708 447 436 2774 2598 5372N of Miss 80 55 88 62 43 34 135 227 362
Table 4.90: During the past 30 days have you used other illicit drugs?
RESPONSE 7th 8th 9th 10th 11th 12th 7-8th 9-12th TOTALYes 0.2 0.3 0.8 1.4 0.4 1.9 0.3 1.1 0.7 -No 99.8 99.7 99.2 98.6 99.6 98.1 99.7 98.9 99.3 -N of Valid 1338 1432 995 713 448 431 2770 2587 5357N of Miss 81 58 100 57 42 39 139 238 377
Table 4.91: During the past 30 days have you used an electronic vapor product?
RESPONSE 7th 8th 9th 10th 11th 12th 7-8th 9-12th TOTALYes 3.6 8.3 14.3 18.0 24.1 30.4 6.0 19.7 12.7 -No 96.4 91.7 85.7 82.0 75.9 69.6 94.0 80.3 87.3 -N of Valid 1337 1430 1006 713 452 434 2767 2605 5372N of Miss 82 60 89 57 38 36 142 220 362
Percentage Tables 244

Pride Surveys Report: 2017-18 Warren County
4.6 Do You Feel The Following Are Harmful To Your Health?
Table 4.92: Do you feel smoking cigarettes is harmful to your health?
RESPONSE 7th 8th 9th 10th 11th 12th 7-8th 9-12th TOTALNo harm 9.4 7.0 4.2 4.5 3.9 4.8 8.1 4.3 6.3 -Some harm 4.2 5.2 5.7 5.2 5.0 3.0 4.7 5.0 4.8 -Harmful 22.7 23.4 23.1 22.0 23.3 19.2 23.1 22.2 22.6 -Very harmful 63.8 64.3 67.0 68.3 67.8 73.1 64.1 68.5 66.2 -N of Valid 1320 1433 1022 710 460 438 2753 2630 5383N of Miss 99 57 73 60 30 32 156 195 351
Table 4.93: Do you feel using smokeless tobacco is harmful to your health?
RESPONSE 7th 8th 9th 10th 11th 12th 7-8th 9-12th TOTALNo harm 10.1 8.1 4.9 6.2 4.8 5.9 9.1 5.4 7.3 -Some harm 11.9 11.8 12.0 11.3 12.1 9.8 11.9 11.5 11.7 -Harmful 24.9 29.9 30.9 28.1 27.9 26.5 27.5 28.9 28.2 -Very harmful 53.0 50.2 52.2 54.4 55.2 57.8 51.6 54.3 52.9 -N of Valid 1312 1421 1011 708 462 438 2733 2619 5352N of Miss 107 69 84 62 28 32 176 206 382
Table 4.94: Do you feel smoking cigars is harmful to your health?
RESPONSE 7th 8th 9th 10th 11th 12th 7-8th 9-12th TOTALNo harm 9.9 8.0 5.3 6.0 4.2 7.9 8.9 5.7 7.3 -Some harm 9.4 11.0 13.1 13.6 14.9 15.5 10.2 14.0 12.1 -Harmful 24.1 28.9 27.3 27.9 28.1 26.9 26.6 27.5 27.1 -Very harmful 56.6 52.1 54.3 52.5 52.8 49.8 54.3 52.8 53.5 -N of Valid 1303 1419 999 705 449 432 2722 2585 5307N of Miss 116 71 96 65 41 38 187 240 427
Percentage Tables 245
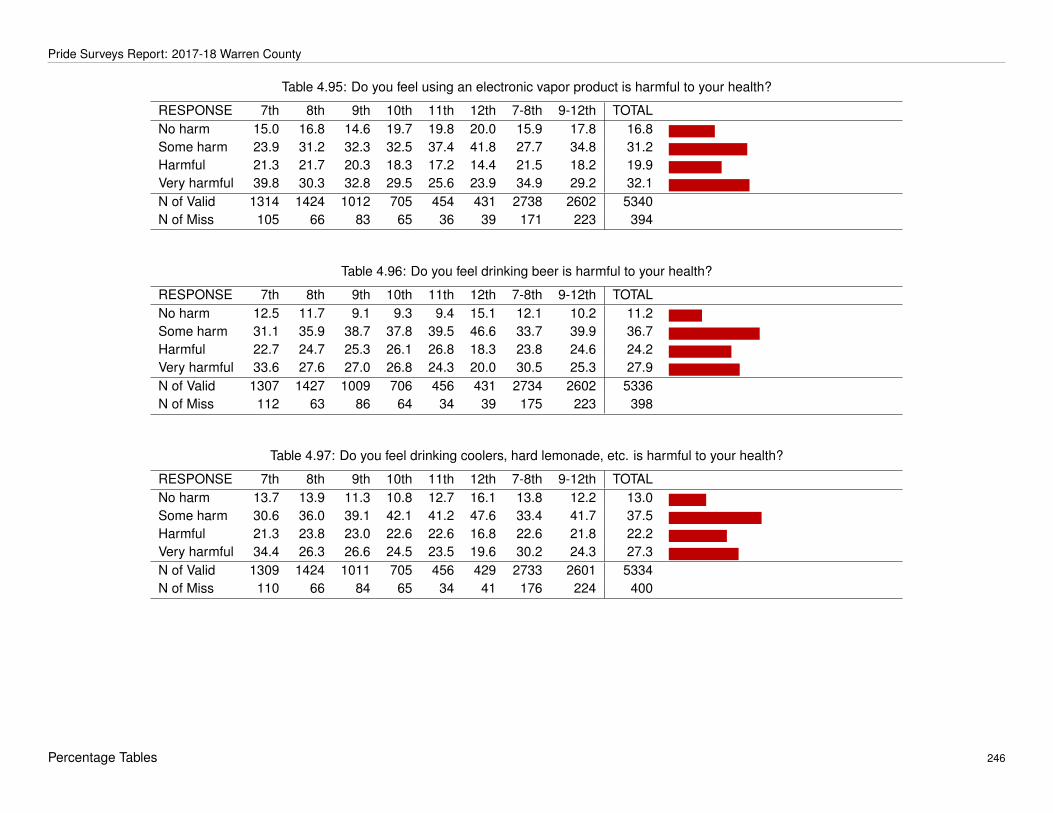
Pride Surveys Report: 2017-18 Warren County
Table 4.95: Do you feel using an electronic vapor product is harmful to your health?
RESPONSE 7th 8th 9th 10th 11th 12th 7-8th 9-12th TOTALNo harm 15.0 16.8 14.6 19.7 19.8 20.0 15.9 17.8 16.8 -Some harm 23.9 31.2 32.3 32.5 37.4 41.8 27.7 34.8 31.2 -Harmful 21.3 21.7 20.3 18.3 17.2 14.4 21.5 18.2 19.9 -Very harmful 39.8 30.3 32.8 29.5 25.6 23.9 34.9 29.2 32.1 -N of Valid 1314 1424 1012 705 454 431 2738 2602 5340N of Miss 105 66 83 65 36 39 171 223 394
Table 4.96: Do you feel drinking beer is harmful to your health?
RESPONSE 7th 8th 9th 10th 11th 12th 7-8th 9-12th TOTALNo harm 12.5 11.7 9.1 9.3 9.4 15.1 12.1 10.2 11.2 -Some harm 31.1 35.9 38.7 37.8 39.5 46.6 33.7 39.9 36.7 -Harmful 22.7 24.7 25.3 26.1 26.8 18.3 23.8 24.6 24.2 -Very harmful 33.6 27.6 27.0 26.8 24.3 20.0 30.5 25.3 27.9 -N of Valid 1307 1427 1009 706 456 431 2734 2602 5336N of Miss 112 63 86 64 34 39 175 223 398
Table 4.97: Do you feel drinking coolers, hard lemonade, etc. is harmful to your health?
RESPONSE 7th 8th 9th 10th 11th 12th 7-8th 9-12th TOTALNo harm 13.7 13.9 11.3 10.8 12.7 16.1 13.8 12.2 13.0 -Some harm 30.6 36.0 39.1 42.1 41.2 47.6 33.4 41.7 37.5 -Harmful 21.3 23.8 23.0 22.6 22.6 16.8 22.6 21.8 22.2 -Very harmful 34.4 26.3 26.6 24.5 23.5 19.6 30.2 24.3 27.3 -N of Valid 1309 1424 1011 705 456 429 2733 2601 5334N of Miss 110 66 84 65 34 41 176 224 400
Percentage Tables 246

Pride Surveys Report: 2017-18 Warren County
Table 4.98: Do you feel drinking liquor is harmful to your health?
RESPONSE 7th 8th 9th 10th 11th 12th 7-8th 9-12th TOTALNo harm 11.1 9.2 6.7 8.5 7.9 12.8 10.1 8.4 9.3 -Some harm 22.4 29.1 30.0 29.2 32.2 38.7 25.9 31.6 28.6 -Harmful 26.3 29.3 28.6 31.1 31.3 24.2 27.9 29.0 28.4 -Very harmful 40.2 32.5 34.8 31.2 28.6 24.2 36.2 31.0 33.7 -N of Valid 1314 1428 1005 705 454 429 2742 2593 5335N of Miss 105 62 90 65 36 41 167 232 399
Table 4.99: Do you feel smoking marijuana is harmful to your health?
RESPONSE 7th 8th 9th 10th 11th 12th 7-8th 9-12th TOTALNo harm 12.6 13.9 14.4 20.6 25.3 29.6 13.3 20.5 16.8 -Some harm 6.1 14.9 17.3 22.4 26.6 28.2 10.7 22.1 16.3 -Harmful 14.6 19.6 19.9 18.1 17.4 14.8 17.2 18.1 17.6 -Very harmful 66.6 51.5 48.5 38.9 30.8 27.5 58.8 39.3 49.3 -N of Valid 1313 1421 1007 709 455 433 2734 2604 5338N of Miss 106 69 88 61 35 37 175 221 396
Table 4.100: Do you feel using synthetic marijuana is harmful to your health?
RESPONSE 7th 8th 9th 10th 11th 12th 7-8th 9-12th TOTALNo harm 11.7 10.1 10.0 13.0 13.2 15.2 10.9 12.3 11.5 -Some harm 6.7 13.8 15.5 17.1 23.3 22.9 10.4 18.5 14.4 -Harmful 16.3 23.5 23.1 22.0 22.9 23.4 20.0 22.8 21.4 -Very harmful 65.3 52.7 51.4 47.9 40.7 38.6 58.7 46.4 52.7 -N of Valid 1305 1420 996 706 455 428 2725 2585 5310N of Miss 114 70 99 64 35 42 184 240 424
Percentage Tables 247
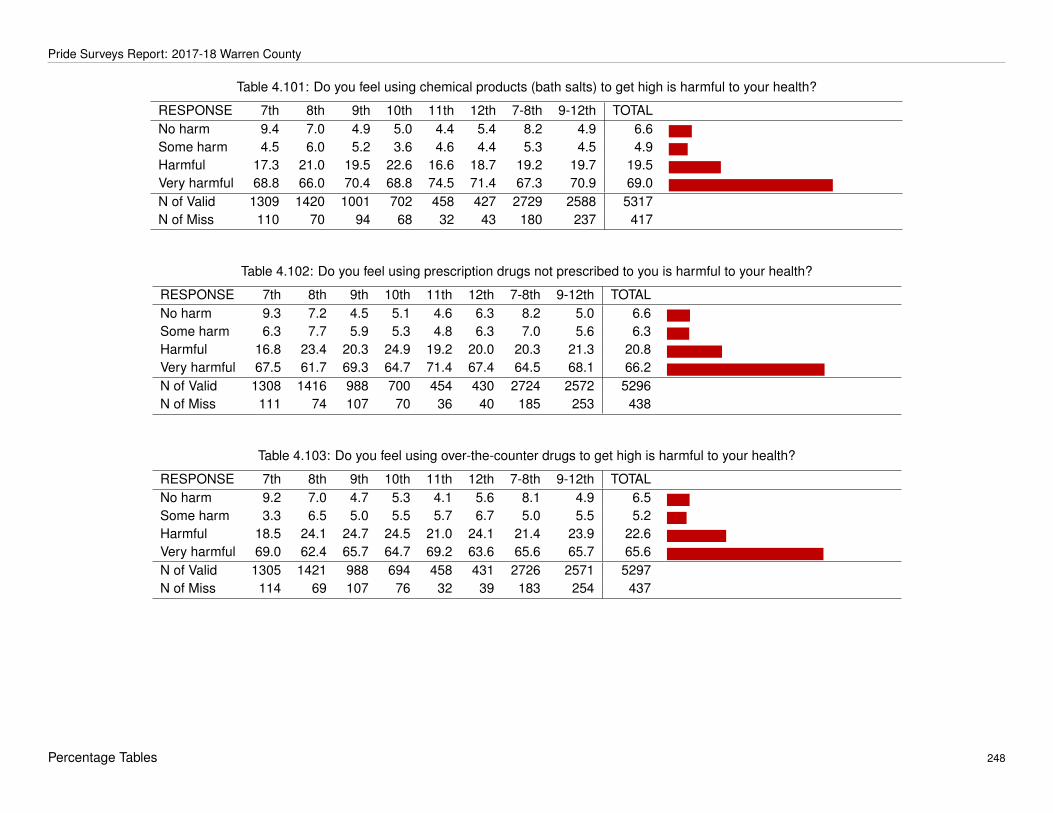
Pride Surveys Report: 2017-18 Warren County
Table 4.101: Do you feel using chemical products (bath salts) to get high is harmful to your health?
RESPONSE 7th 8th 9th 10th 11th 12th 7-8th 9-12th TOTALNo harm 9.4 7.0 4.9 5.0 4.4 5.4 8.2 4.9 6.6 -Some harm 4.5 6.0 5.2 3.6 4.6 4.4 5.3 4.5 4.9 -Harmful 17.3 21.0 19.5 22.6 16.6 18.7 19.2 19.7 19.5 -Very harmful 68.8 66.0 70.4 68.8 74.5 71.4 67.3 70.9 69.0 -N of Valid 1309 1420 1001 702 458 427 2729 2588 5317N of Miss 110 70 94 68 32 43 180 237 417
Table 4.102: Do you feel using prescription drugs not prescribed to you is harmful to your health?
RESPONSE 7th 8th 9th 10th 11th 12th 7-8th 9-12th TOTALNo harm 9.3 7.2 4.5 5.1 4.6 6.3 8.2 5.0 6.6 -Some harm 6.3 7.7 5.9 5.3 4.8 6.3 7.0 5.6 6.3 -Harmful 16.8 23.4 20.3 24.9 19.2 20.0 20.3 21.3 20.8 -Very harmful 67.5 61.7 69.3 64.7 71.4 67.4 64.5 68.1 66.2 -N of Valid 1308 1416 988 700 454 430 2724 2572 5296N of Miss 111 74 107 70 36 40 185 253 438
Table 4.103: Do you feel using over-the-counter drugs to get high is harmful to your health?
RESPONSE 7th 8th 9th 10th 11th 12th 7-8th 9-12th TOTALNo harm 9.2 7.0 4.7 5.3 4.1 5.6 8.1 4.9 6.5 -Some harm 3.3 6.5 5.0 5.5 5.7 6.7 5.0 5.5 5.2 -Harmful 18.5 24.1 24.7 24.5 21.0 24.1 21.4 23.9 22.6 -Very harmful 69.0 62.4 65.7 64.7 69.2 63.6 65.6 65.7 65.6 -N of Valid 1305 1421 988 694 458 431 2726 2571 5297N of Miss 114 69 107 76 32 39 183 254 437
Percentage Tables 248
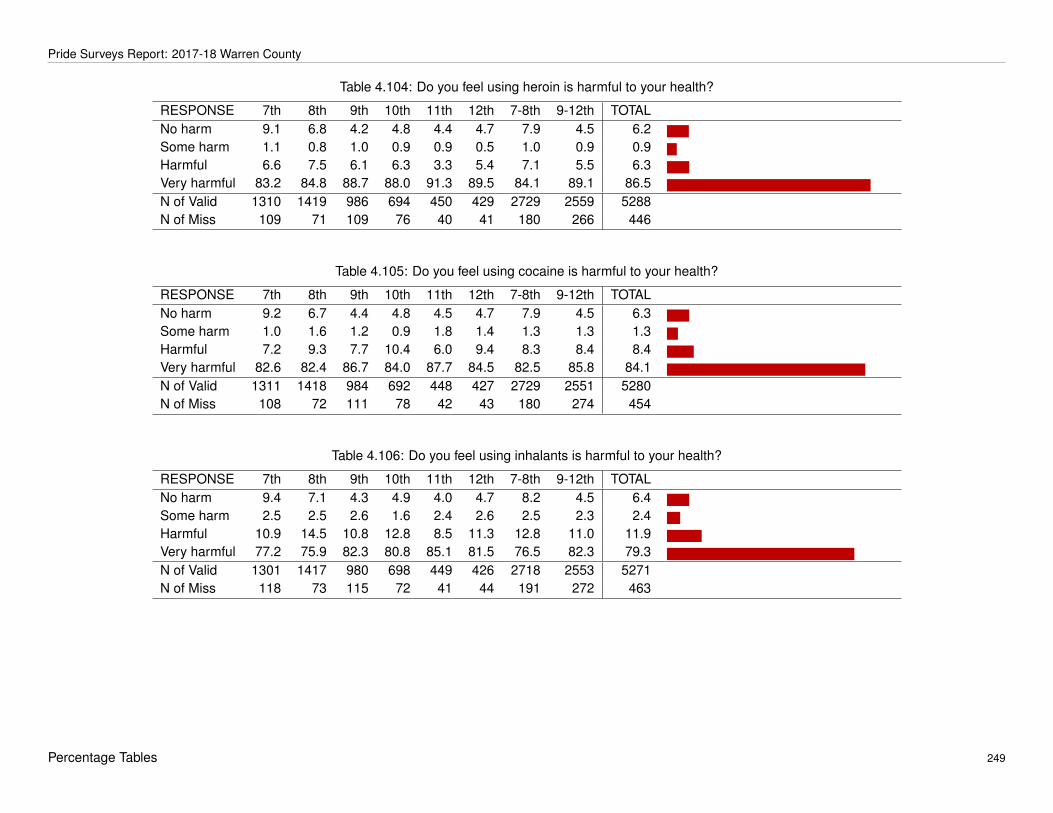
Pride Surveys Report: 2017-18 Warren County
Table 4.104: Do you feel using heroin is harmful to your health?
RESPONSE 7th 8th 9th 10th 11th 12th 7-8th 9-12th TOTALNo harm 9.1 6.8 4.2 4.8 4.4 4.7 7.9 4.5 6.2 -Some harm 1.1 0.8 1.0 0.9 0.9 0.5 1.0 0.9 0.9 -Harmful 6.6 7.5 6.1 6.3 3.3 5.4 7.1 5.5 6.3 -Very harmful 83.2 84.8 88.7 88.0 91.3 89.5 84.1 89.1 86.5 -N of Valid 1310 1419 986 694 450 429 2729 2559 5288N of Miss 109 71 109 76 40 41 180 266 446
Table 4.105: Do you feel using cocaine is harmful to your health?
RESPONSE 7th 8th 9th 10th 11th 12th 7-8th 9-12th TOTALNo harm 9.2 6.7 4.4 4.8 4.5 4.7 7.9 4.5 6.3 -Some harm 1.0 1.6 1.2 0.9 1.8 1.4 1.3 1.3 1.3 -Harmful 7.2 9.3 7.7 10.4 6.0 9.4 8.3 8.4 8.4 -Very harmful 82.6 82.4 86.7 84.0 87.7 84.5 82.5 85.8 84.1 -N of Valid 1311 1418 984 692 448 427 2729 2551 5280N of Miss 108 72 111 78 42 43 180 274 454
Table 4.106: Do you feel using inhalants is harmful to your health?
RESPONSE 7th 8th 9th 10th 11th 12th 7-8th 9-12th TOTALNo harm 9.4 7.1 4.3 4.9 4.0 4.7 8.2 4.5 6.4 -Some harm 2.5 2.5 2.6 1.6 2.4 2.6 2.5 2.3 2.4 -Harmful 10.9 14.5 10.8 12.8 8.5 11.3 12.8 11.0 11.9 -Very harmful 77.2 75.9 82.3 80.8 85.1 81.5 76.5 82.3 79.3 -N of Valid 1301 1417 980 698 449 426 2718 2553 5271N of Miss 118 73 115 72 41 44 191 272 463
Percentage Tables 249
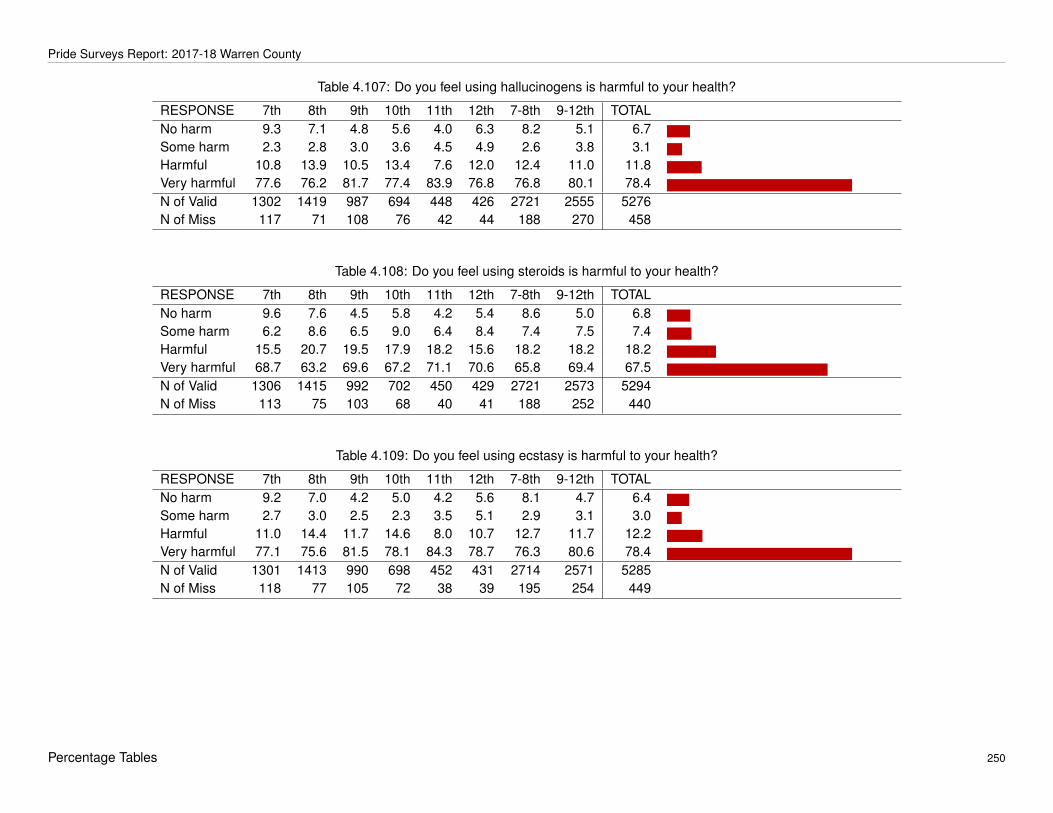
Pride Surveys Report: 2017-18 Warren County
Table 4.107: Do you feel using hallucinogens is harmful to your health?
RESPONSE 7th 8th 9th 10th 11th 12th 7-8th 9-12th TOTALNo harm 9.3 7.1 4.8 5.6 4.0 6.3 8.2 5.1 6.7 -Some harm 2.3 2.8 3.0 3.6 4.5 4.9 2.6 3.8 3.1 -Harmful 10.8 13.9 10.5 13.4 7.6 12.0 12.4 11.0 11.8 -Very harmful 77.6 76.2 81.7 77.4 83.9 76.8 76.8 80.1 78.4 -N of Valid 1302 1419 987 694 448 426 2721 2555 5276N of Miss 117 71 108 76 42 44 188 270 458
Table 4.108: Do you feel using steroids is harmful to your health?
RESPONSE 7th 8th 9th 10th 11th 12th 7-8th 9-12th TOTALNo harm 9.6 7.6 4.5 5.8 4.2 5.4 8.6 5.0 6.8 -Some harm 6.2 8.6 6.5 9.0 6.4 8.4 7.4 7.5 7.4 -Harmful 15.5 20.7 19.5 17.9 18.2 15.6 18.2 18.2 18.2 -Very harmful 68.7 63.2 69.6 67.2 71.1 70.6 65.8 69.4 67.5 -N of Valid 1306 1415 992 702 450 429 2721 2573 5294N of Miss 113 75 103 68 40 41 188 252 440
Table 4.109: Do you feel using ecstasy is harmful to your health?
RESPONSE 7th 8th 9th 10th 11th 12th 7-8th 9-12th TOTALNo harm 9.2 7.0 4.2 5.0 4.2 5.6 8.1 4.7 6.4 -Some harm 2.7 3.0 2.5 2.3 3.5 5.1 2.9 3.1 3.0 -Harmful 11.0 14.4 11.7 14.6 8.0 10.7 12.7 11.7 12.2 -Very harmful 77.1 75.6 81.5 78.1 84.3 78.7 76.3 80.6 78.4 -N of Valid 1301 1413 990 698 452 431 2714 2571 5285N of Miss 118 77 105 72 38 39 195 254 449
Percentage Tables 250

Pride Surveys Report: 2017-18 Warren County
Table 4.110: Do you feel using meth is harmful to your health?
RESPONSE 7th 8th 9th 10th 11th 12th 7-8th 9-12th TOTALNo harm 9.2 6.8 4.2 4.5 4.0 4.7 7.9 4.3 6.2 -Some harm 1.4 1.1 1.0 0.6 0.9 0.7 1.2 0.8 1.0 -Harmful 7.3 10.1 6.4 8.2 4.3 5.1 8.7 6.3 7.6 -Very harmful 82.2 82.1 88.3 86.8 90.8 89.5 82.1 88.5 85.2 -N of Valid 1306 1421 978 696 447 429 2727 2550 5277N of Miss 113 69 117 74 43 41 182 275 457
Percentage Tables 251

Pride Surveys Report: 2017-18 Warren County
4.7 How Much Do You Think People Risk Harming Themselves Physically Or In Other Ways If They
Table 4.111: How much do you think people risk harming themselves physically or in other ways if they use any alcohol?
RESPONSE 7th 8th 9th 10th 11th 12th 7-8th 9-12th TOTALNo risk 9.1 6.8 4.8 5.5 6.8 11.8 7.9 6.5 7.2 -Slight risk 30.7 35.0 35.7 35.8 42.0 40.0 32.9 37.5 35.2 -Moderate risk 33.9 36.8 36.8 35.5 30.9 28.2 35.4 34.0 34.7 -Great risk 26.2 21.4 22.7 23.2 20.3 20.1 23.7 22.0 22.9 -N of Valid 1308 1424 1018 704 459 433 2732 2614 5346N of Miss 111 66 77 66 31 37 177 211 388
Table 4.112: How much do you think people risk harming themselves physically or in other ways if they have five or more drinksof an alcoholic beverage once or twice a week?
RESPONSE 7th 8th 9th 10th 11th 12th 7-8th 9-12th TOTALNo risk 8.6 5.6 4.9 4.6 4.6 7.2 7.0 5.1 6.1 -Slight risk 13.1 16.5 15.0 13.8 16.7 19.5 14.9 15.7 15.3 -Moderate risk 34.3 37.7 34.4 36.6 38.5 36.5 36.1 36.1 36.1 -Great risk 44.0 40.2 45.7 45.1 40.1 36.7 42.0 43.1 42.5 -N of Valid 1309 1420 1008 697 454 430 2729 2589 5318N of Miss 110 70 87 73 36 40 180 236 416
Table 4.113: How much do you think people risk harming themselves physically or in other ways if they take one or two drinks ofan alcoholic beverage nearly every day?
RESPONSE 7th 8th 9th 10th 11th 12th 7-8th 9-12th TOTALNo risk 9.2 7.4 5.9 5.8 5.6 7.2 8.3 6.0 7.2 -Slight risk 14.2 17.2 16.9 15.4 13.1 16.0 15.8 15.7 15.7 -Moderate risk 30.0 30.9 30.0 31.7 33.4 27.6 30.5 30.7 30.6 -Great risk 46.6 44.5 47.1 47.1 47.9 49.2 45.5 47.6 46.5 -N of Valid 1307 1418 1012 694 449 431 2725 2586 5311N of Miss 112 72 83 76 41 39 184 239 423
Percentage Tables 252

Pride Surveys Report: 2017-18 Warren County
Table 4.114: How much do you think people risk harming themselves physically or in other ways if they use any tobacco?
RESPONSE 7th 8th 9th 10th 11th 12th 7-8th 9-12th TOTALNo risk 7.9 6.4 4.9 7.1 9.5 9.9 7.2 7.1 7.1 -Slight risk 14.9 18.5 20.5 23.9 24.1 27.1 16.7 23.1 19.8 -Moderate risk 30.0 35.1 33.9 31.0 32.7 31.1 32.6 32.4 32.5 -Great risk 47.2 40.0 40.7 38.0 33.8 32.0 43.5 37.3 40.5 -N of Valid 1310 1414 991 690 444 425 2724 2550 5274N of Miss 109 76 104 80 46 45 185 275 460
Table 4.115: How much do you think people risk harming themselves physically or in other ways if they smoke one or more packsof cigarettes per day?
RESPONSE 7th 8th 9th 10th 11th 12th 7-8th 9-12th TOTALNo risk 7.2 4.9 3.1 4.9 6.2 6.4 6.0 4.7 5.4 -Slight risk 4.3 6.0 6.4 5.1 7.1 7.1 5.2 6.3 5.7 -Moderate risk 13.2 16.6 16.6 19.3 20.8 19.5 15.0 18.6 16.7 -Great risk 75.3 72.6 73.8 70.7 65.9 67.1 73.9 70.5 72.2 -N of Valid 1306 1422 994 689 452 425 2728 2560 5288N of Miss 113 68 101 81 38 45 181 265 446
Table 4.116: How much do you think people risk harming themselves physically or in other ways if they use electronic vaporproducts?
RESPONSE 7th 8th 9th 10th 11th 12th 7-8th 9-12th TOTALNo risk 13.6 17.1 16.4 20.3 26.8 25.1 15.4 20.7 18.0 -Slight risk 23.8 31.7 34.7 33.8 38.4 40.5 27.9 36.1 31.9 -Moderate risk 28.0 26.3 24.2 19.0 16.7 14.4 27.1 19.9 23.6 -Great risk 34.6 24.9 24.7 26.9 18.1 20.0 29.5 23.3 26.5 -N of Valid 1303 1418 1005 689 448 430 2721 2572 5293N of Miss 116 72 90 81 42 40 188 253 441
Percentage Tables 253

Pride Surveys Report: 2017-18 Warren County
Table 4.117: How much do you think people risk harming themselves physically or in other ways if they smoke marijuana once ortwice a week?
RESPONSE 7th 8th 9th 10th 11th 12th 7-8th 9-12th TOTALNo risk 10.0 10.8 12.0 15.8 22.8 23.4 10.4 16.8 13.5 -Slight risk 7.0 15.4 17.7 22.5 25.9 29.4 11.4 22.4 16.7 -Moderate risk 19.7 24.5 27.1 22.2 24.6 21.5 22.2 24.4 23.3 -Great risk 63.2 49.2 43.3 39.4 26.8 25.7 55.9 36.4 46.5 -N of Valid 1308 1418 994 688 448 428 2726 2558 5284N of Miss 111 72 101 82 42 42 183 267 450
Table 4.118: How much do you think people risk harming themselves physically or in other ways if they use prescription drugsthat are not prescribed to them?
RESPONSE 7th 8th 9th 10th 11th 12th 7-8th 9-12th TOTALNo risk 7.4 4.4 2.7 4.1 3.4 4.7 5.8 3.5 4.7 -Slight risk 8.0 9.7 7.7 7.2 7.7 9.4 8.9 7.9 8.4 -Moderate risk 22.3 23.5 21.0 23.3 24.1 25.6 22.9 22.9 22.9 -Great risk 62.3 62.4 68.6 65.4 64.8 60.3 62.4 65.7 64.0 -N of Valid 1306 1421 990 690 440 426 2727 2546 5273N of Miss 113 69 105 80 50 44 182 279 461
Table 4.119: How much do you think people risk harming themselves physically or in other ways if they use illicit drugs?
RESPONSE 7th 8th 9th 10th 11th 12th 7-8th 9-12th TOTALNo risk 7.2 4.2 3.0 3.3 3.6 3.8 5.6 3.3 4.5 -Slight risk 3.9 5.2 4.9 4.3 4.1 4.7 4.6 4.6 4.6 -Moderate risk 16.4 18.2 16.1 17.8 15.2 18.7 17.3 16.8 17.1 -Great risk 72.6 72.3 76.1 74.5 77.1 72.8 72.4 75.3 73.8 -N of Valid 1298 1413 978 690 441 423 2711 2532 5243N of Miss 121 77 117 80 49 47 198 293 491
Percentage Tables 254

Pride Surveys Report: 2017-18 Warren County
Table 4.120: How much do you think people risk harming themselves physically or in other ways if they drive while drunk?
RESPONSE 7th 8th 9th 10th 11th 12th 7-8th 9-12th TOTALNo risk 6.9 4.1 2.1 3.0 2.8 3.3 5.4 2.7 4.1 -Slight risk 1.3 1.3 2.2 1.6 2.5 1.9 1.3 2.1 1.7 -Moderate risk 5.2 6.5 6.2 7.0 7.3 5.5 5.9 6.5 6.2 -Great risk 86.6 88.1 89.4 88.4 87.4 89.3 87.4 88.8 88.1 -N of Valid 1309 1421 981 690 436 422 2730 2529 5259N of Miss 110 69 114 80 54 48 179 296 475
Table 4.121: How much do you think people risk harming themselves physically or in other ways if they drive while high?
RESPONSE 7th 8th 9th 10th 11th 12th 7-8th 9-12th TOTALNo risk 6.9 4.9 2.8 4.3 5.5 6.2 5.9 4.2 5.1 -Slight risk 1.3 2.5 3.7 6.9 8.2 10.9 1.9 6.6 4.2 -Moderate risk 7.5 9.3 9.5 11.0 15.0 15.7 8.4 11.9 10.1 -Great risk 84.3 83.3 84.1 77.7 71.4 67.2 83.8 77.3 80.7 -N of Valid 1302 1420 972 691 440 421 2722 2524 5246N of Miss 117 70 123 79 50 49 187 301 488
Percentage Tables 255

Pride Surveys Report: 2017-18 Warren County
4.8 How Easy Is It To Get
Table 4.122: How easy is it to get cigarettes, smokeless tobacco, cigars, etc.?
RESPONSE 7th 8th 9th 10th 11th 12th 7-8th 9-12th TOTALDon’t know/can’t get 70.0 57.7 54.9 45.4 45.6 31.9 63.6 46.9 55.4 -Very difficult 2.6 3.4 2.4 1.8 1.7 1.6 3.0 2.0 2.5 -Fairly difficult 4.2 6.7 8.4 9.9 6.9 3.4 5.5 7.7 6.6 -Fairly easy 11.2 15.9 18.2 23.3 21.3 20.9 13.7 20.6 17.1 -Very easy 11.9 16.3 16.0 19.6 24.5 42.2 14.2 22.8 18.4 -N of Valid 1302 1421 1031 709 465 436 2723 2641 5364N of Miss 117 69 64 61 25 34 186 184 370
Table 4.123: How easy is it to get electronic vapor products?
RESPONSE 7th 8th 9th 10th 11th 12th 7-8th 9-12th TOTALDon’t know/can’t get 70.6 56.3 49.6 40.9 36.8 28.2 63.2 41.5 52.5 -Very difficult 3.2 4.2 2.1 1.1 1.1 1.8 3.7 1.6 2.7 -Fairly difficult 4.9 8.7 7.6 8.2 6.9 3.2 6.9 6.9 6.9 -Fairly easy 12.2 17.9 20.7 21.7 23.1 19.0 15.2 21.1 18.1 -Very easy 9.1 12.9 19.9 28.0 32.1 47.7 11.1 28.8 19.8 -N of Valid 1300 1420 1028 704 467 436 2720 2635 5355N of Miss 119 70 67 66 23 34 189 190 379
Table 4.124: How easy is it to get beer, wine, liquor and other alcohol products?
RESPONSE 7th 8th 9th 10th 11th 12th 7-8th 9-12th TOTALDon’t know/can’t get 65.4 51.1 45.4 38.8 34.2 25.3 58.0 38.3 48.3 -Very difficult 3.1 5.4 3.0 3.3 2.8 4.4 4.3 3.3 3.8 -Fairly difficult 6.1 10.4 11.7 11.2 14.4 12.2 8.3 12.1 10.2 -Fairly easy 11.4 16.4 18.3 25.0 22.6 26.4 14.0 22.2 18.0 -Very easy 14.0 16.8 21.6 21.8 26.0 31.7 15.4 24.1 19.7 -N of Valid 1304 1417 1028 707 465 435 2721 2635 5356N of Miss 115 73 67 63 25 35 188 190 378
Percentage Tables 256

Pride Surveys Report: 2017-18 Warren County
Table 4.125: How easy is it to get marijuana?
RESPONSE 7th 8th 9th 10th 11th 12th 7-8th 9-12th TOTALDon’t know/can’t get 78.3 66.4 59.3 47.4 43.5 33.3 72.1 49.0 60.7 -Very difficult 6.9 8.2 4.1 4.7 2.4 3.4 7.6 3.8 5.7 -Fairly difficult 6.2 8.5 13.0 11.4 9.7 10.3 7.4 11.6 9.4 -Fairly easy 5.1 9.7 13.0 20.0 19.6 23.1 7.5 17.7 12.5 -Very easy 3.5 7.2 10.6 16.4 24.8 29.9 5.4 17.9 11.6 -N of Valid 1300 1416 1027 700 464 438 2716 2629 5345N of Miss 119 74 68 70 26 32 193 196 389
Table 4.126: How easy is it to get prescription drugs not prescribed to you?
RESPONSE 7th 8th 9th 10th 11th 12th 7-8th 9-12th TOTALDon’t know/can’t get 71.2 59.4 59.6 53.7 55.0 54.8 65.1 56.4 60.8 -Very difficult 6.0 6.5 7.7 7.5 5.4 5.9 6.2 6.9 6.6 -Fairly difficult 5.4 9.4 9.2 14.9 11.7 13.0 7.5 11.8 9.6 -Fairly easy 9.1 13.0 10.5 12.6 13.2 11.6 11.1 11.7 11.4 -Very easy 8.2 11.7 12.9 11.3 14.7 14.6 10.0 13.1 11.5 -N of Valid 1303 1418 1028 706 462 438 2721 2634 5355N of Miss 116 72 67 64 28 32 188 191 379
Table 4.127: How easy is it to get other illicit drugs?
RESPONSE 7th 8th 9th 10th 11th 12th 7-8th 9-12th TOTALDon’t know/can’t get 81.5 75.4 69.3 61.6 65.0 62.2 78.3 65.3 71.9 -Very difficult 5.2 8.0 8.9 9.0 6.4 7.1 6.7 8.2 7.4 -Fairly difficult 5.8 7.4 8.2 14.9 11.2 12.2 6.7 11.2 8.9 -Fairly easy 3.7 5.1 7.3 8.0 8.4 8.7 4.4 7.9 6.1 -Very easy 3.8 4.2 6.3 6.5 9.0 9.9 4.0 7.4 5.7 -N of Valid 1300 1417 1027 703 466 436 2717 2632 5349N of Miss 119 73 68 67 24 34 192 193 385
Percentage Tables 257

Pride Surveys Report: 2017-18 Warren County
4.9 Feel About Binge Drinking
Table 4.128: How do you feel about someone your age having one or two drinks of an alcoholic beverage nearly every day?
RESPONSE 7th 8th 9th 10th 11th 12th 7-8th 9-12th TOTALNeither approve or disapprove 6.4 9.1 12.6 17.0 17.6 17.8 7.8 15.5 11.6 -Somewhat disapprove 6.9 10.2 11.7 17.0 17.4 17.8 8.6 15.1 11.8 -Strongly disapprove 76.5 70.4 65.7 56.6 55.7 57.4 73.4 60.1 66.9 -Don’t know or can’t say 10.2 10.3 10.0 9.5 9.3 6.9 10.2 9.2 9.7 -N of Valid 1304 1410 1021 707 461 437 2714 2626 5340N of Miss 115 80 74 63 29 33 195 199 394
Percentage Tables 258
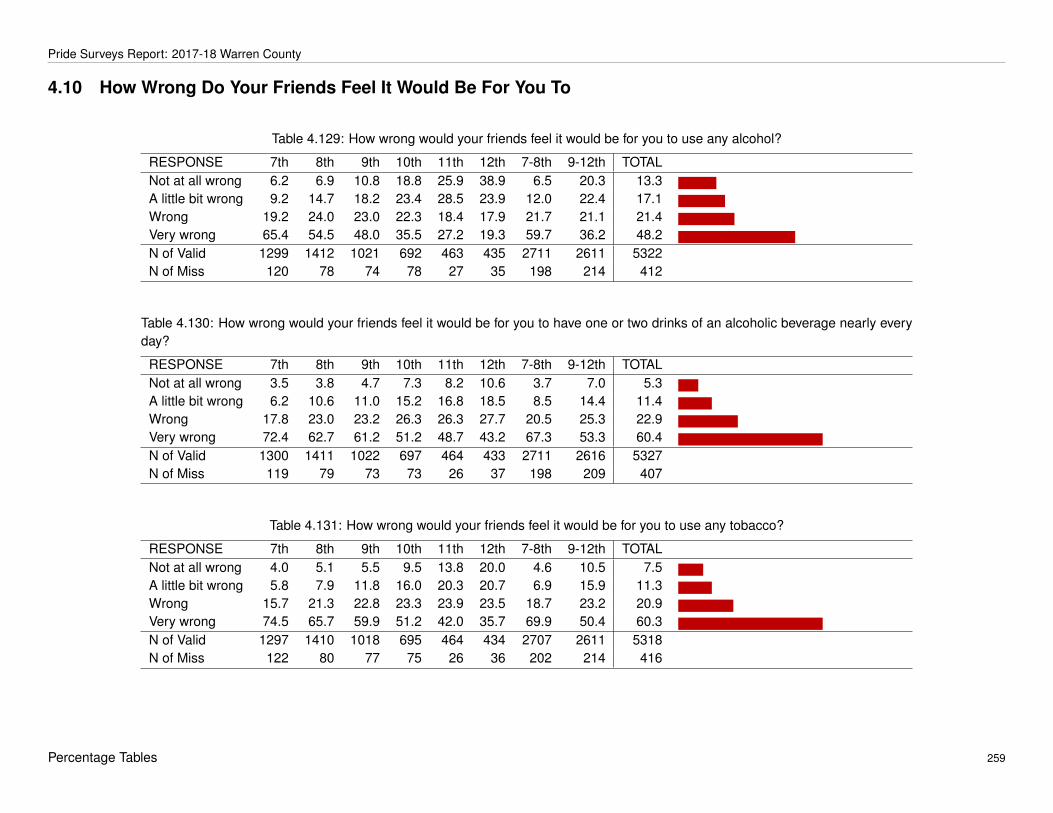
Pride Surveys Report: 2017-18 Warren County
4.10 How Wrong Do Your Friends Feel It Would Be For You To
Table 4.129: How wrong would your friends feel it would be for you to use any alcohol?
RESPONSE 7th 8th 9th 10th 11th 12th 7-8th 9-12th TOTALNot at all wrong 6.2 6.9 10.8 18.8 25.9 38.9 6.5 20.3 13.3 -A little bit wrong 9.2 14.7 18.2 23.4 28.5 23.9 12.0 22.4 17.1 -Wrong 19.2 24.0 23.0 22.3 18.4 17.9 21.7 21.1 21.4 -Very wrong 65.4 54.5 48.0 35.5 27.2 19.3 59.7 36.2 48.2 -N of Valid 1299 1412 1021 692 463 435 2711 2611 5322N of Miss 120 78 74 78 27 35 198 214 412
Table 4.130: How wrong would your friends feel it would be for you to have one or two drinks of an alcoholic beverage nearly everyday?
RESPONSE 7th 8th 9th 10th 11th 12th 7-8th 9-12th TOTALNot at all wrong 3.5 3.8 4.7 7.3 8.2 10.6 3.7 7.0 5.3 -A little bit wrong 6.2 10.6 11.0 15.2 16.8 18.5 8.5 14.4 11.4 -Wrong 17.8 23.0 23.2 26.3 26.3 27.7 20.5 25.3 22.9 -Very wrong 72.4 62.7 61.2 51.2 48.7 43.2 67.3 53.3 60.4 -N of Valid 1300 1411 1022 697 464 433 2711 2616 5327N of Miss 119 79 73 73 26 37 198 209 407
Table 4.131: How wrong would your friends feel it would be for you to use any tobacco?
RESPONSE 7th 8th 9th 10th 11th 12th 7-8th 9-12th TOTALNot at all wrong 4.0 5.1 5.5 9.5 13.8 20.0 4.6 10.5 7.5 -A little bit wrong 5.8 7.9 11.8 16.0 20.3 20.7 6.9 15.9 11.3 -Wrong 15.7 21.3 22.8 23.3 23.9 23.5 18.7 23.2 20.9 -Very wrong 74.5 65.7 59.9 51.2 42.0 35.7 69.9 50.4 60.3 -N of Valid 1297 1410 1018 695 464 434 2707 2611 5318N of Miss 122 80 77 75 26 36 202 214 416
Percentage Tables 259

Pride Surveys Report: 2017-18 Warren County
Table 4.132: How wrong would your friends feel it would be for you to smoke tobacco?
RESPONSE 7th 8th 9th 10th 11th 12th 7-8th 9-12th TOTALNot at all wrong 3.9 4.8 4.6 8.5 12.1 17.5 4.4 9.1 6.7 -A little bit wrong 4.6 6.4 11.5 14.5 19.1 20.0 5.5 15.1 10.2 -Wrong 15.0 21.3 20.8 23.7 25.2 25.3 18.3 23.1 20.7 -Very wrong 76.6 67.4 63.0 53.2 43.6 37.1 71.8 52.7 62.4 -N of Valid 1297 1407 1022 695 461 434 2704 2612 5316N of Miss 122 83 73 75 29 36 205 213 418
Table 4.133: How wrong would your friends feel it would be for you to use electronic vapor products?
RESPONSE 7th 8th 9th 10th 11th 12th 7-8th 9-12th TOTALNot at all wrong 7.2 12.0 17.1 24.5 37.0 41.3 9.7 26.6 18.0 -A little bit wrong 10.5 17.6 18.6 22.1 22.9 23.8 14.2 21.2 17.6 -Wrong 15.7 18.5 20.2 16.1 13.2 11.1 17.2 16.4 16.8 -Very wrong 66.5 51.9 44.1 37.3 26.8 23.8 58.9 35.9 47.6 -N of Valid 1299 1411 1018 691 462 433 2710 2604 5314N of Miss 120 79 77 79 28 37 199 221 420
Table 4.134: How wrong would your friends feel it would be for you to smoke marijuana?
RESPONSE 7th 8th 9th 10th 11th 12th 7-8th 9-12th TOTALNot at all wrong 3.9 6.2 10.7 16.8 26.9 33.1 5.1 18.9 11.9 -A little bit wrong 3.4 8.2 12.5 15.7 20.6 19.3 5.9 15.9 10.8 -Wrong 10.1 15.2 14.2 20.7 17.0 17.5 12.8 17.0 14.8 -Very wrong 82.7 70.3 62.6 46.8 35.5 30.1 76.2 48.2 62.4 -N of Valid 1297 1410 1019 695 465 435 2707 2614 5321N of Miss 122 80 76 75 25 35 202 211 413
Percentage Tables 260

Pride Surveys Report: 2017-18 Warren County
Table 4.135: How wrong would your friends feel it would be for you to use prescription drugs that are not prescribed to you?
RESPONSE 7th 8th 9th 10th 11th 12th 7-8th 9-12th TOTALNot at all wrong 3.2 2.8 3.8 3.9 5.2 6.2 3.0 4.5 3.7 -A little bit wrong 3.7 5.5 6.3 7.5 11.1 9.0 4.6 7.9 6.2 -Wrong 13.9 16.8 15.2 19.3 20.9 23.4 15.4 18.7 17.0 -Very wrong 79.2 74.9 74.7 69.3 62.7 61.3 76.9 68.9 73.0 -N of Valid 1297 1410 1013 694 459 432 2707 2598 5305N of Miss 122 80 82 76 31 38 202 227 429
Table 4.136: How wrong would your friends feel it would be for you to use other illicit drugs?
RESPONSE 7th 8th 9th 10th 11th 12th 7-8th 9-12th TOTALNot at all wrong 2.4 2.3 3.1 3.7 4.5 4.6 2.3 3.8 3.1 -A little bit wrong 2.2 2.7 5.0 5.5 8.6 4.9 2.4 5.8 4.1 -Wrong 10.2 15.1 13.3 17.3 15.8 22.2 12.8 16.3 14.5 -Very wrong 85.3 79.9 78.5 73.5 71.1 68.3 82.5 74.2 78.4 -N of Valid 1296 1409 1016 694 463 432 2705 2605 5310N of Miss 123 81 79 76 27 38 204 220 424
Table 4.137: How wrong would your friends feel it would be for you to gamble anything of value?
RESPONSE 7th 8th 9th 10th 11th 12th 7-8th 9-12th TOTALNot at all wrong 5.7 5.7 9.0 8.8 13.4 13.9 5.7 10.6 8.1 -A little bit wrong 9.8 17.1 14.7 15.5 19.7 21.3 13.6 16.9 15.2 -Wrong 20.8 26.2 23.7 24.7 21.5 23.8 23.6 23.6 23.6 -Very wrong 63.7 51.0 52.6 50.9 45.3 41.0 57.1 48.9 53.1 -N of Valid 1300 1413 1012 691 461 432 2713 2596 5309N of Miss 119 77 83 79 29 38 196 229 425
Percentage Tables 261

Pride Surveys Report: 2017-18 Warren County
4.11 How Wrong Do Your Parents Feel It Would Be For You To
Table 4.138: How wrong would your parents feel it would be for you to use any alcohol?
RESPONSE 7th 8th 9th 10th 11th 12th 7-8th 9-12th TOTALNot at all wrong 3.2 1.6 3.1 3.2 6.2 10.0 2.4 4.8 3.6 -A little bit wrong 3.2 4.4 7.1 8.2 9.7 16.7 3.8 9.4 6.6 -Wrong 8.0 9.8 9.8 14.1 16.1 18.8 8.9 13.6 11.2 -Very wrong 85.6 84.1 80.0 74.5 68.0 54.6 84.8 72.2 78.6 -N of Valid 1293 1412 1010 687 466 432 2705 2595 5300N of Miss 126 78 85 83 24 38 204 230 434
Table 4.139: How wrong would your parents feel it would be for you to have one or two drinks of an alcoholic beverage nearly everyday?
RESPONSE 7th 8th 9th 10th 11th 12th 7-8th 9-12th TOTALNot at all wrong 1.9 1.3 1.9 1.7 3.0 3.2 1.6 2.3 1.9 -A little bit wrong 2.6 2.7 2.9 3.0 3.4 5.8 2.7 3.5 3.1 -Wrong 5.9 7.3 7.0 8.6 10.8 12.3 6.6 9.0 7.8 -Very wrong 89.6 88.7 88.3 86.6 82.8 78.7 89.1 85.3 87.2 -N of Valid 1293 1409 1013 689 465 432 2702 2599 5301N of Miss 126 81 82 81 25 38 207 226 433
Table 4.140: How wrong would your parents feel it would be for you to use any tobacco?
RESPONSE 7th 8th 9th 10th 11th 12th 7-8th 9-12th TOTALNot at all wrong 2.2 1.1 1.8 1.7 2.2 4.9 1.6 2.4 2.0 -A little bit wrong 1.6 1.4 2.7 3.3 5.0 8.1 1.5 4.2 2.8 -Wrong 5.2 7.4 6.0 8.7 10.6 14.2 6.3 8.9 7.6 -Very wrong 91.0 90.1 89.5 86.2 82.3 72.9 90.6 84.6 87.6 -N of Valid 1294 1407 1011 687 464 431 2701 2593 5294N of Miss 125 83 84 83 26 39 208 232 440
Percentage Tables 262

Pride Surveys Report: 2017-18 Warren County
Table 4.141: How wrong would your parents feel it would be for you to smoke tobacco?
RESPONSE 7th 8th 9th 10th 11th 12th 7-8th 9-12th TOTALNot at all wrong 1.9 1.1 1.6 1.5 2.4 4.9 1.5 2.2 1.9 -A little bit wrong 1.5 1.3 3.1 2.5 4.1 7.4 1.4 3.8 2.6 -Wrong 4.5 6.9 5.6 9.1 11.0 13.7 5.7 8.8 7.3 -Very wrong 92.1 90.7 89.7 87.0 82.6 74.1 91.4 85.1 88.3 -N of Valid 1292 1410 1011 685 465 432 2702 2593 5295N of Miss 127 80 84 85 25 38 207 232 439
Table 4.142: How wrong would your parents feel it would be for you to use electronic vapor products?
RESPONSE 7th 8th 9th 10th 11th 12th 7-8th 9-12th TOTALNot at all wrong 3.2 2.3 3.2 3.5 5.4 8.1 2.7 4.5 3.6 -A little bit wrong 2.9 5.3 6.3 7.7 7.5 14.5 4.1 8.3 6.2 -Wrong 7.3 9.9 8.8 11.5 14.7 16.4 8.6 11.8 10.2 -Very wrong 86.6 82.5 81.7 77.2 72.4 61.0 84.5 75.4 80.0 -N of Valid 1293 1408 1011 685 464 433 2701 2593 5294N of Miss 126 82 84 85 26 37 208 232 440
Table 4.143: How wrong would your parents feel it would be for you to smoke marijuana?
RESPONSE 7th 8th 9th 10th 11th 12th 7-8th 9-12th TOTALNot at all wrong 1.9 2.0 2.3 3.1 5.0 7.0 2.0 3.7 2.8 -A little bit wrong 1.2 1.9 3.6 4.7 7.6 8.8 1.6 5.5 3.5 -Wrong 3.6 5.9 5.6 9.2 8.9 11.4 4.8 8.1 6.4 -Very wrong 93.3 90.2 88.5 83.1 78.6 72.9 91.7 82.7 87.3 -N of Valid 1291 1411 1014 685 462 431 2702 2592 5294N of Miss 128 79 81 85 28 39 207 233 440
Percentage Tables 263

Pride Surveys Report: 2017-18 Warren County
Table 4.144: How wrong would your parents feel it would be for you to use prescription drugs that are not prescribed to you?
RESPONSE 7th 8th 9th 10th 11th 12th 7-8th 9-12th TOTALNot at all wrong 1.9 1.3 1.4 1.3 2.4 2.1 1.6 1.7 1.6 -A little bit wrong 1.6 1.3 2.2 1.5 3.0 2.3 1.4 2.2 1.8 -Wrong 4.7 5.2 4.2 5.4 6.9 7.7 5.0 5.6 5.3 -Very wrong 91.8 92.2 92.2 91.8 87.6 87.9 92.0 90.6 91.3 -N of Valid 1292 1411 1013 687 461 428 2703 2589 5292N of Miss 127 79 82 83 29 42 206 236 442
Table 4.145: How wrong would your parents feel it would be for you to use other illicit drugs?
RESPONSE 7th 8th 9th 10th 11th 12th 7-8th 9-12th TOTALNot at all wrong 1.5 1.1 1.1 1.2 1.7 1.9 1.3 1.4 1.3 -A little bit wrong 0.6 0.3 1.2 1.2 1.7 0.9 0.4 1.2 0.8 -Wrong 2.7 3.9 3.8 4.8 6.1 6.8 3.3 5.0 4.1 -Very wrong 95.1 94.8 93.9 92.8 90.5 90.4 94.9 92.4 93.7 -N of Valid 1291 1412 1008 685 461 428 2703 2582 5285N of Miss 128 78 87 85 29 42 206 243 449
Table 4.146: How wrong would your parents feel it would be for you to gamble anything of value?
RESPONSE 7th 8th 9th 10th 11th 12th 7-8th 9-12th TOTALNot at all wrong 2.7 1.7 2.4 2.3 4.1 5.6 2.2 3.2 2.7 -A little bit wrong 3.6 4.8 3.5 3.7 5.8 6.3 4.2 4.4 4.3 -Wrong 8.5 11.7 9.2 10.3 9.5 12.6 10.2 10.1 10.1 -Very wrong 85.2 81.8 84.9 83.7 80.5 75.5 83.4 82.2 82.8 -N of Valid 1288 1407 1006 681 462 429 2695 2578 5273N of Miss 131 83 89 89 28 41 214 247 461
Percentage Tables 264

Pride Surveys Report: 2017-18 Warren County
4.12 From Whom Do You Get
Table 4.147: From whom do you get alcohol?
RESPONSE 7th 8th 9th 10th 11th 12th 7-8th 9-12th TOTALDo not use 87.2 85.2 75.5 64.9 61.4 51.3 86.1 66.2 76.3 -Friends 1.5 5.4 10.1 15.6 19.4 27.0 3.5 16.0 9.7 -Parent 3.5 4.6 6.0 6.4 8.8 11.3 4.1 7.5 5.8 -Siblings 0.6 1.4 2.0 3.2 3.5 7.7 1.0 3.5 2.2 -Store 1.0 1.4 1.4 3.1 9.2 9.6 1.2 4.6 2.9 -Internet 0.6 0.4 0.5 0.4 1.0 0.2 0.5 0.5 0.5 -Other 1.4 3.0 4.2 5.3 6.3 6.0 2.2 5.2 3.7 -N of Valid 1419 1490 1095 770 490 470 2909 2825 5734N of Miss 0 0 0 0 0 0 0 0 0
Table 4.148: From whom do you get tobacco?
RESPONSE 7th 8th 9th 10th 11th 12th 7-8th 9-12th TOTALDo not use 89.5 89.6 85.6 78.3 81.4 73.4 89.5 80.8 85.3 -Friends 0.8 3.4 4.5 7.8 7.1 8.5 2.1 6.5 4.3 -Parent 1.2 1.1 1.3 1.4 1.6 0.9 1.2 1.3 1.2 -Siblings 0.4 0.7 0.8 1.2 1.2 0.6 0.5 1.0 0.7 -Store 0.9 0.8 1.2 2.6 4.7 9.4 0.9 3.5 2.2 -Internet 0.6 0.4 0.5 0.1 0.4 0.6 0.5 0.4 0.5 -Other 0.8 1.5 2.0 2.9 3.1 3.0 1.2 2.6 1.9 -N of Valid 1419 1490 1095 770 490 470 2909 2825 5734N of Miss 0 0 0 0 0 0 0 0 0
Percentage Tables 265
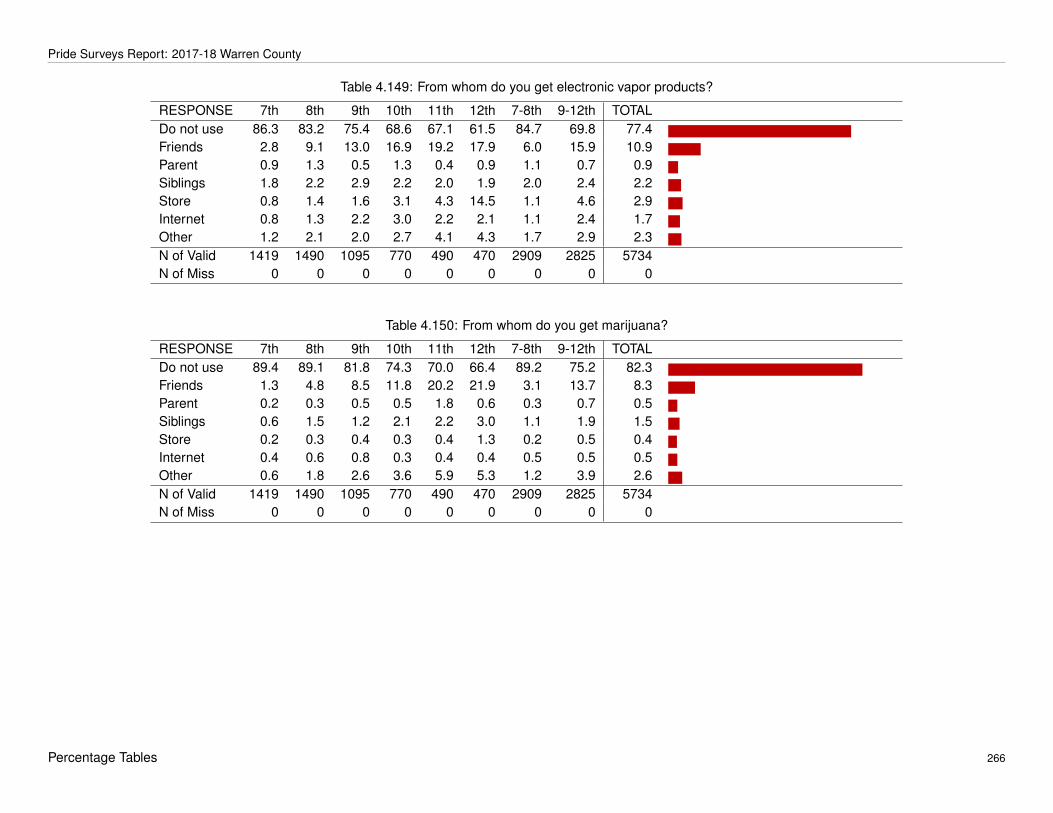
Pride Surveys Report: 2017-18 Warren County
Table 4.149: From whom do you get electronic vapor products?
RESPONSE 7th 8th 9th 10th 11th 12th 7-8th 9-12th TOTALDo not use 86.3 83.2 75.4 68.6 67.1 61.5 84.7 69.8 77.4 -Friends 2.8 9.1 13.0 16.9 19.2 17.9 6.0 15.9 10.9 -Parent 0.9 1.3 0.5 1.3 0.4 0.9 1.1 0.7 0.9 -Siblings 1.8 2.2 2.9 2.2 2.0 1.9 2.0 2.4 2.2 -Store 0.8 1.4 1.6 3.1 4.3 14.5 1.1 4.6 2.9 -Internet 0.8 1.3 2.2 3.0 2.2 2.1 1.1 2.4 1.7 -Other 1.2 2.1 2.0 2.7 4.1 4.3 1.7 2.9 2.3 -N of Valid 1419 1490 1095 770 490 470 2909 2825 5734N of Miss 0 0 0 0 0 0 0 0 0
Table 4.150: From whom do you get marijuana?
RESPONSE 7th 8th 9th 10th 11th 12th 7-8th 9-12th TOTALDo not use 89.4 89.1 81.8 74.3 70.0 66.4 89.2 75.2 82.3 -Friends 1.3 4.8 8.5 11.8 20.2 21.9 3.1 13.7 8.3 -Parent 0.2 0.3 0.5 0.5 1.8 0.6 0.3 0.7 0.5 -Siblings 0.6 1.5 1.2 2.1 2.2 3.0 1.1 1.9 1.5 -Store 0.2 0.3 0.4 0.3 0.4 1.3 0.2 0.5 0.4 -Internet 0.4 0.6 0.8 0.3 0.4 0.4 0.5 0.5 0.5 -Other 0.6 1.8 2.6 3.6 5.9 5.3 1.2 3.9 2.6 -N of Valid 1419 1490 1095 770 490 470 2909 2825 5734N of Miss 0 0 0 0 0 0 0 0 0
Percentage Tables 266

Pride Surveys Report: 2017-18 Warren County
Table 4.151: From whom do you get prescription drugs not prescribed to you?
RESPONSE 7th 8th 9th 10th 11th 12th 7-8th 9-12th TOTALDo not use 89.1 91.1 88.2 83.0 89.2 85.5 90.1 86.5 88.3 -Friends 0.6 1.5 1.6 3.2 2.7 3.0 1.1 2.5 1.8 -Parent 1.8 1.9 1.0 1.3 1.8 1.5 1.9 1.3 1.6 -Siblings 0.8 0.5 0.5 0.5 0.6 0.0 0.7 0.5 0.6 -Store 0.6 0.5 0.5 0.5 0.2 0.2 0.6 0.4 0.5 -Internet 0.6 0.3 0.3 0.1 0.2 0.2 0.4 0.2 0.3 -Other 0.8 1.6 1.2 2.9 1.8 1.7 1.2 1.8 1.5 -N of Valid 1419 1490 1095 770 490 470 2909 2825 5734N of Miss 0 0 0 0 0 0 0 0 0
Table 4.152: From whom do you get illicit drugs?
RESPONSE 7th 8th 9th 10th 11th 12th 7-8th 9-12th TOTALDo not use 90.6 93.1 88.9 84.8 90.2 86.8 91.9 87.7 89.8 -Friends 0.4 1.1 1.2 2.2 2.4 3.4 0.8 2.1 1.4 -Parent 0.2 0.1 0.1 0.3 0.4 0.4 0.1 0.2 0.2 -Siblings 0.1 0.3 0.2 0.3 0.2 0.0 0.2 0.2 0.2 -Store 0.1 0.3 0.3 0.4 0.2 0.0 0.2 0.2 0.2 -Internet 0.3 0.3 0.5 0.6 0.2 0.2 0.3 0.4 0.4 -Other 0.5 1.1 1.1 1.7 1.4 1.9 0.8 1.5 1.1 -N of Valid 1419 1490 1095 770 490 470 2909 2825 5734N of Miss 0 0 0 0 0 0 0 0 0
Percentage Tables 267

Pride Surveys Report: 2017-18 Warren County
4.13 At What Age Did You First
Table 4.153: At what age did you first smoke cigarettes?
RESPONSE 7th 8th 9th 10th 11th 12th 7-8th 9-12th TOTALNever used 97.4 93.8 91.7 90.6 88.4 84.0 95.5 89.6 92.6 -10 or under 1.1 1.3 1.7 2.2 1.5 0.7 1.2 1.6 1.4 -11 0.9 1.3 1.5 0.6 0.7 2.6 1.1 1.3 1.2 -12 0.5 1.0 1.2 0.7 1.1 1.6 0.7 1.1 0.9 -13 0.2 2.1 2.0 1.0 1.8 0.2 1.1 1.4 1.3 -14 0.0 0.5 1.8 2.1 1.1 2.3 0.3 1.8 1.0 -15 0.0 0.1 0.2 2.1 2.2 0.9 0.0 1.2 0.6 -16 0.0 0.0 0.0 0.7 2.4 3.5 0.0 1.2 0.6 -17 or older 0.0 0.0 0.0 0.0 0.9 4.0 0.0 0.8 0.4 -N of Valid 1292 1412 1010 682 457 426 2704 2575 5279N of Miss 127 78 85 88 33 44 205 250 455
Table 4.154: At what age did you first use smokeless tobacco?
RESPONSE 7th 8th 9th 10th 11th 12th 7-8th 9-12th TOTALNever used 99.1 97.7 95.3 93.4 92.1 85.4 98.4 92.6 95.5 -10 or under 0.4 0.6 0.4 1.5 0.7 0.7 0.5 0.8 0.6 -11 0.3 0.5 0.5 0.1 0.0 0.5 0.4 0.3 0.4 -12 0.2 0.7 0.5 0.6 0.2 0.9 0.4 0.5 0.5 -13 0.0 0.4 1.5 0.3 0.7 0.9 0.2 0.9 0.6 -14 0.0 0.1 1.2 2.1 1.1 0.7 0.0 1.3 0.7 -15 0.0 0.0 0.7 1.9 2.2 3.3 0.0 1.7 0.8 -16 0.0 0.0 0.0 0.1 2.8 4.0 0.0 1.2 0.6 -17 or older 0.0 0.0 0.0 0.0 0.2 3.5 0.0 0.6 0.3 -N of Valid 1293 1410 1013 681 457 426 2703 2577 5280N of Miss 126 80 82 89 33 44 206 248 454
Percentage Tables 268
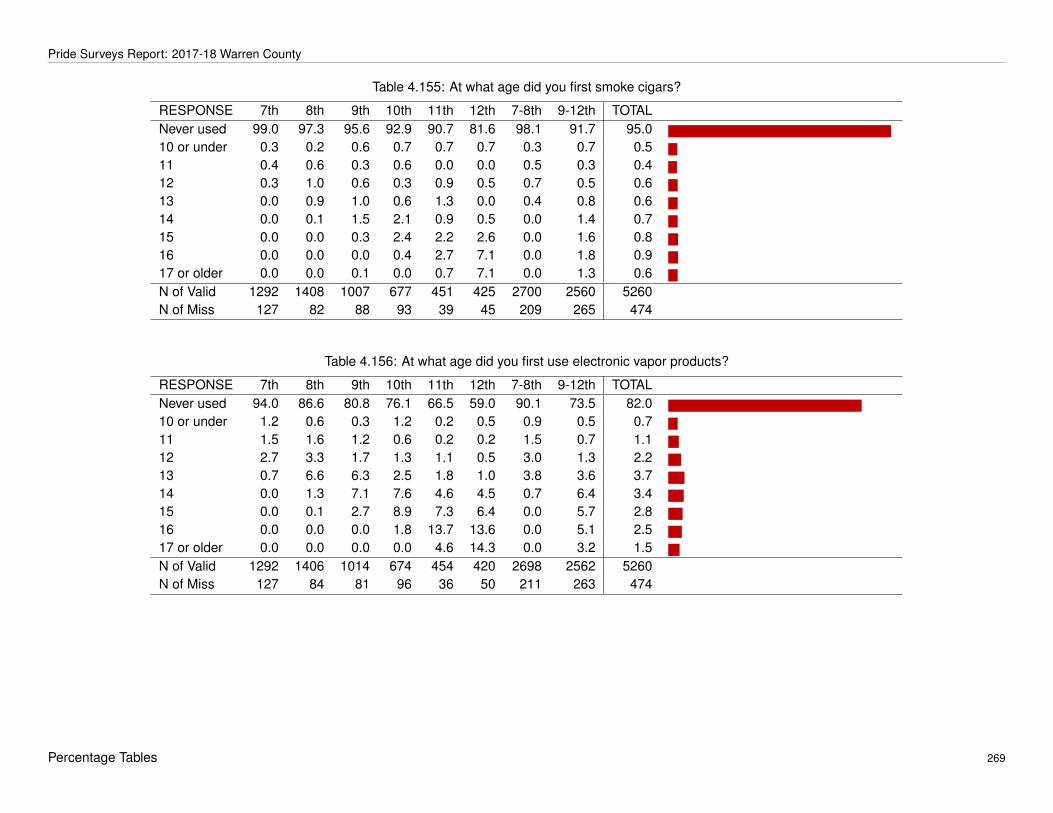
Pride Surveys Report: 2017-18 Warren County
Table 4.155: At what age did you first smoke cigars?
RESPONSE 7th 8th 9th 10th 11th 12th 7-8th 9-12th TOTALNever used 99.0 97.3 95.6 92.9 90.7 81.6 98.1 91.7 95.0 -10 or under 0.3 0.2 0.6 0.7 0.7 0.7 0.3 0.7 0.5 -11 0.4 0.6 0.3 0.6 0.0 0.0 0.5 0.3 0.4 -12 0.3 1.0 0.6 0.3 0.9 0.5 0.7 0.5 0.6 -13 0.0 0.9 1.0 0.6 1.3 0.0 0.4 0.8 0.6 -14 0.0 0.1 1.5 2.1 0.9 0.5 0.0 1.4 0.7 -15 0.0 0.0 0.3 2.4 2.2 2.6 0.0 1.6 0.8 -16 0.0 0.0 0.0 0.4 2.7 7.1 0.0 1.8 0.9 -17 or older 0.0 0.0 0.1 0.0 0.7 7.1 0.0 1.3 0.6 -N of Valid 1292 1408 1007 677 451 425 2700 2560 5260N of Miss 127 82 88 93 39 45 209 265 474
Table 4.156: At what age did you first use electronic vapor products?
RESPONSE 7th 8th 9th 10th 11th 12th 7-8th 9-12th TOTALNever used 94.0 86.6 80.8 76.1 66.5 59.0 90.1 73.5 82.0 -10 or under 1.2 0.6 0.3 1.2 0.2 0.5 0.9 0.5 0.7 -11 1.5 1.6 1.2 0.6 0.2 0.2 1.5 0.7 1.1 -12 2.7 3.3 1.7 1.3 1.1 0.5 3.0 1.3 2.2 -13 0.7 6.6 6.3 2.5 1.8 1.0 3.8 3.6 3.7 -14 0.0 1.3 7.1 7.6 4.6 4.5 0.7 6.4 3.4 -15 0.0 0.1 2.7 8.9 7.3 6.4 0.0 5.7 2.8 -16 0.0 0.0 0.0 1.8 13.7 13.6 0.0 5.1 2.5 -17 or older 0.0 0.0 0.0 0.0 4.6 14.3 0.0 3.2 1.5 -N of Valid 1292 1406 1014 674 454 420 2698 2562 5260N of Miss 127 84 81 96 36 50 211 263 474
Percentage Tables 269
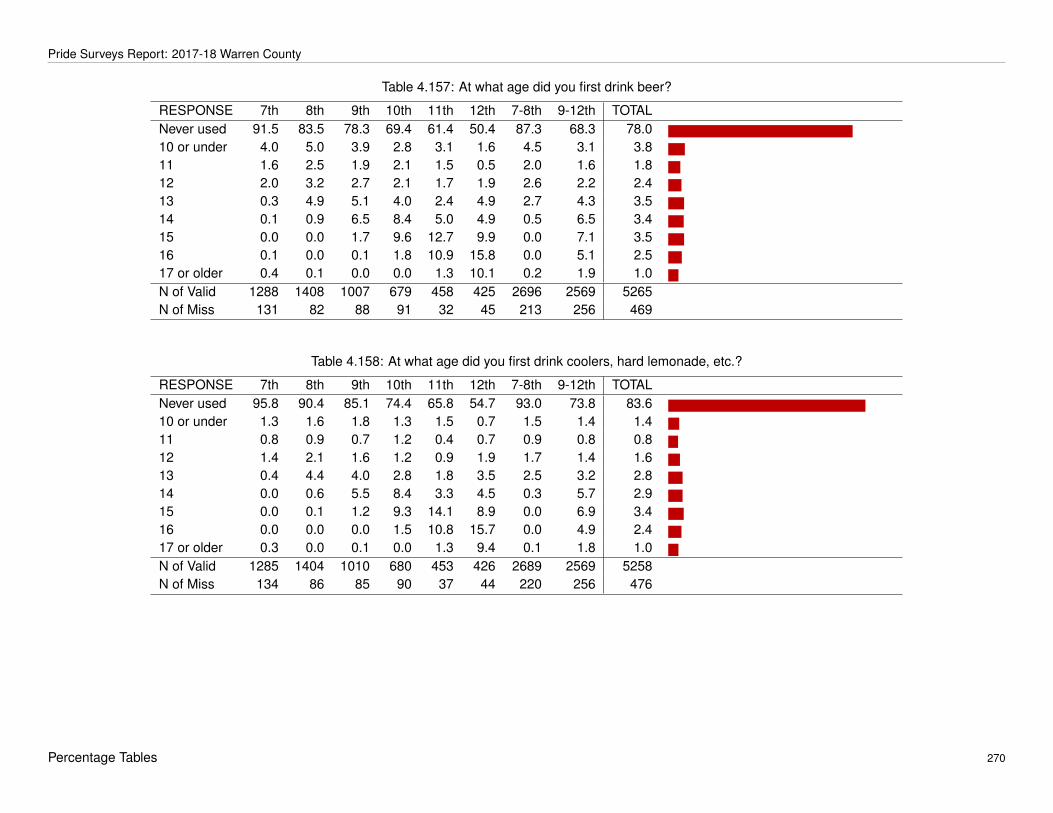
Pride Surveys Report: 2017-18 Warren County
Table 4.157: At what age did you first drink beer?
RESPONSE 7th 8th 9th 10th 11th 12th 7-8th 9-12th TOTALNever used 91.5 83.5 78.3 69.4 61.4 50.4 87.3 68.3 78.0 -10 or under 4.0 5.0 3.9 2.8 3.1 1.6 4.5 3.1 3.8 -11 1.6 2.5 1.9 2.1 1.5 0.5 2.0 1.6 1.8 -12 2.0 3.2 2.7 2.1 1.7 1.9 2.6 2.2 2.4 -13 0.3 4.9 5.1 4.0 2.4 4.9 2.7 4.3 3.5 -14 0.1 0.9 6.5 8.4 5.0 4.9 0.5 6.5 3.4 -15 0.0 0.0 1.7 9.6 12.7 9.9 0.0 7.1 3.5 -16 0.1 0.0 0.1 1.8 10.9 15.8 0.0 5.1 2.5 -17 or older 0.4 0.1 0.0 0.0 1.3 10.1 0.2 1.9 1.0 -N of Valid 1288 1408 1007 679 458 425 2696 2569 5265N of Miss 131 82 88 91 32 45 213 256 469
Table 4.158: At what age did you first drink coolers, hard lemonade, etc.?
RESPONSE 7th 8th 9th 10th 11th 12th 7-8th 9-12th TOTALNever used 95.8 90.4 85.1 74.4 65.8 54.7 93.0 73.8 83.6 -10 or under 1.3 1.6 1.8 1.3 1.5 0.7 1.5 1.4 1.4 -11 0.8 0.9 0.7 1.2 0.4 0.7 0.9 0.8 0.8 -12 1.4 2.1 1.6 1.2 0.9 1.9 1.7 1.4 1.6 -13 0.4 4.4 4.0 2.8 1.8 3.5 2.5 3.2 2.8 -14 0.0 0.6 5.5 8.4 3.3 4.5 0.3 5.7 2.9 -15 0.0 0.1 1.2 9.3 14.1 8.9 0.0 6.9 3.4 -16 0.0 0.0 0.0 1.5 10.8 15.7 0.0 4.9 2.4 -17 or older 0.3 0.0 0.1 0.0 1.3 9.4 0.1 1.8 1.0 -N of Valid 1285 1404 1010 680 453 426 2689 2569 5258N of Miss 134 86 85 90 37 44 220 256 476
Percentage Tables 270

Pride Surveys Report: 2017-18 Warren County
Table 4.159: At what age did you first drink liquor?
RESPONSE 7th 8th 9th 10th 11th 12th 7-8th 9-12th TOTALNever used 96.0 90.5 85.5 76.3 67.1 52.0 93.1 74.3 83.9 -10 or under 0.9 1.3 1.3 1.2 1.8 0.9 1.1 1.3 1.2 -11 0.7 1.1 0.6 0.6 0.7 0.2 0.9 0.5 0.7 -12 1.9 2.4 2.0 1.2 0.7 0.9 2.2 1.4 1.8 -13 0.3 3.9 2.9 2.8 2.6 2.8 2.2 2.8 2.5 -14 0.0 0.6 6.3 7.1 3.7 5.2 0.3 5.9 3.0 -15 0.0 0.1 1.5 9.3 12.3 9.5 0.0 6.8 3.3 -16 0.0 0.0 0.0 1.6 10.1 15.8 0.0 4.8 2.4 -17 or older 0.2 0.1 0.0 0.0 1.1 12.5 0.1 2.3 1.2 -N of Valid 1285 1406 1013 678 456 423 2691 2570 5261N of Miss 134 84 82 92 34 47 218 255 473
Table 4.160: At what age did you first smoke marijuana?
RESPONSE 7th 8th 9th 10th 11th 12th 7-8th 9-12th TOTALNever used 98.6 94.5 89.5 84.5 74.6 69.0 96.5 82.2 89.5 -10 or under 0.4 0.4 0.5 1.2 0.2 0.9 0.4 0.7 0.6 -11 0.5 0.6 0.5 0.7 0.0 0.2 0.6 0.4 0.5 -12 0.4 1.2 1.4 0.7 0.9 1.7 0.8 1.2 1.0 -13 0.1 2.6 2.4 1.6 2.4 0.7 1.4 1.9 1.7 -14 0.0 0.5 4.3 4.4 3.1 3.1 0.3 3.9 2.0 -15 0.0 0.1 1.3 6.2 8.1 6.1 0.0 4.6 2.3 -16 0.0 0.0 0.1 0.6 9.0 12.8 0.0 3.9 1.9 -17 or older 0.0 0.0 0.0 0.0 1.8 5.4 0.0 1.2 0.6 -N of Valid 1288 1410 1013 679 457 423 2698 2572 5270N of Miss 131 80 82 91 33 47 211 253 464
Percentage Tables 271

Pride Surveys Report: 2017-18 Warren County
Table 4.161: At what age did you first use synthetic marijuana?
RESPONSE 7th 8th 9th 10th 11th 12th 7-8th 9-12th TOTALNever used 99.8 99.2 97.8 97.2 96.7 95.5 99.5 97.1 98.3 -10 or under 0.1 0.1 0.1 0.7 0.2 0.5 0.1 0.4 0.2 -11 0.0 0.1 0.3 0.1 0.0 0.0 0.0 0.2 0.1 -12 0.2 0.2 0.5 0.1 0.2 0.0 0.2 0.3 0.2 -13 0.0 0.2 0.5 0.1 0.2 0.2 0.1 0.3 0.2 -14 0.0 0.1 0.8 0.9 0.0 0.2 0.1 0.6 0.3 -15 0.0 0.1 0.0 0.6 0.4 0.5 0.0 0.3 0.2 -16 0.0 0.0 0.0 0.1 2.0 1.4 0.0 0.6 0.3 -17 or older 0.0 0.0 0.0 0.0 0.2 1.7 0.0 0.3 0.2 -N of Valid 1291 1407 1009 675 453 421 2698 2558 5256N of Miss 128 83 86 95 37 49 211 267 478
Table 4.162: At what age did you first use chemical products (bath salts) to get high?
RESPONSE 7th 8th 9th 10th 11th 12th 7-8th 9-12th TOTALNever used 99.7 99.6 99.0 98.8 99.6 98.6 99.6 99.0 99.3 -10 or under 0.2 0.0 0.1 0.6 0.2 0.5 0.1 0.3 0.2 -11 0.1 0.1 0.2 0.0 0.0 0.0 0.1 0.1 0.1 -12 0.1 0.0 0.1 0.1 0.0 0.0 0.0 0.1 0.1 -13 0.0 0.2 0.0 0.0 0.0 0.0 0.1 0.0 0.1 -14 0.0 0.1 0.5 0.3 0.0 0.0 0.1 0.3 0.2 -15 0.0 0.0 0.1 0.1 0.0 0.0 0.0 0.1 0.016 0.0 0.0 0.0 0.0 0.0 0.2 0.0 0.0 0.017 or older 0.0 0.0 0.0 0.0 0.2 0.7 0.0 0.2 0.1 -N of Valid 1292 1409 1000 677 449 421 2701 2547 5248N of Miss 127 81 95 93 41 49 208 278 486
Percentage Tables 272

Pride Surveys Report: 2017-18 Warren County
Table 4.163: At what age did you first use prescription drugs not prescribed to you?
RESPONSE 7th 8th 9th 10th 11th 12th 7-8th 9-12th TOTALNever used 98.4 97.4 97.3 95.9 94.1 94.8 97.9 95.9 96.9 -10 or under 0.9 0.8 0.3 0.6 0.4 0.7 0.9 0.5 0.7 -11 0.1 0.6 0.2 0.1 0.0 0.2 0.3 0.2 0.2 -12 0.5 0.5 0.2 0.0 0.4 0.2 0.5 0.2 0.4 -13 0.1 0.6 0.8 0.4 0.9 0.0 0.3 0.6 0.5 -14 0.0 0.1 1.1 1.5 0.7 0.5 0.1 1.0 0.5 -15 0.0 0.0 0.1 1.3 1.8 0.2 0.0 0.7 0.4 -16 0.0 0.0 0.0 0.1 1.3 1.9 0.0 0.6 0.3 -17 or older 0.0 0.0 0.0 0.0 0.4 1.4 0.0 0.3 0.2 -N of Valid 1291 1408 1000 681 457 422 2699 2560 5259N of Miss 128 82 95 89 33 48 210 265 475
Table 4.164: At what age did you first use over-the-counter drugs to get high?
RESPONSE 7th 8th 9th 10th 11th 12th 7-8th 9-12th TOTALNever used 99.9 99.2 98.8 98.5 98.2 97.4 99.6 98.4 99.0 -10 or under 0.0 0.1 0.1 0.6 0.2 0.5 0.0 0.3 0.2 -11 0.0 0.1 0.2 0.0 0.0 0.0 0.0 0.1 0.1 -12 0.1 0.1 0.1 0.0 0.2 0.2 0.1 0.1 0.1 -13 0.0 0.4 0.4 0.3 0.0 0.2 0.2 0.3 0.2 -14 0.0 0.1 0.4 0.1 0.2 0.2 0.1 0.3 0.2 -15 0.0 0.0 0.0 0.4 0.2 0.2 0.0 0.2 0.1 -16 0.0 0.0 0.0 0.0 0.7 0.5 0.0 0.2 0.1 -17 or older 0.0 0.0 0.0 0.0 0.2 0.7 0.0 0.2 0.1 -N of Valid 1291 1409 999 682 452 424 2700 2557 5257N of Miss 128 81 96 88 38 46 209 268 477
Percentage Tables 273

Pride Surveys Report: 2017-18 Warren County
Table 4.165: At what age did you first use heroin?
RESPONSE 7th 8th 9th 10th 11th 12th 7-8th 9-12th TOTALNever used 100.0 100.0 99.7 99.1 99.6 98.6 100.0 99.3 99.7 -10 or under 0.0 0.0 0.0 0.6 0.2 0.5 0.0 0.3 0.1 -11 0.0 0.0 0.1 0.0 0.0 0.0 0.0 0.0 0.012 0.0 0.0 0.0 0.0 0.0 0.0 0.0 0.0 0.013 0.0 0.0 0.1 0.1 0.0 0.0 0.0 0.1 0.014 0.0 0.0 0.0 0.0 0.0 0.0 0.0 0.0 0.015 0.0 0.0 0.1 0.0 0.0 0.0 0.0 0.0 0.016 0.0 0.0 0.0 0.1 0.0 0.2 0.0 0.1 0.017 or older 0.0 0.0 0.0 0.0 0.2 0.7 0.0 0.2 0.1 -N of Valid 1289 1404 1000 680 456 422 2693 2558 5251N of Miss 130 86 95 90 34 48 216 267 483
Table 4.166: At what age did you first use cocaine?
RESPONSE 7th 8th 9th 10th 11th 12th 7-8th 9-12th TOTALNever used 100.0 99.9 99.7 98.7 98.7 96.9 100.0 98.8 99.4 -10 or under 0.0 0.0 0.0 0.6 0.2 0.5 0.0 0.3 0.1 -11 0.0 0.0 0.0 0.1 0.0 0.0 0.0 0.0 0.012 0.0 0.1 0.0 0.0 0.0 0.0 0.0 0.0 0.013 0.0 0.0 0.0 0.1 0.0 0.0 0.0 0.0 0.014 0.0 0.0 0.2 0.1 0.0 0.0 0.0 0.1 0.1 -15 0.0 0.0 0.1 0.1 0.2 0.0 0.0 0.1 0.1 -16 0.0 0.0 0.0 0.1 0.4 0.7 0.0 0.2 0.1 -17 or older 0.0 0.0 0.0 0.0 0.4 1.9 0.0 0.4 0.2 -N of Valid 1289 1409 1003 682 449 425 2698 2559 5257N of Miss 130 81 92 88 41 45 211 266 477
Percentage Tables 274

Pride Surveys Report: 2017-18 Warren County
Table 4.167: At what age did you first use inhalants?
RESPONSE 7th 8th 9th 10th 11th 12th 7-8th 9-12th TOTALNever used 99.8 99.6 99.2 99.0 98.7 98.6 99.7 98.9 99.3 -10 or under 0.2 0.1 0.0 0.6 0.2 0.5 0.1 0.3 0.2 -11 0.0 0.1 0.2 0.0 0.2 0.0 0.0 0.1 0.1 -12 0.1 0.2 0.2 0.0 0.2 0.2 0.1 0.2 0.2 -13 0.0 0.1 0.2 0.0 0.2 0.0 0.0 0.1 0.1 -14 0.0 0.0 0.2 0.1 0.0 0.0 0.0 0.1 0.1 -15 0.0 0.0 0.0 0.3 0.0 0.2 0.0 0.1 0.1 -16 0.0 0.0 0.0 0.0 0.2 0.0 0.0 0.0 0.017 or older 0.0 0.0 0.0 0.0 0.2 0.5 0.0 0.1 0.1 -N of Valid 1290 1406 1004 679 450 426 2696 2559 5255N of Miss 129 84 91 91 40 44 213 266 479
Table 4.168: At what age did you first use hallucinogens?
RESPONSE 7th 8th 9th 10th 11th 12th 7-8th 9-12th TOTALNever used 99.9 99.7 99.0 97.4 98.2 96.9 99.8 98.1 99.0 -10 or under 0.0 0.0 0.1 0.9 0.2 0.5 0.0 0.4 0.2 -11 0.0 0.1 0.0 0.0 0.0 0.0 0.0 0.0 0.012 0.1 0.0 0.0 0.1 0.0 0.0 0.0 0.0 0.013 0.0 0.1 0.2 0.3 0.0 0.0 0.0 0.2 0.1 -14 0.0 0.1 0.6 0.7 0.2 0.0 0.1 0.5 0.3 -15 0.0 0.0 0.1 0.3 0.2 0.5 0.0 0.2 0.1 -16 0.0 0.0 0.0 0.3 0.2 0.7 0.0 0.2 0.1 -17 or older 0.0 0.0 0.0 0.0 0.9 1.4 0.0 0.4 0.2 -N of Valid 1288 1407 1003 681 446 426 2695 2556 5251N of Miss 131 83 92 89 44 44 214 269 483
Percentage Tables 275

Pride Surveys Report: 2017-18 Warren County
Table 4.169: At what age did you first use steroids?
RESPONSE 7th 8th 9th 10th 11th 12th 7-8th 9-12th TOTALNever used 99.5 99.7 99.8 98.1 98.5 98.1 99.6 98.8 99.2 -10 or under 0.1 0.1 0.0 1.0 0.2 0.7 0.1 0.4 0.2 -11 0.2 0.1 0.1 0.0 0.2 0.0 0.1 0.1 0.1 -12 0.2 0.0 0.0 0.1 0.0 0.0 0.1 0.0 0.1 -13 0.1 0.1 0.0 0.0 0.4 0.0 0.1 0.1 0.1 -14 0.0 0.1 0.1 0.6 0.0 0.0 0.0 0.2 0.1 -15 0.0 0.0 0.0 0.1 0.4 0.2 0.0 0.2 0.1 -16 0.0 0.0 0.0 0.0 0.0 0.0 0.0 0.0 0.017 or older 0.0 0.0 0.0 0.0 0.2 0.9 0.0 0.2 0.1 -N of Valid 1290 1407 1002 682 454 425 2697 2563 5260N of Miss 129 83 93 88 36 45 212 262 474
Table 4.170: At what age did you first use ecstasy?
RESPONSE 7th 8th 9th 10th 11th 12th 7-8th 9-12th TOTALNever used 99.9 99.9 99.6 98.7 99.3 97.9 99.9 99.0 99.5 -10 or under 0.0 0.0 0.1 0.6 0.2 0.5 0.0 0.3 0.2 -11 0.0 0.0 0.0 0.0 0.0 0.0 0.0 0.0 0.012 0.1 0.0 0.0 0.1 0.0 0.0 0.0 0.0 0.013 0.0 0.0 0.1 0.0 0.0 0.0 0.0 0.0 0.014 0.0 0.0 0.2 0.3 0.0 0.2 0.0 0.2 0.1 -15 0.0 0.0 0.0 0.1 0.0 0.0 0.0 0.0 0.016 0.0 0.1 0.0 0.1 0.2 0.7 0.0 0.2 0.1 -17 or older 0.0 0.0 0.0 0.0 0.2 0.7 0.0 0.2 0.1 -N of Valid 1289 1410 1003 677 449 425 2699 2554 5253N of Miss 130 80 92 93 41 45 210 271 481
Percentage Tables 276

Pride Surveys Report: 2017-18 Warren County
Table 4.171: At what age did you first use meth?
RESPONSE 7th 8th 9th 10th 11th 12th 7-8th 9-12th TOTALNever used 99.9 99.9 99.7 99.1 99.6 98.6 99.9 99.3 99.6 -10 or under 0.1 0.0 0.0 0.7 0.0 0.5 0.0 0.3 0.2 -11 0.0 0.0 0.1 0.0 0.0 0.0 0.0 0.0 0.012 0.0 0.0 0.0 0.0 0.0 0.0 0.0 0.0 0.013 0.0 0.1 0.1 0.0 0.0 0.0 0.0 0.0 0.014 0.0 0.0 0.0 0.0 0.0 0.0 0.0 0.0 0.015 0.0 0.0 0.0 0.1 0.2 0.0 0.0 0.1 0.016 0.0 0.0 0.0 0.0 0.0 0.0 0.0 0.0 0.017 or older 0.0 0.0 0.1 0.0 0.2 0.9 0.0 0.2 0.1 -N of Valid 1289 1408 995 676 451 424 2697 2546 5243N of Miss 130 82 100 94 39 46 212 279 491
Table 4.172: At what age did you first use any tobacco?
RESPONSE 7th 8th 9th 10th 11th 12th 7-8th 9-12th TOTALNever used 97.0 93.0 89.0 85.9 82.4 72.9 94.9 84.3 89.8 -10 or under 1.5 1.6 1.8 2.5 1.8 1.2 1.5 1.9 1.7 -11 0.9 1.3 1.7 0.7 0.7 2.8 1.1 1.5 1.3 -12 0.5 1.3 1.5 1.3 1.1 1.9 0.9 1.5 1.2 -13 0.2 2.3 2.7 0.9 2.2 0.5 1.3 1.8 1.5 -14 0.0 0.4 2.5 4.6 1.6 2.1 0.2 2.8 1.5 -15 0.0 0.1 0.8 3.4 4.7 4.7 0.0 2.8 1.4 -16 0.0 0.0 0.0 0.6 4.7 6.1 0.0 2.0 1.0 -17 or older 0.0 0.0 0.0 0.0 0.9 7.8 0.0 1.5 0.7 -N of Valid 1290 1409 1001 674 448 425 2699 2548 5247N of Miss 129 81 94 96 42 45 210 277 487
Percentage Tables 277

Pride Surveys Report: 2017-18 Warren County
Table 4.173: At what age did you first use any alcohol?
RESPONSE 7th 8th 9th 10th 11th 12th 7-8th 9-12th TOTALNever used 89.5 80.2 74.4 63.4 53.7 43.6 84.6 62.7 73.9 -10 or under 4.6 5.9 4.5 3.4 3.5 2.4 5.3 3.7 4.5 -11 1.9 2.8 1.9 2.2 1.5 0.7 2.4 1.7 2.1 -12 3.0 4.1 3.0 2.1 1.8 2.8 3.6 2.5 3.0 -13 0.5 5.9 6.2 4.3 3.9 4.7 3.3 5.1 4.2 -14 0.1 1.0 8.1 10.6 6.6 5.7 0.6 8.1 4.2 -15 0.0 0.0 1.8 11.5 14.0 10.6 0.0 8.0 3.9 -16 0.1 0.0 0.1 2.5 13.4 17.7 0.0 6.0 2.9 -17 or older 0.4 0.1 0.0 0.0 1.5 11.8 0.2 2.2 1.2 -N of Valid 1285 1404 1008 678 456 424 2689 2566 5255N of Miss 134 86 87 92 34 46 220 259 479
Table 4.174: At what age did you first use any illicit drug?
RESPONSE 7th 8th 9th 10th 11th 12th 7-8th 9-12th TOTALNever used 96.0 91.7 86.9 81.3 70.6 66.3 93.8 79.1 86.7 -10 or under 1.8 1.4 0.9 2.0 0.9 1.4 1.6 1.3 1.4 -11 0.9 1.2 1.2 0.8 0.5 0.5 1.0 0.8 0.9 -12 1.1 1.7 1.6 0.8 1.8 1.9 1.4 1.5 1.5 -13 0.2 3.3 2.7 2.0 3.8 1.0 1.8 2.4 2.1 -14 0.0 0.5 5.1 5.6 3.6 3.3 0.3 4.7 2.4 -15 0.0 0.1 1.3 7.1 7.9 6.5 0.0 4.9 2.4 -16 0.0 0.1 0.1 0.6 9.3 13.4 0.0 4.1 2.0 -17 or older 0.0 0.0 0.1 0.0 1.6 5.7 0.0 1.3 0.6 -N of Valid 1276 1392 977 664 442 418 2668 2501 5169N of Miss 143 98 118 106 48 52 241 324 565
Percentage Tables 278

Pride Surveys Report: 2017-18 Warren County
4.14 Where Do You Usually Use...
Table 4.175: Where do you usually smoke cigarettes?
RESPONSE 7th 8th 9th 10th 11th 12th 7-8th 9-12th TOTALDo not use 88.9 89.9 86.0 82.2 84.7 80.9 89.4 83.9 86.7 -At home 0.5 2.2 2.4 2.7 1.8 3.2 1.4 2.5 1.9 -At school 0.1 0.0 0.2 0.5 0.6 0.4 0.0 0.4 0.2 -In a car 0.1 0.4 0.8 1.3 2.2 3.8 0.2 1.7 1.0 -Friend’s house 0.7 2.1 2.8 2.6 3.5 4.9 1.4 3.2 2.3 -Parties 0.2 0.7 1.6 1.8 2.9 5.1 0.5 2.4 1.4 -Other 0.7 1.6 1.6 1.0 2.0 2.1 1.2 1.6 1.4 -N of Valid 1419 1490 1095 770 490 470 2909 2825 5734N of Miss 0 0 0 0 0 0 0 0 0
Table 4.176: Where do you usually use smokeless tobacco?
RESPONSE 7th 8th 9th 10th 11th 12th 7-8th 9-12th TOTALDo not use 89.9 92.0 87.9 83.6 88.2 81.7 91.0 85.7 88.4 -At home 0.1 0.9 1.6 1.6 1.6 1.9 0.5 1.6 1.0 -At school 0.1 0.2 0.5 0.6 0.2 0.6 0.1 0.5 0.3 -In a car 0.0 0.3 0.7 1.0 1.0 2.8 0.2 1.2 0.7 -Friend’s house 0.2 1.1 1.7 1.9 1.8 3.2 0.7 2.1 1.3 -Parties 0.1 0.8 0.7 1.0 0.4 3.6 0.4 1.2 0.8 -Other 0.3 0.6 1.1 1.3 1.2 3.0 0.4 1.5 1.0 -N of Valid 1419 1490 1095 770 490 470 2909 2825 5734N of Miss 0 0 0 0 0 0 0 0 0
Percentage Tables 279

Pride Surveys Report: 2017-18 Warren County
Table 4.177: Where do you usually smoke cigars?
RESPONSE 7th 8th 9th 10th 11th 12th 7-8th 9-12th TOTALDo not use 89.4 92.1 88.2 83.1 85.7 75.5 90.8 84.3 87.6 -At home 0.3 0.7 0.5 2.1 2.0 2.8 0.5 1.6 1.0 -At school 0.1 0.1 0.5 0.6 0.0 0.4 0.1 0.5 0.3 -In a car 0.0 0.2 0.6 1.0 1.6 2.8 0.1 1.3 0.7 -Friend’s house 0.2 0.9 1.3 2.3 2.2 6.4 0.6 2.6 1.6 -Parties 0.1 0.3 0.2 1.2 1.6 5.5 0.2 1.6 0.9 -Other 0.4 0.6 1.3 0.6 1.0 3.0 0.5 1.3 0.9 -N of Valid 1419 1490 1095 770 490 470 2909 2825 5734N of Miss 0 0 0 0 0 0 0 0 0
Table 4.178: Where do you usually use electronic vapor products?
RESPONSE 7th 8th 9th 10th 11th 12th 7-8th 9-12th TOTALDo not use 86.0 83.4 76.0 69.5 66.3 60.0 84.7 69.9 77.4 -At home 2.1 4.6 7.4 9.0 11.4 13.8 3.4 9.6 6.4 -At school 0.0 0.3 2.2 3.2 5.3 6.0 0.2 3.6 1.9 -In a car 0.6 1.9 4.5 7.1 13.7 17.7 1.3 9.0 5.1 -Friend’s house 2.0 6.1 9.7 11.8 16.7 17.9 4.1 12.8 8.4 -Parties 1.1 3.4 5.8 7.7 12.7 13.2 2.3 8.7 5.5 -Other 1.6 3.3 3.7 2.6 5.9 6.8 2.4 4.3 3.3 -N of Valid 1419 1490 1095 770 490 470 2909 2825 5734N of Miss 0 0 0 0 0 0 0 0 0
Percentage Tables 280

Pride Surveys Report: 2017-18 Warren County
Table 4.179: Where do you usually drink beer?
RESPONSE 7th 8th 9th 10th 11th 12th 7-8th 9-12th TOTALDo not use 86.5 85.1 77.8 67.7 63.1 51.9 85.8 68.2 77.1 -At home 2.7 5.6 6.4 9.9 11.2 14.7 4.2 9.6 6.8 -At school 0.1 0.1 0.4 0.8 0.0 1.3 0.1 0.6 0.3 -In a car 0.0 0.3 0.5 1.0 1.0 1.1 0.1 0.8 0.5 -Friend’s house 0.9 4.2 6.8 10.1 15.5 21.7 2.6 11.7 7.1 -Parties 1.0 2.9 4.8 8.3 16.1 23.6 2.0 10.9 6.3 -Other 0.8 1.7 1.8 1.9 2.4 4.5 1.2 2.4 1.8 -N of Valid 1419 1490 1095 770 490 470 2909 2825 5734N of Miss 0 0 0 0 0 0 0 0 0
Table 4.180: Where do you usually drink coolers, hard lemonade, etc.?
RESPONSE 7th 8th 9th 10th 11th 12th 7-8th 9-12th TOTALDo not use 87.7 88.1 80.2 69.6 64.9 54.3 87.9 70.3 79.3 -At home 1.3 3.4 5.1 7.8 10.0 14.5 2.4 8.2 5.3 -At school 0.0 0.0 0.4 0.4 0.0 0.6 0.0 0.4 0.2 -In a car 0.0 0.2 0.5 0.9 1.0 0.9 0.1 0.8 0.4 -Friend’s house 0.8 2.6 4.9 9.1 13.7 19.4 1.8 10.0 5.8 -Parties 0.8 2.0 3.8 8.3 14.7 20.6 1.4 9.7 5.5 -Other 0.3 0.7 1.5 1.7 2.9 3.2 0.5 2.1 1.3 -N of Valid 1419 1490 1095 770 490 470 2909 2825 5734N of Miss 0 0 0 0 0 0 0 0 0
Percentage Tables 281
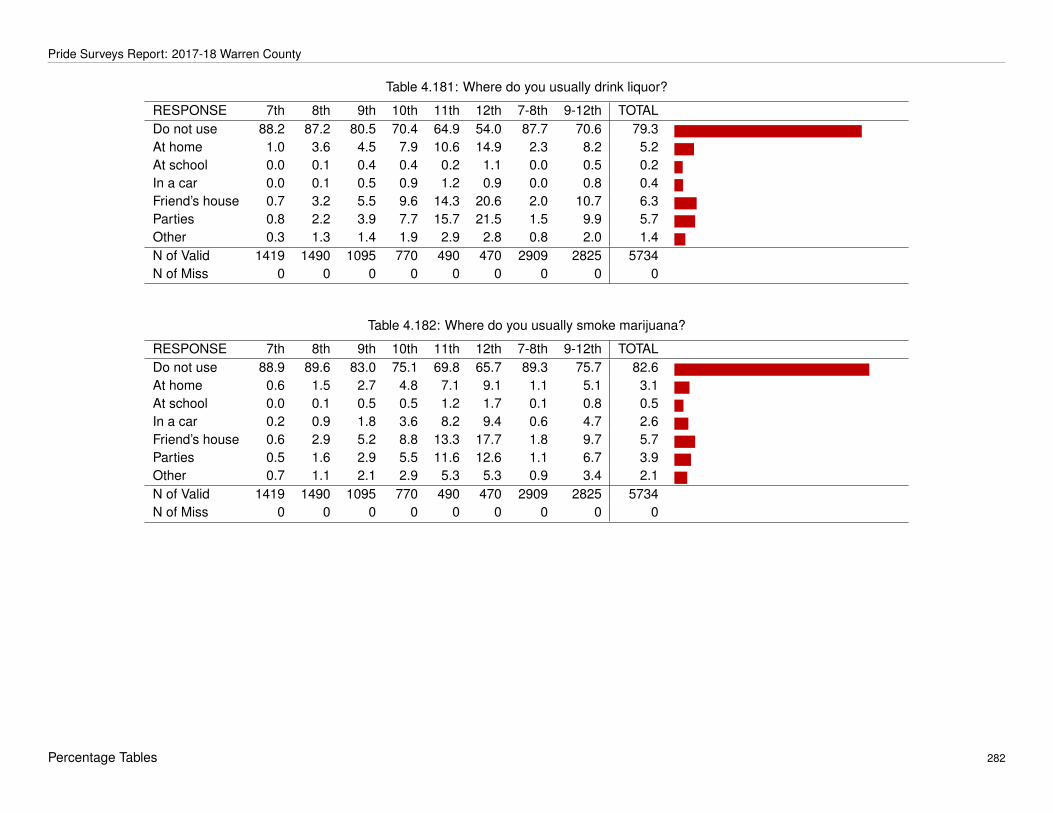
Pride Surveys Report: 2017-18 Warren County
Table 4.181: Where do you usually drink liquor?
RESPONSE 7th 8th 9th 10th 11th 12th 7-8th 9-12th TOTALDo not use 88.2 87.2 80.5 70.4 64.9 54.0 87.7 70.6 79.3 -At home 1.0 3.6 4.5 7.9 10.6 14.9 2.3 8.2 5.2 -At school 0.0 0.1 0.4 0.4 0.2 1.1 0.0 0.5 0.2 -In a car 0.0 0.1 0.5 0.9 1.2 0.9 0.0 0.8 0.4 -Friend’s house 0.7 3.2 5.5 9.6 14.3 20.6 2.0 10.7 6.3 -Parties 0.8 2.2 3.9 7.7 15.7 21.5 1.5 9.9 5.7 -Other 0.3 1.3 1.4 1.9 2.9 2.8 0.8 2.0 1.4 -N of Valid 1419 1490 1095 770 490 470 2909 2825 5734N of Miss 0 0 0 0 0 0 0 0 0
Table 4.182: Where do you usually smoke marijuana?
RESPONSE 7th 8th 9th 10th 11th 12th 7-8th 9-12th TOTALDo not use 88.9 89.6 83.0 75.1 69.8 65.7 89.3 75.7 82.6 -At home 0.6 1.5 2.7 4.8 7.1 9.1 1.1 5.1 3.1 -At school 0.0 0.1 0.5 0.5 1.2 1.7 0.1 0.8 0.5 -In a car 0.2 0.9 1.8 3.6 8.2 9.4 0.6 4.7 2.6 -Friend’s house 0.6 2.9 5.2 8.8 13.3 17.7 1.8 9.7 5.7 -Parties 0.5 1.6 2.9 5.5 11.6 12.6 1.1 6.7 3.9 -Other 0.7 1.1 2.1 2.9 5.3 5.3 0.9 3.4 2.1 -N of Valid 1419 1490 1095 770 490 470 2909 2825 5734N of Miss 0 0 0 0 0 0 0 0 0
Percentage Tables 282

Pride Surveys Report: 2017-18 Warren County
Table 4.183: Where do you usually use synthetic marijuana?
RESPONSE 7th 8th 9th 10th 11th 12th 7-8th 9-12th TOTALDo not use 89.7 92.8 89.2 85.2 87.8 85.5 91.3 87.3 89.3 -At home 0.2 0.3 0.5 0.8 0.6 0.4 0.2 0.6 0.4 -At school 0.0 0.0 0.2 0.3 0.0 0.4 0.0 0.2 0.1 -In a car 0.1 0.2 0.3 0.3 0.4 0.2 0.2 0.3 0.2 -Friend’s house 0.2 0.5 1.1 1.2 1.2 1.5 0.4 1.2 0.8 -Parties 0.1 0.4 0.5 0.9 1.2 1.5 0.2 0.9 0.6 -Other 0.1 0.3 0.5 0.3 0.6 1.1 0.2 0.5 0.4 -N of Valid 1419 1490 1095 770 490 470 2909 2825 5734N of Miss 0 0 0 0 0 0 0 0 0
Table 4.184: Where do you usually use chemical products (bath salts) to get high?
RESPONSE 7th 8th 9th 10th 11th 12th 7-8th 9-12th TOTALDo not use 89.5 92.6 90.2 85.5 90.0 87.4 91.1 88.4 89.8 -At home 0.0 0.1 0.3 0.5 0.2 0.0 0.1 0.3 0.2 -At school 0.0 0.1 0.1 0.1 0.0 0.4 0.0 0.1 0.1 -In a car 0.0 0.0 0.1 0.1 0.0 0.0 0.0 0.1 0.0Friend’s house 0.0 0.1 0.2 0.4 0.0 0.0 0.1 0.2 0.1 -Parties 0.0 0.1 0.1 0.1 0.0 0.6 0.1 0.2 0.1 -Other 0.1 0.3 0.2 0.3 0.4 0.9 0.2 0.4 0.3 -N of Valid 1419 1490 1095 770 490 470 2909 2825 5734N of Miss 0 0 0 0 0 0 0 0 0
Percentage Tables 283

Pride Surveys Report: 2017-18 Warren County
Table 4.185: Where do you usually use prescription drugs not prescribed to you?
RESPONSE 7th 8th 9th 10th 11th 12th 7-8th 9-12th TOTALDo not use 88.6 91.4 89.3 84.0 88.0 85.7 90.0 87.0 88.6 -At home 1.3 2.0 1.6 1.8 2.7 2.1 1.7 1.9 1.8 -At school 0.0 0.0 0.5 0.8 0.6 1.1 0.0 0.7 0.3 -In a car 0.3 0.1 0.1 1.0 0.4 0.2 0.2 0.4 0.3 -Friend’s house 0.1 0.5 0.5 1.0 0.6 0.6 0.3 0.7 0.5 -Parties 0.1 0.1 0.1 0.4 0.4 0.9 0.1 0.4 0.2 -Other 0.4 0.2 0.6 0.5 0.6 1.1 0.3 0.7 0.5 -N of Valid 1419 1490 1095 770 490 470 2909 2825 5734N of Miss 0 0 0 0 0 0 0 0 0
Table 4.186: Where do you usually use over-the-counter drugs to get high?
RESPONSE 7th 8th 9th 10th 11th 12th 7-8th 9-12th TOTALDo not use 89.9 93.2 90.6 85.6 89.8 87.0 91.6 88.5 90.1 -At home 0.0 0.8 0.5 0.5 0.6 1.1 0.4 0.6 0.5 -At school 0.0 0.1 0.4 0.4 0.0 0.2 0.0 0.3 0.2 -In a car 0.0 0.1 0.2 0.3 0.2 0.0 0.0 0.2 0.1 -Friend’s house 0.0 0.2 0.2 0.5 0.2 0.2 0.1 0.3 0.2 -Parties 0.0 0.1 0.2 0.3 0.4 0.4 0.1 0.3 0.2 -Other 0.1 0.1 0.4 0.3 0.4 0.6 0.1 0.4 0.2 -N of Valid 1419 1490 1095 770 490 470 2909 2825 5734N of Miss 0 0 0 0 0 0 0 0 0
Percentage Tables 284

Pride Surveys Report: 2017-18 Warren County
Table 4.187: Where do you usually use heroin?
RESPONSE 7th 8th 9th 10th 11th 12th 7-8th 9-12th TOTALDo not use 90.1 94.0 91.3 86.6 90.2 87.4 92.1 89.2 90.7 -At home 0.0 0.1 0.1 0.4 0.2 0.0 0.0 0.2 0.1 -At school 0.0 0.0 0.1 0.3 0.2 0.4 0.0 0.2 0.1 -In a car 0.0 0.1 0.0 0.3 0.2 0.0 0.0 0.1 0.1 -Friend’s house 0.0 0.1 0.2 0.3 0.2 0.0 0.0 0.2 0.1 -Parties 0.0 0.1 0.0 0.3 0.2 0.4 0.0 0.2 0.1 -Other 0.1 0.0 0.3 0.3 0.6 0.9 0.0 0.4 0.2 -N of Valid 1419 1490 1095 770 490 470 2909 2825 5734N of Miss 0 0 0 0 0 0 0 0 0
Table 4.188: Where do you usually use cocaine?
RESPONSE 7th 8th 9th 10th 11th 12th 7-8th 9-12th TOTALDo not use 90.1 93.9 90.7 86.6 89.6 86.0 92.0 88.6 90.3 -At home 0.0 0.1 0.3 0.4 0.0 0.4 0.0 0.3 0.2 -At school 0.0 0.0 0.1 0.6 0.0 0.4 0.0 0.3 0.1 -In a car 0.0 0.1 0.2 0.4 0.0 0.2 0.0 0.2 0.1 -Friend’s house 0.0 0.1 0.1 0.5 0.4 0.6 0.0 0.4 0.2 -Parties 0.0 0.1 0.0 0.4 0.4 1.1 0.1 0.4 0.2 -Other 0.1 0.0 0.3 0.3 0.4 1.1 0.0 0.4 0.2 -N of Valid 1419 1490 1095 770 490 470 2909 2825 5734N of Miss 0 0 0 0 0 0 0 0 0
Percentage Tables 285
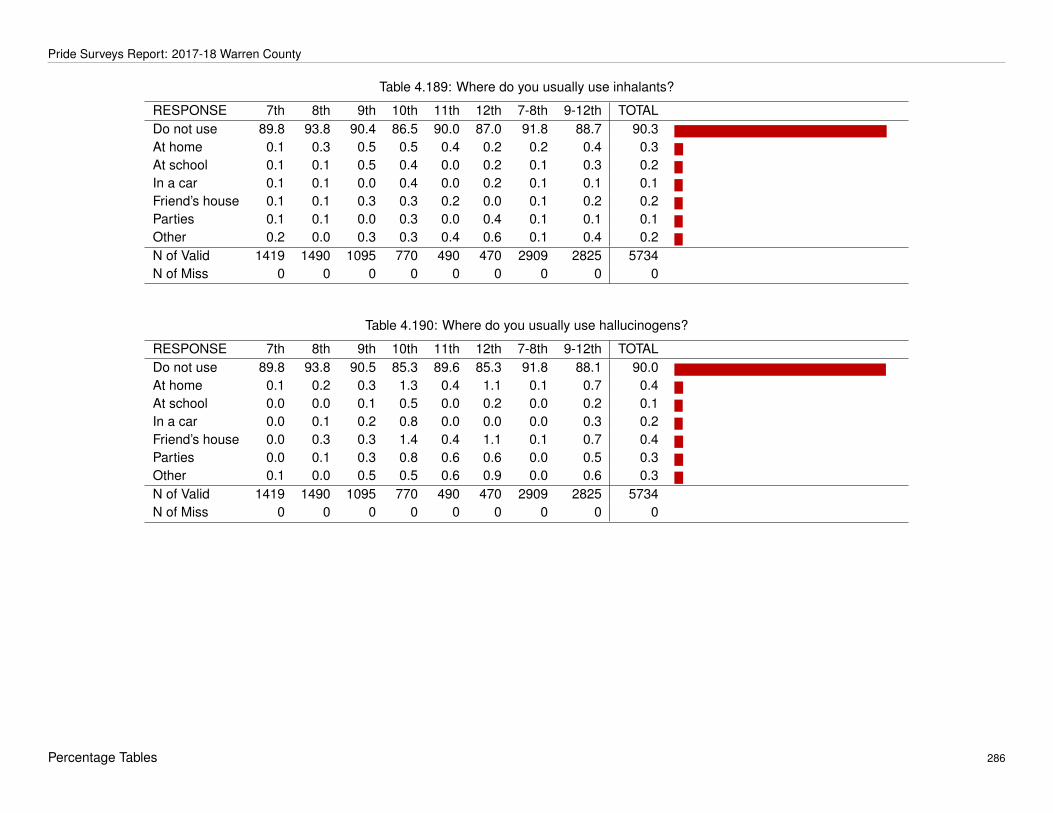
Pride Surveys Report: 2017-18 Warren County
Table 4.189: Where do you usually use inhalants?
RESPONSE 7th 8th 9th 10th 11th 12th 7-8th 9-12th TOTALDo not use 89.8 93.8 90.4 86.5 90.0 87.0 91.8 88.7 90.3 -At home 0.1 0.3 0.5 0.5 0.4 0.2 0.2 0.4 0.3 -At school 0.1 0.1 0.5 0.4 0.0 0.2 0.1 0.3 0.2 -In a car 0.1 0.1 0.0 0.4 0.0 0.2 0.1 0.1 0.1 -Friend’s house 0.1 0.1 0.3 0.3 0.2 0.0 0.1 0.2 0.2 -Parties 0.1 0.1 0.0 0.3 0.0 0.4 0.1 0.1 0.1 -Other 0.2 0.0 0.3 0.3 0.4 0.6 0.1 0.4 0.2 -N of Valid 1419 1490 1095 770 490 470 2909 2825 5734N of Miss 0 0 0 0 0 0 0 0 0
Table 4.190: Where do you usually use hallucinogens?
RESPONSE 7th 8th 9th 10th 11th 12th 7-8th 9-12th TOTALDo not use 89.8 93.8 90.5 85.3 89.6 85.3 91.8 88.1 90.0 -At home 0.1 0.2 0.3 1.3 0.4 1.1 0.1 0.7 0.4 -At school 0.0 0.0 0.1 0.5 0.0 0.2 0.0 0.2 0.1 -In a car 0.0 0.1 0.2 0.8 0.0 0.0 0.0 0.3 0.2 -Friend’s house 0.0 0.3 0.3 1.4 0.4 1.1 0.1 0.7 0.4 -Parties 0.0 0.1 0.3 0.8 0.6 0.6 0.0 0.5 0.3 -Other 0.1 0.0 0.5 0.5 0.6 0.9 0.0 0.6 0.3 -N of Valid 1419 1490 1095 770 490 470 2909 2825 5734N of Miss 0 0 0 0 0 0 0 0 0
Percentage Tables 286
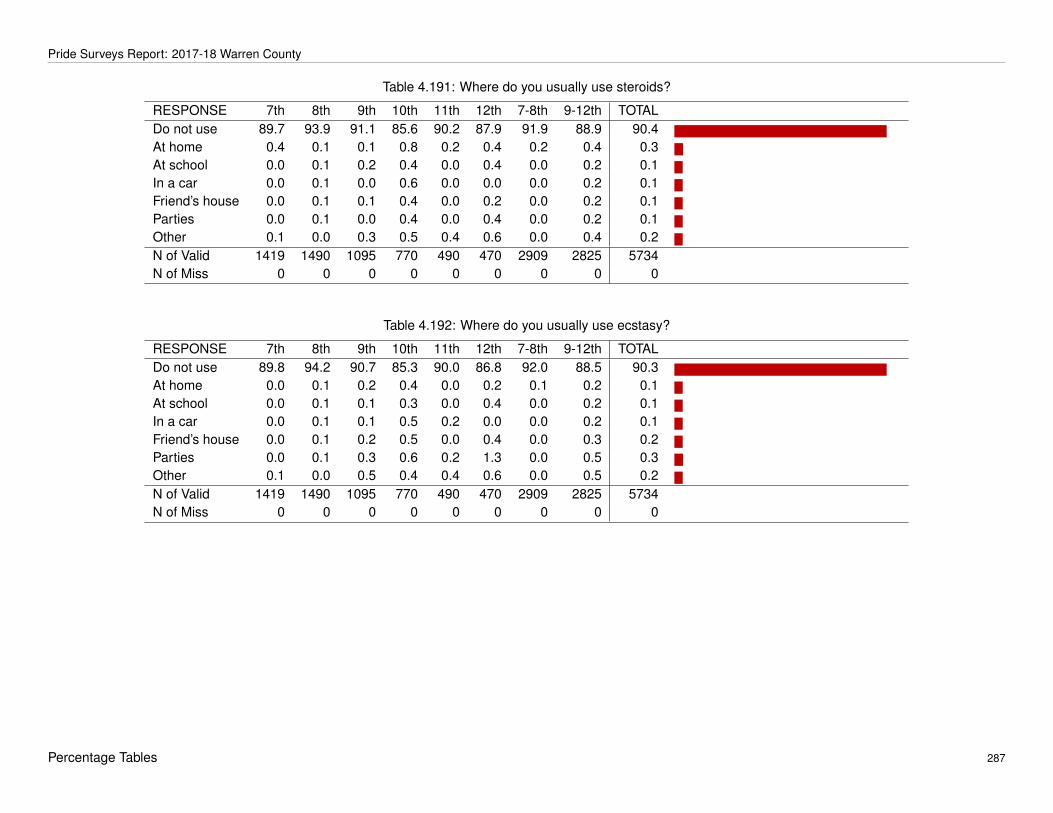
Pride Surveys Report: 2017-18 Warren County
Table 4.191: Where do you usually use steroids?
RESPONSE 7th 8th 9th 10th 11th 12th 7-8th 9-12th TOTALDo not use 89.7 93.9 91.1 85.6 90.2 87.9 91.9 88.9 90.4 -At home 0.4 0.1 0.1 0.8 0.2 0.4 0.2 0.4 0.3 -At school 0.0 0.1 0.2 0.4 0.0 0.4 0.0 0.2 0.1 -In a car 0.0 0.1 0.0 0.6 0.0 0.0 0.0 0.2 0.1 -Friend’s house 0.0 0.1 0.1 0.4 0.0 0.2 0.0 0.2 0.1 -Parties 0.0 0.1 0.0 0.4 0.0 0.4 0.0 0.2 0.1 -Other 0.1 0.0 0.3 0.5 0.4 0.6 0.0 0.4 0.2 -N of Valid 1419 1490 1095 770 490 470 2909 2825 5734N of Miss 0 0 0 0 0 0 0 0 0
Table 4.192: Where do you usually use ecstasy?
RESPONSE 7th 8th 9th 10th 11th 12th 7-8th 9-12th TOTALDo not use 89.8 94.2 90.7 85.3 90.0 86.8 92.0 88.5 90.3 -At home 0.0 0.1 0.2 0.4 0.0 0.2 0.1 0.2 0.1 -At school 0.0 0.1 0.1 0.3 0.0 0.4 0.0 0.2 0.1 -In a car 0.0 0.1 0.1 0.5 0.2 0.0 0.0 0.2 0.1 -Friend’s house 0.0 0.1 0.2 0.5 0.0 0.4 0.0 0.3 0.2 -Parties 0.0 0.1 0.3 0.6 0.2 1.3 0.0 0.5 0.3 -Other 0.1 0.0 0.5 0.4 0.4 0.6 0.0 0.5 0.2 -N of Valid 1419 1490 1095 770 490 470 2909 2825 5734N of Miss 0 0 0 0 0 0 0 0 0
Percentage Tables 287

Pride Surveys Report: 2017-18 Warren County
Table 4.193: Where do you usually use meth?
RESPONSE 7th 8th 9th 10th 11th 12th 7-8th 9-12th TOTALDo not use 89.9 94.0 89.3 85.8 88.8 87.4 92.0 88.0 90.0 -At home 0.1 0.1 0.1 0.3 0.4 0.2 0.1 0.2 0.2 -At school 0.0 0.1 0.2 0.3 0.2 0.4 0.0 0.2 0.1 -In a car 0.0 0.1 0.0 0.4 0.2 0.2 0.0 0.2 0.1 -Friend’s house 0.0 0.1 0.0 0.3 0.2 0.2 0.0 0.1 0.1 -Parties 0.0 0.1 0.0 0.3 0.2 0.6 0.0 0.2 0.1 -Other 0.1 0.1 0.4 0.3 0.8 1.1 0.1 0.5 0.3 -N of Valid 1419 1490 1095 770 490 470 2909 2825 5734N of Miss 0 0 0 0 0 0 0 0 0
Table 4.194: Where do you usually use any tobacco?
RESPONSE 7th 8th 9th 10th 11th 12th 7-8th 9-12th TOTALDo not use 90.1 93.4 90.8 86.5 90.0 86.6 91.8 88.8 90.3 -At home 0.8 2.8 3.0 4.4 4.3 6.4 1.8 4.2 3.0 -At school 0.1 0.3 0.6 0.8 0.6 0.6 0.2 0.7 0.4 -In a car 0.1 0.7 1.5 2.5 3.5 7.7 0.4 3.1 1.7 -Friend’s house 0.7 2.7 3.7 4.8 5.5 10.6 1.7 5.5 3.6 -Parties 0.3 1.2 1.8 2.5 3.3 10.0 0.8 3.6 2.2 -Other 0.8 1.9 2.4 2.1 2.9 5.5 1.4 2.9 2.1 -N of Valid 1419 1490 1095 770 490 470 2909 2825 5734N of Miss 0 0 0 0 0 0 0 0 0
Percentage Tables 288

Pride Surveys Report: 2017-18 Warren County
Table 4.195: Where do you usually use any alcohol?
RESPONSE 7th 8th 9th 10th 11th 12th 7-8th 9-12th TOTALDo not use 89.3 90.5 84.5 76.1 72.2 60.2 89.9 76.0 83.1 -At home 3.3 7.0 8.1 12.9 15.7 19.6 5.2 12.6 8.9 -At school 0.1 0.1 0.5 0.9 0.2 1.5 0.1 0.7 0.4 -In a car 0.0 0.3 0.7 1.4 1.4 1.5 0.2 1.2 0.7 -Friend’s house 1.2 5.0 7.9 13.6 19.2 24.3 3.2 14.2 8.6 -Parties 1.6 3.7 5.8 10.8 19.2 25.1 2.6 12.7 7.6 -Other 1.1 2.1 2.6 2.6 4.1 4.7 1.6 3.2 2.4 -N of Valid 1419 1490 1095 770 490 470 2909 2825 5734N of Miss 0 0 0 0 0 0 0 0 0
Table 4.196: Where do you usually use any illicit drug?
RESPONSE 7th 8th 9th 10th 11th 12th 7-8th 9-12th TOTALDo not use 90.3 94.2 92.2 87.4 92.4 89.1 92.3 90.4 91.4 -At home 2.4 4.2 4.8 6.6 10.6 11.7 3.3 7.5 5.4 -At school 0.1 0.3 1.2 1.4 2.2 2.3 0.2 1.6 0.9 -In a car 0.6 1.0 2.2 4.4 8.8 9.6 0.8 5.2 3.0 -Friend’s house 0.8 3.3 6.0 9.4 14.1 18.3 2.1 10.4 6.2 -Parties 0.8 1.7 3.2 6.0 12.2 13.2 1.2 7.2 4.2 -Other 1.2 1.7 2.9 3.6 5.9 6.4 1.4 4.2 2.8 -N of Valid 1419 1490 1095 770 490 470 2909 2825 5734N of Miss 0 0 0 0 0 0 0 0 0
Percentage Tables 289
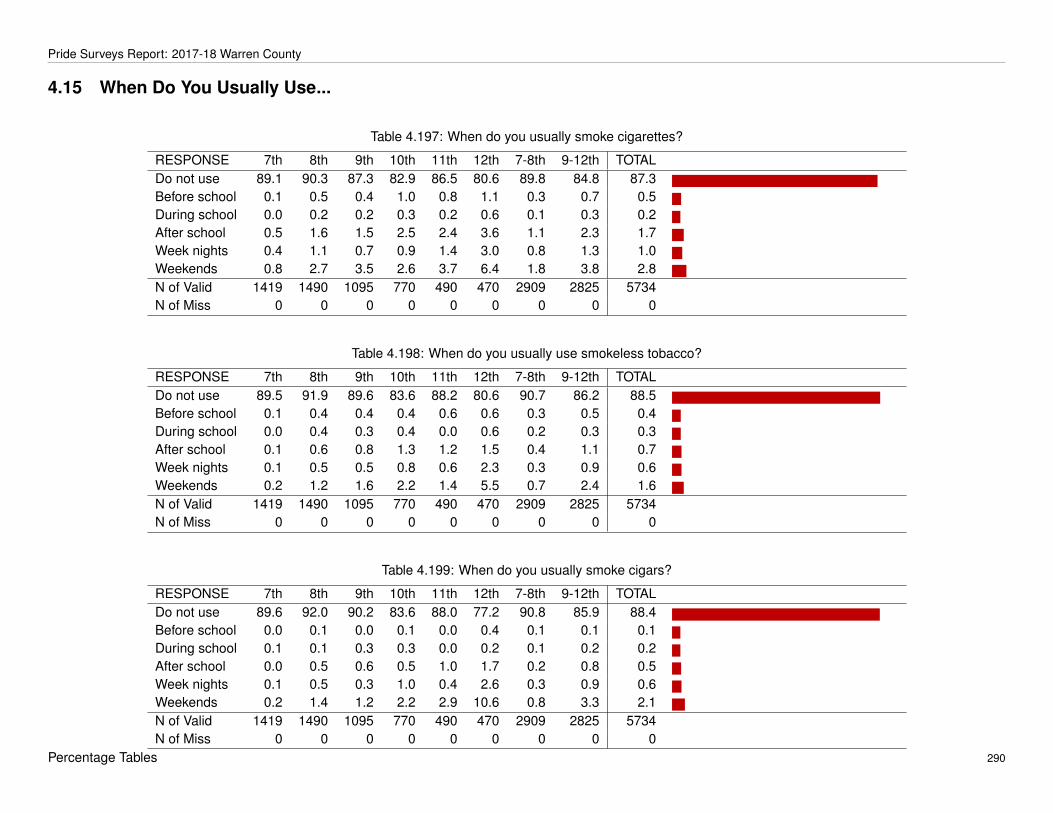
Pride Surveys Report: 2017-18 Warren County
4.15 When Do You Usually Use...
Table 4.197: When do you usually smoke cigarettes?
RESPONSE 7th 8th 9th 10th 11th 12th 7-8th 9-12th TOTALDo not use 89.1 90.3 87.3 82.9 86.5 80.6 89.8 84.8 87.3 -Before school 0.1 0.5 0.4 1.0 0.8 1.1 0.3 0.7 0.5 -During school 0.0 0.2 0.2 0.3 0.2 0.6 0.1 0.3 0.2 -After school 0.5 1.6 1.5 2.5 2.4 3.6 1.1 2.3 1.7 -Week nights 0.4 1.1 0.7 0.9 1.4 3.0 0.8 1.3 1.0 -Weekends 0.8 2.7 3.5 2.6 3.7 6.4 1.8 3.8 2.8 -N of Valid 1419 1490 1095 770 490 470 2909 2825 5734N of Miss 0 0 0 0 0 0 0 0 0
Table 4.198: When do you usually use smokeless tobacco?
RESPONSE 7th 8th 9th 10th 11th 12th 7-8th 9-12th TOTALDo not use 89.5 91.9 89.6 83.6 88.2 80.6 90.7 86.2 88.5 -Before school 0.1 0.4 0.4 0.4 0.6 0.6 0.3 0.5 0.4 -During school 0.0 0.4 0.3 0.4 0.0 0.6 0.2 0.3 0.3 -After school 0.1 0.6 0.8 1.3 1.2 1.5 0.4 1.1 0.7 -Week nights 0.1 0.5 0.5 0.8 0.6 2.3 0.3 0.9 0.6 -Weekends 0.2 1.2 1.6 2.2 1.4 5.5 0.7 2.4 1.6 -N of Valid 1419 1490 1095 770 490 470 2909 2825 5734N of Miss 0 0 0 0 0 0 0 0 0
Table 4.199: When do you usually smoke cigars?
RESPONSE 7th 8th 9th 10th 11th 12th 7-8th 9-12th TOTALDo not use 89.6 92.0 90.2 83.6 88.0 77.2 90.8 85.9 88.4 -Before school 0.0 0.1 0.0 0.1 0.0 0.4 0.1 0.1 0.1 -During school 0.1 0.1 0.3 0.3 0.0 0.2 0.1 0.2 0.2 -After school 0.0 0.5 0.6 0.5 1.0 1.7 0.2 0.8 0.5 -Week nights 0.1 0.5 0.3 1.0 0.4 2.6 0.3 0.9 0.6 -Weekends 0.2 1.4 1.2 2.2 2.9 10.6 0.8 3.3 2.1 -N of Valid 1419 1490 1095 770 490 470 2909 2825 5734N of Miss 0 0 0 0 0 0 0 0 0
Percentage Tables 290

Pride Surveys Report: 2017-18 Warren County
Table 4.200: When do you usually use electronic vapor products?
RESPONSE 7th 8th 9th 10th 11th 12th 7-8th 9-12th TOTALDo not use 86.5 85.4 78.9 71.9 69.8 62.6 85.9 72.7 79.4 -Before school 0.6 0.9 1.6 3.9 5.1 6.0 0.8 3.6 2.1 -During school 0.1 0.2 1.3 2.9 4.1 4.9 0.2 2.8 1.5 -After school 1.5 3.3 5.8 7.3 12.9 14.9 2.4 8.9 5.6 -Week nights 1.2 1.9 3.5 5.6 9.4 12.3 1.5 6.5 4.0 -Weekends 2.8 7.2 10.0 11.3 16.5 20.0 5.1 13.1 9.0 -N of Valid 1419 1490 1095 770 490 470 2909 2825 5734N of Miss 0 0 0 0 0 0 0 0 0
Table 4.201: When do you usually drink beer?
RESPONSE 7th 8th 9th 10th 11th 12th 7-8th 9-12th TOTALDo not use 87.9 87.5 81.5 71.2 69.0 55.5 87.7 72.2 80.0 -Before school 0.0 0.3 0.1 0.4 0.0 0.4 0.1 0.2 0.2 -During school 0.0 0.2 0.0 0.3 0.0 0.2 0.1 0.1 0.1 -After school 0.4 1.2 0.8 2.5 1.0 2.8 0.8 1.6 1.2 -Week nights 0.5 1.1 0.9 1.7 1.4 3.6 0.8 1.7 1.2 -Weekends 2.2 5.4 9.6 14.8 22.7 32.1 3.8 17.0 10.3 -N of Valid 1419 1490 1095 770 490 470 2909 2825 5734N of Miss 0 0 0 0 0 0 0 0 0
Table 4.202: When do you usually drink coolers, hard lemonade, etc.?
RESPONSE 7th 8th 9th 10th 11th 12th 7-8th 9-12th TOTALDo not use 88.0 89.1 82.5 70.9 68.8 56.0 88.6 72.5 80.7 -Before school 0.0 0.1 0.1 0.3 0.0 0.2 0.0 0.1 0.1 -During school 0.0 0.2 0.0 0.3 0.0 0.4 0.1 0.1 0.1 -After school 0.3 0.7 0.8 2.5 0.8 2.1 0.5 1.5 1.0 -Week nights 0.3 0.8 1.0 1.6 1.4 2.8 0.6 1.5 1.0 -Weekends 1.6 4.0 8.2 13.9 22.0 32.3 2.8 16.2 9.4 -N of Valid 1419 1490 1095 770 490 470 2909 2825 5734N of Miss 0 0 0 0 0 0 0 0 0
Percentage Tables 291

Pride Surveys Report: 2017-18 Warren County
Table 4.203: When do you usually drink liquor?
RESPONSE 7th 8th 9th 10th 11th 12th 7-8th 9-12th TOTALDo not use 88.3 88.7 82.6 72.2 68.4 54.3 88.5 72.6 80.7 -Before school 0.0 0.2 0.1 0.4 0.2 0.4 0.1 0.2 0.2 -During school 0.0 0.1 0.1 0.3 0.0 0.4 0.0 0.2 0.1 -After school 0.1 1.0 0.6 1.8 1.4 2.1 0.6 1.3 1.0 -Week nights 0.3 1.0 1.0 1.6 1.4 2.8 0.7 1.5 1.1 -Weekends 1.2 4.6 8.2 13.5 21.6 33.2 2.9 16.1 9.4 -N of Valid 1419 1490 1095 770 490 470 2909 2825 5734N of Miss 0 0 0 0 0 0 0 0 0
Table 4.204: When do you usually smoke marijuana?
RESPONSE 7th 8th 9th 10th 11th 12th 7-8th 9-12th TOTALDo not use 88.9 90.1 84.8 76.9 72.4 66.4 89.5 77.5 83.6 -Before school 0.2 0.5 0.9 2.1 1.4 2.8 0.3 1.6 1.0 -During school 0.1 0.1 0.2 0.1 0.2 0.9 0.1 0.3 0.2 -After school 0.6 1.3 2.3 3.5 4.5 6.6 0.9 3.7 2.3 -Week nights 0.6 1.2 2.2 3.6 5.5 7.4 0.9 4.0 2.5 -Weekends 0.8 3.4 6.0 9.1 17.1 19.4 2.2 11.0 6.5 -N of Valid 1419 1490 1095 770 490 470 2909 2825 5734N of Miss 0 0 0 0 0 0 0 0 0
Table 4.205: When do you usually use synthetic marijuana?
RESPONSE 7th 8th 9th 10th 11th 12th 7-8th 9-12th TOTALDo not use 89.5 93.3 90.0 84.5 88.6 85.5 91.4 87.5 89.5 -Before school 0.0 0.1 0.1 0.0 0.0 0.0 0.1 0.0 0.1 -During school 0.1 0.1 0.2 0.0 0.0 0.4 0.1 0.1 0.1 -After school 0.1 0.2 0.3 0.4 0.4 0.4 0.2 0.4 0.3 -Week nights 0.1 0.3 0.2 0.3 0.2 1.1 0.2 0.4 0.3 -Weekends 0.3 0.4 0.8 0.8 1.4 2.1 0.3 1.1 0.7 -N of Valid 1419 1490 1095 770 490 470 2909 2825 5734N of Miss 0 0 0 0 0 0 0 0 0
Percentage Tables 292

Pride Surveys Report: 2017-18 Warren County
Table 4.206: When do you usually use chemical products (bath salts) to get high?
RESPONSE 7th 8th 9th 10th 11th 12th 7-8th 9-12th TOTALDo not use 89.0 93.0 90.0 85.7 89.8 87.0 91.1 88.3 89.7 -Before school 0.1 0.1 0.0 0.0 0.0 0.2 0.1 0.0 0.1 -During school 0.0 0.1 0.1 0.0 0.0 0.2 0.0 0.1 0.1 -After school 0.0 0.1 0.3 0.0 0.2 0.0 0.0 0.1 0.1 -Week nights 0.0 0.0 0.0 0.0 0.0 0.2 0.0 0.0 0.0Weekends 0.0 0.1 0.4 0.0 0.0 0.4 0.0 0.2 0.1 -N of Valid 1419 1490 1095 770 490 470 2909 2825 5734N of Miss 0 0 0 0 0 0 0 0 0
Table 4.207: When do you usually use prescription drugs not prescribed to you?
RESPONSE 7th 8th 9th 10th 11th 12th 7-8th 9-12th TOTALDo not use 88.7 91.9 90.0 84.5 88.2 85.3 90.3 87.4 88.9 -Before school 0.3 0.6 0.5 0.3 0.6 1.1 0.4 0.6 0.5 -During school 0.0 0.1 0.2 0.3 0.2 1.3 0.0 0.4 0.2 -After school 0.4 1.0 0.6 0.9 0.6 1.3 0.7 0.8 0.8 -Week nights 0.7 0.8 0.5 1.2 0.0 1.1 0.8 0.7 0.7 -Weekends 0.6 0.9 1.0 1.3 0.6 1.9 0.8 1.2 1.0 -N of Valid 1419 1490 1095 770 490 470 2909 2825 5734N of Miss 0 0 0 0 0 0 0 0 0
Table 4.208: When do you usually use over-the-counter drugs to get high?
RESPONSE 7th 8th 9th 10th 11th 12th 7-8th 9-12th TOTALDo not use 89.9 93.2 91.1 86.6 89.6 86.4 91.6 88.8 90.2 -Before school 0.1 0.1 0.3 0.0 0.0 0.2 0.1 0.1 0.1 -During school 0.0 0.1 0.0 0.0 0.0 0.4 0.0 0.1 0.1 -After school 0.0 0.2 0.5 0.1 0.2 0.2 0.1 0.3 0.2 -Week nights 0.0 0.2 0.3 0.1 0.0 0.4 0.1 0.2 0.2 -Weekends 0.0 0.4 0.6 0.3 0.6 0.9 0.2 0.6 0.4 -N of Valid 1419 1490 1095 770 490 470 2909 2825 5734N of Miss 0 0 0 0 0 0 0 0 0
Percentage Tables 293

Pride Surveys Report: 2017-18 Warren County
Table 4.209: When do you usually use heroin?
RESPONSE 7th 8th 9th 10th 11th 12th 7-8th 9-12th TOTALDo not use 89.8 93.8 91.1 86.4 89.6 87.0 91.9 88.9 90.4 -Before school 0.0 0.0 0.1 0.0 0.0 0.4 0.0 0.1 0.1 -During school 0.1 0.1 0.1 0.0 0.0 0.2 0.1 0.1 0.1 -After school 0.0 0.0 0.1 0.0 0.2 0.2 0.0 0.1 0.1 -Week nights 0.0 0.0 0.0 0.0 0.0 0.2 0.0 0.0 0.0Weekends 0.0 0.0 0.2 0.0 0.2 0.6 0.0 0.2 0.1 -N of Valid 1419 1490 1095 770 490 470 2909 2825 5734N of Miss 0 0 0 0 0 0 0 0 0
Table 4.210: When do you usually use cocaine?
RESPONSE 7th 8th 9th 10th 11th 12th 7-8th 9-12th TOTALDo not use 89.8 93.8 91.2 86.9 89.2 85.7 91.8 88.8 90.3 -Before school 0.0 0.0 0.1 0.1 0.0 0.4 0.0 0.1 0.1 -During school 0.0 0.1 0.0 0.1 0.0 0.4 0.0 0.1 0.1 -After school 0.1 0.0 0.4 0.1 0.2 0.4 0.0 0.3 0.2 -Week nights 0.0 0.0 0.0 0.1 0.0 0.4 0.0 0.1 0.1 -Weekends 0.0 0.1 0.5 0.1 1.0 1.9 0.0 0.7 0.4 -N of Valid 1419 1490 1095 770 490 470 2909 2825 5734N of Miss 0 0 0 0 0 0 0 0 0
Table 4.211: When do you usually use inhalants?
RESPONSE 7th 8th 9th 10th 11th 12th 7-8th 9-12th TOTALDo not use 89.5 93.6 91.1 86.4 89.6 87.0 91.6 88.9 90.3 -Before school 0.0 0.1 0.1 0.1 0.0 0.4 0.1 0.1 0.1 -During school 0.1 0.1 0.1 0.0 0.0 0.2 0.1 0.1 0.1 -After school 0.0 0.3 0.2 0.0 0.6 0.2 0.1 0.2 0.2 -Week nights 0.1 0.1 0.3 0.0 0.0 0.0 0.1 0.1 0.1 -Weekends 0.0 0.1 0.4 0.1 0.6 0.6 0.1 0.4 0.2 -N of Valid 1419 1490 1095 770 490 470 2909 2825 5734N of Miss 0 0 0 0 0 0 0 0 0
Percentage Tables 294

Pride Surveys Report: 2017-18 Warren County
Table 4.212: When do you usually use hallucinogens?
RESPONSE 7th 8th 9th 10th 11th 12th 7-8th 9-12th TOTALDo not use 89.5 93.7 90.7 85.3 89.0 86.4 91.6 88.2 90.0 -Before school 0.0 0.0 0.0 0.1 0.0 0.4 0.0 0.1 0.1 -During school 0.0 0.1 0.0 0.3 0.0 0.2 0.0 0.1 0.1 -After school 0.0 0.0 0.5 0.4 0.2 0.2 0.0 0.4 0.2 -Week nights 0.0 0.0 0.2 0.4 0.0 0.0 0.0 0.2 0.1 -Weekends 0.1 0.1 0.7 1.2 1.0 1.9 0.1 1.1 0.6 -N of Valid 1419 1490 1095 770 490 470 2909 2825 5734N of Miss 0 0 0 0 0 0 0 0 0
Table 4.213: When do you usually use steroids?
RESPONSE 7th 8th 9th 10th 11th 12th 7-8th 9-12th TOTALDo not use 89.4 93.9 91.4 86.2 90.0 87.0 91.7 89.0 90.4 -Before school 0.1 0.0 0.1 0.4 0.0 0.4 0.0 0.2 0.1 -During school 0.0 0.1 0.0 0.1 0.0 0.4 0.0 0.1 0.1 -After school 0.1 0.0 0.1 0.3 0.4 0.0 0.0 0.2 0.1 -Week nights 0.1 0.0 0.1 0.1 0.0 0.2 0.1 0.1 0.1 -Weekends 0.0 0.0 0.2 0.1 0.2 0.6 0.0 0.2 0.1 -N of Valid 1419 1490 1095 770 490 470 2909 2825 5734N of Miss 0 0 0 0 0 0 0 0 0
Table 4.214: When do you usually use ecstasy?
RESPONSE 7th 8th 9th 10th 11th 12th 7-8th 9-12th TOTALDo not use 89.6 93.8 91.0 86.5 89.8 86.6 91.8 88.8 90.3 -Before school 0.0 0.0 0.0 0.0 0.0 0.2 0.0 0.0 0.0During school 0.0 0.1 0.0 0.0 0.0 0.2 0.0 0.0 0.0After school 0.1 0.0 0.3 0.1 0.2 0.2 0.0 0.2 0.1 -Week nights 0.0 0.0 0.1 0.1 0.0 0.0 0.0 0.1 0.0Weekends 0.0 0.0 0.4 0.3 0.4 1.3 0.0 0.5 0.2 -N of Valid 1419 1490 1095 770 490 470 2909 2825 5734N of Miss 0 0 0 0 0 0 0 0 0
Percentage Tables 295

Pride Surveys Report: 2017-18 Warren County
Table 4.215: When do you usually use meth?
RESPONSE 7th 8th 9th 10th 11th 12th 7-8th 9-12th TOTALDo not use 89.4 93.4 90.0 86.4 89.4 87.0 91.4 88.4 90.0 -Before school 0.1 0.0 0.0 0.0 0.0 0.2 0.1 0.0 0.1 -During school 0.1 0.1 0.1 0.0 0.0 0.4 0.1 0.1 0.1 -After school 0.0 0.0 0.1 0.0 0.2 0.4 0.0 0.1 0.1 -Week nights 0.0 0.1 0.0 0.0 0.0 0.0 0.0 0.0 0.0Weekends 0.0 0.1 0.3 0.1 0.2 0.9 0.0 0.3 0.2 -N of Valid 1419 1490 1095 770 490 470 2909 2825 5734N of Miss 0 0 0 0 0 0 0 0 0
Table 4.216: When do you usually use any tobacco?
RESPONSE 7th 8th 9th 10th 11th 12th 7-8th 9-12th TOTALDo not use 90.0 93.4 91.9 86.8 91.4 86.4 91.7 89.5 90.6 -Before school 0.2 0.6 0.6 1.3 1.4 2.1 0.4 1.2 0.8 -During school 0.1 0.5 0.5 0.6 0.2 1.1 0.3 0.6 0.4 -After school 0.6 1.8 2.0 3.5 3.7 5.7 1.2 3.3 2.2 -Week nights 0.4 1.5 1.2 2.2 1.8 6.2 1.0 2.4 1.7 -Weekends 1.0 3.4 4.2 5.3 5.3 13.8 2.2 6.3 4.2 -N of Valid 1419 1490 1095 770 490 470 2909 2825 5734N of Miss 0 0 0 0 0 0 0 0 0
Percentage Tables 296
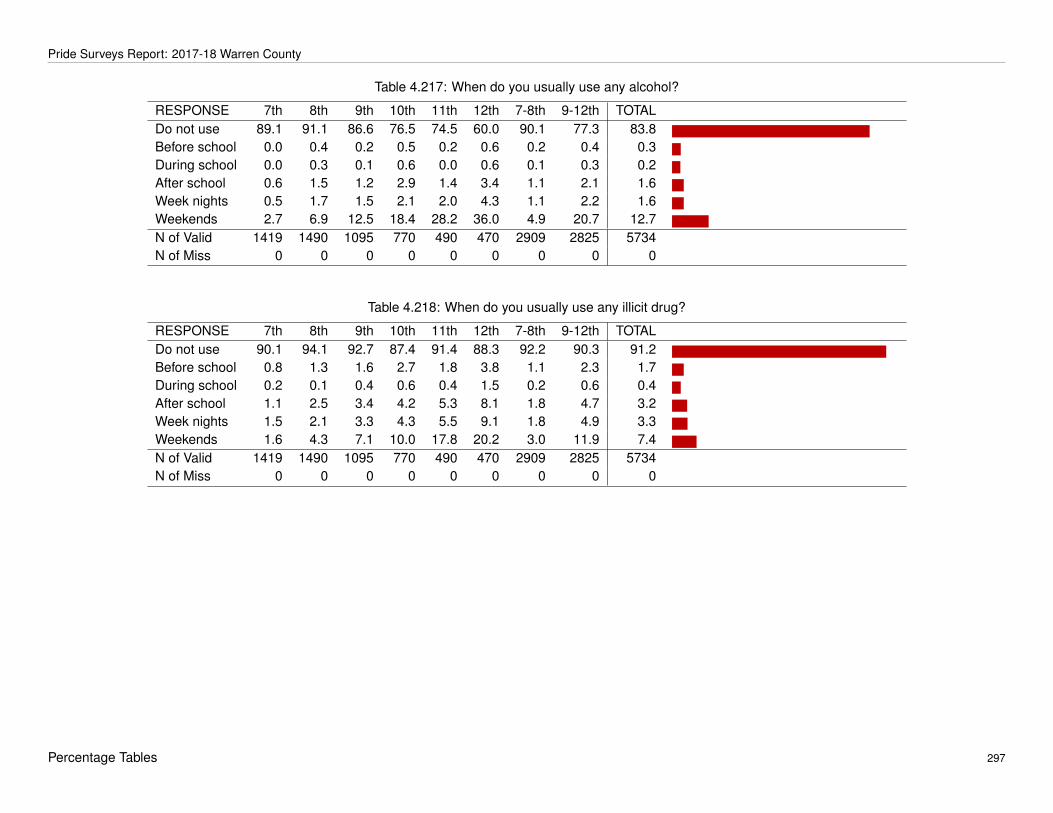
Pride Surveys Report: 2017-18 Warren County
Table 4.217: When do you usually use any alcohol?
RESPONSE 7th 8th 9th 10th 11th 12th 7-8th 9-12th TOTALDo not use 89.1 91.1 86.6 76.5 74.5 60.0 90.1 77.3 83.8 -Before school 0.0 0.4 0.2 0.5 0.2 0.6 0.2 0.4 0.3 -During school 0.0 0.3 0.1 0.6 0.0 0.6 0.1 0.3 0.2 -After school 0.6 1.5 1.2 2.9 1.4 3.4 1.1 2.1 1.6 -Week nights 0.5 1.7 1.5 2.1 2.0 4.3 1.1 2.2 1.6 -Weekends 2.7 6.9 12.5 18.4 28.2 36.0 4.9 20.7 12.7 -N of Valid 1419 1490 1095 770 490 470 2909 2825 5734N of Miss 0 0 0 0 0 0 0 0 0
Table 4.218: When do you usually use any illicit drug?
RESPONSE 7th 8th 9th 10th 11th 12th 7-8th 9-12th TOTALDo not use 90.1 94.1 92.7 87.4 91.4 88.3 92.2 90.3 91.2 -Before school 0.8 1.3 1.6 2.7 1.8 3.8 1.1 2.3 1.7 -During school 0.2 0.1 0.4 0.6 0.4 1.5 0.2 0.6 0.4 -After school 1.1 2.5 3.4 4.2 5.3 8.1 1.8 4.7 3.2 -Week nights 1.5 2.1 3.3 4.3 5.5 9.1 1.8 4.9 3.3 -Weekends 1.6 4.3 7.1 10.0 17.8 20.2 3.0 11.9 7.4 -N of Valid 1419 1490 1095 770 490 470 2909 2825 5734N of Miss 0 0 0 0 0 0 0 0 0
Percentage Tables 297

Pride Surveys Report: 2017-18 Warren County
4.16 Gambling
Table 4.219: Within the past year how often have you played "scratch offs"?
RESPONSE 7th 8th 9th 10th 11th 12th 7-8th 9-12th TOTALDo not use 67.4 60.2 65.4 66.4 70.7 65.9 63.6 66.7 65.1 -Once/year 19.6 23.0 19.7 18.9 16.1 20.1 21.4 18.9 20.2 -6 times/year 6.8 9.7 7.8 8.9 9.4 8.5 8.3 8.5 8.4 -Once/month 2.5 3.4 3.7 3.5 1.8 3.1 3.0 3.2 3.1 -Twice/month 2.0 2.5 2.0 1.1 0.9 0.7 2.3 1.3 1.8 -Once/week 1.3 0.8 0.9 0.8 0.2 1.2 1.0 0.8 0.9 -3 times/week 0.3 0.4 0.2 0.0 0.2 0.0 0.3 0.1 0.2 -Every day 0.2 0.0 0.3 0.5 0.7 0.5 0.1 0.4 0.3 -N of Valid 1257 1397 1007 660 447 413 2654 2527 5181N of Miss 162 93 88 110 43 57 255 298 553
Table 4.220: Within the past year how often have you played lottery tickets (Powerball or Megabucks)?
RESPONSE 7th 8th 9th 10th 11th 12th 7-8th 9-12th TOTALDo not use 84.1 79.2 82.0 84.2 86.7 85.3 81.5 83.9 82.7 -Once/year 10.3 13.5 11.0 9.6 8.8 7.2 12.0 9.6 10.8 -6 times/year 2.1 4.1 4.0 3.6 2.0 4.8 3.1 3.7 3.4 -Once/month 1.5 1.7 1.3 1.5 1.6 1.7 1.6 1.5 1.5 -Twice/month 0.8 0.7 0.8 0.3 0.2 0.0 0.8 0.4 0.6 -Once/week 1.0 0.6 0.4 0.3 0.0 0.7 0.8 0.4 0.6 -3 times/week 0.1 0.1 0.3 0.0 0.0 0.0 0.1 0.1 0.1 -Every day 0.1 0.0 0.3 0.5 0.7 0.2 0.0 0.4 0.2 -N of Valid 1252 1391 1003 659 443 414 2643 2519 5162N of Miss 167 99 92 111 47 56 266 306 572
Percentage Tables 298

Pride Surveys Report: 2017-18 Warren County
Table 4.221: Within the past year how often have you played pull tabs or "paper" games other than lotteries?
RESPONSE 7th 8th 9th 10th 11th 12th 7-8th 9-12th TOTALDo not use 93.3 89.4 90.9 90.8 93.2 91.5 91.2 91.4 91.3 -Once/year 3.9 5.8 4.6 6.0 3.8 5.8 4.9 5.1 5.0 -6 times/year 1.2 2.7 2.6 1.7 1.8 1.2 2.0 2.0 2.0 -Once/month 0.6 0.9 0.5 0.8 0.5 0.2 0.8 0.5 0.7 -Twice/month 0.3 0.6 0.5 0.5 0.2 0.2 0.5 0.4 0.4 -Once/week 0.3 0.5 0.2 0.2 0.0 0.7 0.4 0.2 0.3 -3 times/week 0.0 0.1 0.2 0.2 0.0 0.0 0.0 0.1 0.1 -Every day 0.3 0.0 0.4 0.0 0.5 0.2 0.2 0.3 0.2 -N of Valid 1251 1390 994 662 443 413 2641 2512 5153N of Miss 168 100 101 108 47 57 268 313 581
Table 4.222: Within the past year how often have you played dice or coin flips?
RESPONSE 7th 8th 9th 10th 11th 12th 7-8th 9-12th TOTALDo not use 79.2 71.7 76.3 75.2 83.6 85.5 75.2 78.8 77.0 -Once/year 7.5 9.7 8.1 9.3 5.9 4.4 8.7 7.5 8.1 -6 times/year 4.7 7.6 5.7 6.5 3.6 4.9 6.2 5.4 5.8 -Once/month 2.9 4.5 3.8 4.4 3.0 1.7 3.8 3.5 3.6 -Twice/month 2.7 2.8 2.6 2.1 1.4 1.0 2.8 2.0 2.4 -Once/week 1.4 2.2 1.7 1.5 1.6 0.5 1.8 1.4 1.6 -3 times/week 0.8 1.0 0.9 0.6 0.2 1.2 0.9 0.8 0.8 -Every day 0.7 0.5 0.8 0.5 0.7 0.7 0.6 0.7 0.6 -N of Valid 1242 1391 997 664 439 406 2633 2506 5139N of Miss 177 99 98 106 51 64 276 319 595
Percentage Tables 299

Pride Surveys Report: 2017-18 Warren County
Table 4.223: Within the past year how often have you played cards (poker, etc.)?
RESPONSE 7th 8th 9th 10th 11th 12th 7-8th 9-12th TOTALDo not use 78.8 69.2 72.9 70.4 76.9 75.1 73.8 73.3 73.5 -Once/year 8.0 11.0 8.2 9.8 6.6 7.7 9.6 8.3 9.0 -6 times/year 4.6 8.9 7.6 7.7 6.4 8.7 6.9 7.6 7.2 -Once/month 2.9 3.9 5.7 6.0 4.8 3.9 3.4 5.3 4.4 -Twice/month 2.7 3.8 2.5 3.9 2.3 1.9 3.2 2.8 3.0 -Once/week 1.2 2.2 1.6 0.9 1.6 1.2 1.8 1.4 1.6 -3 times/week 1.0 0.7 0.6 0.5 0.2 0.7 0.9 0.5 0.7 -Every day 0.7 0.2 0.8 0.8 1.1 0.7 0.5 0.8 0.6 -N of Valid 1243 1380 995 663 438 413 2623 2509 5132N of Miss 176 110 100 107 52 57 286 316 602
Table 4.224: Within the past year how often have you bet on a sport?
RESPONSE 7th 8th 9th 10th 11th 12th 7-8th 9-12th TOTALDo not use 82.7 72.1 75.4 77.4 84.3 82.1 77.1 78.6 77.8 -Once/year 8.1 12.2 10.3 10.0 5.9 9.2 10.2 9.3 9.8 -6 times/year 3.4 6.3 5.5 4.5 3.2 4.1 4.9 4.6 4.8 -Once/month 1.6 3.5 3.1 3.6 2.5 1.7 2.6 2.9 2.7 -Twice/month 1.6 2.2 1.5 1.8 0.9 1.0 1.9 1.4 1.7 -Once/week 1.4 1.9 2.2 1.1 2.5 1.2 1.7 1.8 1.7 -3 times/week 0.4 1.3 0.8 0.3 0.0 0.0 0.9 0.4 0.6 -Every day 0.8 0.6 1.2 1.2 0.7 0.7 0.7 1.0 0.9 -N of Valid 1249 1390 994 660 440 413 2639 2507 5146N of Miss 170 100 101 110 50 57 270 318 588
Percentage Tables 300

Pride Surveys Report: 2017-18 Warren County
Table 4.225: Within the past year how often have you bet on a horse/dog race?
RESPONSE 7th 8th 9th 10th 11th 12th 7-8th 9-12th TOTALDo not use 93.7 90.4 92.6 92.3 95.2 91.0 91.9 92.7 92.3 -Once/year 4.7 6.5 4.6 5.2 3.0 7.1 5.6 4.9 5.3 -6 times/year 0.6 1.5 1.0 1.2 0.2 1.5 1.1 1.0 1.0 -Once/month 0.4 0.5 0.5 0.5 0.5 0.0 0.5 0.4 0.4 -Twice/month 0.2 0.4 0.5 0.5 0.2 0.0 0.3 0.4 0.3 -Once/week 0.2 0.5 0.2 0.0 0.2 0.0 0.4 0.1 0.3 -3 times/week 0.2 0.1 0.2 0.2 0.0 0.2 0.2 0.2 0.2 -Every day 0.0 0.1 0.3 0.3 0.7 0.2 0.0 0.4 0.2 -N of Valid 1241 1390 992 660 436 410 2631 2498 5129N of Miss 178 100 103 110 54 60 278 327 605
Table 4.226: Within the past year how often have you bet on games of personal skill (bowling, video games, dares, etc.)?
RESPONSE 7th 8th 9th 10th 11th 12th 7-8th 9-12th TOTALDo not use 77.3 68.2 70.8 73.6 78.6 78.7 72.5 74.2 73.3 -Once/year 8.6 10.4 8.0 6.9 6.9 7.3 9.5 7.4 8.5 -6 times/year 4.0 8.6 8.2 7.3 6.2 6.3 6.4 7.3 6.8 -Once/month 2.7 4.0 3.2 4.8 2.3 1.9 3.4 3.3 3.3 -Twice/month 2.3 2.9 3.0 2.6 1.8 1.9 2.6 2.5 2.6 -Once/week 1.5 2.5 3.8 2.1 2.3 2.2 2.0 2.8 2.4 -3 times/week 1.7 1.4 1.6 0.9 0.5 0.2 1.6 1.0 1.3 -Every day 1.8 2.0 1.4 1.8 1.4 1.5 1.9 1.5 1.7 -N of Valid 1248 1391 1000 662 435 413 2639 2510 5149N of Miss 171 99 95 108 55 57 270 315 585
Percentage Tables 301

Pride Surveys Report: 2017-18 Warren County
Table 4.227: Within the past year how often have you played bingo for money?
RESPONSE 7th 8th 9th 10th 11th 12th 7-8th 9-12th TOTALDo not use 94.3 90.8 91.2 91.2 95.2 92.7 92.5 92.2 92.3 -Once/year 3.3 5.5 4.7 5.0 2.5 4.6 4.4 4.4 4.4 -6 times/year 0.8 1.9 2.1 1.8 0.9 1.7 1.4 1.8 1.6 -Once/month 0.8 0.9 0.1 1.1 0.2 0.2 0.8 0.4 0.6 -Twice/month 0.4 0.6 0.8 0.6 0.2 0.0 0.5 0.5 0.5 -Once/week 0.2 0.1 0.5 0.2 0.0 0.2 0.2 0.3 0.2 -3 times/week 0.1 0.1 0.2 0.2 0.5 0.0 0.1 0.2 0.2 -Every day 0.1 0.0 0.3 0.0 0.5 0.5 0.0 0.3 0.2 -N of Valid 1252 1385 992 661 437 413 2637 2503 5140N of Miss 167 105 103 109 53 57 272 322 594
Table 4.228: Within the past year how often have you bet money over the internet?
RESPONSE 7th 8th 9th 10th 11th 12th 7-8th 9-12th TOTALDo not use 98.2 96.9 95.8 96.7 96.6 95.2 97.5 96.0 96.8 -Once/year 0.6 1.3 1.7 0.8 1.1 1.5 1.0 1.3 1.1 -6 times/year 0.6 0.7 0.9 0.6 0.5 1.0 0.6 0.8 0.7 -Once/month 0.1 0.2 0.3 0.9 0.7 0.7 0.2 0.6 0.4 -Twice/month 0.3 0.4 0.1 0.6 0.2 0.2 0.3 0.3 0.3 -Once/week 0.1 0.1 0.7 0.0 0.2 0.7 0.1 0.4 0.3 -3 times/week 0.0 0.1 0.1 0.0 0.0 0.0 0.1 0.0 0.1 -Every day 0.2 0.2 0.4 0.5 0.7 0.7 0.2 0.5 0.4 -N of Valid 1248 1387 995 657 436 413 2635 2501 5136N of Miss 171 103 100 113 54 57 274 324 598
Percentage Tables 302

Pride Surveys Report: 2017-18 Warren County
Table 4.229: Within the past year how often have you bet money in other ways?
RESPONSE 7th 8th 9th 10th 11th 12th 7-8th 9-12th TOTALDo not use 90.6 84.3 87.3 87.4 88.4 89.7 87.3 87.9 87.6 -Once/year 3.6 6.3 5.2 4.3 6.2 4.2 5.0 5.0 5.0 -6 times/year 2.4 4.0 3.8 4.0 1.4 2.5 3.3 3.2 3.2 -Once/month 1.0 2.0 1.1 1.8 2.1 1.7 1.6 1.6 1.6 -Twice/month 1.0 1.9 0.8 0.8 0.2 1.0 1.4 0.7 1.1 -Once/week 0.6 0.9 0.7 0.8 0.5 0.2 0.7 0.6 0.7 -3 times/week 0.4 0.3 0.2 0.2 0.5 0.0 0.3 0.2 0.3 -Every day 0.4 0.4 0.9 0.9 0.7 0.7 0.4 0.8 0.6 -N of Valid 1247 1391 986 658 432 408 2638 2484 5122N of Miss 172 99 109 112 58 62 271 341 612
Table 4.230: Where do you usually gamble?
RESPONSE 7th 8th 9th 10th 11th 12th 7-8th 9-12th TOTALInternet 1.6 3.0 3.8 4.4 4.3 4.7 2.3 4.2 3.3 -Casino 0.3 0.3 1.0 0.8 0.6 0.4 0.3 0.8 0.5 -Harness racing 1.1 1.0 1.2 1.0 1.2 0.6 1.1 1.1 1.1 -My home 14.0 24.9 20.1 19.1 20.2 17.2 19.6 19.4 19.5 -Sporting event 4.8 8.7 8.5 7.3 6.5 6.0 6.8 7.4 7.1 -School property 1.4 3.8 2.9 4.0 2.9 4.5 2.6 3.5 3.0 -Community festival, concert or other event 2.7 5.9 4.3 6.5 4.1 5.5 4.4 5.1 4.7 -Another person’s home 5.3 10.1 10.2 8.6 9.2 11.1 7.7 9.7 8.7 -Neighborhood store or convenience store 0.9 1.6 1.5 1.3 1.8 2.1 1.3 1.6 1.4 -Park, parking lot, or other public place 1.3 1.7 2.8 2.3 3.1 1.9 1.5 2.6 2.0 -Other place 4.2 5.9 5.6 4.8 4.1 6.4 5.1 5.2 5.1 -I have not gambled 67.3 60.7 62.1 57.4 61.6 58.3 63.9 60.1 62.1 -N of Valid 1419 1490 1095 770 490 470 2909 2825 5734N of Miss 0 0 0 0 0 0 0 0 0
Percentage Tables 303

Pride Surveys Report: 2017-18 Warren County
Table 4.231: Have you ever felt bad about the amount you bet or about what happens when you bet money?
RESPONSE 7th 8th 9th 10th 11th 12th 7-8th 9-12th TOTALNever 84.0 73.2 76.0 76.1 78.6 72.6 78.3 75.9 77.2 -Seldom 9.3 16.0 15.0 12.7 14.0 21.0 12.8 15.2 14.0 -Sometimes 3.4 6.2 5.1 6.7 4.8 3.9 4.9 5.3 5.1 -Often 2.8 4.2 3.4 3.1 2.5 2.0 3.5 2.9 3.2 -A lot 0.6 0.4 0.5 1.4 0.0 0.5 0.5 0.6 0.6 -N of Valid 1253 1390 995 653 435 409 2643 2492 5135N of Miss 163 99 97 114 54 58 262 323 585
Table 4.232: Have you ever felt that you would like to stop betting money but didn’t think you could?
RESPONSE 7th 8th 9th 10th 11th 12th 7-8th 9-12th TOTALNever 85.2 75.2 76.7 76.5 80.5 74.1 79.9 76.9 78.4 -Seldom 12.9 21.5 20.6 20.2 18.6 24.2 17.4 20.7 19.0 -Sometimes 1.0 1.9 1.6 2.0 0.7 1.0 1.4 1.4 1.4 -Often 0.6 0.9 0.8 0.6 0.2 0.7 0.7 0.6 0.7 -A lot 0.4 0.6 0.3 0.8 0.0 0.0 0.5 0.3 0.4 -N of Valid 1246 1383 992 654 436 409 2629 2491 5120N of Miss 167 101 98 116 53 59 268 326 594
Table 4.233: Have you ever lied to anyone about betting or gambling?
RESPONSE 7th 8th 9th 10th 11th 12th 7-8th 9-12th TOTALNever 84.6 74.4 76.4 76.9 80.5 73.9 79.2 76.8 78.1 -Seldom 13.7 22.3 20.0 20.8 17.0 24.6 18.2 20.5 19.3 -Sometimes 0.9 2.6 2.5 1.5 1.4 1.0 1.8 1.8 1.8 -Often 0.6 0.6 0.8 0.6 0.7 0.5 0.6 0.7 0.7 -A lot 0.2 0.1 0.2 0.2 0.5 0.0 0.1 0.2 0.2 -N of Valid 1251 1386 993 653 435 410 2637 2491 5128N of Miss 165 101 99 116 54 57 266 326 592
Percentage Tables 304

Pride Surveys Report: 2017-18 Warren County
Table 4.234: Have you ever bet or gambled more than you wanted?
RESPONSE 7th 8th 9th 10th 11th 12th 7-8th 9-12th TOTALNever 84.5 74.4 76.0 76.0 80.8 73.7 79.2 76.5 77.9 -Seldom 13.0 19.8 18.2 17.7 15.2 21.6 16.6 18.1 17.3 -Sometimes 1.4 3.5 3.5 3.7 3.0 2.7 2.5 3.3 2.9 -Often 0.9 2.2 1.9 1.4 0.7 1.2 1.6 1.5 1.5 -A lot 0.2 0.1 0.3 1.2 0.2 0.7 0.2 0.6 0.4 -N of Valid 1252 1381 976 651 428 407 2633 2462 5095N of Miss 166 103 115 119 59 60 269 353 622
Percentage Tables 305
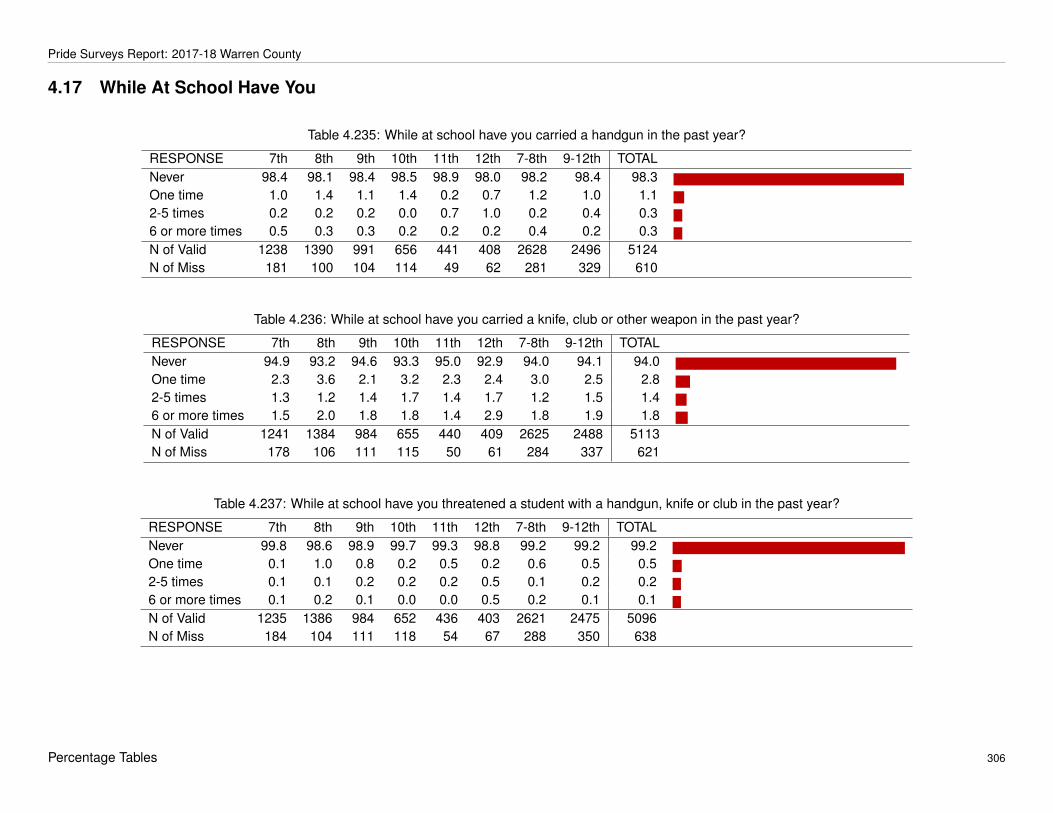
Pride Surveys Report: 2017-18 Warren County
4.17 While At School Have You
Table 4.235: While at school have you carried a handgun in the past year?
RESPONSE 7th 8th 9th 10th 11th 12th 7-8th 9-12th TOTALNever 98.4 98.1 98.4 98.5 98.9 98.0 98.2 98.4 98.3 -One time 1.0 1.4 1.1 1.4 0.2 0.7 1.2 1.0 1.1 -2-5 times 0.2 0.2 0.2 0.0 0.7 1.0 0.2 0.4 0.3 -6 or more times 0.5 0.3 0.3 0.2 0.2 0.2 0.4 0.2 0.3 -N of Valid 1238 1390 991 656 441 408 2628 2496 5124N of Miss 181 100 104 114 49 62 281 329 610
Table 4.236: While at school have you carried a knife, club or other weapon in the past year?
RESPONSE 7th 8th 9th 10th 11th 12th 7-8th 9-12th TOTALNever 94.9 93.2 94.6 93.3 95.0 92.9 94.0 94.1 94.0 -One time 2.3 3.6 2.1 3.2 2.3 2.4 3.0 2.5 2.8 -2-5 times 1.3 1.2 1.4 1.7 1.4 1.7 1.2 1.5 1.4 -6 or more times 1.5 2.0 1.8 1.8 1.4 2.9 1.8 1.9 1.8 -N of Valid 1241 1384 984 655 440 409 2625 2488 5113N of Miss 178 106 111 115 50 61 284 337 621
Table 4.237: While at school have you threatened a student with a handgun, knife or club in the past year?
RESPONSE 7th 8th 9th 10th 11th 12th 7-8th 9-12th TOTALNever 99.8 98.6 98.9 99.7 99.3 98.8 99.2 99.2 99.2 -One time 0.1 1.0 0.8 0.2 0.5 0.2 0.6 0.5 0.5 -2-5 times 0.1 0.1 0.2 0.2 0.2 0.5 0.1 0.2 0.2 -6 or more times 0.1 0.2 0.1 0.0 0.0 0.5 0.2 0.1 0.1 -N of Valid 1235 1386 984 652 436 403 2621 2475 5096N of Miss 184 104 111 118 54 67 288 350 638
Percentage Tables 306

Pride Surveys Report: 2017-18 Warren County
Table 4.238: While at school have you threatened to hurt a student by hitting, slapping or kicking in the past year?
RESPONSE 7th 8th 9th 10th 11th 12th 7-8th 9-12th TOTALNever 90.8 82.0 83.4 87.6 88.2 89.7 86.2 86.4 86.3 -One time 5.5 9.7 9.9 5.5 5.9 3.2 7.8 6.9 7.3 -2-5 times 2.1 4.8 4.4 4.3 3.2 4.4 3.5 4.1 3.8 -6 or more times 1.5 3.5 2.3 2.6 2.7 2.7 2.6 2.5 2.5 -N of Valid 1234 1385 984 653 441 408 2619 2486 5105N of Miss 185 105 111 117 49 62 290 339 629
Table 4.239: While at school have you hurt a student by using a handgun, knife or club in the past year?
RESPONSE 7th 8th 9th 10th 11th 12th 7-8th 9-12th TOTALNever 99.8 99.6 99.5 99.7 100.0 99.8 99.7 99.7 99.7 -One time 0.2 0.3 0.2 0.2 0.0 0.2 0.2 0.2 0.2 -2-5 times 0.0 0.1 0.1 0.2 0.0 0.0 0.1 0.1 0.1 -6 or more times 0.0 0.0 0.2 0.0 0.0 0.0 0.0 0.1 0.0N of Valid 1233 1383 985 651 438 408 2616 2482 5098N of Miss 186 107 110 119 52 62 293 343 636
Table 4.240: While at school have you hurt a student by hitting, slapping or kicking in the past year?
RESPONSE 7th 8th 9th 10th 11th 12th 7-8th 9-12th TOTALNever 90.6 85.6 90.3 89.6 94.0 93.8 88.0 91.4 89.6 -One time 5.8 8.3 5.8 5.4 2.8 3.4 7.1 4.8 6.0 -2-5 times 2.8 4.0 2.9 2.9 2.3 2.2 3.4 2.7 3.0 -6 or more times 0.8 2.1 1.0 2.0 0.9 0.5 1.5 1.2 1.3 -N of Valid 1235 1384 982 647 436 406 2619 2471 5090N of Miss 184 106 113 123 54 64 290 354 644
Percentage Tables 307

Pride Surveys Report: 2017-18 Warren County
Table 4.241: While at school have you been threatened with a handgun, knife or club by a student in the past year?
RESPONSE 7th 8th 9th 10th 11th 12th 7-8th 9-12th TOTALNever 97.4 94.9 94.9 94.9 97.5 97.6 96.1 95.8 96.0 -One time 1.5 3.2 3.2 2.9 1.4 1.0 2.4 2.4 2.4 -2-5 times 0.9 1.4 1.4 1.7 0.9 0.5 1.1 1.2 1.2 -6 or more times 0.2 0.5 0.5 0.5 0.2 1.0 0.4 0.5 0.5 -N of Valid 1232 1386 983 651 438 409 2618 2481 5099N of Miss 187 104 112 119 52 61 291 344 635
Table 4.242: While at school have you had a student threaten to hit, slap or kick you in the past year?
RESPONSE 7th 8th 9th 10th 11th 12th 7-8th 9-12th TOTALNever 77.7 68.2 72.7 78.8 84.2 86.7 72.7 78.6 75.6 -One time 10.6 14.9 12.4 9.1 7.8 5.2 12.9 9.5 11.3 -2-5 times 6.9 9.9 8.5 7.4 5.3 4.9 8.5 7.0 7.8 -6 or more times 4.9 7.0 6.4 4.8 2.7 3.2 6.0 4.8 5.4 -N of Valid 1236 1386 990 650 438 407 2622 2485 5107N of Miss 183 104 105 120 52 63 287 340 627
Table 4.243: While at school have you been afraid a student may hurt you in the past year?
RESPONSE 7th 8th 9th 10th 11th 12th 7-8th 9-12th TOTALNever 83.1 78.7 81.0 84.4 88.1 89.5 80.8 84.6 82.6 -One time 10.4 12.6 11.2 8.6 6.2 5.8 11.5 8.8 10.2 -2-5 times 3.9 4.9 4.5 4.2 4.1 3.9 4.4 4.2 4.3 -6 or more times 2.7 3.8 3.4 2.8 1.6 0.7 3.3 2.5 2.9 -N of Valid 1235 1380 982 649 438 411 2615 2480 5095N of Miss 184 110 113 121 52 59 294 345 639
Percentage Tables 308

Pride Surveys Report: 2017-18 Warren County
Table 4.244: While at school have you been hurt by a student using a handgun, knife or club in the past year?
RESPONSE 7th 8th 9th 10th 11th 12th 7-8th 9-12th TOTALNever 99.8 99.4 98.7 98.8 99.8 99.3 99.6 99.0 99.3 -One time 0.2 0.4 0.8 0.9 0.2 0.0 0.3 0.6 0.5 -2-5 times 0.0 0.0 0.4 0.2 0.0 0.5 0.0 0.3 0.1 -6 or more times 0.0 0.1 0.1 0.2 0.0 0.2 0.1 0.1 0.1 -N of Valid 1233 1387 988 649 435 407 2620 2479 5099N of Miss 186 103 107 121 55 63 289 346 635
Table 4.245: While at school have you been hurt by a student who hit, slapped or kicked you in the past year?
RESPONSE 7th 8th 9th 10th 11th 12th 7-8th 9-12th TOTALNever 82.0 79.5 84.2 89.5 92.4 94.9 80.7 88.8 84.6 -One time 10.6 11.6 6.8 5.8 3.5 2.9 11.1 5.3 8.3 -2-5 times 4.7 5.5 6.6 3.7 2.8 1.5 5.1 4.3 4.7 -6 or more times 2.7 3.4 2.5 0.9 1.4 0.7 3.1 1.6 2.4 -N of Valid 1237 1386 976 650 434 408 2623 2468 5091N of Miss 182 104 119 120 56 62 286 357 643
Percentage Tables 309

Pride Surveys Report: 2017-18 Warren County
4.18 In My School, I Feel Safe...
Table 4.246: In my school, I feel safe in the classroom.
RESPONSE 7th 8th 9th 10th 11th 12th 7-8th 9-12th TOTALNever 3.4 3.0 4.6 4.0 6.5 5.6 3.2 4.9 4.1 -Seldom 2.3 2.9 3.3 3.7 2.7 1.7 2.6 3.0 2.8 -Sometimes 6.1 8.6 7.4 8.6 8.1 4.4 7.5 7.4 7.4 -Often 20.3 24.4 24.8 26.4 23.3 22.2 22.5 24.5 23.5 -A Lot 67.9 61.0 60.0 57.4 59.4 66.0 64.3 60.2 62.3 -N of Valid 1228 1388 984 652 443 409 2616 2488 5104N of Miss 191 102 111 118 47 61 293 337 630
Table 4.247: In my school, I feel safe in the cafeteria (lunchroom).
RESPONSE 7th 8th 9th 10th 11th 12th 7-8th 9-12th TOTALNever 4.1 3.9 5.7 5.1 7.8 7.3 4.0 6.2 5.1 -Seldom 4.6 4.6 4.3 3.9 4.6 2.7 4.6 4.0 4.3 -Sometimes 10.3 11.9 10.7 11.4 11.2 6.1 11.2 10.2 10.7 -Often 21.8 25.8 26.4 27.9 22.4 23.2 24.0 25.6 24.7 -A Lot 59.2 53.7 52.9 51.8 54.0 60.7 56.3 54.1 55.2 -N of Valid 1222 1385 976 649 437 410 2607 2472 5079N of Miss 197 105 119 121 53 60 302 353 655
Table 4.248: In my school, I feel safe in the halls.
RESPONSE 7th 8th 9th 10th 11th 12th 7-8th 9-12th TOTALNever 5.6 4.3 6.1 5.2 7.7 6.6 4.9 6.2 5.6 -Seldom 5.6 6.1 4.6 4.5 3.6 2.7 5.9 4.1 5.0 -Sometimes 13.1 13.3 11.7 12.0 11.8 7.1 13.2 11.0 12.2 -Often 19.9 26.1 26.8 26.0 23.2 21.8 23.2 25.1 24.1 -A Lot 55.7 50.1 50.8 52.2 53.5 61.9 52.8 53.5 53.1 -N of Valid 1227 1383 974 649 439 409 2610 2471 5081N of Miss 192 107 121 121 51 61 299 354 653
Percentage Tables 310

Pride Surveys Report: 2017-18 Warren County
Table 4.249: In my school, I feel safe in the bathroom.
RESPONSE 7th 8th 9th 10th 11th 12th 7-8th 9-12th TOTALNever 7.6 5.0 6.4 6.2 8.4 6.1 6.2 6.7 6.4 -Seldom 5.2 5.5 6.3 4.8 4.6 3.7 5.4 5.2 5.3 -Sometimes 11.4 14.1 10.7 12.1 9.6 6.4 12.8 10.2 11.5 -Often 20.6 24.4 26.5 26.1 23.3 22.1 22.6 25.1 23.8 -A Lot 55.2 51.0 50.1 50.7 54.1 61.8 53.0 52.9 52.9 -N of Valid 1220 1384 972 643 438 408 2604 2461 5065N of Miss 199 106 123 127 52 62 305 364 669
Table 4.250: In my school, I feel safe in the gym.
RESPONSE 7th 8th 9th 10th 11th 12th 7-8th 9-12th TOTALNever 4.9 4.5 5.5 5.2 8.2 6.3 4.7 6.0 5.3 -Seldom 4.1 4.3 4.0 3.4 3.7 3.2 4.2 3.7 3.9 -Sometimes 8.3 9.4 8.6 9.7 10.5 6.3 8.9 8.9 8.9 -Often 19.9 23.6 24.4 26.6 21.1 20.1 21.8 23.7 22.7 -A Lot 62.8 58.3 57.4 55.2 56.5 64.1 60.4 57.8 59.1 -N of Valid 1216 1380 974 640 437 412 2596 2463 5059N of Miss 203 110 121 130 53 58 313 362 675
Table 4.251: In my school, I feel safe on the school bus.
RESPONSE 7th 8th 9th 10th 11th 12th 7-8th 9-12th TOTALNever 7.7 6.6 6.7 7.1 10.7 8.6 7.1 7.8 7.5 -Seldom 7.6 6.3 5.9 4.8 5.2 2.9 6.9 5.0 6.0 -Sometimes 11.9 13.5 8.5 11.9 11.1 7.1 12.8 9.6 11.2 -Often 21.4 25.2 26.4 25.4 20.9 20.5 23.4 24.2 23.8 -A Lot 51.3 48.5 52.5 50.7 52.2 60.9 49.8 53.3 51.5 -N of Valid 1214 1372 972 645 441 409 2586 2467 5053N of Miss 205 118 123 125 49 61 323 358 681
Percentage Tables 311

Pride Surveys Report: 2017-18 Warren County
Table 4.252: In my school, I feel safe at school events (ballgames, etc.).
RESPONSE 7th 8th 9th 10th 11th 12th 7-8th 9-12th TOTALNever 6.0 5.7 6.7 5.7 7.3 6.1 5.8 6.4 6.1 -Seldom 6.1 5.0 5.6 4.8 5.0 3.4 5.5 4.9 5.2 -Sometimes 10.3 13.6 10.0 11.6 11.0 6.4 12.0 10.0 11.1 -Often 22.9 24.2 27.7 28.2 25.3 25.1 23.6 27.0 25.2 -A Lot 54.7 51.5 49.9 49.6 51.4 59.0 53.0 51.6 52.3 -N of Valid 1222 1378 977 645 438 407 2600 2467 5067N of Miss 197 112 118 125 52 63 309 358 667
Table 4.253: In my school, I feel safe in the parking lot.
RESPONSE 7th 8th 9th 10th 11th 12th 7-8th 9-12th TOTALNever 10.9 6.9 7.9 7.2 8.8 7.1 8.8 7.7 8.3 -Seldom 8.2 8.1 5.6 5.6 4.6 2.9 8.1 5.0 6.6 -Sometimes 13.6 15.7 13.9 13.7 14.7 10.1 14.7 13.4 14.1 -Often 21.6 24.1 26.8 25.9 24.0 23.3 22.9 25.5 24.2 -A Lot 45.7 45.2 45.9 47.6 47.9 56.5 45.5 48.4 46.9 -N of Valid 1220 1385 966 641 434 407 2605 2448 5053N of Miss 199 105 129 129 56 63 304 377 681
Percentage Tables 312

Pride Surveys Report: 2017-18 Warren County
4.19 Frequency of Use
Table 4.254: Frequency of use of cigarettes?
RESPONSE 7th 8th 9th 10th 11th 12th 7-8th 9-12th TOTALDaily 0.0 0.1 0.5 1.4 0.9 1.3 0.1 0.9 0.5 -Weekly 0.3 1.1 1.3 3.1 2.6 2.9 0.7 2.3 1.5 -Annual 1.3 4.3 6.8 7.5 9.6 13.6 2.8 8.6 5.7 -N of Valid 1364 1447 1045 731 468 448 2811 2692 5503N of Miss 55 43 50 39 22 22 98 133 231
Table 4.255: Frequency of use of smokeless tobacco?
RESPONSE 7th 8th 9th 10th 11th 12th 7-8th 9-12th TOTALDaily 0.1 0.1 0.3 1.2 0.6 0.7 0.1 0.7 0.4 -Weekly 0.1 0.6 0.7 1.8 1.1 2.2 0.4 1.3 0.8 -Annual 0.6 2.1 4.5 6.0 5.8 10.3 1.4 6.1 3.7 -N of Valid 1362 1441 1046 728 466 446 2803 2686 5489N of Miss 57 49 49 42 24 24 106 139 245
Table 4.256: Frequency of use of cigars?
RESPONSE 7th 8th 9th 10th 11th 12th 7-8th 9-12th TOTALDaily 0.0 0.0 0.1 0.1 0.2 0.2 0.0 0.1 0.1 -Weekly 0.1 0.3 0.3 0.7 1.1 1.8 0.2 0.8 0.5 -Annual 0.4 2.1 3.5 6.9 8.6 18.7 1.3 7.8 4.5 -N of Valid 1353 1445 1043 728 466 443 2798 2680 5478N of Miss 66 45 52 42 24 27 111 145 256
Table 4.257: Frequency of use of electronic vapor products?
RESPONSE 7th 8th 9th 10th 11th 12th 7-8th 9-12th TOTALDaily 0.3 0.6 1.9 5.5 5.7 9.4 0.5 4.8 2.6 -Weekly 0.6 2.1 6.0 9.6 12.1 18.3 1.4 10.1 5.7 -Annual 3.7 11.7 18.0 23.4 30.4 38.2 7.8 25.0 16.2 -N of Valid 1362 1442 1047 730 471 448 2804 2696 5500N of Miss 57 48 48 40 19 22 105 129 234
Percentage Tables 313

Pride Surveys Report: 2017-18 Warren County
Table 4.258: Frequency of use of beer?
RESPONSE 7th 8th 9th 10th 11th 12th 7-8th 9-12th TOTALDaily 0.0 0.1 0.0 0.3 0.6 0.2 0.1 0.2 0.1 -Weekly 0.3 0.8 1.1 2.9 4.3 8.0 0.6 3.3 1.9 -Annual 5.4 11.7 17.3 25.5 34.1 44.2 8.7 26.9 17.6 -N of Valid 1360 1445 1049 730 466 448 2805 2693 5498N of Miss 59 45 46 40 24 22 104 132 236
Table 4.259: Frequency of use of coolers, hard lemonade, etc.?
RESPONSE 7th 8th 9th 10th 11th 12th 7-8th 9-12th TOTALDaily 0.1 0.2 0.1 0.3 0.6 0.2 0.1 0.3 0.2 -Weekly 0.4 0.8 0.9 2.1 4.9 5.8 0.6 2.7 1.6 -Annual 3.6 9.5 15.0 22.6 32.5 41.2 6.6 24.5 15.4 -N of Valid 1348 1437 1044 730 468 447 2785 2689 5474N of Miss 71 53 51 40 22 23 124 136 260
Table 4.260: Frequency of use of liquor?
RESPONSE 7th 8th 9th 10th 11th 12th 7-8th 9-12th TOTALDaily 0.1 0.1 0.0 0.4 0.4 0.7 0.1 0.3 0.2 -Weekly 0.2 0.8 1.3 2.7 4.7 7.0 0.5 3.2 1.8 -Annual 3.2 10.1 16.4 25.0 33.0 44.6 6.8 26.3 16.3 -N of Valid 1361 1444 1034 728 464 442 2805 2668 5473N of Miss 58 46 61 42 26 28 104 157 261
Table 4.261: Frequency of use of marijuana?
RESPONSE 7th 8th 9th 10th 11th 12th 7-8th 9-12th TOTALDaily 0.1 0.3 1.0 2.5 1.7 3.4 0.2 1.9 1.0 -Weekly 0.4 1.2 3.1 5.4 7.9 9.5 0.8 5.6 3.2 -Annual 1.1 5.5 9.7 15.3 24.2 29.2 3.4 17.0 10.0 -N of Valid 1354 1445 1043 725 466 442 2799 2676 5475N of Miss 65 45 52 45 24 28 110 149 259
Percentage Tables 314

Pride Surveys Report: 2017-18 Warren County
Table 4.262: Frequency of use of synthetic marijuana?
RESPONSE 7th 8th 9th 10th 11th 12th 7-8th 9-12th TOTALDaily 0.0 0.1 0.3 0.0 0.0 0.2 0.1 0.2 0.1 -Weekly 0.2 0.1 0.7 0.3 0.6 0.9 0.2 0.6 0.4 -Annual 0.3 0.8 2.0 2.0 4.3 3.2 0.6 2.6 1.6 -N of Valid 1348 1440 1032 716 463 441 2788 2652 5440N of Miss 71 50 63 54 27 29 121 173 294
Table 4.263: Frequency of use of chemical products (bath salts)?
RESPONSE 7th 8th 9th 10th 11th 12th 7-8th 9-12th TOTALDaily 0.0 0.0 0.0 0.0 0.0 0.2 0.0 0.0 0.0Weekly 0.0 0.0 0.2 0.0 0.2 0.2 0.0 0.1 0.1 -Annual 0.2 0.9 1.0 0.8 1.5 0.9 0.6 1.0 0.8 -N of Valid 1362 1446 1044 730 465 445 2808 2684 5492N of Miss 57 44 51 40 25 25 101 141 242
Table 4.264: Frequency of use of pain medication not prescribed to you?
RESPONSE 7th 8th 9th 10th 11th 12th 7-8th 9-12th TOTALDaily 0.1 0.0 0.1 0.0 0.0 0.0 0.1 0.0 0.1 -Weekly 0.1 0.2 0.7 0.0 0.6 0.4 0.2 0.4 0.3 -Annual 1.6 2.4 3.3 3.2 6.0 4.0 2.0 3.9 2.9 -N of Valid 1357 1443 1040 721 465 445 2800 2671 5471N of Miss 62 47 55 49 25 25 109 154 263
Table 4.265: Frequency of use of stimulant medication not prescribed to you?
RESPONSE 7th 8th 9th 10th 11th 12th 7-8th 9-12th TOTALDaily 0.2 0.1 0.0 0.1 0.0 0.5 0.2 0.1 0.1 -Weekly 0.3 0.2 0.3 0.4 0.4 0.9 0.3 0.4 0.3 -Annual 1.0 1.4 2.1 2.9 5.4 6.5 1.2 3.6 2.4 -N of Valid 1353 1443 1041 729 465 444 2796 2679 5475N of Miss 66 47 54 41 25 26 113 146 259
Percentage Tables 315

Pride Surveys Report: 2017-18 Warren County
Table 4.266: Frequency of use of sleeping medication not prescribed to you?
RESPONSE 7th 8th 9th 10th 11th 12th 7-8th 9-12th TOTALDaily 0.5 0.3 0.3 0.3 0.0 0.0 0.4 0.2 0.3 -Weekly 0.7 0.8 1.4 0.3 0.4 0.7 0.8 0.8 0.8 -Annual 2.7 4.6 4.5 3.1 4.1 3.8 3.7 3.9 3.8 -N of Valid 1354 1442 1036 721 463 442 2796 2662 5458N of Miss 65 48 59 49 27 28 113 163 276
Table 4.267: Frequency of use of sedative/anxiety medication not prescribed to you?
RESPONSE 7th 8th 9th 10th 11th 12th 7-8th 9-12th TOTALDaily 0.1 0.1 0.2 0.1 0.0 0.0 0.1 0.1 0.1 -Weekly 0.1 0.4 0.6 0.3 0.6 0.2 0.2 0.4 0.3 -Annual 0.8 2.3 2.3 2.9 5.6 3.8 1.6 3.3 2.4 -N of Valid 1358 1445 1048 725 465 444 2803 2682 5485N of Miss 61 45 47 45 25 26 106 143 249
Table 4.268: Frequency of use of over-the-counter drugs to get high?
RESPONSE 7th 8th 9th 10th 11th 12th 7-8th 9-12th TOTALDaily 0.0 0.0 0.1 0.0 0.0 0.0 0.0 0.0 0.0Weekly 0.0 0.0 0.5 0.3 0.2 0.2 0.0 0.3 0.2 -Annual 0.1 1.4 1.3 1.5 1.7 1.1 0.7 1.4 1.1 -N of Valid 1355 1447 1044 723 466 442 2802 2675 5477N of Miss 64 43 51 47 24 28 107 150 257
Table 4.269: Frequency of use of heroin?
RESPONSE 7th 8th 9th 10th 11th 12th 7-8th 9-12th TOTALDaily 0.0 0.0 0.0 0.0 0.2 0.0 0.0 0.0 0.0Weekly 0.0 0.1 0.0 0.1 0.2 0.2 0.0 0.1 0.1 -Annual 0.0 0.1 0.2 0.4 0.9 0.7 0.0 0.4 0.2 -N of Valid 1352 1447 1040 724 462 442 2799 2668 5467N of Miss 67 43 55 46 28 28 110 157 267
Percentage Tables 316

Pride Surveys Report: 2017-18 Warren County
Table 4.270: Frequency of use of cocaine?
RESPONSE 7th 8th 9th 10th 11th 12th 7-8th 9-12th TOTALDaily 0.0 0.0 0.0 0.0 0.2 0.0 0.0 0.0 0.0Weekly 0.0 0.1 0.1 0.0 0.2 0.5 0.0 0.1 0.1 -Annual 0.0 0.6 0.6 1.1 1.7 2.3 0.3 1.2 0.7 -N of Valid 1353 1442 1043 722 463 440 2795 2668 5463N of Miss 66 48 52 48 27 30 114 157 271
Table 4.271: Frequency of use of inhalants?
RESPONSE 7th 8th 9th 10th 11th 12th 7-8th 9-12th TOTALDaily 0.1 0.1 0.0 0.0 0.2 0.0 0.1 0.0 0.1 -Weekly 0.1 0.1 0.1 0.0 0.2 0.0 0.1 0.1 0.1 -Annual 0.5 1.4 1.1 1.4 1.5 1.4 1.0 1.3 1.1 -N of Valid 1344 1445 1045 720 460 442 2789 2667 5456N of Miss 75 45 50 50 30 28 120 158 278
Table 4.272: Frequency of use of hallucinogens?
RESPONSE 7th 8th 9th 10th 11th 12th 7-8th 9-12th TOTALDaily 0.0 0.0 0.0 0.0 0.2 0.2 0.0 0.1 0.0Weekly 0.0 0.0 0.1 0.3 0.2 0.2 0.0 0.2 0.1 -Annual 0.1 0.4 1.5 2.5 2.2 3.9 0.3 2.3 1.2 -N of Valid 1346 1439 1040 717 461 438 2785 2656 5441N of Miss 73 51 55 53 29 32 124 169 293
Table 4.273: Frequency of use of steroids?
RESPONSE 7th 8th 9th 10th 11th 12th 7-8th 9-12th TOTALDaily 0.1 0.0 0.1 0.3 0.2 0.0 0.1 0.1 0.1 -Weekly 0.2 0.1 0.3 0.7 0.7 0.0 0.1 0.4 0.3 -Annual 1.6 0.8 0.7 2.3 2.0 1.4 1.2 1.5 1.3 -N of Valid 1346 1443 1045 724 460 442 2789 2671 5460N of Miss 73 47 50 46 30 28 120 154 274
Percentage Tables 317

Pride Surveys Report: 2017-18 Warren County
Table 4.274: Frequency of use of ecstasy?
RESPONSE 7th 8th 9th 10th 11th 12th 7-8th 9-12th TOTALDaily 0.1 0.0 0.0 0.0 0.0 0.0 0.0 0.0 0.0Weekly 0.1 0.1 0.0 0.4 0.0 0.2 0.1 0.2 0.1 -Annual 0.1 0.3 0.4 1.4 0.9 1.4 0.2 0.9 0.6 -N of Valid 1346 1444 1030 725 457 442 2790 2654 5444N of Miss 73 46 65 45 33 28 119 171 290
Table 4.275: Frequency of use of meth?
RESPONSE 7th 8th 9th 10th 11th 12th 7-8th 9-12th TOTALDaily 0.0 0.0 0.0 0.0 0.0 0.0 0.0 0.0 0.0Weekly 0.0 0.0 0.0 0.1 0.0 0.2 0.0 0.1 0.0Annual 0.1 0.3 0.2 0.3 0.9 0.7 0.2 0.4 0.3 -N of Valid 1349 1440 1035 724 458 439 2789 2656 5445N of Miss 70 50 60 46 32 31 120 169 289
Table 4.276: Frequency of use of any tobacco?
RESPONSE 7th 8th 9th 10th 11th 12th 7-8th 9-12th TOTALDaily 0.1 0.2 0.9 2.3 1.5 1.8 0.2 1.5 0.8 -Weekly 0.4 1.5 1.8 4.0 3.6 5.5 1.0 3.3 2.1 -Annual 1.7 5.7 9.4 12.5 14.7 25.7 3.7 13.9 8.7 -N of Valid 1365 1449 1051 734 470 451 2814 2706 5520N of Miss 54 41 44 36 20 19 95 119 214
Table 4.277: Frequency of use of any alcohol?
RESPONSE 7th 8th 9th 10th 11th 12th 7-8th 9-12th TOTALDaily 0.1 0.2 0.1 0.5 0.6 0.7 0.1 0.4 0.3 -Weekly 0.6 1.4 1.8 3.5 5.5 10.2 1.0 4.3 2.6 -Annual 7.8 16.2 23.4 33.0 42.6 52.4 12.2 34.2 23.0 -N of Valid 1364 1449 1054 734 469 450 2813 2707 5520N of Miss 55 41 41 36 21 20 96 118 214
Percentage Tables 318

Pride Surveys Report: 2017-18 Warren County
Table 4.278: Frequency of use of any illicit drug?
RESPONSE 7th 8th 9th 10th 11th 12th 7-8th 9-12th TOTALDaily 1.0 0.8 1.4 3.1 1.9 3.6 0.9 2.3 1.6 -Weekly 1.5 2.2 5.0 6.1 9.1 10.7 1.9 7.0 4.4 -Annual 7.6 12.1 14.8 19.9 26.8 32.4 9.9 21.2 15.4 -N of Valid 1364 1450 1057 733 471 447 2814 2708 5522N of Miss 55 40 38 37 19 23 95 117 212
Percentage Tables 319

Chapter 5
Drug-Free Communities Support Program Core Measures
The Drug-Free Communities Support Program, administered by the Cen-ter for Substance Abuse Prevention, requests specific data which is typicallyreferred to as the Core Measures. The requirements for these data has re-cently been modified. The tables in this section reflect the latest changes andrequirements. The drug categories measured are tobacco, alcohol, marijuana,and prescription drugs.
The first four tables are broken down by grade level and the following ta-bles are broken down by gender.
30-Day Use The question During the past 30 days... is used to measure thisstatistic by reporting the percentage of students who report using in thepast 30 days.
Perception of Risk The question How much do you think people risk harm-ing themselves physically or in other ways if they... is used to measurethis statistic by reporting the percentage of students who report thatusing the drug is Moderate Risk or Great Risk to their health.
Perception of Parental Disapproval The questions How wrong do your par-ents feel it would be for you to ...? are used to measure this statisticby reporting the percentage of students who report that parents wouldfeel it is Wrong or Very Wrong to use tobacco, alcohol, marijuana, andprescription drugs.
Perception of Friends Disapproval The questions How wrong do your friendsfeel it would be for you to ...? are used to measure this statistic by re-porting the percentage of students who report that friends would feel itis Wrong or Very Wrong to use tobacco, alcohol, marijuana, and pre-scription drugs.
320
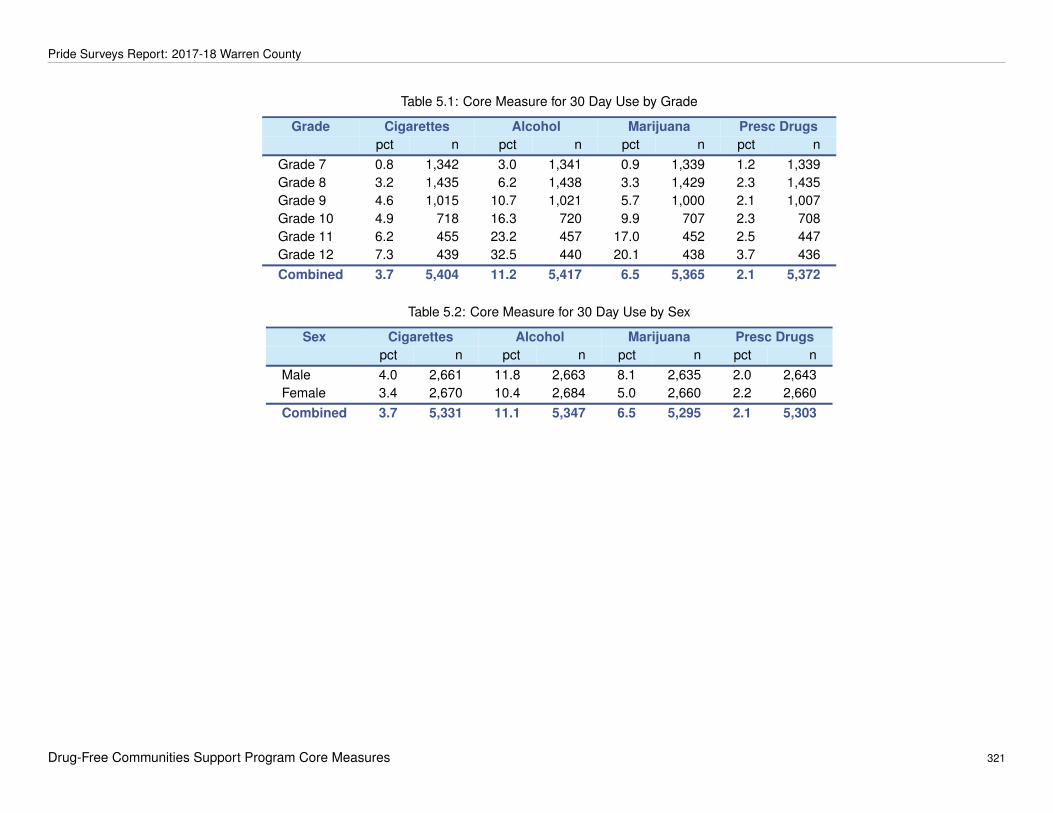
Pride Surveys Report: 2017-18 Warren County
Table 5.1: Core Measure for 30 Day Use by Grade
Grade Cigarettes Alcohol Marijuana Presc Drugspct n pct n pct n pct n
Grade 7 0.8 1,342 3.0 1,341 0.9 1,339 1.2 1,339Grade 8 3.2 1,435 6.2 1,438 3.3 1,429 2.3 1,435Grade 9 4.6 1,015 10.7 1,021 5.7 1,000 2.1 1,007Grade 10 4.9 718 16.3 720 9.9 707 2.3 708Grade 11 6.2 455 23.2 457 17.0 452 2.5 447Grade 12 7.3 439 32.5 440 20.1 438 3.7 436Combined 3.7 5,404 11.2 5,417 6.5 5,365 2.1 5,372
Table 5.2: Core Measure for 30 Day Use by Sex
Sex Cigarettes Alcohol Marijuana Presc Drugspct n pct n pct n pct n
Male 4.0 2,661 11.8 2,663 8.1 2,635 2.0 2,643Female 3.4 2,670 10.4 2,684 5.0 2,660 2.2 2,660Combined 3.7 5,331 11.1 5,347 6.5 5,295 2.1 5,303
Drug-Free Communities Support Program Core Measures 321

Pride Surveys Report: 2017-18 Warren County
Table 5.3: Core Measure of Perception of Risk by Grade
Grade Cigarettes Alcohol Marijuana Presc Drugspct n pct n pct n pct n
Grade 7 88.5 1,306 78.3 1,309 83.0 1,308 84.6 1,306Grade 8 89.2 1,422 77.9 1,420 73.8 1,418 85.9 1,421Grade 9 90.4 994 80.2 1,008 70.3 994 89.6 990Grade 10 90.0 689 81.6 697 61.6 688 88.7 690Grade 11 86.7 452 78.6 454 51.3 448 88.9 440Grade 12 86.6 425 73.3 430 47.2 428 85.9 426Combined 88.9 5,288 78.6 5,318 69.8 5,284 86.9 5,273
Table 5.4: Core Measure of Perception of Risk by Sex
Sex Cigarettes Alcohol Marijuana Presc Drugspct n pct n pct n pct n
Male 87.9 2,593 75.4 2,603 64.7 2,592 84.9 2,585Female 90.0 2,623 81.8 2,643 74.8 2,623 88.9 2,619Combined 89.0 5,216 78.6 5,246 69.8 5,215 86.9 5,204
Drug-Free Communities Support Program Core Measures 322

Pride Surveys Report: 2017-18 Warren County
Table 5.5: Core Measure of Parental Disapproval by Grade
Grade Tobacco Alcohol Marijuana Presc Drugspct n pct n pct n pct n
Grade 7 96.6 1,292 93.6 1,293 96.8 1,291 96.5 1,292Grade 8 97.6 1,410 94.0 1,412 96.1 1,411 97.4 1,411Grade 9 95.4 1,011 89.8 1,010 94.1 1,014 96.4 1,013Grade 10 96.1 685 88.6 687 92.3 685 97.2 687Grade 11 93.5 465 84.1 466 87.4 462 94.6 461Grade 12 87.7 432 73.4 432 84.2 431 95.6 428Combined 95.6 5,295 89.8 5,300 93.7 5,294 96.6 5,292
Table 5.6: Core Measure of Parental Disapproval by Sex
Sex Tobacco Alcohol Marijuana Presc Drugspct n pct n pct n pct n
Male 94.4 2,584 88.8 2,584 92.2 2,579 95.9 2,583Female 96.7 2,642 91.1 2,644 95.2 2,642 97.4 2,639Combined 95.6 5,226 89.9 5,228 93.7 5,221 96.6 5,222
Drug-Free Communities Support Program Core Measures 323

Pride Surveys Report: 2017-18 Warren County
Table 5.7: Core Measure of Friends Disapproval by Grade
Grade Tobacco Alcohol Marijuana Presc Drugspct n pct n pct n pct n
Grade 7 91.5 1,297 84.7 1,299 92.8 1,297 93.1 1,297Grade 8 88.8 1,407 78.5 1,412 85.5 1,410 91.7 1,410Grade 9 83.9 1,022 71.0 1,021 76.8 1,019 89.9 1,013Grade 10 77.0 695 57.8 692 67.5 695 88.6 694Grade 11 68.8 461 45.6 463 52.5 465 83.7 459Grade 12 62.4 434 37.2 435 47.6 435 84.7 432Combined 83.1 5,316 69.6 5,322 77.3 5,321 90.0 5,305
Table 5.8: Core Measure of Friends Disapproval by Sex
Sex Tobacco Alcohol Marijuana Presc Drugspct n pct n pct n pct n
Male 80.0 2,603 67.3 2,605 73.7 2,604 87.7 2,600Female 86.2 2,640 72.1 2,646 80.9 2,645 92.3 2,635Combined 83.1 5,243 69.7 5,251 77.3 5,249 90.0 5,235
Drug-Free Communities Support Program Core Measures 324

Pride Surveys Report: 2017-18 Warren County
Table 5.9: Core Measure of Age of Onset by Grade
Grade Alcohol Cigarettes Marijuana Presc Drugspct n age pct n age pct n age pct n age
Grade 7 10.5 1,285 11.2 3.0 1,290 10.8 1.4 1,288 11.1 1.6 1,291 10.9Grade 8 19.8 1,404 11.7 7.0 1,409 11.8 5.5 1,410 12.4 2.6 1,408 11.5Grade 9 25.6 1,008 12.7 11.0 1,001 12.4 10.5 1,013 13.3 2.7 1,000 12.9Grade 10 36.6 678 13.7 14.1 674 13.2 15.5 679 13.8 4.1 681 13.6Grade 11 46.3 456 14.4 17.6 448 14.2 25.4 457 15.0 5.9 457 14.4Grade 12 56.4 424 15.1 27.1 425 14.8 31.0 423 15.3 5.2 422 14.8Combined 26.1 5,255 13.2 10.2 5,247 13.1 10.5 5,270 14.0 3.1 5,259 13.0
Table 5.10: Core Measure of Age of Onset by Sex
Sex Alcohol Cigarettes Marijuana Presc Drugspct n age pct n age pct n age pct n age
Male 26.4 2,568 13.1 12.6 2,565 13.3 12.0 2,577 14.0 2.8 2,567 13.1Female 25.6 2,614 13.2 7.8 2,610 12.8 8.9 2,621 14.1 3.2 2,621 12.9Combined 26.0 5,182 13.2 10.2 5,175 13.1 10.4 5,198 14.1 3.0 5,188 13.0
Drug-Free Communities Support Program Core Measures 325

Pride Surveys Report: 2017-18 Warren County
Table 5.11: Students Perception of Availability by Grade
Grade Tobacco Alcohol Marijuana Presc Drugspct n pct n pct n pct n
Grade 7 23.1 1,302 25.4 1,304 8.6 1,300 17.3 1,303Grade 8 32.2 1,421 33.2 1,417 16.9 1,416 24.7 1,418Grade 9 34.2 1,031 39.9 1,028 23.6 1,027 23.4 1,028Grade 10 42.9 709 46.8 707 36.4 700 23.9 706Grade 11 45.8 465 48.6 465 44.4 464 27.9 462Grade 12 63.1 436 58.2 435 53.0 438 26.3 438Combined 35.5 5,364 37.7 5,356 24.1 5,345 23.0 5,355
Table 5.12: Students Perception of Availability by Sex
Sex Tobacco Alcohol Marijuana Presc Drugspct n pct n pct n pct n
Male 35.3 2,634 35.4 2,626 25.6 2,620 19.5 2,630Female 35.6 2,658 39.7 2,657 22.4 2,652 26.2 2,652Combined 35.4 5,292 37.6 5,283 24.0 5,272 22.9 5,282
Drug-Free Communities Support Program Core Measures 326