pricing freight transport to account for external costs
TRANSCRIPT
CongressionalBudgetOffice
PricingFreightTransporttoAccountforExternalCosts
2016AlliedSocialScienceAssociationsMeetingsSanFrancisco,California
January3,2016
DavidAustin,MicroeconomicStudiesDivision
TheinformationinthispresentationispreliminaryandisbeingcirculatedtostimulatediscussionandcriticalcommentasdevelopmentalworkforanalysisfortheCongress.Foradditionalinformation,seeDavidAustin,PricingFreightTransporttoAccountforExternalCosts,WorkingPaper2015-03(CongressionalBudgetOffice,March2015),www.cbo.gov/publication/50049.
CONGRESSIONALBUDGETOFFICE 2
WhatThisProjectAddresses
■ Externalcostsoffreighttransportincludetheeffectsofaccidents,damagetoroads,airpollution,trafficcongestion,andemissionsofcarbondioxide.
■ Ifsuchexternalcostsweretaxed,howwouldthechoiceofmodeoftransportation—truckvs.rail—beaffected?
■ Towhatextentareresources(includinginfrastructure)misallocatedbecausepricesdonotreflectallcosts?
CONGRESSIONALBUDGETOFFICE 3
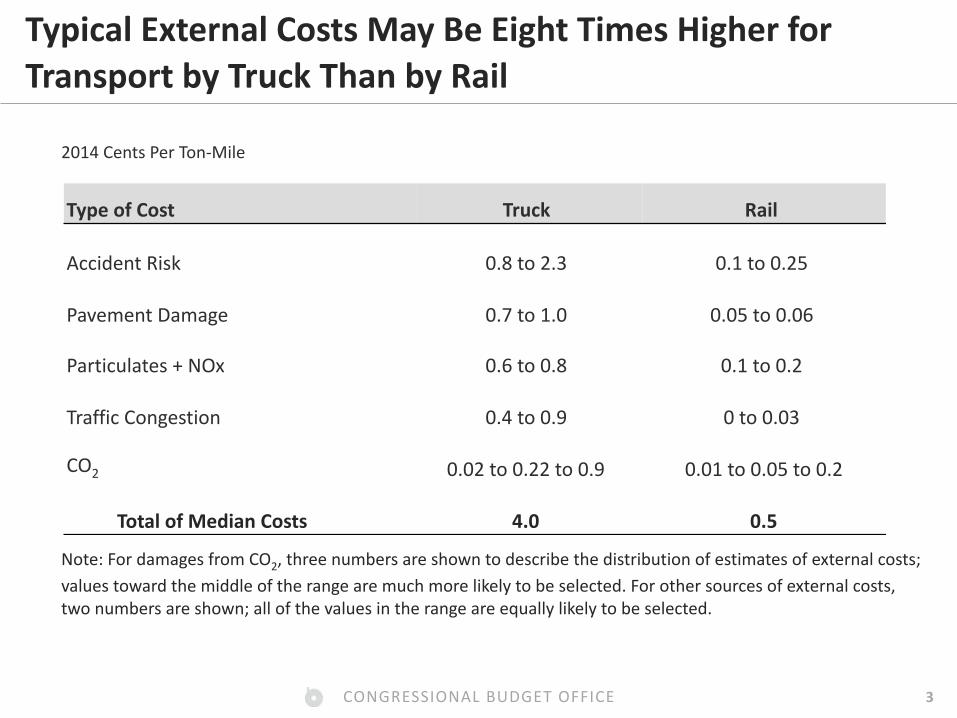
TypicalExternalCostsMayBeEightTimesHigherforTransportbyTruckThanbyRail
TypeofCost Truck Rail
AccidentRisk 0.8to2.3 0.1to0.25
PavementDamage 0.7to1.0 0.05to0.06
Particulates+NOx 0.6to0.8 0.1to0.2
TrafficCongestion 0.4to0.9 0to0.03
CO2 0.02to0.22to0.9 0.01to0.05to0.2
TotalofMedianCosts 4.0 0.5
2014CentsPerTon-Mile
Note:FordamagesfromCO2,threenumbersareshowntodescribethedistributionofestimatesofexternalcosts;valuestowardthemiddleoftherangearemuchmorelikelytobeselected.Forothersourcesofexternalcosts,twonumbersareshown;allofthevaluesintherangeareequallylikelytobeselected.
CONGRESSIONALBUDGETOFFICE 4
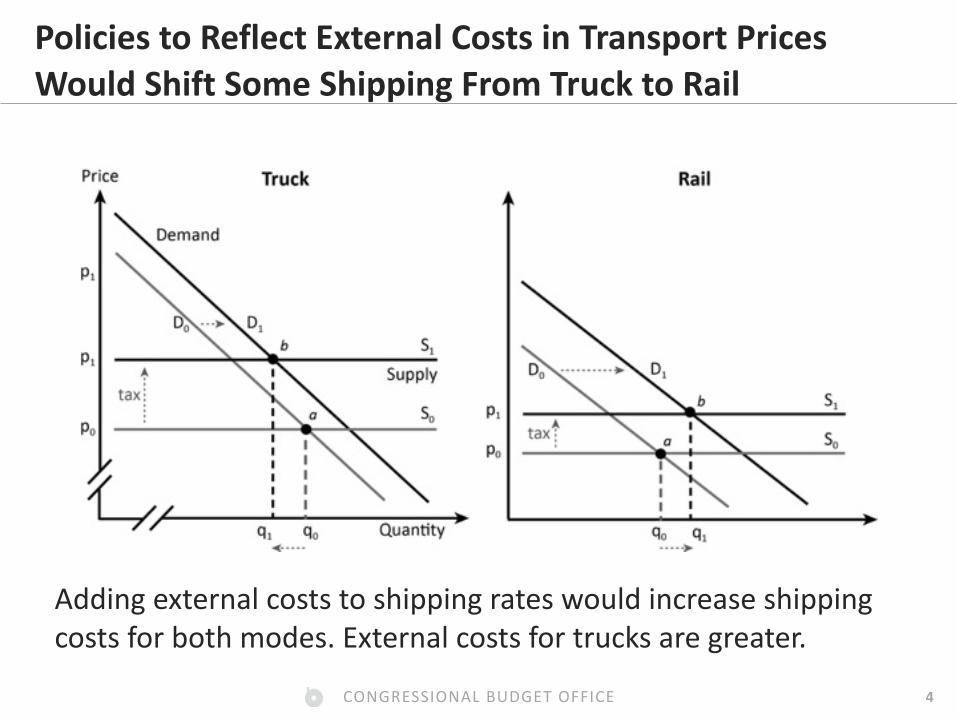
PoliciestoReflectExternalCostsinTransportPricesWouldShiftSomeShippingFromTrucktoRail
Addingexternalcoststoshippingrateswouldincreaseshippingcostsforbothmodes.Externalcostsfortrucksaregreater.
CONGRESSIONALBUDGETOFFICE 5
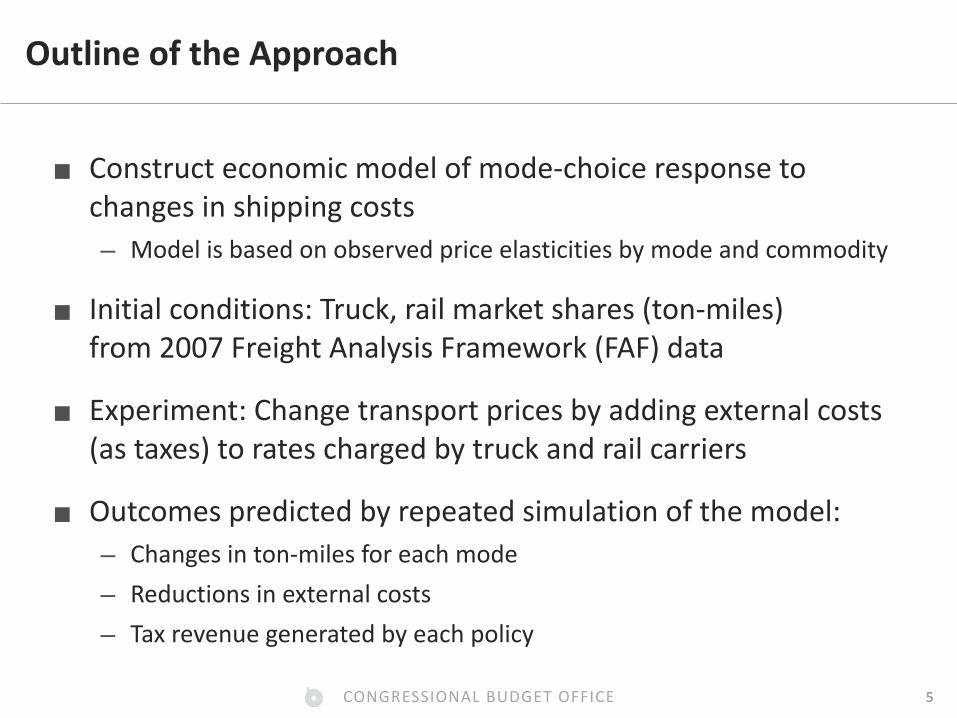
OutlineoftheApproach
■ Constructeconomicmodelofmode-choiceresponsetochangesinshippingcosts– Modelisbasedonobservedpriceelasticitiesbymodeandcommodity
■ Initialconditions:Truck,railmarketshares(ton-miles)from2007FreightAnalysisFramework(FAF)data
■ Experiment:Changetransportpricesbyaddingexternalcosts(astaxes)torateschargedbytruckandrailcarriers
■ Outcomespredictedbyrepeatedsimulationofthemodel:– Changesinton-milesforeachmode– Reductionsinexternalcosts– Taxrevenuegeneratedbyeachpolicy
CONGRESSIONALBUDGETOFFICE 6
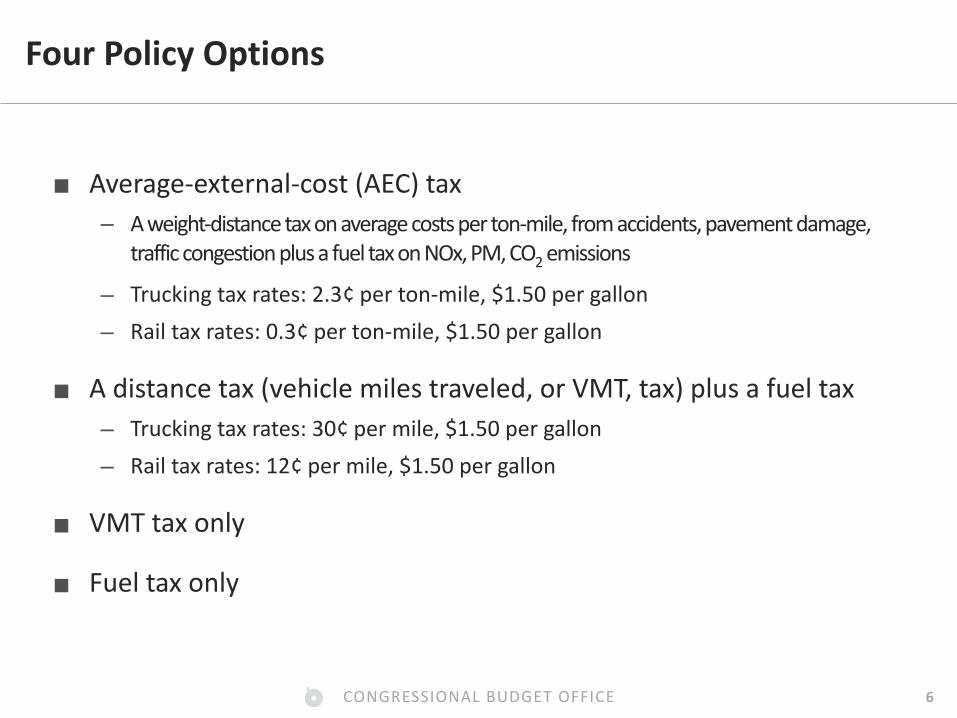
FourPolicyOptions
■ Average-external-cost(AEC)tax– Aweight-distancetaxonaveragecostsperton-mile,fromaccidents,pavementdamage,
trafficcongestionplusafueltaxonNOx,PM,CO2emissions
– Truckingtaxrates:2.3¢perton-mile,$1.50pergallon– Railtaxrates:0.3¢perton-mile,$1.50pergallon
■ Adistancetax(vehiclemilestraveled,orVMT,tax)plusafueltax– Truckingtaxrates:30¢permile,$1.50pergallon– Railtaxrates:12¢permile,$1.50pergallon
■ VMTtaxonly
■ Fueltaxonly
CONGRESSIONALBUDGETOFFICE 7
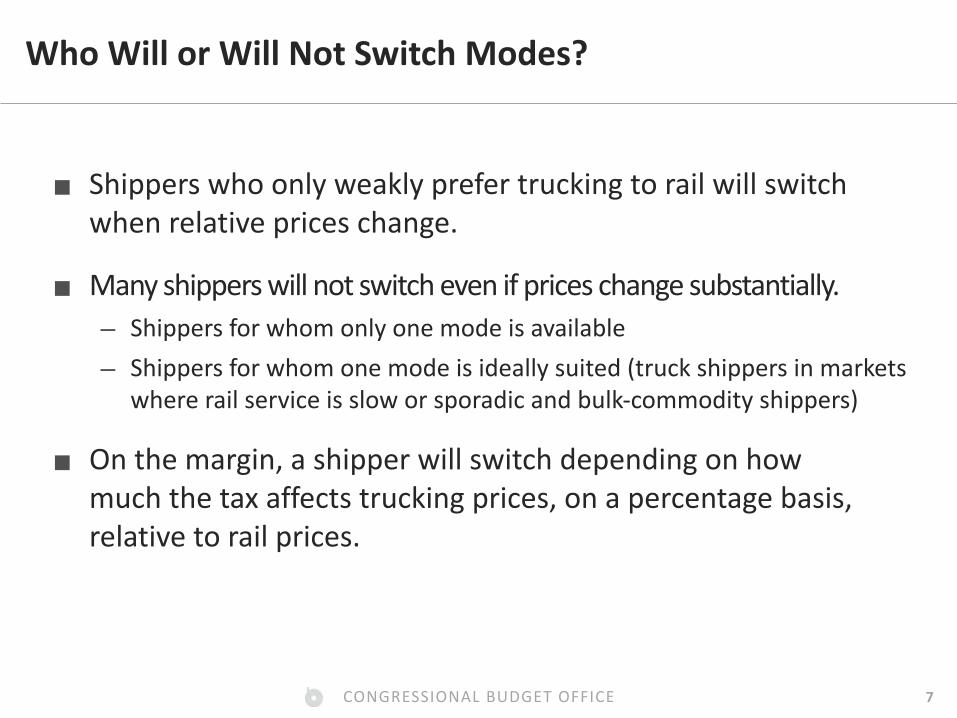
WhoWillorWillNotSwitchModes?
■ Shipperswhoonlyweaklyprefertruckingtorailwillswitchwhenrelativepriceschange.
■ Manyshipperswillnotswitchevenifpriceschangesubstantially.– Shippersforwhomonlyonemodeisavailable– Shippersforwhomonemodeisideallysuited(truckshippersinmarkets
whererailserviceissloworsporadicandbulk-commodityshippers)
■ Onthemargin,ashipperwillswitchdependingonhowmuchthetaxaffectstruckingprices,onapercentagebasis,relativetorailprices.
CONGRESSIONALBUDGETOFFICE 8
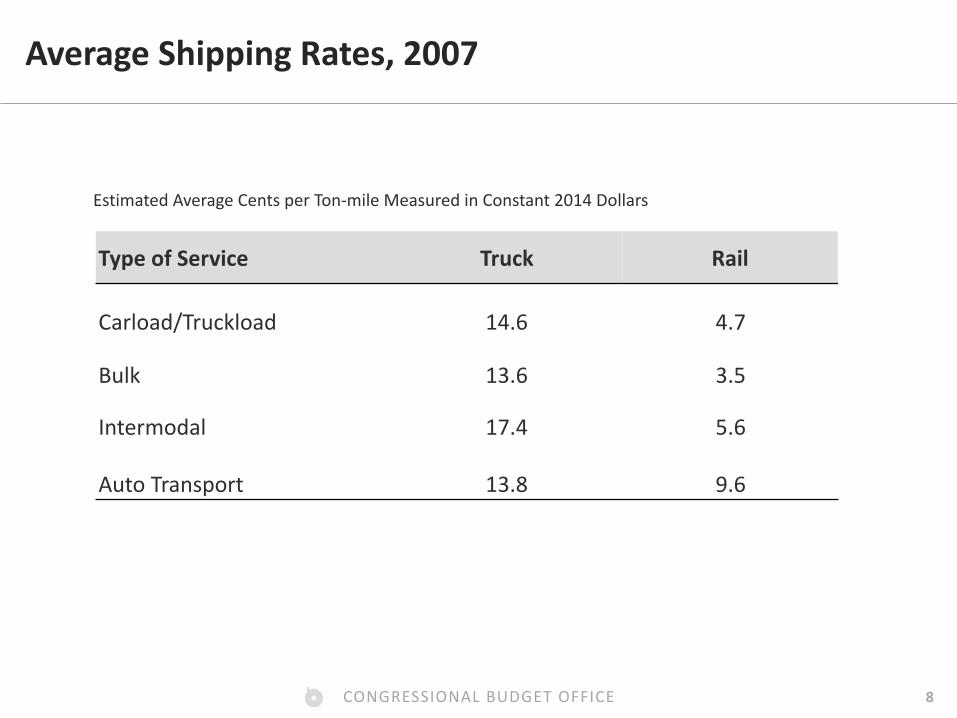
AverageShippingRates,2007
TypeofService Truck Rail
Carload/Truckload 14.6 4.7
Bulk 13.6 3.5
Intermodal 17.4 5.6
AutoTransport 13.8 9.6
EstimatedAverageCentsperTon-mileMeasuredinConstant2014Dollars

CONGRESSIONALBUDGETOFFICE 9
OverviewofFindings:AECTax
■ Theratiooftrucktorailexternalcostsis8:1.
■ TheAECtaxhasamuchsmallereffectonrelativeprices.– Shipperswillingtopaymorefortrucktransportthanforrail– Newtaxisinadditiontoexistingtaxesondieselfuel
■ ThereisanaveragepredictedincreaseinshippingcostsfromtheAECtax.– Trucks:19%– Rail:12%
CONGRESSIONALBUDGETOFFICE 10
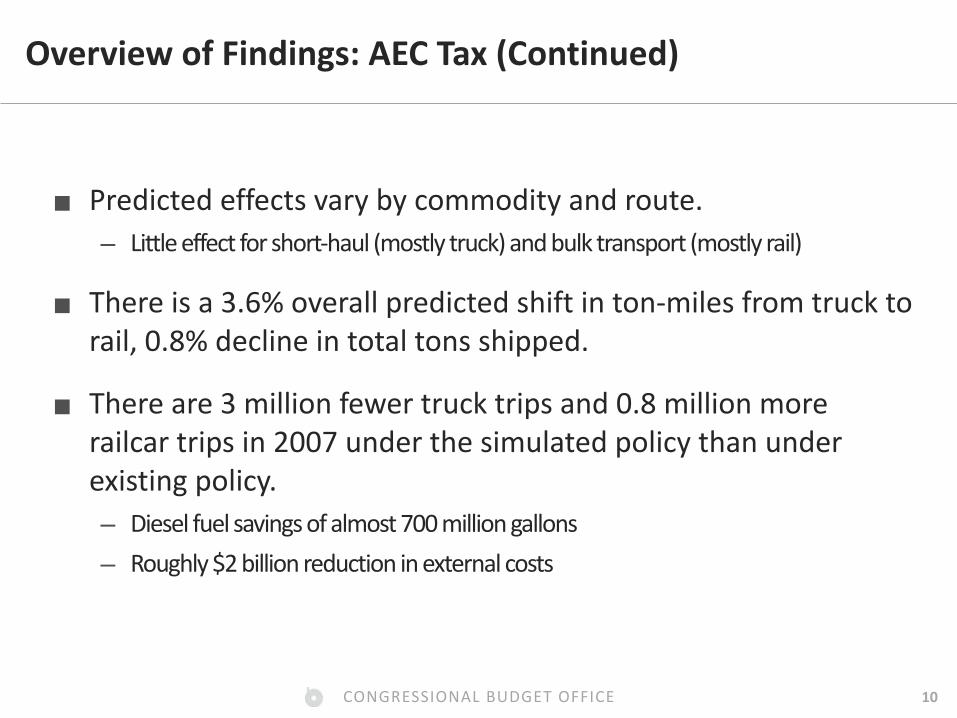
OverviewofFindings:AECTax(Continued)
■ Predictedeffectsvarybycommodityandroute.– Littleeffectforshort-haul(mostlytruck)andbulktransport(mostlyrail)
■ Thereisa3.6%overallpredictedshiftinton-milesfromtrucktorail,0.8%declineintotaltonsshipped.
■ Thereare3millionfewertrucktripsand0.8millionmorerailcartripsin2007underthesimulatedpolicythanunderexistingpolicy.– Dieselfuelsavingsofalmost700milliongallons– Roughly$2billionreductioninexternalcosts
CONGRESSIONALBUDGETOFFICE 11
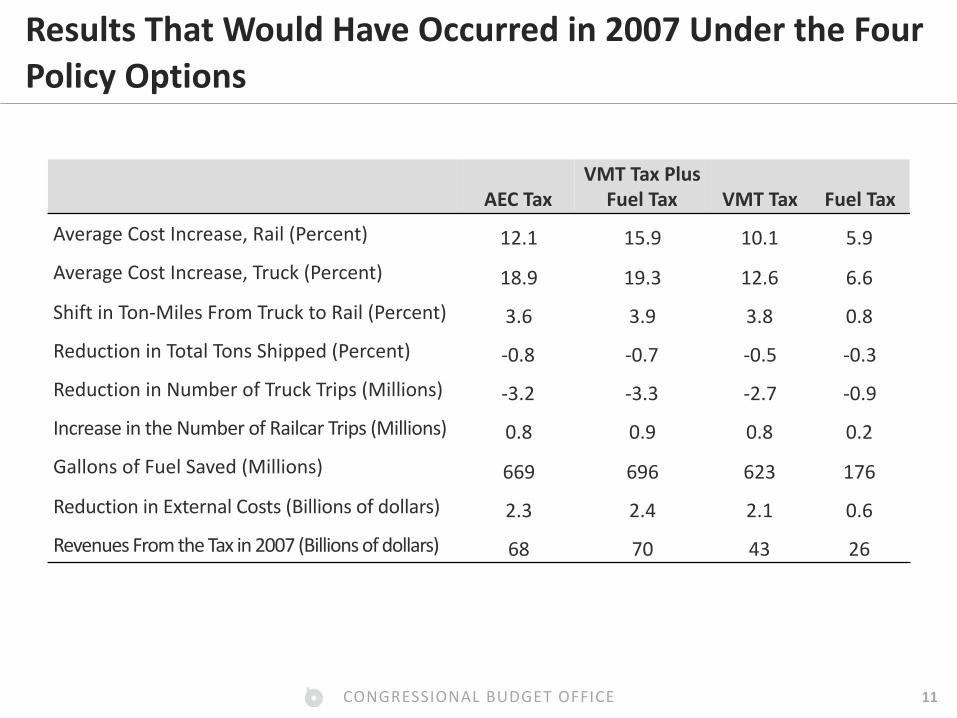
ResultsThatWouldHaveOccurredin2007UndertheFourPolicyOptions
AECTaxVMTTaxPlus
FuelTax
VMTTax
FuelTax
AverageCostIncrease,Rail(Percent) 12.1 15.9 10.1 5.9
AverageCostIncrease,Truck(Percent) 18.9 19.3 12.6 6.6
ShiftinTon-MilesFromTrucktoRail(Percent) 3.6 3.9 3.8 0.8
ReductioninTotalTonsShipped(Percent) -0.8 -0.7 -0.5 -0.3
ReductioninNumberofTruckTrips(Millions) -3.2 -3.3 -2.7 -0.9
IncreaseintheNumberofRailcarTrips(Millions) 0.8 0.9 0.8 0.2
GallonsofFuelSaved(Millions) 669 696 623 176
ReductioninExternalCosts(Billionsofdollars) 2.3 2.4 2.1 0.6
RevenuesFromtheTaxin2007(Billionsofdollars) 68 70 43 26
CONGRESSIONALBUDGETOFFICE 12
DiscussionofFindings
■ TheeffectsoftheVMTtaxplusthefueltaxaregenerallyalittlelargerthanthoseoftheAECtax.– TheAECtaxisamoreaccuratereflectionofexternalcosts.– Byignoringweight,theVMTtaxishigheronlightershipmentsand
loweronheaviershipments,comparedwithataxonweightanddistance.
– Thedrawbackisatrade-offforloweradministrativecosts.
■ Byitself,theVMTtaxhaseffectsnearlyaslargeasthecombinationofVMTtaxplusfueltax,butitraises$27billionlessinrevenues.
CONGRESSIONALBUDGETOFFICE 13
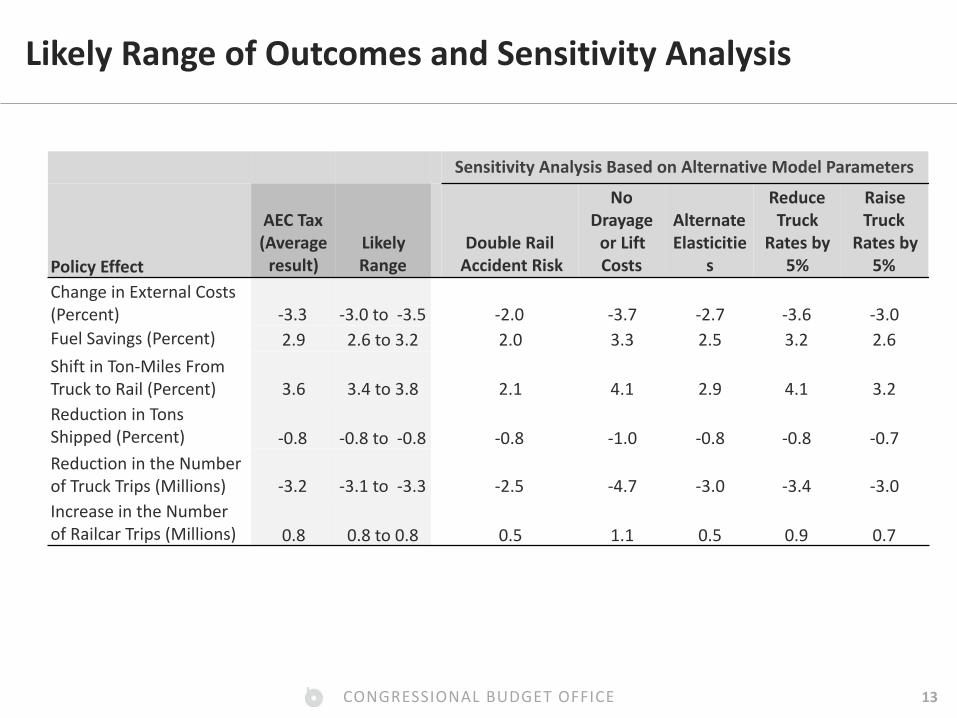
LikelyRangeofOutcomesandSensitivityAnalysis
SensitivityAnalysisBasedonAlternativeModelParameters
PolicyEffect
AECTax(Averageresult)
LikelyRange
DoubleRailAccidentRisk
NoDrayageorLiftCosts
AlternateElasticitie
s
ReduceTruck
Ratesby5%
RaiseTruck
Ratesby5%
ChangeinExternalCosts(Percent) -3.3 -3.0to-3.5 -2.0 -3.7 -2.7 -3.6 -3.0FuelSavings(Percent) 2.9 2.6to3.2 2.0 3.3 2.5 3.2 2.6ShiftinTon-MilesFromTrucktoRail(Percent) 3.6 3.4to3.8 2.1 4.1 2.9 4.1 3.2ReductioninTonsShipped(Percent) -0.8 -0.8to-0.8 -0.8 -1.0 -0.8 -0.8 -0.7ReductionintheNumberofTruckTrips(Millions) -3.2 -3.1to-3.3 -2.5 -4.7 -3.0 -3.4 -3.0IncreaseintheNumberofRailcarTrips(Millions) 0.8 0.8to0.8 0.5 1.1 0.5 0.9 0.7

CONGRESSIONALBUDGETOFFICE 14
LikelyRangeofOutcomesandSensitivityAnalysis(Continued)
■ Resultsarebasedon1,000iterationsofthesimulationmodel.
■ Variationinmodelpredictionsoverthoseiterationsissummarizedasthe“likelyrange”ofvaluesthatthemodeledoutcomesmighttake.– Thatrangeisdefinedascontainingtwo-thirdsofthemodel’s
predictions,centeredonthemedianprediction.
■ Theinfluenceofindividualparametersonthemodel’spredictionsisexaminedbyvaryingtheparameters’values.– Manyofthosesensitivitytestsyieldpredictionsthatlieslightlyoutside
ofthelikelyrange.

CONGRESSIONALBUDGETOFFICE 15
DataandParameters
■ Theunitofobservationforfreightshippingistotalton-milesandtonsshippedin2007.– Bystatepair,eachof39commodities,andtwotransportmodes– Almost76,000observations– DatacomefromtheFreightAnalysisFramework,basedprimarilyonthe
2007CommodityFlowSurvey
■ Themodel’sparametersarespecifiedasrangesofpossiblevalues.– Shippingrates,drayagecosts,transportshareofproductionand
distributioncosts,demandelasticities,railroutecircuity,emptyreturns,taxpass-through,andpayloadcapacities
■ Insimulations,aspecificvalueisdrawnatrandomfromeachparameter’sspecifiedrange.
CONGRESSIONALBUDGETOFFICE 16
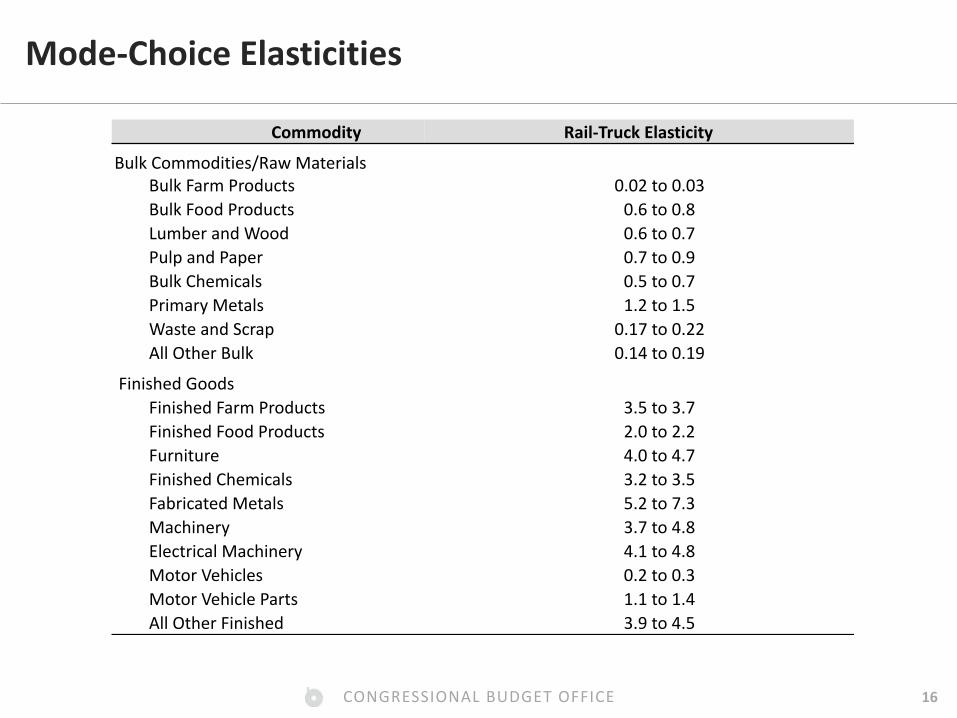
Mode-ChoiceElasticities
Commodity Rail-TruckElasticity
BulkCommodities/RawMaterialsBulkFarmProducts 0.02to0.03BulkFoodProducts 0.6to0.8LumberandWood 0.6to0.7PulpandPaper 0.7to0.9BulkChemicals 0.5to0.7PrimaryMetals 1.2to1.5WasteandScrap 0.17to0.22AllOtherBulk 0.14to0.19
FinishedGoodsFinishedFarmProducts 3.5to3.7FinishedFoodProducts 2.0to2.2Furniture 4.0to4.7FinishedChemicals 3.2to3.5FabricatedMetals 5.2to7.3Machinery 3.7to4.8ElectricalMachinery 4.1to4.8MotorVehicles 0.2to0.3MotorVehicleParts 1.1to1.4AllOtherFinished 3.9to4.5
CONGRESSIONALBUDGETOFFICE 17
AlternativestotheAECTax
■ Amongthepolicyoptionsanalyzed,theAECtaxmostaccuratelyreflectsexternalcosts,butitwouldbethemostcostlytoadminister.– Thegovernmentmustknowtheweightanddistanceofeveryshipment.
■ TheVMTtaxrequiresdistanceonly,notweight.
■ Thefueltaxisleastcostlytoadminister.– Acollectionmechanismisalreadyinplace.
■ TheVMTandfueltaxeshaveloweradministrativecostsbutreflectexternalcostslessaccuratelyorlesscomprehensively.– Thepolicysimulationsexaminetheimportanceofthattrade-off.
CONGRESSIONALBUDGETOFFICE 18
SourcesforNumericValues
■ Externalcosts– Particulates/NOx:Matthewsetal.,J.InfrastructureSystems(2001)– CO2:InteragencyWorkingGrouponSocialCostofCarbon(2014)
– Allotherexternalcosts:GovernmentAccountabilityOffice(2011)
■ Carrierrates(pricesperton-mile)– DepartmentofTransportation,SurfaceTransportationBoard,andCongressional
BudgetOffice
■ Mode-choiceelasticities– Jones,Nix,andSchwier(1990),from“NCHRPReport388:AGuidebookfor
ForecastingFreightTransportationDemand,”TransportationResearchBoard(1997)
■ Ton-milesoffreightshippedin2007– FreightAnalysisFramework,basedontheCommodityFlowSurvey