pricewaterhousecoopers india pvt ltd moneytree tm … · pricewaterhousecoopers india pvt ltd....
TRANSCRIPT

Technology Institute
This special reportprovides summary results of Q3 ’13, Q2 ’14, and Q3 ’14.
PricewaterhouseCoopers India Pvt Ltd
MoneyTreeTM India ReportQ3 2014Data provided by Venture Intelligence
www.pwc.com/globalmoneytreewww.pwc.in

PwC MoneyTreeTM India Report – Q3 ’14 2
1. Overview 3
2. Analysis of private equity investments
Total equity investments in PE-backed companies
Investments by industry
Investments by stage of development
Investments by region
Top 20 PE deals
4
4
5
7
8
9
3. Analysis of PE exits
Total PE exits
Exits by industry
Exits by type
Top five PE exits
10
10
11
12
13
4. Active PE firms 14
5. Sector focus: IT & ITeS sector
Total PE investments
Investments by stage of development
Investments by region
Investments by subsector
PE exits in the sector
15
15
17
18
19
20
6. Definitions
Contacts
21
22
Table of contents

PwC MoneyTreeTM India Report – Q3 ’14 3
1. Overview
Focussed on the future
Q3 ’14 saw 103 PE deals, valued at 3.01 billion USD. This represents a 4% increase over the PE deal value in Q2 ’14 and a 97% increase over the deal value in Q3 ’13.
It may be too simplistic to attribute the heightened activity to the ever-improving macro-economic environment, but the latter did play its part. Inflation was at 6.46% in September 2014, as compared to 9.84% during the same period last year and the cooling off in crude prices meant that fiscal deficit was broadly in control. More importantly, investors see a government keen on making investments into the country easier, and one that is focussed on enabling infrastructure for that purpose. This is great news for private equity investors looking to exit investments of four-plus-years vintage. Overall, FDI inflows over the last four months alone have exceeded 10.75 billion USD, and strengthening these inflows over the next few quarters could provide a further boost to the overall macro-economy.
The public markets have not looked back from the beginning of the year, and together with heightened strategic investor interest, provided composite exit opportunities to PE funds. In terms of fresh investments, PE investors have been selective and continue to take longer to consummate deals than ever before, the exception being the e-commerce sector. It stood out with deals worth 1,175 million USD during Q3 ’14, propelling an increasing number of investors to be convinced of its potential in India.
The IT & ITeS and healthcare sectors showed significant PE deal activity, followed by energy, education and engineering & construction. With the launch of the government’s Make in India programme and the proposed labour reforms, the manufacturing sector is also expected to gain investor interest. Thus PE investors are expected to turn their focus on manufacturing and infrastructure over a period of time.
Sanjeev Krishan Private Equity Industry Leader PwC India

PwC MoneyTreeTM India Report – Q3 ’14 4
2. Analysis of private equity investments
Total equity investments in PE-backed companies
Private equity investments in India have recorded an uninterrupted five-quarter upswing with 3.01 billion USD in the third quarter of the year across 103 deals, a moderate increase of 4% in value and a 3% drop in volume. In Q2 ’14, 2.91 billion USD was invested in 106 deals.
But the good news is that investments have doubled as compared to the same quarter last year, despite a 9% reduction in the volume. Q3 of the previous year saw 1.53 billion USD invested in 113 deals.
The Information technology and IT-enabled services (IT & ITeS) sector has made a comeback as the top sector, attracting 1.64 billion USD in 56 deals, more than half the total investments for the quarter. It is more than a two-fold jump as compared to the previous quarter and two and half times higher than the same period last year.
The healthcare & life sciences sector has emerged second in terms of investment value with investments worth 292 million USD in 11 deals, a 45% decline as compared to the previous quarter.
With regard to investments by stage of development, the growth stage has received the highest value of investments worth 1.84 billion USD across 34 deals.
0
1,000
2,000
3,000
4,000
5,000
6,000
2004 2005 2006 2007 2008 2009 2010 2011 2012 2013 2014Quarter
Number of deals
Data provided by Venture Intelligence.
Q119
Q223
Q321
Q438
Q144
Q242
Q346
Q462
Q1100
Q287
Q3106
Q499
Q1118
Q295
Q3139
Q4178
Q1165
Q2108
Q3136
Q487
Q173
Q248
Q369
Q4102
Q195
Q284
Q3122
Q4104
Q1121
Q2131
Q3145
Q4125
Q1132
Q2120
Q3131
Q4108
Q1107
Q2124
Q3113
Q498
Q1133
Q2106
Q3103
Q4
576
357
845
2,038
1,776
2,768
1,9632,081
2,6552,587
807711
1,010
2,370
2,044
1,582
3,829
1,197
1,371
727
5,401
4,378
3,815
2,097
1,652
2,049
2,710
1,952
2,7042,211
3,864
1,229923
147242
464
1,528
1,177
4,834
2,1902,398
2,9113,013
Value of deals (in US$ Mn)
Total equity investments
Bangalore has emerged as the leader in terms of PE investments (both by value and volume of deals) in this quarter with an investment of 1.8 billion USD from 29 deals.
PwC MoneyTreeTM India Report – Q3 ’14 5
Investments by industry Q3 ’13, Q2 ’14 and Q3 ’14
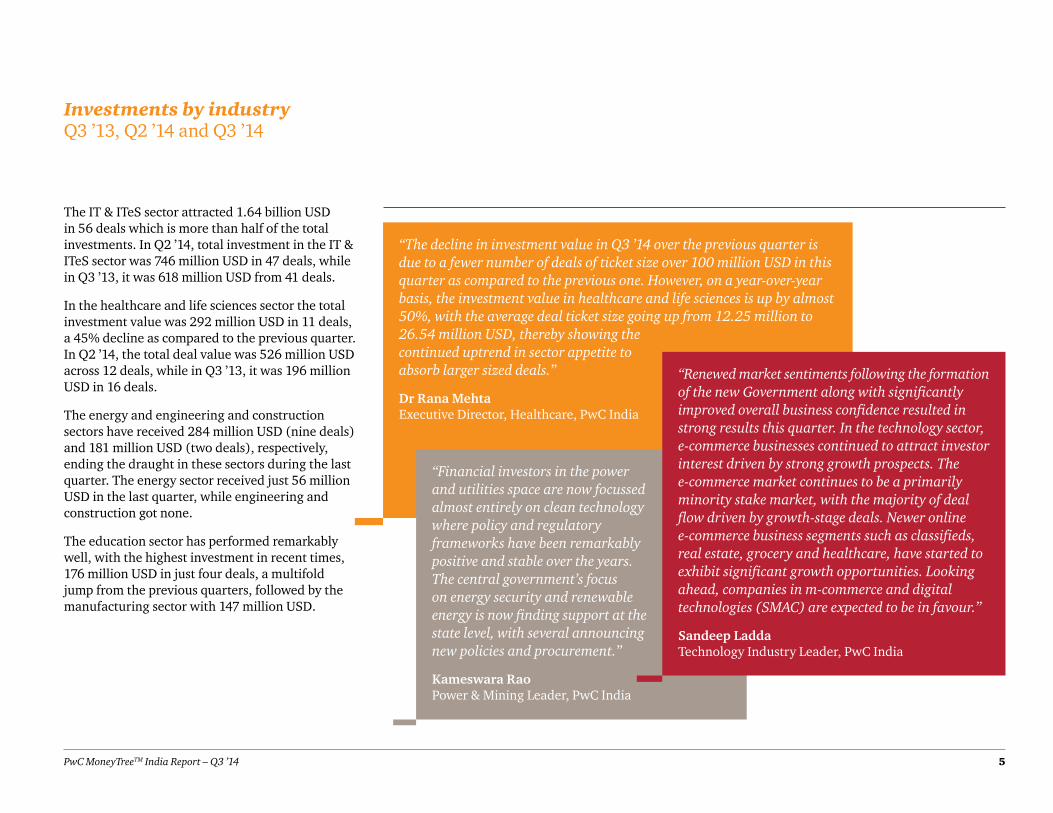
The IT & ITeS sector attracted 1.64 billion USD in 56 deals which is more than half of the total investments. In Q2 ’14, total investment in the IT & ITeS sector was 746 million USD in 47 deals, while in Q3 ’13, it was 618 million USD from 41 deals.
In the healthcare and life sciences sector the total investment value was 292 million USD in 11 deals, a 45% decline as compared to the previous quarter. In Q2 ’14, the total deal value was 526 million USD across 12 deals, while in Q3 ’13, it was 196 million USD in 16 deals.
The energy and engineering and construction sectors have received 284 million USD (nine deals) and 181 million USD (two deals), respectively, ending the draught in these sectors during the last quarter. The energy sector received just 56 million USD in the last quarter, while engineering and construction got none.
The education sector has performed remarkably well, with the highest investment in recent times, 176 million USD in just four deals, a multifold jump from the previous quarters, followed by the manufacturing sector with 147 million USD.
“The decline in investment value in Q3 ’14 over the previous quarter is due to a fewer number of deals of ticket size over 100 million USD in this quarter as compared to the previous one. However, on a year-over-year basis, the investment value in healthcare and life sciences is up by almost 50%, with the average deal ticket size going up from 12.25 million to 26.54 million USD, thereby showing the continued uptrend in sector appetite to absorb larger sized deals.”
Dr Rana MehtaExecutive Director, Healthcare, PwC India
“Financial investors in the power and utilities space are now focussed almost entirely on clean technology where policy and regulatory frameworks have been remarkably positive and stable over the years. The central government’s focus on energy security and renewable energy is now finding support at the state level, with several announcing new policies and procurement.”
Kameswara RaoPower & Mining Leader, PwC India
“Renewed market sentiments following the formation of the new Government along with significantly improved overall business confidence resulted in strong results this quarter. In the technology sector, e-commerce businesses continued to attract investor interest driven by strong growth prospects. The e-commerce market continues to be a primarily minority stake market, with the majority of deal flow driven by growth-stage deals. Newer online e-commerce business segments such as classifieds, real estate, grocery and healthcare, have started to exhibit significant growth opportunities. Looking ahead, companies in m-commerce and digital technologies (SMAC) are expected to be in favour.”
Sandeep Ladda Technology Industry Leader, PwC India

PwC MoneyTreeTM India Report – Q3 ’14 6
After an excellent performance in the last quarter, the banking and financial sector dropped by 85% to 147 million USD from 958 million USD in the last quarter.
Investments by industries
Energy
Healthcare & life sciences
Textiles & garments
Information technology (IT)& IT-enabled services (ITeS)
Manufacturing
Others
Engineering& construction
Shipping & logistics
Banking, financial services& insurance
1,5001,000 2,0005000
$5
$0
$51$25
$10
$147$62
$57
$176$9
$51
$0$5$18
$0$77
$0
$181
$147
$232
$486$45
$144
$38
$0
$958$91
$292$526
$196
$284$56
$79
$1,640$746
$618
Travel & transport
Education
Fast moving consumergoods (FMCG)
Value of deals (in US$ Mn)
Q3 2013
Q2 2014
Q3 2014
Data provided by Venture Intelligence.
Note: ‘Others’ include other services, travel and transport, media and entertainment, hotels and resorts, education, fast-moving consumer goods, sports and fitness, agri-business, food and beverages, and retail.

PwC MoneyTreeTM India Report – Q3 ’14 7
Investments by stage of development Q3 ’13, Q2 ’14 and Q3 ’14
In Q3 ’14, most PE investors preferred the growth route as this stage received investments worth 1.8 billion USD in 34 deals. Late-stage investments were valued at 857 million USD in 15 deals during this quarter.
Investments by stage of development
0 500 1,000 1,500 2,000
Other
Pre-IPO
Early
PIPE
Growth
Late
Buyout
100
16
124
138
23
88
699151
1,833897
412
8571,158
266
8517
588Value of deals (in USD Mn)
Q3 2013
Q2 2014
Q3 2014
Data provided by Venture Intelligence.
Note: Definitions for the stage of development categories can be found in the ‘definitions’ section of this report.
Growth stage in the above graph includes both growth and growth-PE stages.
PwC MoneyTreeTM India Report – Q3 ’14 8
Investments by region Q3 ’13, Q2 ’14 and Q3 ’14
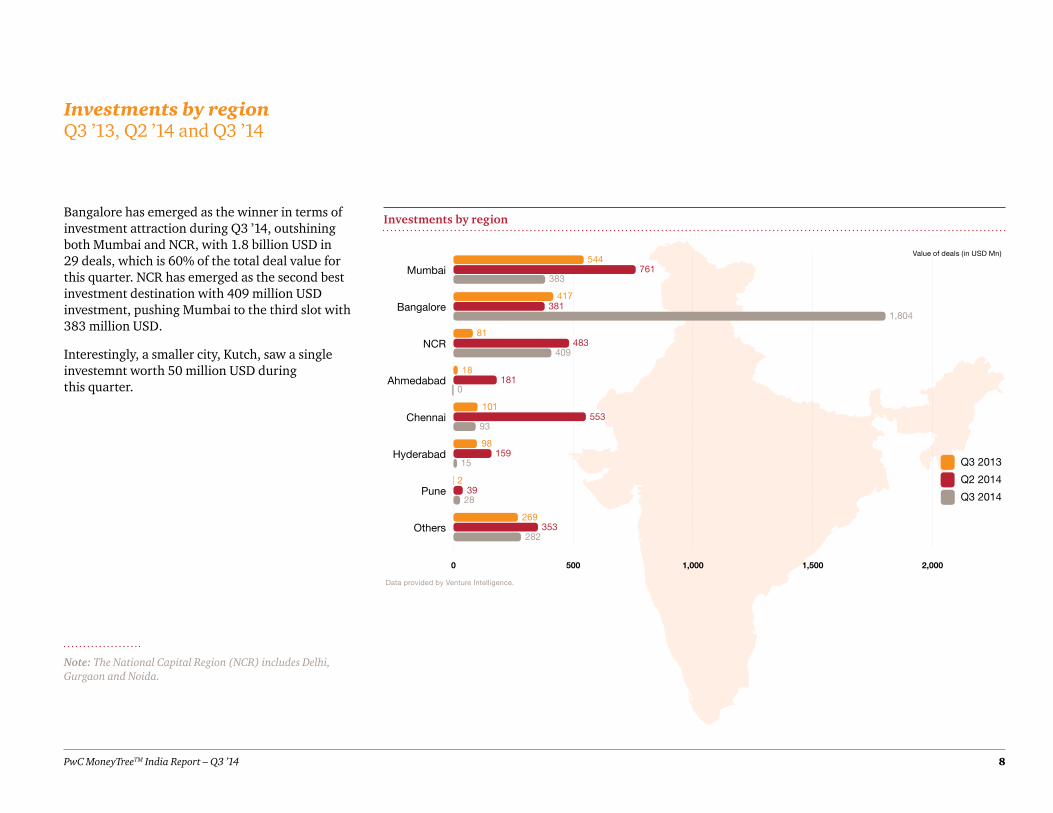
Bangalore has emerged as the winner in terms of investment attraction during Q3 ’14, outshining both Mumbai and NCR, with 1.8 billion USD in 29 deals, which is 60% of the total deal value for this quarter. NCR has emerged as the second best investment destination with 409 million USD investment, pushing Mumbai to the third slot with 383 million USD.
Interestingly, a smaller city, Kutch, saw a single investemnt worth 50 million USD during this quarter.
Investments by region
Note: The National Capital Region (NCR) includes Delhi, Gurgaon and Noida.
0 500 1,000 1,500 2,000
Others
Pune
Hyderabad
Chennai
Ahmedabad
NCR
Bangalore
Mumbai
Value of deals (in USD Mn)
93
159
553
0
2
269
101
28
282
39
353
98
15
18118
409483
81
1,804381
417
383761
544
Q3 2013
Q2 2014
Q3 2014
Data provided by Venture Intelligence.

PwC MoneyTreeTM India Report – Q3 ’14 9
Top 20 PE deals Q3 ’14
The top 20 deals comprised 78% of the total deal value in Q3 ’14. The top four deals constituted 48% of the total deal value. About 84% of the deals in this quarter are below the value of 50 million USD.
Top 20 PE deals in Q3 2014
Company Industry InvestorsDeal amount (in USD Mn)
Flipkart IT & ITeS Morgan Stanley, GIC, Tiger Global, Accel India, Iconiq Capital, DST Global, Others 1,000
GMR Holdings Eng & construction KKR 164
Manipal Global Education Services Education PremjiInvest 150
Narayana Hrudayalaya Healthcare & life sciences CDC Group 150
Bilt Paper Manufacturing IFC 100
Sterlite Power Grid Ventures Energy StanChart PE 83
Cholamandalam Investment and Finance Company BFSI Apax Partners 83
ReNew Wind Power Energy ADB, GEF 70
Hike IT & ITeS Tiger Global, Others 65
Syngene International Healthcare & life sciences India Value Fund 64
Quikr IT & ITeSWarburg Pincus, Norwest, Tiger Global, Matrix Partners India, Nokia Growth Partners, Omidyar Network, Kinnevik, Others
60
Snapdeal.com IT & ITeS Ratan Tata 50
Continuum Wind Energy Energy IFC 50
Spykar Lifestyle Textiles & garments Metmin Investments 50
Olacabs IT & ITeS Sequoia Capital India, Tiger Global, Matrix Partners India, Steadview 42
Delhivery Shipping & logistics Nexus Ventures, Multiples PE, Others 35
ACME Solar Energy Energy IFC 34
Freecharge.in IT & ITeS Sequoia Capital India, Ru-Net Holdings, Others 33
BigBasket IT & ITeS Helion Ventures, Ascent Capital, Zodius Capital, Lionrock Capital 33
Century Real Estate- SPV Hotels & resorts Blackstone 33Data provided by Venture Intelligence.

PwC MoneyTreeTM India Report – Q3 ’14 10
3. Analysis of PE exits
Total PE exits
The exit activity in the third quarter of 2014 has dropped by 18%, with a total value of 1.11 billion USD in 31 deals, as compared to the the previous quarter which saw 1.35 billion USD worth investment in 56 deals. During the same period last year, the total exit value was just 534 million USD in 25 deals.
With a single deal worth 234 million USD, the telecom sector dominated the exit space in this quarter followed by the manufacturing sector (229 mllion USD in two deals).
As a result of a surging stock market, almost 72% of the total exits happened through public market deals, valued at 801 million USD.
Total private equity exits
0
500
1,000
1,500
2,000
2,500
3,000
3,500
2004 2005 2006 2007 2008 2009 2010 2011 2012 2013 2014Quarter
Number of deals
12 6 8
Q1 Q2 Q3 Q412
Q116
Q213
Q322
Q425
Q114
Q217
Q320
Q427
Q134
Q239
Q339
Q435
Q130
Q216
Q315
Q411
Q119
Q245
Q334
Q432
Q147
Q232
Q346
Q455
Q133
Q227
Q333
Q427
Q145
Q235
Q332
Q438
Q137
Q242
Q325
Q433 24 56 31
Q1 Q2 Q3 Q4
1,029
172
1,008
644
559
827854
612
834
202
592
279
599
1,212
927
235
787
68
449
1,905
683
1,323
280
936
416 385
886
3,063
1,131
1,320
1,5061,615
116
257
238
167534
1,941
1,133
1,294
416
1,107
1,349
Value of deals (in US$ Mn)
Data provided by Venture Intelligence.

PwC MoneyTreeTM India Report – Q3 ’14 11
Exits by industry Q3 ’13, Q2 ’14 and Q3 ’14
The telecom sector led the exits this quarter in terms of value, with a single deal worth 234 million USD. This sector didn’t witness any exits in the previous quarter or even in the same period last year. The manufacturing sector saw a drop of 40% in value, to 229 million USD in two deals, as compared to the previous quarter (381 million USD in five deals). In Q3 ’13, the sector saw five deals worth 77 million USD.
The BFSI and energy sectors have witnessed exit deals worth 188 million USD (five deals) and 142 million USD (two deals), respectively, whereas healthcare dropped to 40 million USD, an 88% fall as compared to the previous quarter.
Exits by industry
Note: Others include engineering and construction, shipping and logistics, textiles and garments, energy, other services, retail, food and beverages and hotels and resorts.
38
92
255
170
188
418
142
100
275
65
1230
515
0
229381
77
40323
17
0 100 200 300 400 500
Others
Banking, financial services& insurance
Information technology& IT-enabled services
Energy
Textiles & garments
Manufacturing
Healthcare & life sciences
Q3 2013
Q2 2014
Q3 2014
Value of deals (in US$ Mn)
Data provided by Venture Intelligence.

PwC MoneyTreeTM India Report – Q3 ’14 12
Exits by type Q3 ’13, Q2 ’14 and Q3 ’14
Public market sales have continued to be the preferred mode of exit with more than 72% of the total exit value coming from public deals (801 million USD in 20 deals). Strategic sales saw value worth 144 million USD in seven deals, followed by secondary sales (90 million USD in two deals).
This quarter witnessed one IPO worth 37 million USD.
Exits by type
Note: N/A indicates this information has not been publicly disclosed.
Note: Definitions of the types of exit can be found in the ‘definitions’ section of this report.
3511
144
176
170142
3700
90373
121
801795
95
0 200 400 600 800 1,000
Buyback
Strategic sale
IPO
Secondary sale
Public market sale
Q3 2013
Q2 2014
Q3 2014
Value of deals (in US$ Mn)
Data provided by Venture Intelligence.

PwC MoneyTreeTM India Report – Q3 ’14 13
Top five PE exits Q3 ’14
The top five exits comprised 65% of the total exit value in Q3 ’14.
Top 5 PE exits in Q3 2014
Company Industry InvestorsDeal amount (USD Mn)
Idea Cellular Telecom Providence 234
Mahindra & Mahindra Manufacturing Goldman Sachs 227
Petronet LNG Energy ADB 117
Repco Home Finance BFSI Carlyle 79
IndusInd Bank BFSI General Atlantic 66 Data provided by Venture Intelligence.

PwC MoneyTreeTM India Report – Q3 ’14 14
4. Active PE firms
Based on the volume of deals, Sequoia Capital has emerged as the most active investor for Q3 ’14.
The most active PE investors in the third quarter of 2014 include the following:
Most active PE investors in Q3 ’14
Investors No of deals
Sequoia Capital India 7
Nexus Ventures 6
Matrix Partners India 6
Helion Ventures 5
Kalaari Capital 5
Tiger Global 5
IFC 4
SAIF 4
Qualcomm Ventures 4
Omidyar Network 3
Faering Capital 3
Blume Ventures 3
IDG Ventures India 3
India Quotient 3
Inventus Capital Partners 3 Data provided by Venture Intelligence.
Investors No of deals
Accel India 3
ADB 2
Infuse Ventures 2
Saama Capital 2
Mayfield 2
Parampara Capital 2
Bessemer 2
Ratan Tata 2
Norwest 2
Zodius Capital 2
IvyCap Ventures 2
Steadview 2
Apax Partners 2
JAFCO Asia 2
WestBridge 2
* Number of deals includes both single and co-investments by PE firms. In cases where two or more firms have invested in a single deal, it is accounted as one deal for each of the firms.
PwC MoneyTreeTM India Report – Q3 ’14 15
5. Sector focus IT & ITeS sector
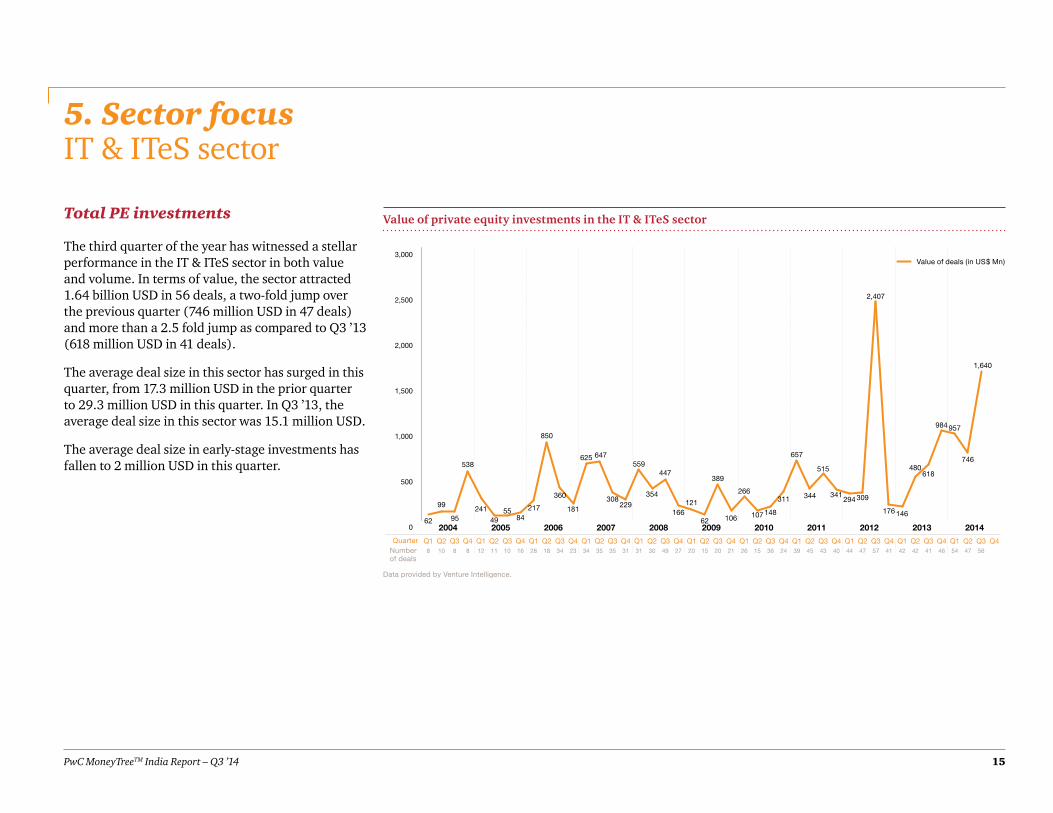
Total PE investments
The third quarter of the year has witnessed a stellar performance in the IT & ITeS sector in both value and volume. In terms of value, the sector attracted 1.64 billion USD in 56 deals, a two-fold jump over the previous quarter (746 million USD in 47 deals) and more than a 2.5 fold jump as compared to Q3 ’13 (618 million USD in 41 deals).
The average deal size in this sector has surged in this quarter, from 17.3 million USD in the prior quarter to 29.3 million USD in this quarter. In Q3 ’13, the average deal size in this sector was 15.1 million USD.
The average deal size in early-stage investments has fallen to 2 million USD in this quarter.
Value of private equity investments in the IT & ITeS sector
0
500
1,000
1,500
2,000
2,500
3,000
2004 2005 2006 2007 2008 2009 2010 2011 2012 2013 2014Quarter
Number of deals
Data provided by Venture Intelligence.
Q1 Q2 Q3 Q4 Q1 Q2 Q3 Q4 Q1 Q2 Q3 Q4 Q1 Q2 Q3 Q4 Q1 Q2 Q3 Q4 Q1 Q2 Q3 Q4 Q1 Q2 Q3 Q4 Q1 Q2 Q3 Q4 Q1 Q2 Q3 Q4 Q1 Q2 Q3 Q4 Q1 Q2 Q3 Q4
241
49 84
850
360
625
181
647559
447
62
121
389
148107106
657
16621755
229308
354 266 341 309
515
311 344 294
2,407
176
538
95
99
62
618480
146
984 957
1,640
746
Value of deals (in US$ Mn)
318 10 8 8 12 11 10 16 28 18 34 23 34 35 35 31 30 49 27 20 15 20 21 26 15 36 24 39 45 43 40 44 47 57 41 42 42 41 46 54 47 56
PwC MoneyTreeTM India Report – Q3 ’14 16
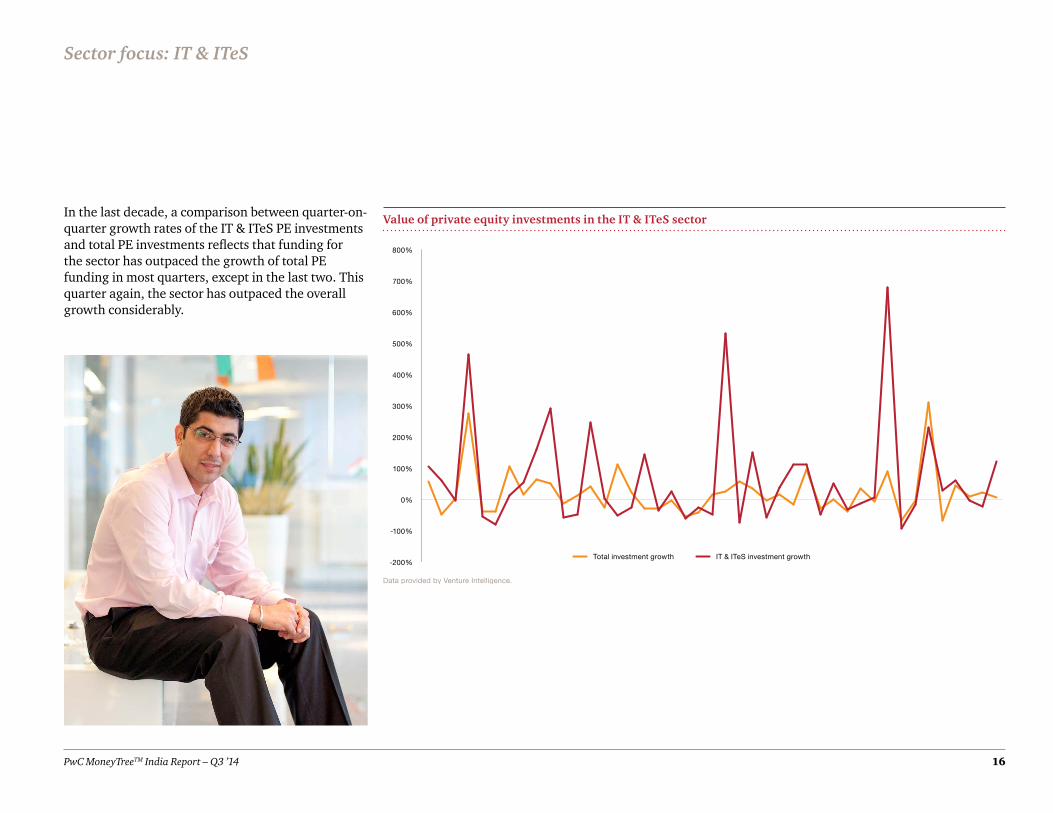
In the last decade, a comparison between quarter-on-quarter growth rates of the IT & ITeS PE investments and total PE investments reflects that funding for the sector has outpaced the growth of total PE funding in most quarters, except in the last two. This quarter again, the sector has outpaced the overall growth considerably.
Value of private equity investments in the IT & ITeS sector
Sector focus: IT & ITeS
-200%
-100%
0%
100%
200%
300%
400%
500%
600%
700%
800%
Total investment growth IT & ITeS investment growth
Data provided by Venture Intelligence.

PwC MoneyTreeTM India Report – Q3 ’14 17
Investments by stage of development Q3 ’13, Q2 ’14 and Q3 ’14
Investments in the growth stage have outpaced all other modes in this quarter, seeing 92% of the total value. Growth investments in this quarter stood at 1.51 billion USD, a three-fold increase from the previous quarter and a six-fold growth over Q3 ’13.
There was neither a buy-out, nor a pipe deal in the technology sector in this quarter. Only three late-stage investments were valued at 70 million USD.
IT & ITeS investments by stage of development
Sector focus: IT & ITeS
0 500 1,000 1,500 2,000
Pre-IPO
Early
PIPE
Growth
Late
Buyout
000
102
0
64
43
190
1,506506
245
70117
15
03
315
Q3 2013
Q2 2014
Q3 2014
Value of deals (in US$ Mn)
Data provided by Venture Intelligence.

PwC MoneyTreeTM India Report – Q3 ’14 18
Investments by region Q3 ’13, Q2 ’14 and Q3 ’14
Bangalore has continued its run as the best IT investment destination in this quarter, attracting 72% of the total investments in the sector during this quarter. The city has attracted 1.18 billion USD in 17 deals, followed by Mumbai (211 million USD in 15 deals) and NCR (144 million USD in nine deals).
IT & ITeS investments by region
Sector focus: IT & ITeS
5
35
17
10
0
4
16
0
63
0
13
2
28
3214
144224
6
1,179321
235
211104
341
0 200 400 600 800 1,000 1,200 1,400
Others
Kochi
Pune
Hyderabad
Chennai
NCR
Bangalore
Mumbai
Q3 2013
Q2 2014
Q3 2014
Value of deals (in US$ Mn)
Data provided by Venture Intelligence.

PwC MoneyTreeTM India Report – Q3 ’14 19
Investments by subsector Q3 ’13, Q2 ’14 and Q3 ’14
The online services subsector has received almost 85% of total deal value, with 1.39 billion USD in 28 deals, followed by mobile services (138 million USD in nine deals) and enterprise software (79 million USD in 13 deals).
None of the other subsectors received considerable investments in this quarter.
IT & ITeS investments by subsector
Sector focus: IT & ITeS
79
29
48
4
0
1
12
7
25
0
0
6
138
300
33333
228
3
1,385579
262
0 200 400 600 800 1,000 1,200 1,400 1,600
Others
Networkingtechnology
Mobileservices
Enterprisesoftware
IT products
IT services
ITeS—BPO
Onlineservices
Q3 2013
Q2 2014
Q3 2014
Value of deals (in US$ Mn)
Data provided by Venture Intelligence.
PwC MoneyTreeTM India Report – Q3 ’14 20
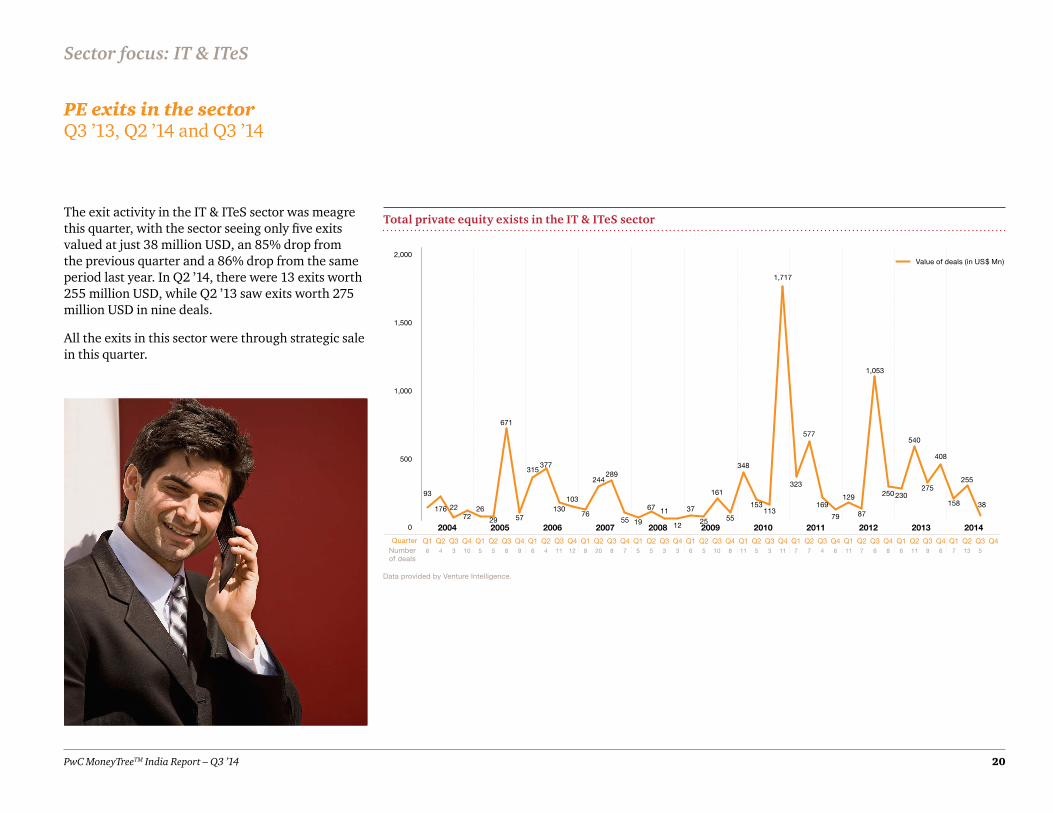
PE exits in the sector Q3 ’13, Q2 ’14 and Q3 ’14
The exit activity in the IT & ITeS sector was meagre this quarter, with the sector seeing only five exits valued at just 38 million USD, an 85% drop from the previous quarter and a 86% drop from the same period last year. In Q2 ’14, there were 13 exits worth 255 million USD, while Q2 ’13 saw exits worth 275 million USD in nine deals.
All the exits in this sector were through strategic sale in this quarter.
Total private equity exists in the IT & ITeS sector
Sector focus: IT & ITeS
0
500
1,000
1,500
2,000
2004 2005 2006 2007 2008 2009 2010 2011 2012 2013 2014Quarter
Number of deals
6 4 3
Q1 Q2 Q3 Q410
Q15
Q25
Q38
Q49
Q16
Q24
Q311
Q412
Q18
Q220
Q38
Q47
Q15
Q25
Q33
Q43
Q16
Q25
Q310
Q48
Q111
Q25
Q33
Q411
Q17
Q27
Q34
Q46
Q111
Q27
Q36
Q48
Q16
Q211
Q39
Q46 7 13 5
Q1 Q2 Q3 Q4
26
29 57
377
13076
103
244
19
1125
37
161
113153
55
323
12
315
671
55
289
67
348
79 87169
1,717
577
129
1,053
250
7222176
93275
540
230
408
158 38
255
Value of deals (in US$ Mn)
Data provided by Venture Intelligence.

PwC MoneyTreeTM India Report – Q3 ’14 21
6. Definitions
Stages of development
Early stage: This refers to the first or second round of institutional investments in companies that adhere to the following:
• Less than five years old
• Not part of a larger business group
• Investment is less than 20 million USD
Growth stage: This refers to investments of less than 20 million USD. Also, investments meeting the following criteria are considered in the growth stage:
• Third or fourth round funding of institutional investments
• First or second round of institutional investments for companies that are more than five years old and less than 10 years old or spin-outs from larger businesses
Growth stage-PE: This includes the following:
• First or second round of investments worth 20 million USD or more
• Third or fourth round funding for companies that are more than five years old and less than 10 years old or subsidiaries or spin-outs of larger businesses
• Fifth or sixth rounds of institutional investments
Types of PE exits
Buyback: This includes the purchase of the PE or VC investors’ equity stakes by either the investee company or its founders or promoters.
Strategic sale: This includes the sale of the PE or VC investors’ equity stakes (or the entire investee company itself) to a third-party company (which is typically a larger company in the same sector).
Secondary sale: Any purchase of the PE or VC investors’ equity stakes by another PE or VC investors constitutes secondary sale.
Public market sale: This includes the sale of the PE or VC investors’ equity stakes in a listed company through the public market.
Initial public offering (IPO): This includes the sale of PE or VC investors’ equity stake in an unlisted company through its first public offering of stock.
Late stage: This comprises the following:
• Investment in companies that are a decade old
• Seventh or later rounds of institutional investments
PIPEs: The following constitute as PIPEs:
• PE investments in publicly listed companies via preferential allotments or private placements
• Acquisition of shares by PE firms via the secondary market
Buyout: This is an acquisition of controlling stake via purchase of stakes of existing shareholders.
Buyout–large: This includes buyout deals of 100 million USD or more in value.
Other: This includes PE investments in special purpose vehicle (SPV) or project-level investments.

PwC MoneyTreeTM India Report – Q3 ’14 22
www.pwc.com/globalmoneytreewww.pwc.in
Contacts
Sandeep Ladda Leader, Technology [email protected]
Sanjeev Krishan Leader, Private Equity [email protected]
This report was researched and written by the following:
Pradyumna Sahu Director, Technology [email protected]
Sibi Sathyan Knowledge Manager, Private Equity [email protected]
For more information
If you would like to discuss how these findings might impact your business or your future strategy, please reach out to any of our technology industry leaders listed below.
Raman Chitkara Global Technology Leader 1 408 817 3746 [email protected]
Rod Dring – Australia Werner Ballhaus – Germany Yury Pukha – Russia 61 2 8266 7865 49 211 981 5848 7 495 223 5177 [email protected] [email protected] [email protected]
Estela Vieira – Brazil Sandeep Ladda – India Greg Unsworth – Singapore 55 1 3674 3802 91 22 6689 1444 65 6236 3738 [email protected] [email protected] [email protected]
Christopher Dulny – Canada Masahiro Ozaki – Japan Philip Shepherd – UAE 416 869 2355 81 3 5326 9090 97 1 43043501 [email protected] [email protected] [email protected]
Jianbin Gao – China Hoonsoo Yoon – Korea Jass Sarai – UK 86 21 2323 3362 82 2 709 0201 44 0 1895 52 2206 [email protected] [email protected] [email protected]
Pierre Marty – France Ilja Linnemeijer – The Netherlands Tom Archer – US 33 1 5657 58 15 31 88 792 4956 1 408 817 3836 [email protected] [email protected] [email protected]

About PwC’s Technology Institute
The Technology Institute is PwC’s global research network that studies the business of technology and the technology of business with the purpose of creating thought leadership that offers both fact-based analysis and experienced-based perspectives. Technology Institute insights and viewpoints originate from active collaboration between our professionals across the globe and their first-hand experiences working in and with the technology industry.
About PwC
PwC firms help organisations and individuals create the value they are looking for. We are a network of firms in 157 countries with more than 195,000 people who are committed to delivering quality in assurance, tax and advisory services. Find out more and tell us what matters by visiting us at www.pwc.com.
www.pwc.com
PricewaterhouseCoopers and Venture Intelligence have taken responsible steps to ensure that the information contained in the MoneyTreeTM report has been obtained from reliable sources. However, neither of the parties can warrant the ultimate validity of the data obtained. Results are updated periodically. Therefore, all data is subject to change at any time. Before making any decision or taking any action, you should consult a competent professional adviser.
© 2014 PwC. All rights reserved. PwC refers to the PwC network and/or one or more of its member firms, each of which is a separate legal entity. Please see http://www.pwc.com/structure for further details. This content is for general information purposes only, and should not be used as a substitute for consultation with professional advisors. MW-15-0805PwC MoneyTreeTM India Report – Q3 ’14