price discovery and arbitrage efficiency of indian equity
TRANSCRIPT

1
Price Discovery and Arbitrage Efficiency of Indian Equity Futures and Cash Markets
Kapil Gupta1
Dr. Balwinder Singh2 Abstract:
Present study investigates the price discovery efficiency and validity of Law of One Price in the Indian equity market by using tick-by-tick data available at National Stock Exchange of India. The study finds that strong and stable long-run relationship exists between Indian equity futures and cash markets, however, during short-run significant deviations from equilibrium relationship have been observed. Empirical findings in the study suggest that price discovery takes place in both markets, whereas, the Indian equity futures market dominates the information transmission process and the duration of lead-lag between two markets has been found to be varying in the range of five to fifty five minutes.
The study has further found that days to expiry do not play significant role in the price discovery mechanism of Nifty futures contracts. However, mispricings for individual stock futures contracts have been found to be significantly negatively associated with days to expiry, which implies that near to the expiration date more arbitrage opportunities are available and these findings support the early liquidation option as proposed by Brennan and Schwartz (1990). Regulatory restriction on the participation of institutional traders may be a significant factor leading to negative association between mispricings of futures contracts and days to expiry, therefore, they might be preferring either to unwind or to rollover their positions before maturity date, which not only makes money available to them but also enables them to take new positions.
Key Words: Price Discovery, Law of One Price, Arbitrage Activities, Cost-of-Carry, Information Spillover, Basis Risk, Early Liquidation Option and Market Microstructure. ____________________ 1 Faculty Member, IBS Gurgaon, Gurgaon, India, Email: [email protected]. 2 Reader, Department of Commerce and Business Management, Guru Nanak Dev University, Amritsar (143005), Punjab, India, Email: [email protected].

2
Price Discovery and Arbitrage Efficiency of Indian Equity Futures and Cash Markets
Section I: Introduction
Perfect market models presume that all traders are equally endowed with knowledge and ability to analyze the available information set(s). However, in reality, traders (due to circumstances and taste differentials) are observed to concentrate on acquiring particular set(s) of information and they leave to others to discount rest of it. Nonetheless, asset valuation theories suggest that if useful information is neglected, better-informed traders would soon recognize the opportunity to book risk-free profits from its collection and use. Traders making profits on expectation differentials arising from information differences suggest the information exchange role for futures market besides its traditional insurance or risk allocation function. Therefore, if inclusion of futures price in the decision making process eliminates noise in the pricing system, it suggests that information known to the informed traders has become public, which implies that expectations with respect to the future spot price for both groups will be same and the information exchange role of the futures market would cease. However, as long as the noise remains in the pricing system, a difference in return expectations will persist, which would provide incentives for collection and use of private information, thus, supports the information exchange role for the futures market (Brannen and Ulveling (1984)).
Considering the information exchange and price discovery roles of the futures market, many theoretical as well as empirical attempts (see table I) have been made and the regulatory bodies, market makers, academicians and practitioners unanimously have agreed upon the common notion that organized futures markets contain significant information for the prospective cash market price changes in short-run, irrespective of the fact that in the long-run, both markets observe strong and stable co-movement. However, Wahab and Lashgari (1993), Chan and Lien (2001), Chen et al., (2002), Lin et al., (2002), Lien et al., (2003), Lin et al., (2003), Mukherjee and Mishra (2006) and Thomas (2006) have found contrary evidence suggesting that cash market serves as dominant market and futures market behaves like satellite market1.
The cost-of-carry relationship between two markets further implies that since price movements in both markets are subject to common information set(s), therefore,
1 Lead-lag relationship between futures and cash markets has been a subject of interest for practitioners, traders, regulatory bodies and academicians alike because leading market may help the change agents to trigger regulatory changes and correct the market inefficiencies (Raju and Karande (2003)). It may also help portfolio managers to hedge their portfolio risk and boost the hedger’s trading participation in the futures market, which may lead to the cash market stabilization (Ederington (1979), Figlewski (1984), Alexander (1999), Neuberger (1999) and Chang et al., (2000)). Lead-lag relationship between two markets is followed by information transmission from one market towards other but it should not be interpreted that information transmission takes place from dominant market towards the satellite market only because it is bi-directional phenomenon. However, the speed and amount of information transmission from one market to other would certainly be different (Kawaller et al., (1987), Stoll and Whaley (1990), Chan (1992) and Wahab and Lashgari (1993)).

3
law of one price must hold (Hasbrouck (1995)) and any deviation between two price series must be subject to transaction cost (Protopapadakis and Stoll (1983) and Goodwin (1992)). However, in real world, significant violations of law of one price have been observed (see table II), which implies that though stable long-run relationship persists between two markets, but during short-run, both price series significantly deviate from each other and offer exploitable arbitrage opportunities (Cox et al., (1981) and Stoll and Whaley (1990)).
Nevertheless, Cornell and French (1983a), Mackinlay and Ramaswamy (1988), Yadav and Pope (1990), Twite (1992), Neal (1996), Brailsford and Hodgson (1997), Akin (2003), Lee (2005) and Vipul (2005a and 2005b) found that the assumptions of cost-of-carry model do not hold in reality but Brailsford and Cusack (1997) by using three different futures pricing models (namely; cost-of-carry model, Ramaswamy-Saundaresan model and Hemler-Longstaff model) found that each model shows pricing errors and though small but exploitable arbitrage opportunities were persistent. Therefore, Brailsford and Cusack (1997) concluded that pricing errors besides the model misspecification (as evidenced in Cox et al., (1981)) may be a positive function of time-to-maturity and illiquidity in the market.
In addition, empirical works (see table II) have often found evidences of substantial and sustained ‘wave-like’ mispricings between cash and futures markets. One explanation to mispricings between two price series may be the immaturity of arbitrage sector to connect two markets. Other possible explanation put forward as potential determinants of mispricings includes infrequent trading in underlying asset and non-synchronous trading between two markets (Neal (1996) and Brailsford and Hodgson (1997)).
Presence of market frictions have also been documented as one of the potential factors, which leads to deviations between futures and the forward prices (Stoll and Whaley (1990)) because market frictions disturb market equilibrium and the asset market with relative cost advantage starts leading the corresponding market. This suggests that strategic trading rules may be formulated to book risk free profits available in the market (Brannen and Ulveling (1984), Lai and Lai (1991), Jong and Donders (1998), Min and Najand (1999) and Chan et al., (2004)).
Some more possible reasons for persistence of large spreads over the period may be the presence of imperfect market microstructure settings and the purpose for which futures contracts are used. For instance; Beaulieu et al., (2003) observed that reduction in tick size of TSE 35 Index Participation Units from 0.60% to 0.25% of the prevailing price helped to improve its price discovery efficiency in Canada, which implies that improvements in contract specifications help to improve the price discovery efficiency of the asset. Furthermore, Jiang et al., (2001) found that contemporaneous relationship between futures and cash markets got strengthened with removal of short selling restrictions in the Hong Kong cash market particularly when the market was undergoing bear phase and the underlying asset was relatively overpriced. Therefore, imperfect trading specifications of the futures contracts may be responsible for violation of the common notion that an asset, which involves zero investment, will always be an efficient price discovery vehicle (also see, Diamond and Verrecchia (1987), Puttonen (1993), Kempf (1998) and Beaulieu et al., (2003)).

4
Cornell and Reinganum (1981) found that absence of tax implications and the ability of traders to short sell were important features of the foreign exchange market (which are absent in other markets), which enables currency futures to represent their fundamental values. Antoniou et al., (1998) further found that due to restrictions on the participation of foreign institutional investors in futures market (which lead to lesser competitiveness in the market), information asymmetry in Spain significantly increased after the introduction of futures trading2. Therefore, presence of artificial trading restrictions may make arbitrageurs handicapped to correct price deviations between two markets, hence, as on the maturity date, traders would prefer to rollover to next contract instead of booking losses (because in most of futures markets, payoffs are settled in cash not by physical delivery).
The purpose of usage of futures market may be another important determinant of persistence of large spreads between futures and forward prices because empirical literature has found significantly dispersed market reactions to the dynamic interactions of speculators and hedgers. Bessembinder and Seguin (1992 and 1993), Gulen and Mayhew (2000) and Thomas (2006) have found that prominent usage of futures contracts for hedging, results into decline in the unwanted fluctuations in the cash market, whereas, every increased participation of noise traders amplify information asymmetry as well as the cash market volatility3.
Furthermore, Kumar and Seppi (1994) found that illiquidity might have long lasting impact on basis; therefore, arbitrageurs struggle to close the gap between two prices. Roll et al., (2007) found that liquidity and basis in addition to being contemporaneously correlated forecast each other. They found bidirectional granger causality between short-term absolute basis and effective spreads. They have also found that quoted and effective spreads granger cause longer-term absolute basis, which suggests that liquidity enhances the efficiency of futures/cash pricing system and helps to mitigate pricing errors. Spread in prices of both markets is negatively associated with information assimilation efficiency of both markets, which improves with every addition in the market wide liquidity (Campbell et al., (1993)). Hence, spreads in prices of both markets would reduce as early as futures and the underlying asset markets mature.
Besides, researchers like Cornell and French (1983a and 1983b), Mackinlay and Ramaswamy (1988), Yadav and Pope (1994), Antoniou and Holmes (1995), Neal (1996), Stoll and Whaley (1997), Chow et al., (2003), Lien and Yang (2003), Vipul (2005a and 2005b) and others have found significant relationship between mispricings and time-to-expiry of the contract. They have found that arbitrage opportunities were positively
2 Chen et al., (2002), Lin et al., (2002 and 2003), Mukherjee and Mishra (2006), Sah and Kumar (2006) and Thomas (2006) also found that regulatory bottlenecks on (foreign as well as domestic) institutional trader’s participation in derivatives market were major reasons for futures markets in Taiwan and India to behave like satellite markets, whereas in these countries, cash markets have been found to be an efficient price discovery vehicle. 3 In a theoretical model, Kyle (1985) defines market depth as the order flow required to move prices by one unit. His model suggests that market depth changes with trading activity (volume) and is also related to non-informational trading activity. According to the Kyle model, high market depth would be more closely associated with lower price volatility than would low depth, given the same level of trading volume. Thus, market depth may provide additional information about the interaction between price volatility and trading volume.

5
associated with time-to-expiry and as soon as contracts approach near to the expiration date, mispricings disappear or if were available, these were not economically exploitable. Cornell and French (1983a and 1983b) argued that in the presence of tax timing option, mispricings should be negative and converge to zero as time to expiration decreases because the value of tax timing option declines with reduction in time-to-expiry. However, Yadav and Pope (1990) found contrary results that time-to-maturity does not affect the intensity of mispricings.
In addition, Vipul (2005a and 2005b) found that individual days of one week to expiry do not show different mispricing patterns in India. He explains that since NIFTY futures were generally underpriced4, therefore, as soon as the date of expiry approaches, mispricings go down partially because squaring up of short positions by hedgers creates sufficient demand of long positions in the futures market, which is reflected through shedding of open interest positions about one week prior to the expiry of futures contracts in India. Since, as on the date of expiry, uncertainty about expected dividend yield goes away, therefore, prices of futures contracts closely reflect the prices of underlying asset.
In addition to the time-to-maturity effect on mispricings, researchers like Brailsford and Hodgson (1997) and Vipul (2005a and 2005b) have examined whether the pattern of mispricings changes over different trading days-of-the-week. Brailsford and Hodgson (1997) found that index futures have significantly lower mispricings on Fridays in the Australian Market. However, Vipul (2005a and 2005b) did not find any significant evidence of days-of-the-week effect on mispricings in the Indian equity futures market.
Yadav and Pope (1990) further noted that mean arbitrage profits were positive when initially the futures contracts were underpriced, however, the mean arbitrage profits were negative when futures contracts were initially overpriced. They also noted that first order autocorrelation coefficient of mispricings were negative, which is obvious in the presence of an effective link between the cash and futures markets. Yadav and Pope (1990) and Neal (1996) also found that since the sign of mispricings revert to every new information shock, therefore, early unwinding option may prove to be a better option for arbitrageurs to book extra normal profits5. Yadav and Pope (1990) observed that additional profits arising out of rollover or early unwinding were a significant proportion of the total arbitrage profits and often exceeded the arbitrage profits arising from simple hold till expiration strategy. They further mentioned that additional profits imply a heavy transaction cost discount and should generate substantial arbitrage activity even when futures prices are within the transaction cost bounds. Neal (1996) consistent with
4 Underpriced futures contracts indicates that the volume of shorters was higher than those who were long in the market, where; shorters may be investors and fund managers who hedge their investments or funds and speculators being the counter party were long in the market because they could buy underlying asset at a lower price. 5 Neal (1996) mentions that contrary to the basic arbitrage model, the ability to liquidate an arbitrage position before expiration is a valuable option and affects the decision to establish an arbitrage option. The early liquidation model of Brennan and Schwartz (1990) predicts that an arbitrage position will be established when absolute deviation from fair value plus the value of the option to liquidate the position early exceeds the transaction costs of arbitrage.

6
Brennan and Schwartz (1990) found that arbitrage trade was a positive function of absolute deviation from fair value and of the directional volatility6.
Another important issue, which may potentially be another strong determinant of mispricings between two markets, that is, the return generation process in both markets is inefficient, which is reflected in the form of statistically significant autoregressive returns (for instance; see Stevenson and Bear (1970), Rendleman and Carabini (1979), Koppenhaver (1983), Klemkosky and Lasser (1985), Glassman (1987), Gross (1988), Lo and MacKinlay (1988), Choudhry (1991), Johnson et al., (1991) and Gupta and Singh (2006b)). Delayed information assimilation in both markets cause bid/ask bounce, which generates intra market arbitrage opportunities and will result into widening of spread between two markets. Therefore, if return generation process in both markets is inefficient, basis would likely be to wander away from the cost-of-carry and possibilities of price convergence as on maturity date may be doubtful (for detailed discussion, see Fortenbery and Zapata (1997), Theobald and Yallup (2001), Zeng (2001), Monoyios and Sarno (2002) and Pattarin and Ferretti (2004)), which would enforce traders to rollover their current positions to the next contract cycle, hence, the cash market volatility will increase.
The above discussion suggests that though futures and cash markets observe strong and stable long run comovement but during short run significant lead lag relationship exists between two markets, which might offer risk free profit making opportunities to arbitrageurs. As early as arbitrageurs exploit the arbitrage opportunity, price discovery efficiency in both markets will improve and hedgers would be benefited because early exploitation of arbitrage opportunities tends to reduce variation in basis risk (Merrick Jr. (1988)). Review of empirical literature further suggests that irrational/unreal assumption of the estimation model and imperfect market microstructural settings are prominent factors, which cause exploitable deviations between prices of two markets. However, since, most of the studies have been conducted in developed markets and emerging markets are neglected to an extent, hence, the academic theories emerged out of empirical observations may not be universalized.
The current study is an attempt to examine the price discovery and arbitrage efficiency of an emerging capital market i.e. India, which is one of the most liquid markets of the world. Though, many empirical attempts have been made to examine the price discovery (Table I) and arbitrage efficiency (Table II) in the Indian equity futures
6 Neal (1996) cites two limitations in the early liquidation option, which emerge because Brennan and Schwartz (1990) assumed that deviations between actual and theoretical futures contract price should follow Brownian Bridge Process, which would force mispricings to be zero at maturity and induce mean reversion in mispricings. First limitation Neal (1996) cited was that, early liquidation option (unlike basic arbitrage model) does not incorporate any bounds, which arbitrage will place on level and volatility of deviation from fair value because a bounded process is likely to affect the value of the early liquidation option. More generally, if the deviations are bounded by arbitrage, the volatility relevant to valuing the early liquidation option will not be the variance of mispricings but a measure of how quickly such mispricings reverses sign. The second limitation he cites is that the degree of reversion implied by the Brownian Bridge Process is simply proportional to 1/(T-t), where (T-t) is the time to maturity. As Brennan and Schwartz (1990) acknowledged that the process does not include other state variables, such as index arbitrage, which are likely to induce reversion, therefore, the empirical tests have used proxies for the value of the early liquidation option.

7
market but yet no conclusive evidence is available whether Indian equity futures market serves as an efficient price discovery vehicle. To the best of researchers’ knowledge, one of the most prominent reasons for inconclusive evidence on price discovery and arbitrage efficiency of the Indian equity futures market may be that these empirical studies (except Bhatia (2007)) have employed daily closing prices, whereas, robust examination of price discovery and arbitrage efficiency of closely linked markets is possible by using high frequency (i.e. intraday) data (see, Diagler (1990)).
Nonetheless, Bhatia (2007) has used intraday data and has evidenced that Indian equity futures market is an efficient price discovery vehicle but the scope of the study is limited to Nifty futures and data has been considered only for one year. Present study reexamines the price discovery and arbitrage efficiency in the Indian equity futures market by using five minutes data of relatively lengthy time frame (i.e. April 2003 to March 2007) for Nifty as well as fifty most liquid individual stocks.
Current study attempts to address four empirical issues: (i) whether futures and cash markets observe strong and stable long run relationship; (ii) whether both markets observe strong comovement during short run; (iii) which market serves as a source for information/volatility spillover during short run; and (iv) how mispricings behave during the contract cycle. The study has been organized into four sections; section one introduces the problem, section two details about the data base and research design, section three discusses results and analysis and section four concludes the study.
Section II: Data Base and Research Design Present study employs high frequency data from April 2003 to March 2007 for
examining the price discovery and arbitrage efficiency in the Indian equity futures market. In order to avoid non synchronous trading between two markets (similar to Stoll and Whaley (1990)), all observations at five minutes interval (in both futures and cash segments) for Nifty and fifty most liquid individual stocks (Appendix A) have been considered. In addition to the trading activity in the futures segment, fifty most liquid individual stocks have been selected on the basis of following sample selection criteria:
1. In order to avoid the potential bias of corporate actions (namely, issue of bonus shares and stock splits) on the information dissemination efficiency of both equity stocks as well as stock futures contracts, the present study includes only those individual stocks in the sample size of the study, whose price series during the sample period were not adjusted due to any corporate action (for example see Lamoureux and Lastrapes (1990)). The dates of bonus issues and stock splits have been checked with Capitaline Database.
2. All those individual stock futures contracts, whose trading during the sample period was banned by stock exchange authorities due to any reason7, doesn’t form part of the sample size. This sample selection criterion negates the chances of including those individual stock futures contracts, whose trading was not continuous during the sample period, which otherwise could be a potential factor
7 See Eligibility Selection Criteria for permitting and discontinuing the trading of Indices and Individual Stocks in F&O segment at NSE (www.nseindia.com).

8
responsible for inefficient price discovery (for example see Campbell et al., (1993)).
The price series of mid and far month futures contracts were also available but due to their low trading activity and turnover volume8, both series have suffered with significant irregular trading. Therefore, the present study restricts the scope of the study to examine the price discovery and arbitrage efficiency of near month futures contracts because Efficient Market Hypothesis presumes voluminous and continuous trading activity (for details; see Campbell et al., (1993)).
Prior to using time series data in econometrical analysis, it is necessary that its statistical features (including unit root and cointegration) should be tested because existence of unit roots leads to spurious estimations. In order to test for the existence of unit roots and to determine the order of differencing necessary to convert non stationery series into stationary series, Augmented Dicky-fuller (ADF) and Phillip Perron test (PP) tests have been applied. Therefore, prior to applying econometrical procedures, if the price series of cash (St) as well as futures markets (Ft) are found to be non stationary, these will be differenced to convert these into stationary series. Table III reports the unit root test results of the price series of futures, cash and basis, which suggests that price series of futures and cash markets are non stationary at levels, whereas, their log first difference is stationary9. This implies that both series may be I(1); hence, should observe long run relationship, which is also evident from stationarity results of basis.
In addition, the long run relationship between two series has been examined by applying Johansen and Juselius (1990) cointegration procedure, which states that coefficient matrix (Π) contains essential information about the relationship between St and Ft. Specifically, if rank (Π) = 0, then Π is the 2x2 zero matrix, which implies that there is no cointegration relationship between St and Ft-n. However, if Π contains full rank, i.e. rank (Π) = 2 in case of futures and cash markets, then all variables in Xt are I(0), whereas, if Π has reduced rank, i.e. rank (Π) = 1, then there is a one cointegrating relationship between St and Ft, which is given by any row of matrix Π and the expression ΠXt-1 will be the error-correction term in equation (1)10. Where Xt is the 2x1 vector
8 Trading volume in mid and far months has been a result of rollovers in the last week of month i.e. near expiration date (for detail, see Thomas (2006)). 9 In order to save space, the unit root test results of futures and cash market price series at levels are not reported but are available on demand. 10 Since rank (Π) equals the number of characteristic roots (or eigen values) which are different from zero, the number of distinct cointegrating vectors can be obtained by estimating the number of these eigen values, which are significantly different from zero. The characteristic root of the n×n matrix Π, are the values of λ which satisfy the following equation 0nIλΠ − = , where In is a n×n identity matrix. Johansen (1988), proposed the following two statistics to test for the rank of Π:
1
max 1
ˆ( ) ln(1 )
ˆ( , 1) ln(1 )
n
trace ii r
r
r T
r r T
λ λ
λ λ= +
+
= − −
+ = − −
∑
Where, iλ are the eigen values obtained from the estimate of the Π matrix and T is the number of usable
observations. The traceλ tests the null that there are at most r cointegrating vectors, against the alternative

9
( , )t tS F ′of log-spot and log-futures prices, respectively, ∆ denotes the first difference operator and εt is a 2x1 vector of error terms , ,( , )S t F tε ε ′ . The VECM specification contains information on both short and long-run adjustment to changes in Xt, via the estimated parameters Γi and Π, respectively. In such case, Π can be factored into two separate matrices α and β, both of dimensions 2x1, where 1 represents the rank of Π such as αβ ′Π = , where β ′ represents vector of cointegrating parameters and α is the vector of error correction coefficients measuring the speed of convergence to the long-run steady state (cited in Thomas (2006)).
1
11
,p
t i t i t ti
X X X ε−
− −=
∆ = Γ ∆ + Π +∑ …………………(1)
Once the long run relationship between two markets has been identified (table IV), it is important to examine the short run relationship between two series and to study the direction of information transmission. Voluminous literature on short-run dynamics between futures and cash markets (see table I), has applied Granger Causality methodology to examine the direction of information transmission. The null hypothesis of Granger Causality methodology is that there is no causal relationship between two variables, however, rejection of the null hypothesis suggests that there is significant information transmission from one market to other and it may be unidirectional or may be bidirectional subject to the market conditions in which these two series interact. Equation (2) lays down the estimation procedure of Granger Causality methodology, where, RSSR = Restricted Residual Sum of Squares, RSSUR = Unrestricted Residual Sum of Squares, m = Number of Lagged Terms of Endogenous Variable in Unrestricted Regression Equation, k = Number of Parameters Estimated in the Unrestricted Regression and n-k = Degrees of Freedom in F Distribution.
(RSSR – RSSUR)/m F = RSSUR/(n-k) ……………….. (2)
The number of ‘m’ lagged terms to be introduced in the causality test may be chosen on the basis of Akaike (AIC) or Schwartz Information Criterion (SIC) (see Gujarati (2003) p. 698), however, in the current study, number of lags have been decided on the basis of SIC, which uses a function of residual sum of squares together with a penalty for large number of parameters. Specifically, SIC minimizes the expression: T*log(RSS)+K*(log T), where T is the number of observations, RSS is the sum of the squared residuals and K is the number of regressor. Furthermore, it has been presumed that error terms entering into the causality tests are uncorrelated, which has been tested through White Heteroscedasticity test procedure, whose null hypothesis (variance of residuals is time invariant) has been accepted for Nifty as well as all individual stock futures contracts but in order to save the space, only F statistics and p values have been
that the number of cointegrating vectors is greater than r and the maxλ tests the null that the number of
cointegrating vectors is r , against the alternative of r+1. Critical values for traceλ and maxλ statistics are provided by Osterwald-Lenum (1992).

10
reported in table V, however, the results of White Heteroscedasticity test procedure are available on demand.
Unidirectional causality from futures (cash) to cash (futures) market indicates that estimated coefficients of the lagged futures (cash) are statistically different from zero as a group and the set of estimated coefficients of the lagged cash (futures) is not statistically different from zero. Unidirectional causal relationship suggests that traders prefer to trade through futures (cash) market, which later on transmits information to cash (futures) market, consequently significant lead-lag relationship may persist between these two. However, bidirectional causality or feedback relationship suggests that estimated sets of coefficients are statistically different from zero in both regression equations. Feedback relationship between futures and cash markets implies that both markets contain important information, which can be used to price the value content of new information in other market. Nonetheless, bidirectional causality implies feedback relationship but it does not refute the chances that two markets will observe lead-lag relationship during short-run. Finally, no causal relationship between two markets will suggest that information transmission between two markets do not result into any disturbance in equilibrium price of the other market. In efficient cost-of-carry regime, bidirectional causality between futures and cash markets is expected because current futures price at any time will be sum of current spot price and expected risk premium to hold such asset if trader is long in the cash market or opportunity cost if trader has taken short position in the cash market.
In order to investigate the lead-lag strength of a market, Vector Autoregression (VAR) and Vector Error Correction Methodologies (VECM) have been applied. VAR model as name suggests, models the vectors of variables as autoregressive processes, where each variable linearly depends upon its lagged values and those of other variables in the vector, which implies that future values of the process are a weighted sum of past and present values plus some noise and possible exogenous variables. Therefore, solutions to VAR model are the sum of both deterministic as well as stochastic components. The deterministic components depend upon initial conditions and deterministic terms and the stochastic components depend upon random shocks, which will be a weighted sum of past shocks. If the process is stable, then shocks in the distant past will have only a negligible impact, hence, the stochastic component will be the weighted sum of most recent information shocks. However, if the process is integrated (which implies that effects of past shock never decay), the stochastic component will be sum of all past shocks. Whereas, if the process is explosive, then shocks will be amplified as time passes (Rachev et al., (2006) pp. 321-372).
VAR model for futures and cash market returns can be functionally presented in equations (3.1) and (3.2). In equations (3.1) and (3.2) VAR process assumes that εf,t and
εs,t are white noise and independently and identically distributed with zero mean and finite variance. The order of lagged terms (i.e. i to p and j to p) have been decided on the basis of SIC criteria. In equations (3.1) and (3.2), Rf,t = daily returns of futures contract, Rf,t-i = lagged daily returns of futures market, Rs,t = daily returns of cash market, Rs,t-j = lagged daily returns of cash market, α0,f = intercept term of futures returns, α0,s = intercept term of cash market returns, βi = parameter of autoregressive terms and βj =

11
parameter of lagged returns of other variable in the vector. Table VI reports the estimated results of VAR model.
p p Rf,t = α0,f + Σβi (Rf,t-i) + Σβj (Rs,t-j) + εf,t ……………….(3.1) i=1 j=1 p p Rs,t = α0,s + Σβi (Rs,t-i) + Σβj (Rf,t-j) + εs,t ………………(3.2) i=1 j=1
However, since, it has been observed in table IV that futures and cash market price series are cointegrated, therefore, VECM has been applied to further examine the lead-lag relationship between two series. VECM will be estimated as per the functional relationship expressed in equations (4.1) and (4.2), where, Rf,t = daily returns of futures contract, Rf,t-j = lagged daily returns of futures market, Rs,t = daily returns of cash market, Rs,t-k = lagged daily returns of cash market, α0,f = intercept term of futures returns, α0,s = intercept term of cash market returns, αi = parameter of error correction term, βj = parameter of autoregressive terms and βk = parameter of lagged returns of other variable in the vector. Significant error correction terms will help researchers to identify the market, which will correct the information shocks so that price convergence on the maturity date may take place. Table VII reports the estimated results of VECM. p p p Rf,t = α0f + Σαif (Ft-i – St-i) + ΣβjRf,t-j + ΣβkRs,t-k + εft ……….……..…….(4.1) i=1 j=1 k=1 p p p Rs,t = α0s+ Σαis (Ft-i – St-i) + ΣβjRs,t-j + ΣβkRf,t-k + εst ……..………….….(4.2) i=1 j=1 k=1
Once the present study has identified that significant lead-lag relationship exists between Indian equity futures and cash markets, regulatory bodies and practitioners are interested to know whether such lead-lag relationship can be used to exploit potential arbitrage opportunities. Since, Vipul (2005b), Gupta and Singh (2007) and Gupta (2008) have found that significant arbitrage opportunities exists in the Indian capital market, therefore, the present study estimates equation (5) to examine the pattern and behavior of such opportunities by applying high frequency data. In equation (5), Mt = Difference between theoretical and actual futures price, α0 = intercept term, βj = coefficient of autoregressive terms decided on the basis of Schwartz Information Criterion, DTE = days to expiry of the contract, DAY*MOR = dummy for morning trading sessions as on different trading days, DAY*AFT = dummy for afternoon trading sessions as on different trading days and DAY*OTH = dummy for trading sessions other than morning and afternoon trading sessions. Morning trading session means any trading activity during 9.55 am to 11.00 am and afternoon trading session includes trading activity during 2.31 pm to 3.30 pm. In order to avoid the problem of multicollinearity, the present study instead of individual dummies for trading days of the week and trading sessions uses interactive dummies for trading session as on different trading days of the week. k 4 5 5
Mt = α0 + ∑βjMt-j + βkDTE + ∑βmDAY*MOR + ∑βnDAY*OTH + ∑βoDAY*AFT + εt … (5) j=1 m=1 n=1 o=1
12
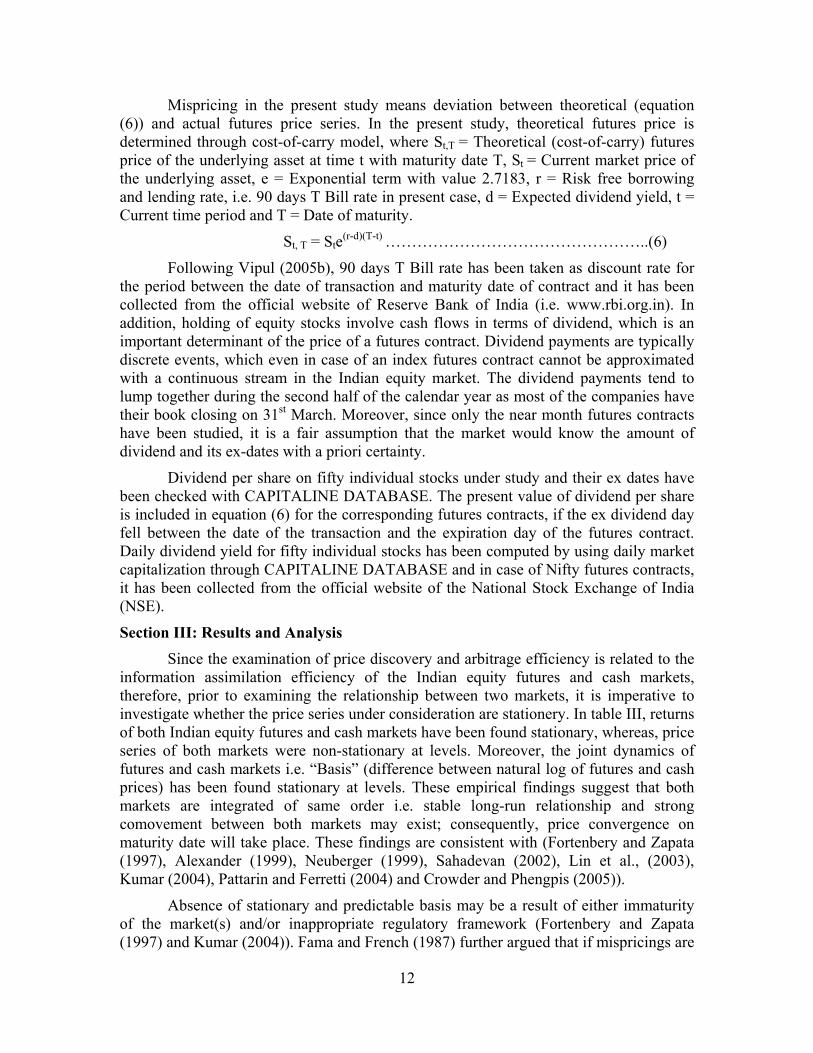
Mispricing in the present study means deviation between theoretical (equation (6)) and actual futures price series. In the present study, theoretical futures price is determined through cost-of-carry model, where St,T = Theoretical (cost-of-carry) futures price of the underlying asset at time t with maturity date T, St = Current market price of the underlying asset, e = Exponential term with value 2.7183, r = Risk free borrowing and lending rate, i.e. 90 days T Bill rate in present case, d = Expected dividend yield, t = Current time period and T = Date of maturity.
St, T = Ste(r-d)(T-t) …………………………………………..(6)
Following Vipul (2005b), 90 days T Bill rate has been taken as discount rate for the period between the date of transaction and maturity date of contract and it has been collected from the official website of Reserve Bank of India (i.e. www.rbi.org.in). In addition, holding of equity stocks involve cash flows in terms of dividend, which is an important determinant of the price of a futures contract. Dividend payments are typically discrete events, which even in case of an index futures contract cannot be approximated with a continuous stream in the Indian equity market. The dividend payments tend to lump together during the second half of the calendar year as most of the companies have their book closing on 31st March. Moreover, since only the near month futures contracts have been studied, it is a fair assumption that the market would know the amount of dividend and its ex-dates with a priori certainty.
Dividend per share on fifty individual stocks under study and their ex dates have been checked with CAPITALINE DATABASE. The present value of dividend per share is included in equation (6) for the corresponding futures contracts, if the ex dividend day fell between the date of the transaction and the expiration day of the futures contract. Daily dividend yield for fifty individual stocks has been computed by using daily market capitalization through CAPITALINE DATABASE and in case of Nifty futures contracts, it has been collected from the official website of the National Stock Exchange of India (NSE).
Section III: Results and Analysis Since the examination of price discovery and arbitrage efficiency is related to the
information assimilation efficiency of the Indian equity futures and cash markets, therefore, prior to examining the relationship between two markets, it is imperative to investigate whether the price series under consideration are stationery. In table III, returns of both Indian equity futures and cash markets have been found stationary, whereas, price series of both markets were non-stationary at levels. Moreover, the joint dynamics of futures and cash markets i.e. “Basis” (difference between natural log of futures and cash prices) has been found stationary at levels. These empirical findings suggest that both markets are integrated of same order i.e. stable long-run relationship and strong comovement between both markets may exist; consequently, price convergence on maturity date will take place. These findings are consistent with (Fortenbery and Zapata (1997), Alexander (1999), Neuberger (1999), Sahadevan (2002), Lin et al., (2003), Kumar (2004), Pattarin and Ferretti (2004) and Crowder and Phengpis (2005)).
Absence of stationary and predictable basis may be a result of either immaturity of the market(s) and/or inappropriate regulatory framework (Fortenbery and Zapata (1997) and Kumar (2004)). Fama and French (1987) further argued that if mispricings are

13
governed by market factors only, then actual basis (i.e. Ft - St) should predict the theoretical basis (i.e. St,T - St) and if β is positive and significant in equation (7), it implies that variance of actual basis will help to correct the spot price deviation from its equilibrium price. In equation (7), St, T = Theoretical futures price of the underlying asset at time t with maturity date T, St = Current market price of the underlying asset, α = Constant term, Ft = Current futures price, µt, T =Random error term.
St, T - St = α + β (Ft - St) + µt …..……………………….(7)
Therefore, finding stationary basis and both futures and cash price series stationary at first log difference (non stationary at levels) conforms to the presumptions of cointegration test procedure. Stationary basis also suggests that both markets are fairly competitive and during long-run, these efficiently discount the risk component of available information set(s).
In addition, table IV reports the Johansen Cointegration test ( traceλ and maxλ ) results and suggests that both markets are integrated of order one (except for BANKBARODA, GAIL, IPCL, MTNL, NTPC, ORIENTBANK), hence, price convergence on contract expiry date does take place, which implies that Indian equity futures and cash markets observe strong and stable long-run relationship and these findings are consistent with Thenmozhi (2002), Raju and Karande (2003), Gupta and Singh (2006a and 2006b), Sah and Kumar (2006), Thomas (2006) and Bose (2007). Absence of cointegration between futures and cash markets for six individual stocks may be a result of significantly low trading activity in either of the markets (Fortenbery and Zapata (1997) and Kumar (2004)).
Therefore, it can be concluded that Indian equity futures and cash markets are in long-run equilibrium, which implies that during long run, arbitrage mechanism in the Indian capital market may be efficient. In addition, stable long-run relationship between Indian equity futures and cash markets may be due to mean reverting nature of basis. Theoretically, it has been argued that in the presence of efficient cost-of-carry regime, Basis risk will be positively associated with time-to-expiry and it reverts to every information shock. Therefore, stationary basis is presumed to observe mean reverting behavior because when spread between two price series is different from cost-of-carry, arbitrageur’s activity will correct such deviation and basis will restart matching with cost-of-carry of the respective futures contract (Zeng (2001), Theobald and Yallup (2001), Monoyios and Sarno (2002) and Pattarin and Ferretti (2004)).
Long-run relationship between Indian equity futures and cash markets provide important input for hedgers because widely followed hedging philosophy as suggested by Ederington (1979) presumes that for efficient hedging, there should be strong co-movement between two markets and hedgers should take Beta (β) weighted positions in futures market but inverse in sign. β in Minimum Variance Hedging philosophy will be a slope coefficient, computed as ratio of covariance of futures and cash price series to the variance of futures prices. Pennings and Meulenberg (1997) further stated that Ederington’s efficient hedge ratio is expected to reduce the portfolio variance to minimum level but it may not help to achieve the portfolio objective if futures market observes thin trading, because thinly traded futures contract may not provide efficient hedging benefit in long-run, however, short-run hedge ratios may work efficiently

14
because nonetheless it will be Naïve hedge ratio (also see Theobald and Yallup (2001) and Lien (2003)).
Hasbrouck (1995) mentioned that existence of cointegration relationship between Indian equity futures and cash markets further suggest that both markets share same information set, thus, law of one price may hold in the long-run, which implies that there is no lead-lag relationship between two markets during long-run. However, Stoll and Whaley (1990) observed that presence of market frictions such as, infrequent trading of the underlying asset, significant difference in transaction cost of asset traded in futures and cash markets, short sale restrictions, etc. may be potential factors, which causes short-run deviations between two prices. Kim et al., (1999) further mentioned that due to significantly lower transaction cost in futures market, traders prefer to take early positions in the futures market and hedge their risk exposure in the cash market.
In the presence of efficient cost-of-carry regime, bidirectional causality between futures and cash markets is expected because current futures price at any time will be sum of current spot price and expected risk premium to hold such asset if trader is long in the cash market or opportunity cost if trader has taken short position in the cash market. Table V reports Granger Causality results, which suggests that significant bidirectional relationship (except for Nifty) exists between Indian equity futures and cash markets, however, there is unidirectional Granger Causality between Nifty and Nifty futures, where Nifty futures significantly granger cause Nifty at 10% significance level. However, the magnitude of F coefficients indicate that the Indian equity futures market strongly cause cash market. These findings are consistent with the findings of Kawaller et al., (1987), Ng (1987), Stoll and Whaley (1990), Chan (1992), Martikainen et al., (1995), Arshanapalli and Doukas (1997), Jong and Donders (1998), Pizzi et al., (1998), Booth et al., (1999), Min and Najand (1999), Tse (1999), Frino et al., (2000), Thenmozhi (2002), Covrig et al., (2004), Kenourgios (2004), Pattarin and Ferretti (2004), So and Tse (2004) and Zong et al., (2004) but are inconsistent with the findings of Wahab and Lashgari (1993), Chan and lien (2001), Chen et al., (2002), Lin et al., (2002), Lien et al., (2003), Lin et al., (2003), Mukherjee and Mishra (2006), Thomas (2006) and Gupta (2008).
In addition, the results of VAR methodology in table VI provide some important inputs for regulatory bodies as well as practitioners. Consistent with the granger causality results, significant information spillover has been identified between Indian equity futures and cash markets. Moreover, VAR results suggest that the Indian equity futures market significantly lead the Indian cash market where, Nifty futures lead Nifty by five minutes. However, the length of lead-lag relationship between individual stock futures and cash market varies in the range of five to fifty minutes. Out of fifty individual stocks considered in the study, twenty seven individual stock futures lead cash market by five to forty minutes. Whereas, fifteen individual stocks lead individual stock futures by five to fifty five minutes and no lead-lag relationship exists between eight individual stocks and their respective futures contracts. These findings are consistent with the findings of international literature, however, inconsistent with Indian literature (see table I).

15
In addition, the findings of VECM are consistent with the results of Granger Causality and VAR11, which suggests that the Indian equity futures market dominates the price discovery process and the Indian cash market, operates as a satellite market for dissemination of an available information set. Moreover, VECM results suggest that both markets play equally important role in restoring market equilibrium as on the maturity date. Error correction terms in equations (4.1) and (4.2) suggest that in order to restore price equilibrium, there is upward movement in futures market and downward movement in cash market.
Once the present study has identified significant lead-lag relationship between Indian equity futures and cash markets, regulatory bodies and practitioners would be more interested to know whether, exploitable arbitrage opportunities are available? Since, Vipul (2005b) and Gupta (2008) have found that significant and exploitable arbitrage opportunities exist in the Indian capital market, therefore, the present study makes an attempt to examine the pattern and behavior of persistent risk free profit making opportunities.
The cost-of-carry model presumes that the magnitude of mispricings should be positively associated with the time to maturity of the contract because as soon as the contract approaches maturity date, the uncertainty regarding future cash flows reduces. Table VII reports the estimated results of equation (5), where the mispricings of Nifty are insignificantly associated with days to expiry (DTE), which implies that the amount of mispricings does not depend upon the period to maturity. These findings are contrary to Cornell and French (1983a and 1983b) but are consistent with Yadav and Pope (1990).
However, DTE significantly predicts mispricings of individual stock futures contracts. DTE is significantly negative for individual stock futures contracts (except for ABB, HCLTECH, ICICIBANK, JETAIRWAYS and MTNL), which implies that near to maturity date more arbitrage opportunities in the Indian equity futures market are available. These findings are inconsistent with the findings of Cornell and French (1983a and 1983b), Mackinlay and Ramaswamy (1988), Antoniou and Holmes (1995), Neal (1996), Stoll and Whaley (1997), Chow et al., (2003), Lien and Yang (2003), Vipul (2005a and 2005b) and Roll et al., (2007).
Negative association between days to expiry and the amount of mispricings may be because of the trading restrictions imposed by exchange authorities and SEBI on various market participants12. Therefore, these traders might be preferring either to
11 Since the results of VECM are similar to the results of VAR, therefore, the current study in order to save space does not report the results of VECM, however, these are available on demand. 12 For instance; in India, the trading member’s position limits in equity index futures contracts shall be higher of Rs. 500 crores or 15% of the total open interest level in equity index futures contracts. In addition, for individual stocks having applicable market-wise position limit (MWPL) of Rs. 500 crores or more, the combined futures and options position limit for trading members shall be 20% of applicable MWPL or Rs. 300 crores, whichever is lower and out of which the stock futures position(s) cannot exceed 10% of the applicable MWPL or Rs. 150 crores, whichever is lower. In case of the individual stocks having applicable MWPL less than Rs. 500 crores, the combined futures and options position limit would be 20% of applicable MWPL and futures position cannot exceed 20% of applicable MWPL or Rs. 50 crore whichever is lower. Furthermore, the client wise gross open position limits across all the derivative contracts on an underlying, should not exceed 1% of the free float market capitalization (in terms of

16
unwind or roll over their positions before the maturity date. These findings are consistent with the findings of Brennan and Schwartz (1990), Yadav and Pope (1990) and Neal (1996). Brennan and Schwartz (1990) suggested that an early unwinding of arbitrage positions has trading value because early liquidation of arbitrage positions not only make the money available to arbitrageurs but it also enables them to take new positions, which otherwise may not be possible if arbitrageurs are unwinding their positions on the maturity date.
Furthermore, results in table VII suggests that three trading sessions as on Friday observes maximum amount of mispricings as compared to that during other trading sessions over different trading days of the week. These findings are obvious because in India, futures contracts expire on the last Thursday of the month and last Friday of the month becomes the first trading day for any futures contract. Friday being first trading day of the month has to discount maximum risk component emerging out of the uncertainties regarding future cash flows, therefore, presence of information asymmetry is bound to offer maximum arbitrage opportunities. In addition, dummies for other and afternoon trading sessions of Wednesday have been found to be significantly negative, which further support the argument that days to maturity plays key role in efficient price discovery in the Indian equity futures market. Moreover, mispricings are found to be significantly autoregressive for higher order and the significant autoregressive coefficients are observed to be declining, which implies that Basis conforms to the asymptotic property of financial time series13.
In addition to reporting the seasonal behavior of mispricings in the Indian equity futures contracts, table VII provides another important information that except for NIFTY, mispricings for individual stock futures contracts persist over the contract cycle because when, equation (5) was estimated through Ordinary Least Square (OLS) procedure, the variance of error term was found to be time varying (except for Nifty), therefore, equation (5) has been estimated through GARCH (1,1) assuming ‘t’ distribution. Moreover, table VII reports presence of volatility clustering in the mispriced series because the sum of ARCH and GARCH terms is approximately equal to 1.
Section IV: Conclusion Present study examines the price discovery and arbitrage efficiency of Indian
equity futures and cash markets. Study finds strong and stable long-run comovement between two markets, which suggests that both markets observe long-run price equilibrium, hence, on maturity date price convergence does take place. However, during short-run, significant violations of equilibrium relationship have been observed, which implies that significant volatility spillover from one market to other takes place. Granger Causality results further suggest that Indian equity futures market dominates the information assimilation process in the Indian capital market. Therefore, in the present study, though feedback relationship has been identified, which implies that price
number of shares) or 5% of the open interest in all derivative contracts in the same underlying stock (in terms of number of shares), whichever is higher (For details, see F&O segment in www.nseindia.com). 13 In order to save space, in table VII, since the sign of autoregressive terms do not change, therefore, only the significant order of autoregression has been reported. However, detailed results are available on demand.

17
discovery takes place in both markets but Indian equity futures market has been found to be strongly causing the Indian cash market.
In addition, it has been found that both markets observe significant lead-lag relationship whose duration varies in the range of five to fifty five minutes. VECM results further suggest that both markets play equally important role in restoring market equilibrium on the maturity date. Moreover, mispricings have been found to be significantly sensitive to the days to maturity. However, contrary to the existing literature, present study finds that mispricings are negatively associated with days to expiry, which supports the argument that traders instead of unwinding their positions on the maturity date, either exercise early liquidation option or rollover their position to the next contract cycle.
Moreover, present study finds that Friday offers maximum number of arbitrage opportunities, which may draw its explanation from the fact that in India, futures contracts expire on the last Thursday of the month and Friday being the first day of the contract month has to discount maximum amount of uncertainties with regard to the future cash flows. However, Wednesday being the last trading day before settlement on last Thursday of the month observes minimum number of arbitrage opportunities.
In India, exploitable arbitrage opportunities may be persistent because of the lack of competitiveness in the Indian capital market. For instance; nonetheless, Securities and Exchange Board of India (SEBI) has permitted Futures and Options trading on two stock exchanges in India i.e. Bombay Stock Exchange of India (BSE) and National Stock Exchange of India (NSE) but virtually, NSE account for 99% trading activity in the Futures and Options segment in India. In addition, SEBI has restricted the total exposure of institutional traders in the market, which has allowed retail traders to dominate the market who base their decision on firm-specific or insider information, which is often little stale or late. Therefore, present study suggests that increase in market competitiveness may help to improve price discovery efficiency.
In addition, futures and options trading has been permitted for more than 250 individual equity stocks, however, less than 10% of these are sufficiently liquid. Therefore, stock exchange authorities are suggested to make the eligibility norms more stringent so that only quality (fundamentally strong) stocks qualify for trading in futures and options segment. This is expected to help to improve the hedging efficiency of the Indian equity futures market.
References:
Akin, R. M. (2003),“Maturity Effects in Futures Markets: Evidence from Eleven Financial Futures Markets”, Santa Cruz Centre for International Economics, Paper 03-06, Downloaded on 23rd Feb. 2006, from, http://repositories.cdlib.org /sccie/03-06.
Alexander, C. (1999),“Optimal Hedging Using Cointegration”, Mathematics of Finance, 357(1758), 2039-2058.
Antoniou, A. and Holmes, P. (1995),“Futures Trading, Information and Spot Price Volatility: Evidence for the FTSE-100 Stock Index Futures Contract Using GARCH”, Journal of Banking and Finance, 19(1), 117-129.

18
Antoniou, A., Holmes, P. and Priestley, R. (1998),“The Effect of Stock Index Futures Trading on Stock Index Volatility: An Analysis of the Asymmetric Response of Volatility to News”, The Journal of Futures Markets, 18(2), 151-166.
Arshanapalli, B. and Doukas, J. (1997),“The Linkages of S&P 500 Stock Index and S&P 500 Stock Index Futures Prices During October 1987”, Journal of Economics and Business, 49, 253-266.
Beaulieu, M. C., Ebrahim, S. K. and Morgan, I. G. (2003),“Does Tick Size Influence Price Discovery? Evidence from the Toronto Stock Exchange”, The Journal of Futures Markets, 23(1), 49-66.
Bessembinder, H. and Seguin, P. J. (1993),“Price Volatility, Trading Volume and Market Depth: Evidence from Futures Markets”, The Journal of Financial and Quantitative Analysis, 28(1), 21-39.
Bessembinder, H. and Seguin, P.J. (1992),“Futures-Trading Activity and Stock Price Volatility”, The Journal of Finance, XLVII(5), 2015-2034.
Bhatia, S. (2007),“Do the S&P CNX Nifty Index and Nifty Futures Really Lead/Lag? Error Correction Model: A Cointegration Approach”, NSE Research Paper, NSE India.
Booth, G. G., So, R. W. and Tse, Y. (1999),“Price Discovery in the German Equity Index Derivatives Markets”, The Journal of Futures Markets, 19(6), 619-643.
Bose, S. (2007),“Contribution of Indian Index Futures to Price Formation in the Stock Market”, Money and Finance, 3(1), 39-56.
Brailsford, T. J. and Cusack, A. J. (1997),“A Comparison of Futures Pricing Models in a New Market: The Case of Individual Share Futures”, The Journal of Futures Markets, 17(5), 515-541.
Brailsford, T. J. and Hodgson, A. (1997),“Mispricing in Stock Index Futures: A Re-Examination Using The SPI”, Australian Journal of Financial Management, 22(1), 21-45.
Brannen, P. P. and Ulveling, E. F. (1984),“Considering an Informational Role for a Futures Market”, The Review of Economic Studies, 51(1), 33-52.
Brennan, M. J. and Schwartz, E. S. (1990),“Arbitrage in Stock Index Futures”, Journal of Business, 63(1), 7-32.
Campbell, J. Y., Grossman, S. J. and Wang J. (1993),“Trading Volume and Serial Correlation in Stock Returns”, The Quarterly Journal of Economics, 108(4), 905-939.
Chan, K. (1992),“A Further Analysis of the Lead-Lag Relationship Between the Cash Market and Stock Index Futures Market”, The Review of Financial Studies, 5(1), 123-152.
Chan, L. and Lien, D. (2001),“Cash Settlement and Price Discovery in Futures Markets”, Quarterly Journal of Business and Economics, 40(3-4), 65-77.
Chan, S. J., Lin, C. C. and Hsu, H. (2004),“Do Different Futures Contracts in One Stock Exchange Have the Same Price Discovery Capability? Empirical Study of Taiwan Futures Exchange”, Journal of Financial Management and Analysis, 17(1), 34-44.
Chang, E., Chou, R. Y. and Nelling, E. F. (2000),“Market Volatility and the Demand for Hedging in Stock Index Futures”, The Journal of Futures Markets, 20(2), 105-125.
Chen, S. Y., Lin, C. C., Chou, P. H. and Hwang, D. Y. (2002),“A Comparison of Hedge Effectiveness and Price Discovery Between TAIFEX TAIEX Index Futures and SGX MSCI Taiwan Index Futures”, Review of Pacific Basin Financial Markets and Policies, 5(2), 277-300.
Choudhry, T., (2000),“Day-of-the-Week Effect in Emerging Asian Stock Market: Evidence from GARCH Model”, Applied Financial Economics, 10, 235-242.
Chow, Y-F., Yung, H. H. M. and Zhang, H. (2003),“Expiration Day Effects: The Case of Hong Kong”, The Journal of Futures Markets, 23(1), 67-86.
Cornell, B. and French, K. R. (1983a),“The Pricing of Stock Index Futures”, The Journal of Futures Markets, 3(1), 1-14.

19
Cornell, B. and French, K. R. (1983b),“Taxes and the Pricing of Stock Index Futures”, The Journal of Finance, 39(3), 657-694.
Cornell, B. and Reinganum, M. R. (1981),“Forward and Futures Prices: Evidence from the Foreign Exchange Markets”, The Journal of Finance, 36(5), 1035-1045.
Covrig, V., Ding, D. V. and Low, B. S. (2004),“The Contribution of a Satellite Market to Price Discovery: Evidence from the Singapore Exchange”, The Journal of Futures Market, 24(10), 981-1004.
Cox, J. C., Ingersoll, J. E. and Ross, S. A. (1981),“The Relation Between Forward Prices and Futures Prices”, Journal of Financial Economics, 9, 321-346.
Crowder, W. J. and Phengpis, C. (2005),“Stability of the S&P 500 Futures Market Efficiency Conditions”, Applied Financial Economics, Vol. 15, 855-866.
Diagler, R. T. (1990),“Intraday Stock Index Futures Arbitrage with Time Lag Effects,” Downloaded on 23rd Feb. 2006, From http://www.fiu.edu/~daiglerr/pdf / intraday_ SIF arbitrage.pdf.
Diamond, D. W. and Verrecchia, R. E. (1987),“Constraints on Short Selling and Asset Price Adjustment to Private Information”, Journal of Financial Economics, 18(2), 277-311.
Ederington, L. H. (1979),“The Hedging Performance of the New Futures Markets”, The Journal of Finance, 34(1), 157-170.
Fama, E. F. and French, K. R. (1987),“Commodity Futures Prices: Some Evidence on Forecast Power, Premiums and the Theory of Storage”, Journal of Business, 60(1), 55-73.
Figlewski, S. (1984),“Hedging Performance and Basis Risk in Stock Index Futures”, The Journal of Finance, 39(3), 657-669.
Fortenbery, R. T. and Zapata, H. O. (1997),“An Evaluation of Price Linkages Between Futures and Cash Markets for Cheddar Cheese”, The Journal of Futures Markets, 17(3), 279-301.
Frino, A., Walter, T. and West, A. (2000),“The Lead-Lag Relationship Between Equities and Stock Index Futures Markets Around Information Releases”, The Journal of Futures Markets, 20(5), 467-487.
Glassman, D. (1987),“The Efficiency of Foreign Exchange Futures Markets in Turbulent and Non-Turbulent Periods”, The Journal of Futures Markets, 7(3), 245-267.
Goodwin, B. K. (1992),“Multivariate Cointegration Tests and the Law of One Price: A Clarification and Correction”, Review of Agricultural Economics, 14(2), 337-338.
Gross, M. (1988),“A Semi-Strong Test of the Efficiency of the Aluminum and Copper Markets at the LME”, The Journal of Futures Markets, 8(1), 67-77.
Gujarati D. N. (2003),“Basic Econometrics”, 4th Edition, McGraw-Hill Inc.
Gulen, H. and Mayhew, S. (2000),“Stock Index Futures Trading and Volatility in International Equity Markets”, The Journal of Futures Markets, Vol. 20, No. 7, 661-685.
Gupta (2008),“Testing the Efficiency of Indian Equity Futures Market”, Unpublished Ph. D. Thesis, Department of Commerce and Business Management, Guru Nanak Dev University, Amritsar.
Gupta, K. and Singh, B. (2006a),“Price Discovery and Causality in Spot and Futures Markets in India”, The ICFAI Journal of Derivatives Markets, III(1), 30-41.
Gupta, K. and Singh, B. (2006b),“Random Walk and Indian Equity Futures Market”, The ICFAI Journal of Derivatives Market, III(3), 23-42.
Gupta, K. and Singh, B. (2007),“Investigating the Pricing Efficiency of Indian Equity Futures Market”, Management and Labour Studies, 32(4), 486-512.
Hasbrouck, J. (1995),“One Security, Many Markets: Determining the Contributions to Price Discovery”, The Journal of Finance, 50(4), 1175-1199.

20
Jiang, L., Fung, J. K. W. and Cheng, L. T. W. (2001),“The Lead-Lag Relation Between Spot and Futures Markets Under Different Short-Selling Regimes”, The Financial Review, 38, 63-88.
Johansen, S. and Juselius, K. (1990),“Maximum Likelihood Estimation and Inference on Cointegration-with Applications to the Demand for Money”, Oxford Bulletin of Economics and Statistics, 52, 169-210.
Johnson, R. L., Zulauf, C. R., Irwin, S. H. and Gerlow, M. E. (1991),“ The Soybean Complex Spread: An Examination of Market Efficiency From the Viewpoint of a Production Process”, The Journal of Futures Markets, 11, 25-37.
Jong, F. D. and Donders, M. W. M. (1998),“Intraday Lead-Lag Relationships Between the Futures, Options and Stock Market”, European Finance Review, 1, 337-359.
Kawaller, I. G., Koch, P. D. and Koch, T. W. (1987),“The Temporal Price Relationship Between S&P500 Futures and the S&P500 Index”, The Journal of Finance, 42(5), 1309-1329.
Kempf, A. (1998),“Short Selling, Unwinding and Mispricing”, The Journal of Futures Markets, 18(18), 903-923.
Kenourgios, D. F. (2004),“Price Discovery in the Athens Derivatives Exchange: Evidence for the FTSE/ASE-20 Futures Market”, Economic and Business Review, 6(3), 229-243.
Kim, M., Szakmary, A. C. and Schwarz, T. V. (1999),“Trading Costs and Price Discovery Across Stock Index Futures and Cash Markets”, The Journal of Futures Markets, 19(4), 475-498.
Klemkosky, R. C. and Lasser, D. J. (1985),“An Efficiency Analysis of the T-Bond Futures Market”, The Journal of Futures Markets, 5(4), 607-620.
Koopenhaver, G. D. (1983),“The Forward Pricing Efficiency of the Live Cattle Futures Market”, The Journal of Futures Markets, 3(3), 307-319.
Kumar, P. and Seppi, D. J. (1994),“Information and Index Arbitrage”, Journal of Business, 67(4), 481-509.
Kumar, S. (2004),“Price Discovery and Market Efficiency: Evidence from Agricultural Commodities Futures Markets”, South Asian Journal of Management, 11(2), 32-47.
Kyle, A. S. (1985),“Continuous Auctions and Insider Trading”, Econometrica, 53(6), 1315-1335.
Lai, K. S. and Lai, M. (1991),“A Cointegration Test for Market Efficiency”, The Journal of Futures Markets, 11(5), 567-575.
Lamourex, C. G. and Lastrapes, W. D., (1990),“Heteroskedasticity in Stock Return Data: Volume Versus GARCH Effects”, The Journal of Finance, 45(1), 221-229.
Lee, J. (2005),“Index Arbitrage With the KOSPI 200 Futures”, Downloaded on 10th March 2006, From http://www.fma.org/Chicago/Papers/jaehalee-FMA-2005.pdf.
Lien, D. (2003),“The Effect of Liquidity Constraints on Futures Hedging”, The Journal of Futures Markets, 23(6), 603-613.
Lien, D. and Yang, L. (2003),“Options Expiration Effects and the Role of Individual Share Futures Contracts”, The Journal of Futures Markets, 23(11), 1107-1118.
Lien, D., Tse, Y. K. and Zhang, X. (2003),“Structural Change and Lead-Lag Relationship Between the NIKKEI Spot Index and Futures Price: A Genetic Programming Approach”, Quantitative Finance, 3, 136-144.
Lin, C. C., Chen, S. Y. and Hwang, D. Y. (2003),“An Application of Threshold Cointegration to Taiwan Stock Index Futures and Spot Markets”, Review of Pacific Basin Financial Markets and Policies, 6(3), 291-304.
Lin, C. C., Chen, S. Y., Hwang, D. Y. and Lin, C. F. (2002),“Does Index Futures Dominates Index Spot? Evidence from Taiwan Market”, Review of Pacific Basin Financial Markets and Policies, 5(2), 255-275.

21
Lo, A. W. and MacKinlay, A. C. (1988),“Stock Market Prices do not Follow Random Walks: Evidence from a Simple Specification Test”, The Review of Financial Studies, 1(1), 41-66.
Mackinlay, A. C. and Ramaswamy, K. (1988),“Index-Futures Arbitrage and the Behavior of Stock Index Futures Prices”, The Review of Financial Studies, 1(2), 137-158.
Martikainen, T., Perttunen, J. and Puttonen, V. (1995),“On The Dynamics of Stock Index Futures and Individual Stock Returns”, Journal of Banking Finance and Accounting, 22(1), 87-100.
Merrick, Jr. J.J. (1988),“Hedging with Mispriced Futures”, The Journal of Financial and Quantitative Analysis, 23(4), 451-464.
Min, J. H. and Najand, M. (1999),“A Further Investigation of the Lead-Lag Relationship Between The Spot Market and Stock Index Futures: Early Evidence from Korea”, The Journal of Futures Markets, 19(2), 217-232.
Monoyios, M. and Sarno, L. (2002),“Mean Reversion in Stock Index Futures Markets: A Nonlinear Analysis”, The Journal of Futures Markets, 22(4), 285-314.
Mukherjee, K. N. and Mishra, R. K. (2006),“Lead-Lag Relationship Between Equities and Stock Index Futures Market and It’s Variation Around Information Release: Empirical Evidence from India”, NSE Research Paper, NSE India.
Neal, R. (1996),“Direct Tests of Index Arbitrage Models”, The Journal of Financial and Quantitative Analysis, 31(4), 541-562.
Neuberger, A. (1999),“Hedging Long-Term Exposures with Multiple Short-Term Futures Contracts”, The Review of Financial Studies, 12(3), 429-459.
Ng, N. (1987),“ Detecting Spot Price Forecasts in Futures Prices Using Causality Tests”, Review of Futures Markets, 6, 250-267.
Osterwald-Lenum, M. (1992),“A Note with Quantiles of the Asymptotic Distribution of the Maximum Likelihood Cointegration Rank Test Statistics”, Oxford Bulletin of Economics and Statistics, 54, 461–471.
Pattarin, F. and Ferretti, R. (2004),“The Mib30 Index and Futures Relationship: Econometric Analysis and Implications for Hedging”, Applied Financial Economics, 14, 1281-1289.
Pennings, J. M. E. and Meulenberg, M. T. G. (1997),“Hedging Efficiency: A Futures Exchange Management Approach”, The Journal of Futures Markets, 17(5), 599-615.
Pizzi, M. A., Economopoulos, A. J. and O’Neill H. M. (1998),“An Examination of the Relationship Between Stock Index Cash and Futures Markets: A Cointegration Approach”, The Journal of Futures Markets, 18(3), 297-305.
Protopapadakis, A. and Stoll, H. R. (1983),“Spot and Futures Prices and the Law of One Price”, The Journal of Finance, 38(5), 1431-1455.
Puttonen, V (1993),“Short Sales Restrictions and the Temporal Relationship between Stock Index, Cash and Derivatives Markets”, The Journal of Futures Markets, 13(6), 645-664.
Rachev, S. T., Mottnik, S., Fabozzi, F. J., Focardi, S. M. and Jasic, T. (2006),“Financial Econometrics: From Basics to Advanced Modeling Techniques”, John Wiley & Sons, Inc. Publication.
Raju, M. T. and Karande, K. (2003),“Price Discovery and Volatility on NSE Futures Market”, SEBI Working Paper No. 7.
Rendleman, J. R. and Carabini, E. C. (1979),“The Efficiency of the Treasury Bill Futures Market”, The Journal of Finance, 34(4), 895-914.
Roll, R., Schwartz, E. and Subrahmanyam, A. (2007),“Liquidity and the Law of One Price: The Case of the Futures-Cash Basis”, The Journal of Finance, 62(5), 2201-2234.

22
Sah, A. N. and Kumar, A. A. (2006),“Price Discovery in Cash and Futures Market: The Case of S&P Nifty and Nifty Futures”, The ICFAI Journal of Applied Finance, 12(4), 55-63.
Sahadevan, K. G. (2002),“Price Discovery, Return and Market Conditions: Evidence from Commodity Futures Markets”, The ICFAI Journal of Applied Finance, 8(5), 25-39.
So, R. W. and Tse, Y. (2004),“Price Discovery in the Hang Seng Index Markets: Index, Futures and the Tracker Fund”, The Journal of Futures Markets, 24(9), 887-907.
Stevenson, A. R. and Bear, M. R. (1970),“Commodity Futures: Trends or Random Walks?”, The Journal of Finance, 25(1), 65-81.
Stoll, H. and Whaley, R. (1997),“Expiration-Day Effects of the All Ordinaries Share Prices Index Futures: Empirical Evidence and Alternative Settlement Procedures”, Australian Journal of Management, 22(2), 139-174.
Stoll, H. R. and Whaley, R. E. (1990),“The Dynamics of Stock Index and Stock Index Futures Returns”, Journal of Financial and Quantitative Analysis, 25(4), 441-468.
Thenmozhi, M. (2002),“Futures Trading, Information and Spot Price Volatility of NSE-50 Index Futures Contract”, NSE Research Paper, NSE India.
Theobald, M. and Yallup, P. (1997),“Hedging Ratios and Cash/Futures Market Linkages”, The Journal of Futures Markets, 17, 1, 101-115.
Theobald, M. and Yallup, P. (2001),“Mean Reversion and Basis Dynamics”, The Journal of Futures Markets, 21(9), 797-818.
Thomas, S. (2006),“Interdependence and Dynamic Linkages Between S&P CNX Nifty Futures and Spot Market: with Specific Reference to Volatility, Expiration Effects and Price Discovery Mechanism”, Unpublished PhD Thesis, Department of Management Studies, IIT Madras.
Tse, Y. (1999),“Price Discovery and Volatility Spillovers in the DJIA Index and Futures Markets”, The Journal of Futures Markets, 19(8), 911-930.
Twite, G. J. (1992),“Effect of Stochastic Interest Rates on the Pricing of SPI Futures Contracts”, Australian Journal of Management, 17(2), 259-269.
Vipul (2005a),“Futures and Options Expiration-Day Effects: The Indian Evidence”, The Journal of Futures Markets, 25(11), 1045-1065.
Vipul (2005b),“Temporal Variation in Futures Mispricing”, Vikalpa, 30(4), 25-38.
Wahab, M. and Lashgari, M. (1993),“Price Dynamics and Error Correction in Stock Index and Stock Index Futures Markets: A Cointegration Approach”, The Journal of Futures Markets, 13(7), 711-742.
Yadav, P. K. and Pope, P. F. (1990),“Stock Index Futures Arbitrage: International Evidence”, The Journal of Futures Markets, 10(6), 573-603.
Yadav, P. K. and Pope, P. F. (1994),“Stock Index Futures Mispricing: Profit Opportunities or Risk Premium?”, Journal of Banking and Finance, 18(5), 921-953.
Zeng, T. (2001),“Mean Reversion and the Comovement of Equilibrium Spot and Futures Prices: Implications from Alternative Data-Generating Processes”, The Journal of Futures Markets, 21(8), 769-796.
Zong, M., Darrat, A. F. and Otero, R. (2004),“Price Discovery and Volatility Spillovers in Index Futures Markets: Some Evidence from Mexico”, Journal of Banking and Finance, 28(12), 3037-3054.

23
Table I Empirical Evidences on Cointegration, Causal and Lead-Lag Relationship Between Cash and Futures Markets
Author (Year of Study)
Market Understudy
Symbol of Stock(s)/Index(ices)
Understudy
Sample Period
Long-Run Relationship
Information Transmission
Leading Market
Kofi (1973) U.S.A. Wheat and Maine Potato Futures and Spot Markets
Jan. 1953-Dec. 1969 Yes N.E. Futures Market
Leads Cash Market
Cox (1976) U.S.A.
Onion, Maine Potatoes, Pork Bellies, Hogs, Cattle and Frozen Concentrated Orange Juice Futures and Spot Markets
Sept. 1942 to Oct. 1959, Dec. 1941 to July 1971, Sept. 1961 to Sept. 1971, Feb. 1966 to May 1970, Nov. 1964 to July 1971 and Oct. 1966 to Aug. 1971
Yes N.E. Futures Market Leads Cash Market
Protopapadakis and Stoll (1983) U.S.A.
Silver, Copper, Tin, Lead, Zinc, Coffee, Sugar, Soybean Meal, wheat, Rubber and Futures and Cash Markets
1972 to 1980 Yes Bidirectional N.E.
French (1986) U.S.A. 21 Commodity Futures and Spot Markets
Jan. 1965 to Dec. 1984 N.E. N.E. Futures Market
Leads Spot Market
Kawaller et al., (1987) U.S.A. S&P500 Futures and S&P500 Index
Jan. 1984- Dec. 1985 Yes N.E. Futures Market
Leads Cash Market
Ng (1987) U.S.A.
Value Line Futures and Value Line Index, S&P500 Futures and S&P500 Index, BP, DM, SF, CD and JY
Jan. 1981 to Dec. 1985, Apr. 1982 to Dec. 1986 and Jan. 1983 to Dec. 1986
N.E. Futures Market Causes Cash Market Not Vice Versa
Futures Market Leads Cash Market
Stoll and Whaley (1990) U.S.A.
S&P500 Futures and S&P500 Index MMI Futures and MMI Index
April 1982 to March 1987 and July 1984 to March 1987
Yes Bidirectional Futures Market Leads Cash Market
Lai and Lai (1991)
U.S.A, U.K., Germany, France, Canada and Japan
USD, BP, DM, SF, CD and JY
July 1973 to Dec. 1989 Yes N.E. N.E.
Chan (1992) U.S.A.
S&P500 Futures and S&P500 Index MMI Futures and MMI Index and 20 Stock Futures
Aug. 1984 to June 1985 and Jan. 1987 to Sept. 1987
N.E. Bidirectional Futures Market Leads Cash Market
Wahab and Lashgari (1993) U.K. and U.S.A. FTSE100- FTSE100 Futures and S&P500-S&P500 Futures
Jan. 1988 to May 1992 Yes Bidirectional Cash Market Leads
Futures Market
Martikainen et al., (1995) Finland
RCAS, RFUT and 22 Individual Stock and Futures Contracts on Same Stocks
Jan. 1989 to Dec. 1990 Yes Bidirectional Futures Market
Leads Cash Market
Tse (1995) Japanese NSA Futures and NSA Index
Dec. 1988 to Apr. 1993 Yes N.E. Futures Market
Leads Cash Market
Arshanapalli and Doukas (1997) U.S.A. S&P500 Futures and
S&P500 Index Oct. 1987 only Yes Bidirectional Futures Market Leads Cash Market
Fortenbery and Zapata (1997) U.S.A NCE June 1993 to July
1995 No N.E. None
Contd….

24
Author (Year of Study)
Market Understudy
Symbol of Stock(s)/Index(ices)
Understudy
Sample Period
Long-Run Relationship
Information Transmission
Leading Market
Abhyankar (1998) U.K. FTSE100- FTSE100 Futures Jan. 1992 to Dec. 1992 Yes Bidirectional
Futures Market Leads Cash Market but after incorporating the nonlinear components in the model no lead lag was observed
Chatrath and Song (1998) U.S.A. JY Futures and JY Jan. 1992 to Dec. 1995 N.E. Bidirectional Futures Market
Leads Cash Market
Chow (1998) U.S.A. Gold, Silver, Palladium and Platinum Futures and Spot Markets
Jan. 1975 to Sept. 1997, Jan. 1970 to Sept. 1997, Mar. 1977 to Sept. 1997 and Jan. 1970 to July 1997
Traditional Methodology may not find cointegration but the model applied in paper observes cointegration
N.E. N.E.
Jong and Donders (1998) Europe AEX Index Futures, AEX Index Options and AEX Index
Jan. to July 1992 and Jan. to June 1993
N.E.
Futures to Options and Cash. Bidirectional for Options and Cash
Futures Leads Options and Cash. No lead lag between options and cash
Lien and Tse(1998) Singapore Nikkei Futures Jan. 1989 to Aug. 1996 Yes Futures causes cash
market Futures Market Leads Cash Market
Pizzi et al., (1998) U.S.A. S&P500 and S&P500 Futures
Jan. 1987 to Mar. 1987 Yes Bidirectional Futures Market
Leads Cash Market
Booth et al., (1999) Germany FDAX, ODAX and DAX Jan. 1992 to Dec. 1994 Yes
Futures to Options and Cash. Bidirectional for Options and Cash
Futures Leads Options and Cash. No lead lag between options and cash
Kavussanos and Nomikos (1999) U.K. BIFFEX and BPI July 1988 to April
1997 Yes
Bidirectional but Stronger from Futures to Cash Market than vice versa
Futures Market Leads Cash Market
Min and Najand (1999) Korea KOSPI200 Futures and KOSPI200 Index
May 1996 to Oct. 1996 Yes Bidirectional Futures Market
Leads Cash Market
Tse (1999) U.S.A. DJIA Futures and DJIA Index
Nov. 1997 to April 1998 Yes Bidirectional Futures Market
Leads Cash Market
Frino et al., (2000) Australia AOI and SPI Aug. 1995 to Dec. 1996 Yes Bidirectional Futures Market
Leads Cash Market
Chan and Lien (2001) U.S.A. Feeder Cattle and Live/Lean Hog Futures and Spot Markets
Sept. 1977 to Dec. 1998 Yes Bidirectional Cash Market Leads
Futures Market
Theobald and Yallup (2001) U.K. FTSE100 Futures and FTSE100 Index
Jan. 1999 to Dec. 1999 Yes Bidirectional Futures Market
Leads Cash Market
Chen et al., (2002) Taiwan TAIFEXTAIEX- TAIEX and SGXMSCIb-MSCIb
July 1998 to July 2000 Yes Bidirectional
SGXMSCIb leads both TAIFEXTAIEX- TAIEX
Monoyios and Sarno (2002) U.S.A. and U.K. S&P 500 and FTSE 100 Futures
Jan. 1988 to Dec. 1998 Yes Bidirectional Futures Market
Leads Cash Market
Sahadevan (2002) India
Pepper, Cotton, Castro seed, Castor Oil, Mustard Seed and Gur Futures and Spot Markets
Jan 1999 to Aug. 2001 No No None
Tan (2002) Malaysia MSCIa and KLFI Jan. 1996 to Sept. 2000 Yes Bidirectional Futures Market
Leads Cash Market
Contd….

25
Author (Year of Study)
Market Understudy
Symbol of Stock(s)/Index(ices)
Understudy
Sample Period
Long-Run Relationship
Information Transmission
Leading Market
Thenmozhi (2002) India Nifty Futures and Nifty Index
June 2000 to July 2002 N.E. Futures to Cash
Market Futures Market Leads Cash Market
Babu and Bhole (2003) India Nifty Futures and Nifty Index
June 2000 to Sept 2003 Yes Bidirectional Futures Market
Leads Cash Market
Beaulieu et al., (2003) Canada TSE35 Index Futures and TSE35 Index
Aug. 1991 to Oct. 1991 Yes N.E. Futures Market
Leads Cash Market
Kavussanos and Nomikos (2003) U.K. BIFFEX and BPI Aug. 1988 to
April 1998 Yes
Bidirectional but Stronger from Futures to Cash Market than vice versa
Futures Market Leads Cash Market
Lien et al., (2003) Singapore Nikkei 225 Futures and Cash Markets
Sept. 1995 to Dec. 1999 Yes Bidirectional Cash Market Leads
Futures Market
Lin et al., (2003) Taiwan TAIFEXTAIEX and TAIEX Jan. 1999 to Mar. 2000 No Bidirectional Cash Market Leads
Futures Market
Raju and Karande (2003) India Nifty Futures and Nifty Index
June 2000 to Oct. 2002 Yes N.E. No Significant Lead-
Lag Relationship
Soydemir and Petrie (2003) U.S.A. DJIA Futures and DJIA Index
March 1999 to Aug. 1999 Yes Bidirectional Futures Market
Leads Cash Market
Chan et al., (2004) Taiwan TAIFEX, Mini-TAIEX, TE and TBI
Oct. 2001 to Mar. 2002 Yes Bidirectional Futures Market
Leads Cash Market
Covrig et al., (2004) Japan and Singapore
Nikkei 225 Futures and Nikkei 225 Index
Mar. 2000 to June 2000 Yes Bidirectional Futures Market
Leads Cash Market
Kavussanos et al., (2004) U.K. BIFFEX and BPI Jan. 1996 to Dec. 2000 Yes
Bidirectional but Stronger from Futures to Cash Market than vice versa
Futures Market Leads Cash Market
Kenourgios (2004) Athens FTSE/ASE-20 Futures and FTSE/ASE-20 Index
Aug. 1999 to June 2002 Yes Bidirectional Futures Market
Leads Cash Market
Pattarin and Ferretti (2004) Italy Mib30 and Fib30 Nov. 1994 to Sept. 2002 Yes Bidirectional Futures Market
Leads Cash Market
Ryoo and Smith (2004) Korea KOSPI200 Sept. 1993 to Dec. 1998 Yes Bidirectional Futures Market
Leads Cash Market
So and Tse (2004) Hong Kong HIS, HSIF and TF Nov. 1999 to June 2002 Yes N.E. Futures Market
Leads Cash Market
Zong et al., (2004) Mexico IPC Index Futures and IPC Index
April 1999 to July 2002 Yes Bidirectional Futures Market
Leads Cash Market
Hasan (2005) U.K. and U.S.A. FTSE100- FTSE100 Futures and S&P500-S&P500 Futures
Jan. 1985-Dec. 1993 and Jan. 1983- Dec. 1993
Yes Bidirectional None
Gupta and Singh (2006a) India Nifty Futures and Nifty Cash
June 2000 to Feb. 2005 Yes Bidirectional No Lead Lag
Relationship
Gupta and Singh (2006c) India Nifty Futures and Nifty Index
June 2000 to Dec. 2005 Yes Bidirectional
No Lead Lag during full Sample period but futures market significantly leads cash market during High Volatility Period.
Contd….

26
Author (Year of Study)
Market Understudy
Symbol of Stock(s)/Index(ices)
Understudy
Sample Period
Long-Run Relationship
Information Transmission
Leading Market
Gupta and Singh (2006d) India Nifty and 24 Stock Futures June 2000 to July 2005 Yes Bidirectional
No Lead Lag for Nifty futures but significant lead lag relationship exists in case of stock futures.
In and Kim (2006) U.S.A. S&P500 Futures and S&P500 Index
April 1982 to Dec. 2001 Yes Bidirectional None
Mukherjee and Mishra (2006) India NIFTY and 5 Stock Futures April to Sept.
2004 Yes Bidirectional Cash Market Leads Futures Market
Sah and Kumar (2006) India Nifty Futures and Nifty Index
June 2000 to March 2005 Yes Bidirectional Cash Market Leads
Futures Market
Thomas (2006) India Nifty Futures and Nifty Index
June 2000 to April 2005 Yes Bidirectional Cash Market Leads
Futures Market
Bhatia (2007) India Nifty Futures and Nifty Index
April 2005 to March 2006 Yes Bidirectional Futures Market
Leads Cash Market
Bose (2007) India Nifty Futures and Nifty Index
March 2002 to Sept. 2006 Yes Nifty Futures
Causes Nifty Futures Market Leads Cash Market
Floros and Vougas (2007) Greece FTSE/ASE20 and FTSE/ASE Mid40 at ADEX
Aug. 1999-Aug. 2001 and Jan 2000 to Aug. 2001
Yes N.E. Futures Market Leads Cash Market
Gupta (2008) India Nifty Futures and 84 Individual Stocks
Jan. 2003 to Dec. 2006 Yes Bidirectional Cash Market Leads
Futures Market Where: ADEX= Athens Derivatives Exchange, AOI= All Ordinary Share Price Index, AOIF= All Ordinary Share Price Index Futures, BIFFEX= Baltic International Freight Futures Exchange, BP=British Pound, BPI= Baltic Panamax Index, CD= Canadian Dollar, DAX= Deutscher Aktienindex Index, DJIA= Dow Jones Industrial Average Index, DM=Deutsche Mark, FDAX= Deutscher Aktienindex Index Futures, HIS= Hang Seng Index, HSIF= Hang Seng Index Futures, IPC= Mexican Price and Quotations Index, JY=Japanese Yen, KLCI= Kuala Lumpur Composite Index, KLFI= Kuala Lumpur Futures Index, MMI= Major Market Index, MSCIa= Malaysian Stock Composite Index, MSCIb= Morgan Stanley Capital International Inc. Taiwan Index, NCE = National Cheese Exchange in Green Bay, N.E. = Not Examined, NSA= Nikkei Stock Average Index, ODAX= Deutscher Aktienindex Index Options, SF=Swiss Franc, SGXMSCI= Morgan Stanley Capital International Inc. Taiwan Index Futures, SPI= Share Price Index Futures, TAIEX= Taiwan Stock Exchange Capitalization Weighted Stock Index, TAIFEX= Taiwan Stock Exchange Capitalization Weighted Stock Index Futures, TBI= TSE Banking and Insurance Sector Index Futures, TE= TSE Electronic Sector Index Futures, TF= Tracker Fund, Wisconsin, U.K.= United Kingdom, U.S.A.= Unites States of America, USD= U.S. Dollar. Source: Compiled from various studies

27
Table II Empirical Evidences on Pricing Efficiency of Futures Markets Author
(Year of Study) Country
Understudy Market
Understudy Period
Understudy Mispricings
Cornell and Reinganum (1981) U.S.A IMM 1974-1979 No
Cornell and French (1983a) U.S.A NYSE and S&P500
June 1982- Sept. 1982 Yes
Figlewski (1984) U.S.A S&P500 1982-1983 No Cornell (1985) U.S.A S&P500 1982-1983 No Klemkosky amd Lasser (1985) U.S.A T-Bond Futures 1978-1981 Yes Arditti et al., (1986) U.S.A S&P500 1982-1984 Yes
Merrick Jr. (1987) U.S.A NYSE and S&P500 1982-1986 Yes
Mackinlay and Ramaswamy (1988) U.S.A S&P500 1982-1987 Yes Bhatt and Cakici (1990) U.S.A S&P500 1982-1987 Yes Diagler (1990) U.S.A S&P500 and MMI 1987-1988 No
Stulz et al., (1990) Switzerland OTC Market Jan. 1989- Oct. 1989 No
Yadav and Pope (1990) U.K. FTSE-100 1984-1988 Yes Yau et al., (1990) Hong Kong HSI 1986-1988 Yes Chung (1991) U.S.A MMI 1984-1986 Yes Klemkosky and Lee (1991) U.S.A S&P500 1983-1987 Yes Puttonen and Martikainen (1991) Finnish FOX 1988-1990 Yes Twite (1991) Australia AOI 1983-1988 Yes Lim (1992) Japan Nikkei and Simex 1988-1989 No Twite (1992) Australia SPI 1983-1988 Yes Yadav and Pope (1992) U.K. FTSE100 1986-1990 Yes Neal (1996) America S&P500 1989 Yes Brailsford and Hodgson (1997) Australia AOI and SPI 1989-1993 Yes Brailsford and Cusack (1997) Australia SPI 1994-1995 Yes Bae et al., (1998) Hong Kong HIS 1993-1994 No
Akin (2003) America 11 commodity
contracts traded on CME
1982-2000 Yes
Lee (2005b) Korea KOSPI 1996-2001 Yes
Vipul (2005b) India
NIFTY, ACC, INFOSYS, RIL,
SATYAM, TELCO, TISCO
2002-2004 Yes
Gupta and Singh (2007) India Nifty July 2000 to Dec. 2005 Yes
Roll et al., (2007) America S&P500 1988-2002 Yes
Gupta (2008) India Nifty and 84 Individual Stocks
Jan. 2003 to Dec. 2006 Yes
Source: Compiled from various studies.
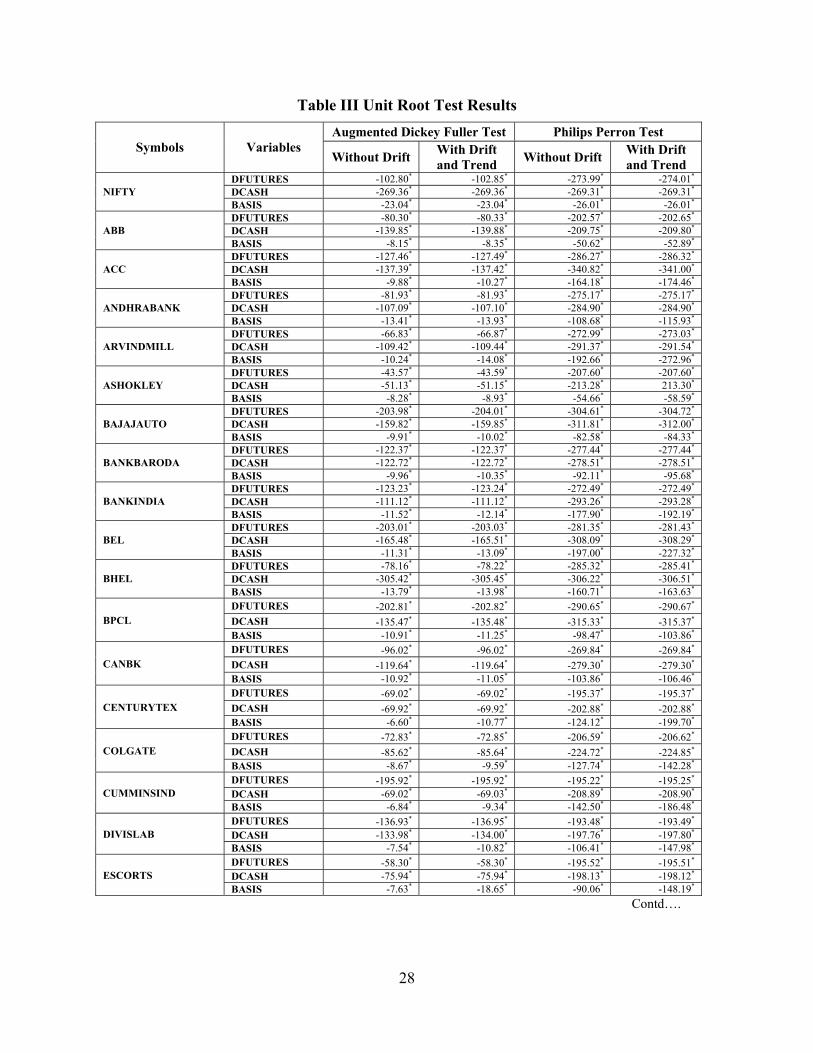
28
Table III Unit Root Test Results Augmented Dickey Fuller Test Philips Perron Test
Symbols Variables Without Drift With Drift
and Trend Without Drift With Drift and Trend
DFUTURES -102.80* -102.85* -273.99* -274.01* DCASH -269.36* -269.36* -269.31* -269.31* NIFTY BASIS -23.04* -23.04* -26.01* -26.01* DFUTURES -80.30* -80.33* -202.57* -202.65* DCASH -139.85* -139.88* -209.75* -209.80* ABB BASIS -8.15* -8.35* -50.62* -52.89* DFUTURES -127.46* -127.49* -286.27* -286.32* DCASH -137.39* -137.42* -340.82* -341.00* ACC BASIS -9.88* -10.27* -164.18* -174.46* DFUTURES -81.93* -81.93* -275.17* -275.17* DCASH -107.09* -107.10* -284.90* -284.90* ANDHRABANK BASIS -13.41* -13.93* -108.68* -115.93* DFUTURES -66.83* -66.87* -272.99* -273.03* DCASH -109.42* -109.44* -291.37* -291.54* ARVINDMILL BASIS -10.24* -14.08* -192.66* -272.96* DFUTURES -43.57* -43.59* -207.60* -207.60* DCASH -51.13* -51.15* -213.28* 213.30* ASHOKLEY BASIS -8.28* -8.93* -54.66* -58.59* DFUTURES -203.98* -204.01* -304.61* -304.72* DCASH -159.82* -159.85* -311.81* -312.00* BAJAJAUTO BASIS -9.91* -10.02* -82.58* -84.33* DFUTURES -122.37* -122.37* -277.44* -277.44* DCASH -122.72* -122.72* -278.51* -278.51* BANKBARODA BASIS -9.96* -10.35* -92.11* -95.68* DFUTURES -123.23* -123.24* -272.49* -272.49* DCASH -111.12* -111.12* -293.26* -293.28* BANKINDIA BASIS -11.52* -12.14* -177.90* -192.19* DFUTURES -203.01* -203.03* -281.35* -281.43* DCASH -165.48* -165.51* -308.09* -308.29* BEL BASIS -11.31* -13.09* -197.00* -227.32* DFUTURES -78.16* -78.22* -285.32* -285.41* DCASH -305.42* -305.45* -306.22* -306.51* BHEL BASIS -13.79* -13.98* -160.71* -163.63* DFUTURES -202.81* -202.82* -290.65* -290.67* DCASH -135.47* -135.48* -315.33* -315.37* BPCL BASIS -10.91* -11.25* -98.47* -103.86* DFUTURES -96.02* -96.02* -269.84* -269.84* DCASH -119.64* -119.64* -279.30* -279.30* CANBK BASIS -10.92* -11.05* -103.86* -106.46* DFUTURES -69.02* -69.02* -195.37* -195.37* DCASH -69.92* -69.92* -202.88* -202.88* CENTURYTEX BASIS -6.60* -10.77* -124.12* -199.70* DFUTURES -72.83* -72.85* -206.59* -206.62* DCASH -85.62* -85.64* -224.72* -224.85* COLGATE BASIS -8.67* -9.59* -127.74* -142.28* DFUTURES -195.92* -195.92* -195.22* -195.25* DCASH -69.02* -69.03* -208.89* -208.90* CUMMINSIND BASIS -6.84* -9.34* -142.50* -186.48* DFUTURES -136.93* -136.95* -193.48* -193.49* DCASH -133.98* -134.00* -197.76* -197.80* DIVISLAB BASIS -7.54* -10.82* -106.41* -147.98* DFUTURES -58.30* -58.30* -195.52* -195.51* DCASH -75.94* -75.94* -198.13* -198.12* ESCORTS BASIS -7.63* -18.65* -90.06* -148.19*
Contd….

29
Augmented Dickey Fuller Test Philips Perron Test Symbols Variables
Without Drift With Drift and Trend Without Drift With Drift
and Trend DFUTURES -199.30* -199.30* -198.59* -198.59* DCASH -79.10* -79.10* -201.51* -201.51* ESSAROIL BASIS -7.61* -12.95* -172.57* -253.40* DFUTURES -40.38* -40.39* -260.41* -260.41* DCASH -39.97* -39.98* -277.18* -277.18* GAIL BASIS -9.14* -10.62* -42.83* -55.33* DFUTURES -104.43* -104.44* -201.03* -201.04* DCASH -89.87* -89.88* -208.75* -208.76* GNFC BASIS -8.05* -8.74* -52.47* -60.92* DFUTURES -129.06* -129.10* -282.12* -282.19* DCASH -202.49* -202.53* -306.74* -306.88* GRASIM BASIS -12.31* -12.66* -153.67* -160.35* DFUTURES -92.98* -92.99* -286.46* -286.52* DCASH -280.40* -280.41* -280.62* -280.65* HCLTECH BASIS -13.93* -15.27* -142.15* -157.07* DFUTURES -134.61* -204.46* -301.67* -301.64* DCASH -216.93* -216.95* -325.15* -325.12* HEROHONDA BASIS -9.26* -9.63* -54.29* -58.23* DFUTURES -204.32* -204.32* -295.08* -295.08* DCASH -216.59* -216.59* -320.14* -320.14* HINDUNILVR BASIS -8.82* -8.83* -56.42* -57.15* DFUTURES -155.98* -155.90* -291.08* -291.08* DCASH -206.89* -206.89* -307.12* -307.22* HINDPETRO BASIS -9.42* -9.46* -93.84* -94.62* DFUTURES -200.91* -200.93* -294.56* -294.62* DCASH -210.61* -210.63* -321.76* -321.93* ICICIBANK BASIS -11.37* -12.33* -65.69* -75.82* DFUTURES -70.85* -70.85* -204.59* -204.59* DCASH -105.84* -105.84* -208.12* -208.11* IDBI BASIS -8.01* -9.76* -104.70* -138.72* DFUTURES -179.86* -179.85* -179.43* -179.42* DCASH -128.08* -128.07* -190.44* -190.43* IDFC BASIS -6.93* -7.17* -61.69* -65.29* DFUTURES -94.33* -94.35* -284.65* -284.65* DCASH -85.97* -85.99* -297.36* -297.36* IPCL BASIS -8.02* -8.39* -74.92* -81.33* DFUTURES -211.63* -211.63* -210.52* -210.52* DCASH -95.65* -95.66* -229.02* -229.04* JETAIRWAYS BASIS -13.01* -13.21* -74.78* -76.20* DFUTURES -109.69* -109.70* -198.34* -198.34* DCASH -198.51* -198.52* -198.53* -198.63* KTKBANK BASIS -5.18* -5.35* -54.14* -57.77* FUTURES -110.82* -110.85* -286.72* -286.77* CASH -114.30* -114.33* -319.90* -319.89* MARUTI BASIS -14.48* -15.07* -209.06* -219.31* FUTURES -70.77* -70.78* -199.58* -199.59* CASH -107.28* -107.29* -206.55* -206.56* MATRIXLABS BASIS -5.40* -5.57* -11.02* -11.99* FUTURES -131.22* -131.22* -285.53* -285.53* CASH -204.45* -204.45* -308.24* -308.24* MTNL BASIS -10.86* -11.42* -124.10* -134.18*
Contd….

30
Augmented Dickey Fuller Test Philips Perron Test Symbols Variables
Without Drift With Drift and Trend Without Drift With Drift
and Trend DFUTURES -205.53* -205.54* -306.69* -306.72* DCASH -206.62* -206.63* -307.17* -307.22* NATIONALUM BASIS -8.61* -10.53* -49.59* -70.31* DFUTURES -203.60* -203.60* -202.81* -202.81* DCASH -193.00* -193.00* -192.44* -192.43* NDTV BASIS -6.82* -12.08* -137.48* -227.59* DFUTURES -44.16* -44.19* -244.39* -244.52* DCASH -68.93* -68.94* -257.40* -257.42* NTPC BASIS -11.40* -15.15* -148.66* -170.99* DFUTURES -121.59* -121.59* -272.67* -272.67* DCASH -106.37* -106.37* -278.07* -278.08* ORIENTBANK BASIS -10.54* -10.74* -100.50* -103.73* DFUTURES -82.03* -82.04* -274.18* -274.20* DCASH -123.21* -123.22* -282.55* -282.56* PNB BASIS -7.80* -8.02* -44.83* -46.79* DFUTURES -103.67* -103.67* -296.75* -296.75* DCASH -128.41* -128.41* -299.03* -299.03* POLARIS BASIS -8.45* -11.71* -168.80* -262.88* DFUTURES -102.26* -102.28* -195.20* -195.21* DCASH -90.20* -90.23* -213.62* -213.70* RELCAPITAL BASIS -6.99* -11.84* -132.90* -227.49* DFUTURES -126.47* -126.49* -278.50* -278.55* DCASH -124.29* -124.32* -362.86* -363.05* RELIANCE BASIS -9.47* -11.24* -205.79* -251.34* DFUTURES -128.83* -128.85* -295.09* -295.14* DCASH -108.01* -108.03* -342.49* -342.65* SBIN BASIS -10.38* -12.09* -172.74* -216.62* DFUTURES -65.18* -65.23* -195.72* -195.73* DCASH -68.57* -68.62* -195.23* -195.24* SRF BASIS -6.83* -8.07* -89.41* -116.14* DFUTURES -120.78* -120.79* -280.66* -280.68* DCASH -89.60* -89.62* -288.46* -288.47* SYNDIBANK BASIS -10.20* -10.49* -114.61* -117.27* DFUTURES -206.16* -206.16* -207.02* -207.10* DCASH -140.92* -140.93* -212.14* -212.24* TATACHEM BASIS -5.84* -5.89* -11.62* -11.93* DFUTURES -111.64* -111.64* -253.47* -253.46* DCASH -118.00* -118.00* -285.31* -285.31* TATAMOTORS BASIS -9.36* -9.36* -108.96* -109.06* DFUTURES -129.91* -129.93* -295.20* -295.25* DCASH -104.80* -104.83* -309.41* -309.48* TATAPOWER BASIS -13.39* -14.63* -72.16* -81.73* DFUTURES -127.76* -127.79* -190.30* -190.32* DCASH -70.28* -70.32* -207.56* -207.61* TITAN BASIS -8.45* -11.60* -103.39* -144.15* DFUTURES -123.18* -123.19* -273.23* -273.24* DCASH -125.57* -125.58* -294.36* -294.39* UNIONBANK BASIS -11.78* -13.10* -148.13* -156.90*
* Significant at 1% level of significance, ** Significant at 5% level of significance and *** Significant at 10% level of significance.
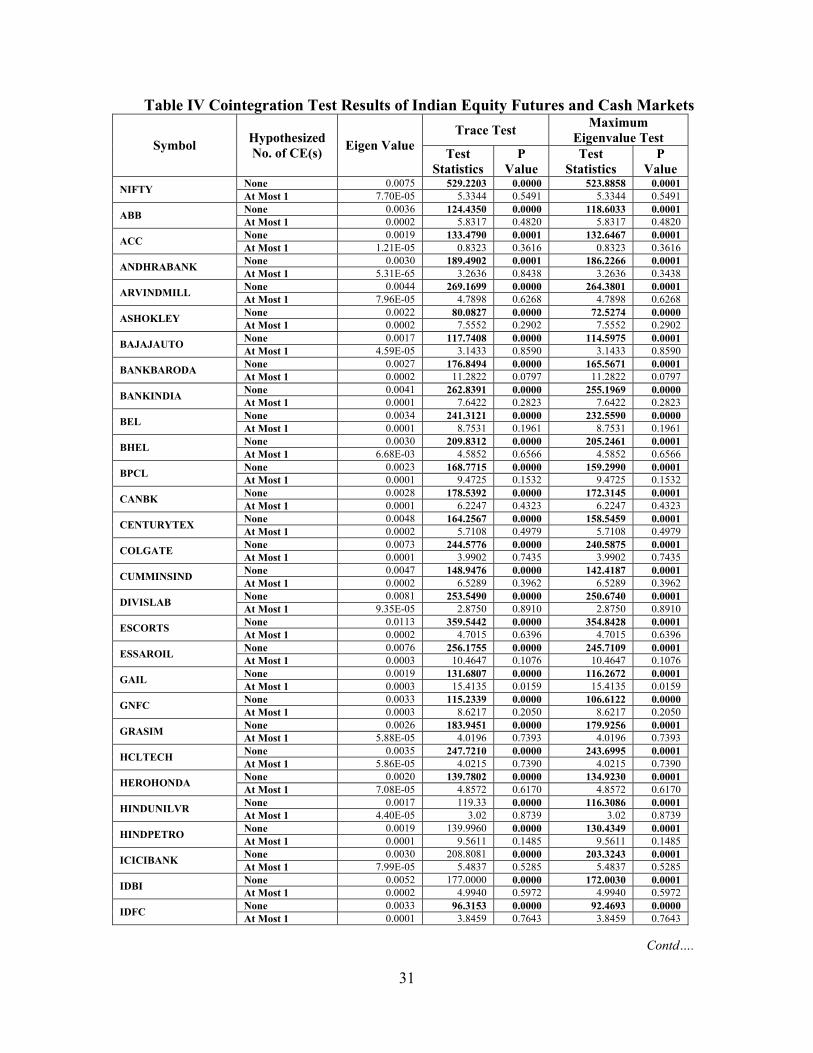
31
Table IV Cointegration Test Results of Indian Equity Futures and Cash Markets Trace Test Maximum
Eigenvalue Test Symbol Hypothesized No. of CE(s) Eigen Value Test
Statistics P
Value Test
Statistics P
Value None 0.0075 529.2203 0.0000 523.8858 0.0001 NIFTY At Most 1 7.70E-05 5.3344 0.5491 5.3344 0.5491 None 0.0036 124.4350 0.0000 118.6033 0.0001 ABB At Most 1 0.0002 5.8317 0.4820 5.8317 0.4820 None 0.0019 133.4790 0.0001 132.6467 0.0001 ACC At Most 1 1.21E-05 0.8323 0.3616 0.8323 0.3616 None 0.0030 189.4902 0.0001 186.2266 0.0001 ANDHRABANK At Most 1 5.31E-65 3.2636 0.8438 3.2636 0.3438 None 0.0044 269.1699 0.0000 264.3801 0.0001 ARVINDMILL At Most 1 7.96E-05 4.7898 0.6268 4.7898 0.6268 None 0.0022 80.0827 0.0000 72.5274 0.0000 ASHOKLEY At Most 1 0.0002 7.5552 0.2902 7.5552 0.2902 None 0.0017 117.7408 0.0000 114.5975 0.0001 BAJAJAUTO At Most 1 4.59E-05 3.1433 0.8590 3.1433 0.8590 None 0.0027 176.8494 0.0000 165.5671 0.0001 BANKBARODA At Most 1 0.0002 11.2822 0.0797 11.2822 0.0797 None 0.0041 262.8391 0.0000 255.1969 0.0000 BANKINDIA At Most 1 0.0001 7.6422 0.2823 7.6422 0.2823 None 0.0034 241.3121 0.0000 232.5590 0.0000 BEL At Most 1 0.0001 8.7531 0.1961 8.7531 0.1961 None 0.0030 209.8312 0.0000 205.2461 0.0001 BHEL At Most 1 6.68E-03 4.5852 0.6566 4.5852 0.6566 None 0.0023 168.7715 0.0000 159.2990 0.0001 BPCL At Most 1 0.0001 9.4725 0.1532 9.4725 0.1532 None 0.0028 178.5392 0.0000 172.3145 0.0001 CANBK At Most 1 0.0001 6.2247 0.4323 6.2247 0.4323 None 0.0048 164.2567 0.0000 158.5459 0.0001 CENTURYTEX At Most 1 0.0002 5.7108 0.4979 5.7108 0.4979 None 0.0073 244.5776 0.0000 240.5875 0.0001 COLGATE At Most 1 0.0001 3.9902 0.7435 3.9902 0.7435 None 0.0047 148.9476 0.0000 142.4187 0.0001 CUMMINSIND At Most 1 0.0002 6.5289 0.3962 6.5289 0.3962 None 0.0081 253.5490 0.0000 250.6740 0.0001 DIVISLAB At Most 1 9.35E-05 2.8750 0.8910 2.8750 0.8910 None 0.0113 359.5442 0.0000 354.8428 0.0001 ESCORTS At Most 1 0.0002 4.7015 0.6396 4.7015 0.6396 None 0.0076 256.1755 0.0000 245.7109 0.0001 ESSAROIL At Most 1 0.0003 10.4647 0.1076 10.4647 0.1076 None 0.0019 131.6807 0.0000 116.2672 0.0001 GAIL At Most 1 0.0003 15.4135 0.0159 15.4135 0.0159 None 0.0033 115.2339 0.0000 106.6122 0.0000 GNFC At Most 1 0.0003 8.6217 0.2050 8.6217 0.2050 None 0.0026 183.9451 0.0000 179.9256 0.0001 GRASIM At Most 1 5.88E-05 4.0196 0.7393 4.0196 0.7393 None 0.0035 247.7210 0.0000 243.6995 0.0001 HCLTECH At Most 1 5.86E-05 4.0215 0.7390 4.0215 0.7390 None 0.0020 139.7802 0.0000 134.9230 0.0001 HEROHONDA At Most 1 7.08E-05 4.8572 0.6170 4.8572 0.6170 None 0.0017 119.33 0.0000 116.3086 0.0001 HINDUNILVR At Most 1 4.40E-05 3.02 0.8739 3.02 0.8739 None 0.0019 139.9960 0.0000 130.4349 0.0001 HINDPETRO At Most 1 0.0001 9.5611 0.1485 9.5611 0.1485 None 0.0030 208.8081 0.0000 203.3243 0.0001 ICICIBANK At Most 1 7.99E-05 5.4837 0.5285 5.4837 0.5285 None 0.0052 177.0000 0.0000 172.0030 0.0001 IDBI At Most 1 0.0002 4.9940 0.5972 4.9940 0.5972 None 0.0033 96.3153 0.0000 92.4693 0.0000 IDFC At Most 1 0.0001 3.8459 0.7643 3.8459 0.7643
Contd….

32
Trace Test Maximum Eigenvalue Test Symbol Hypothesized
No. of CE(s) Eigen Value Test Statistics
P Value
Test Statistics
P Value
None 0.0016 119.6607 0.0000 108.7306 0.0001 IPCL At Most 1 0.0002 10.9301 0.0908 10.9301 0.0908 None 0.0041 148.2486 0.0000 143.2198 0.0001 JETAIRWAYS At Most 1 0.0001 5.0288 0.5923 5.0288 0.5923 None 0.0025 79.1621 0.0000 77.0498 0.0000 KTKBANK At Most 1 6.77E-05 2.1123 0.9614 2.1123 0.9614 None 0.0039 252.5168 0.0001 250.3932 0.0001 MARUTI At Most 1 3.31E-05 2.1237 0.1450 2.1237 0.1450 None 0.0010 39.3019 0.0006 34.4472 0.0002 MATRIXLABS At Most 1 0.0001 4.8546 0.6173 4.8546 0.6173 None 0.0019 140.3428 0.0001 130.6212 0.0001 MTNL At Most 1 0.0001 9.7217 0.0018 9.7217 0.0018 None 0.0017 123.3865 0.0000 115.8687 0.0001 NATIONALUM At Most 1 0.0001 7.5178 0.2936 7.5178 0.2936 None 0.0065 211.3639 0.0000 206.9242 0.0001 NDTV At Most 1 0.0001 4.4397 0.6779 4.4397 0.6779 None 0.0044 193.2884 0.0000 182.0630 0.0001 NTPC At Most 1 0.0003 11.2254 0.0814 11.2254 0.0814 None 0.0019 127.9800 0.0000 117.1130 0.0001 ORIENTBANK At Most 1 0.0002 8.8670 0.0929 8.8670 0.0929 None 0.0010 70.1868 0.0000 62.5897 0.0000 PNB At Most 1 0.0001 7.5970 0.2864 7.5970 0.2864 None 0.0028 196.2489 0.0000 192.2291 0.0001 POLARIS At Most 1 5.86E-05 4.0198 0.7392 4.0198 0.7392 None 0.0053 184.6091 0.0000 176.3229 0.0001 RELCAPITAL At Most 1 0.0003 8.2862 0.2292 8.2862 0.2292 None 0.0037 257.9841 0.0000 254.1347 0.0001 RELIANCE At Most 1 5.59E-05 3.8494 0.7638 3.8494 0.7638 None 0.0027 193.7208 0.0000 187.4038 0.0001 SBIN At Most 1 9.19E-05 6.3170 0.4211 6.3170 0.4211 None 0.0049 155.0368 0.0001 152.4819 0.0001 SRF At Most 1 8.16E-05 2.5549 0.1100 2.5549 0.1100 None 0.0023 140.6967 0.0000 136.6305 0.0001 SYNDIBANK At Most 1 6.77E-05 4.0661 0.7325 4.0661 0.7325 None 0.0013 48.7758 0.0000 41.8771 0.0000 TATACHEM At Most 1 0.0002 6.8988 0.3552 6.8988 0.3552 None 0.0028 163.4635 0.0000 159.0174 0.0001 TATAMOTORS At Most 1 7.95E-05 4.4461 0.6770 4.4461 0.6770 None 0.0028 201.8957 0.0000 193.3267 0.0001 TATAPOWER At Most 1 0.0001 8.5691 0.2086 8.5691 0.2086 None 0.0104 341.2376 0.0000 333.9578 0.0001 TITAN At Most 1 0.0002 7.2798 0.3162 7.2798 0.3162 None 0.0028 179.5441 0.0000 175.2320 0.0001 UNIONBANK At Most 1 7.01E-05 4.3121 0.6966 4.3121 0.6966

33
Table V Granger Causality Test Results of Indian Equity Futures and Cash Markets Symbol Null Hypothesis F Value P Value
Cash Market Does Not Granger Cause Futures Market 1.07 0.37 NIFTY Futures Market Does Not Granger Cause Cash Market 2.24 0.06 Cash Market Does Not Granger Cause Futures Market 18.65 3.6E-44 ABB Futures Market Does Not Granger Cause Cash Market 274.53 0.0000 Cash Market Does Not Granger Cause Futures Market 8.353 3.5E-25 ACC Futures Market Does Not Granger Cause Cash Market 605.669 0.0000 Cash Market Does Not Granger Cause Futures Market 86.62 6.0E-161 ANDHRABANK Futures Market Does Not Granger Cause Cash Market 765.02 0.0000 Cash Market Does Not Granger Cause Futures Market 31.40 1.8E-90 ARVINDMILL Futures Market Does Not Granger Cause Cash Market 532.47 0.0000 Cash Market Does Not Granger Cause Futures Market 9.70 1.4E-27 ASHOKLEY Futures Market Does Not Granger Cause Cash Market 219.75 0.0000 Cash Market Does Not Granger Cause Futures Market 119.48 2.0E-272 BAJAJAUTO Futures Market Does Not Granger Cause Cash Market 567.99 0.0000 Cash Market Does Not Granger Cause Futures Market 49.87 9.0E-120 BANKBARODA Futures Market Does Not Granger Cause Cash Market 425.53 0.0000 Cash Market Does Not Granger Cause Futures Market 37.29 6.0E-95 BANKINDIA Futures Market Does Not Granger Cause Cash Market 657.39 0.0000 Cash Market Does Not Granger Cause Futures Market 33.18 2.0E-182 BEL Futures Market Does Not Granger Cause Cash Market 235.92 0.0000 Cash Market Does Not Granger Cause Futures Market 38.23 9.0E-134 BHEL Futures Market Does Not Granger Cause Cash Market 418.82 0.0000 Cash Market Does Not Granger Cause Futures Market 99.21 3.0E-245 BPCL Futures Market Does Not Granger Cause Cash Market 628.14 0.0000 Cash Market Does Not Granger Cause Futures Market 35.61 3.4E-70 CANBK Futures Market Does Not Granger Cause Cash Market 668.14 0.0000 Cash Market Does Not Granger Cause Futures Market 6.77 1.0E-15 CENTURYTEX Futures Market Does Not Granger Cause Cash Market 322.64 0.0000 Cash Market Does Not Granger Cause Futures Market 13.21 1.5E-25 COLGATE Futures Market Does Not Granger Cause Cash Market 477.36 0.0000 Cash Market Does Not Granger Cause Futures Market 11.63 7.8E-47 CUMMINSIND Futures Market Does Not Granger Cause Cash Market 192.63 0.0000 Cash Market Does Not Granger Cause Futures Market 43.81 1.0E-120 DIVISLAB Futures Market Does Not Granger Cause Cash Market 175.69 0.0000 Cash Market Does Not Granger Cause Futures Market 29.44 8.2E-41 ESCORTS Futures Market Does Not Granger Cause Cash Market 408.78 0.0000 Cash Market Does Not Granger Cause Futures Market 24.12 4.9E-76 ESSAROIL Futures Market Does Not Granger Cause Cash Market 243.52 0.0000 Cash Market Does Not Granger Cause Futures Market 25.28 1.5E-74 GAIL Futures Market Does Not Granger Cause Cash Market 645.12 0.0000 Cash Market Does Not Granger Cause Futures Market 17.30 7.0E-29 GNFC Futures Market Does Not Granger Cause Cash Market 409.29 0.0000 Cash Market Does Not Granger Cause Futures Market 27.90 2.1E-74 GRASIM Futures Market Does Not Granger Cause Cash Market 645.12 0.0000 Cash Market Does Not Granger Cause Futures Market 71.80 4E-204 HCLTECH Futures Market Does Not Granger Cause Cash Market 256.07 0.0000 Cash Market Does Not Granger Cause Futures Market 104.46 3E-195 HEROHONDA Futures Market Does Not Granger Cause Cash Market 743.49 0.0000 Cash Market Does Not Granger Cause Futures Market 69.38 5.0E-128 HINDUNILVR Futures Market Does Not Granger Cause Cash Market 680.44 0.0000 Cash Market Does Not Granger Cause Futures Market 37.28 7.0E-116 HINDPETRO Futures Market Does Not Granger Cause Cash Market 415.66 0.0000 Cash Market Does Not Granger Cause Futures Market 29.98 8.3E-53 ICICIBANK Futures Market Does Not Granger Cause Cash Market 768.66 0.0000 Cash Market Does Not Granger Cause Futures Market 22.07 1.4E-45 IDBI Futures Market Does Not Granger Cause Cash Market 381.22 0.0000 Cash Market Does Not Granger Cause Futures Market 16.81 1.9E-50 IDFC Futures Market Does Not Granger Cause Cash Market 210.42 0.0000 Cash Market Does Not Granger Cause Futures Market 26.05 7.9E-55 IPCL Futures Market Does Not Granger Cause Cash Market 729.61 0.0000 Cash Market Does Not Granger Cause Futures Market 29.92 1.4E-52 JETAIRWAYS Futures Market Does Not Granger Cause Cash Market 377.89 0.0000
Contd….

34
Symbol Null Hypothesis F Value P Value
Cash Market Does Not Granger Cause Futures Market 45.35 4.0E-125 KTKBANK Futures Market Does Not Granger Cause Cash Market 185.45 0.0000 Cash Market Does Not Granger Cause Futures Market 37.89 9.0E-104 MARUTI Futures Market Does Not Granger Cause Cash Market 599.77 0.0000 Cash Market Does Not Granger Cause Futures Market 15.02 3.0E-17 MATRIXLABS Futures Market Does Not Granger Cause Cash Market 506.61 0.0000 Cash Market Does Not Granger Cause Futures Market 12.33 2.7E-31 MTNL Futures Market Does Not Granger Cause Cash Market 604.92 0.0000 Cash Market Does Not Granger Cause Futures Market 70.61 2.0E-144 NATIONALUM Futures Market Does Not Granger Cause Cash Market 553.44 0.0000 Cash Market Does Not Granger Cause Futures Market 42.81 5.0E-142 NDTV Futures Market Does Not Granger Cause Cash Market 175.04 0.0000 Cash Market Does Not Granger Cause Futures Market 52.09 3.0E-155 NTPC Futures Market Does Not Granger Cause Cash Market 324.65 0.0000 Cash Market Does Not Granger Cause Futures Market 37.12 2.0E-150 ORIENTBANK Futures Market Does Not Granger Cause Cash Market 260.87 0.0000 Cash Market Does Not Granger Cause Futures Market 20.19 6.5E-52 PNB Futures Market Does Not Granger Cause Cash Market 435.39 0.0000 Cash Market Does Not Granger Cause Futures Market 15.48 1.9E-43 POLARIS Futures Market Does Not Granger Cause Cash Market 452.54 0.0000 Cash Market Does Not Granger Cause Futures Market 8.70 3.0E-19 RELCAPITAL Futures Market Does Not Granger Cause Cash Market 390.18 0.0000 Cash Market Does Not Granger Cause Futures Market 3.71 7.9E-08 RELIANCE Futures Market Does Not Granger Cause Cash Market 658.69 0.0000 Cash Market Does Not Granger Cause Futures Market 25.08 1.2E-61 SBIN Futures Market Does Not Granger Cause Cash Market 885.09 0.0000 Cash Market Does Not Granger Cause Futures Market 18.64 2.5E-47 SRF Futures Market Does Not Granger Cause Cash Market 213.47 0.0000 Cash Market Does Not Granger Cause Futures Market 48.54 2.0E-116 SYNDIBANK Futures Market Does Not Granger Cause Cash Market 658.35 0.0000 Cash Market Does Not Granger Cause Futures Market 27.97 1.9E-79 TATACHEM Futures Market Does Not Granger Cause Cash Market 115.02 0.0000 Cash Market Does Not Granger Cause Futures Market 23.72 1.9E-49 TATAMOTORS Futures Market Does Not Granger Cause Cash Market 634.53 0.0000 Cash Market Does Not Granger Cause Futures Market 24.98 2.2E-70 TATAPOWER Futures Market Does Not Granger Cause Cash Market 394.31 0.0000 Cash Market Does Not Granger Cause Futures Market 16.28 1.5E-21 TITAN Futures Market Does Not Granger Cause Cash Market 551.82 0.0000 Cash Market Does Not Granger Cause Futures Market 43.99 2.2E-96 UNIONBANK Futures Market Does Not Granger Cause Cash Market 789.86 0.0000
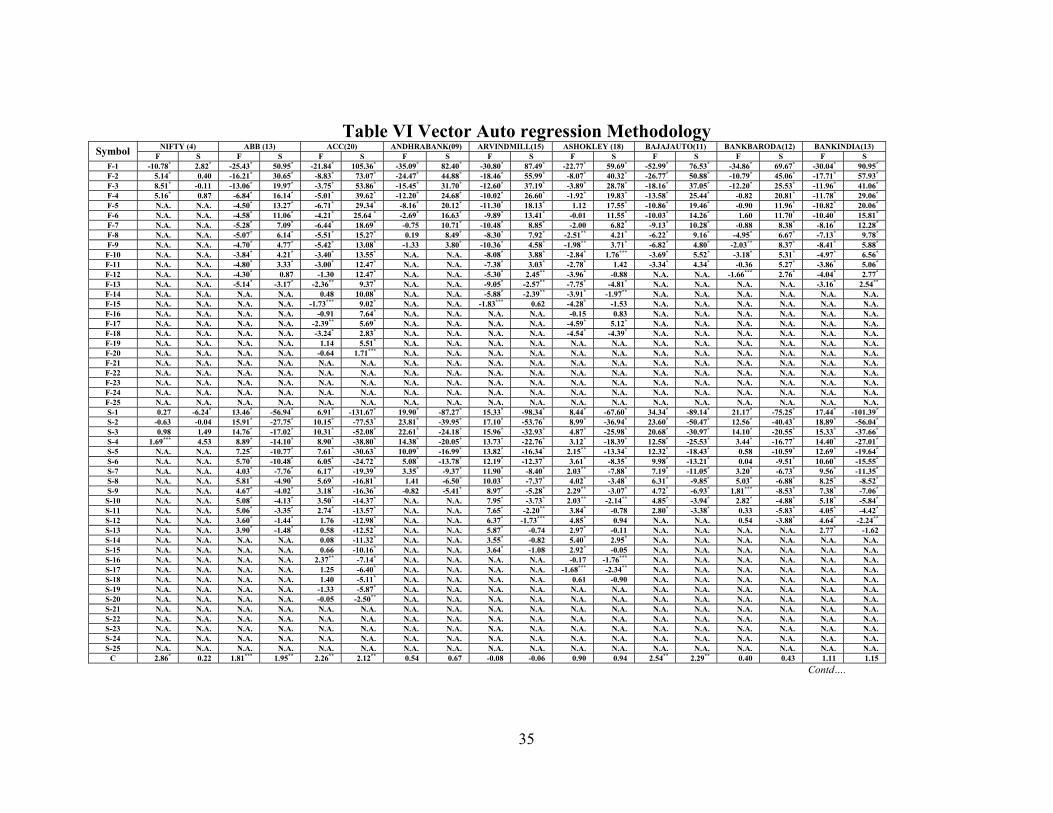
35
Table VI Vector Auto regression Methodology NIFTY (4) ABB (13) ACC(20) ANDHRABANK(09) ARVINDMILL(15) ASHOKLEY (18) BAJAJAUTO(11) BANKBARODA(12) BANKINDIA(13) Symbol F S F S F S F S F S F S F S F S F S
F-1 -10.78* 2.82* -25.43* 50.95* -21.84* 105.36* -35.09* 82.40* -30.80* 87.49* -22.77* 59.69* -52.99* 76.53* -34.86* 69.67* -30.04* 90.95* F-2 5.14* 0.40 -16.21* 30.65* -8.83* 73.07* -24.47* 44.88* -18.46* 55.99* -8.07* 40.32* -26.77* 50.88* -10.79* 45.06* -17.71* 57.93* F-3 8.51* -0.11 -13.06* 19.97* -3.75* 53.86* -15.45* 31.70* -12.60* 37.19* -3.89* 28.78* -18.16* 37.05* -12.20* 25.53* -11.96* 41.06* F-4 5.16* 0.87 -6.84* 16.14* -5.01* 39.62* -12.20* 24.68* -10.02* 26.60* -1.92* 19.83* -13.58* 25.44* -0.82 20.81* -11.78* 29.06* F-5 N.A. N.A. -4.50* 13.27* -6.71* 29.34* -8.16* 20.12* -11.30* 18.13* 1.12 17.55* -10.86* 19.46* -0.90 11.96* -10.82* 20.06* F-6 N.A. N.A. -4.58* 11.06* -4.21* 25.64 * -2.69* 16.63* -9.89* 13.41* -0.01 11.55* -10.03* 14.26* 1.60 11.70* -10.40* 15.81* F-7 N.A. N.A. -5.28* 7.09* -6.44* 18.69* -0.75 10.71* -10.48* 8.85* -2.00 6.82* -9.13* 10.28* -0.88 8.38* -8.16* 12.28* F-8 N.A. N.A. -5.07* 6.14* -5.51* 15.27* 0.19 8.49* -8.30* 7.92* -2.51** 4.21* -6.22* 9.16* -4.95* 6.67* -7.13* 9.78* F-9 N.A. N.A. -4.70* 4.77* -5.42* 13.08* -1.33 3.80* -10.36* 4.58* -1.98** 3.71* -6.82* 4.80* -2.03** 8.37* -8.41* 5.88* F-10 N.A. N.A. -3.84* 4.21* -3.40* 13.55* N.A. N.A. -8.08* 3.88* -2.84* 1.76*** -3.69* 5.52* -3.18* 5.31* -4.97* 6.56* F-11 N.A. N.A. -4.80* 3.33* -3.00* 12.47* N.A. N.A. -7.38* 3.03* -2.78* 1.42 -3.34* 4.34* -0.36 5.27* -3.86* 5.06* F-12 N.A. N.A. -4.30* 0.87 -1.30 12.47* N.A. N.A. -5.30* 2.45** -3.96* -0.88 N.A. N.A. -1.66*** 2.76* -4.04* 2.77* F-13 N.A. N.A. -5.14* -3.17* -2.36** 9.37* N.A. N.A. -9.05* -2.57** -7.75* -4.81* N.A. N.A. N.A. N.A. -3.16* 2.54** F-14 N.A. N.A. N.A. N.A. 0.48 10.08* N.A. N.A. -5.88* -2.39** -3.91* -1.97** N.A. N.A. N.A. N.A. N.A. N.A.F-15 N.A. N.A. N.A. N.A. -1.73*** 9.02* N.A. N.A. -1.83*** 0.62 -4.28* -1.53 N.A. N.A. N.A. N.A. N.A. N.A.F-16 N.A. N.A. N.A. N.A. -0.91 7.64* N.A. N.A. N.A. N.A. -0.15 0.83 N.A. N.A. N.A. N.A. N.A. N.A.F-17 N.A. N.A. N.A. N.A. -2.39** 5.69* N.A. N.A. N.A. N.A. -4.59* 5.12* N.A. N.A. N.A. N.A. N.A. N.A.F-18 N.A. N.A. N.A. N.A. -3.24* 2.83* N.A. N.A. N.A. N.A. -4.54* -4.39* N.A. N.A. N.A. N.A. N.A. N.A.F-19 N.A. N.A. N.A. N.A. 1.14 5.51* N.A. N.A. N.A. N.A. N.A. N.A. N.A. N.A. N.A. N.A. N.A. N.A.F-20 N.A. N.A. N.A. N.A. -0.64 1.71*** N.A. N.A. N.A. N.A. N.A. N.A. N.A. N.A. N.A. N.A. N.A. N.A.F-21 N.A. N.A. N.A. N.A. N.A. N.A. N.A. N.A. N.A. N.A. N.A. N.A. N.A. N.A. N.A. N.A. N.A. N.A.F-22 N.A. N.A. N.A. N.A. N.A. N.A. N.A. N.A. N.A. N.A. N.A. N.A. N.A. N.A. N.A. N.A. N.A. N.A.F-23 N.A. N.A. N.A. N.A. N.A. N.A. N.A. N.A. N.A. N.A. N.A. N.A. N.A. N.A. N.A. N.A. N.A. N.A.F-24 N.A. N.A. N.A. N.A. N.A. N.A. N.A. N.A. N.A. N.A. N.A. N.A. N.A. N.A. N.A. N.A. N.A. N.A.F-25 N.A. N.A. N.A. N.A. N.A. N.A. N.A. N.A. N.A. N.A. N.A. N.A. N.A. N.A. N.A. N.A. N.A. N.A.S-1 0.27 -6.24* 13.46* -56.94* 6.91* -131.67* 19.90* -87.27* 15.33* -98.34* 8.44* -67.60* 34.34* -89.14* 21.17* -75.25* 17.44* -101.39* S-2 -0.63 -0.04 15.91* -27.75* 10.15* -77.53* 23.81* -39.95* 17.10* -53.76* 8.99* -36.94* 23.60* -50.47* 12.56* -40.43* 18.89* -56.04* S-3 0.98 1.49 14.76* -17.02* 10.31* -52.08* 22.61* -24.18* 15.96* -32.93* 4.87* -25.98* 20.68* -30.97* 14.10* -20.55* 15.33* -37.66* S-4 1.69*** 4.53 8.89* -14.10* 8.90* -38.80* 14.38* -20.05* 13.73* -22.76* 3.12* -18.39* 12.58* -25.53* 3.44* -16.77* 14.40* -27.01* S-5 N.A. N.A. 7.25* -10.77* 7.61* -30.63* 10.09* -16.99* 13.82* -16.34* 2.15** -13.34* 12.32* -18.43* 0.58 -10.59* 12.69* -19.64* S-6 N.A. N.A. 5.70* -10.48* 6.05* -24.72* 5.08* -13.78* 12.19* -12.37* 3.61* -8.35* 9.98* -13.21* 0.04 -9.51* 10.60* -15.55* S-7 N.A. N.A. 4.03* -7.76* 6.17* -19.39* 3.35* -9.37* 11.90* -8.40* 2.03** -7.88* 7.19* -11.05* 3.20* -6.73* 9.56* -11.35* S-8 N.A. N.A. 5.81* -4.90* 5.69* -16.81* 1.41 -6.50* 10.03* -7.37* 4.02* -3.48* 6.31* -9.85* 5.03* -6.88* 8.25* -8.52* S-9 N.A. N.A. 4.67* -4.02* 3.18* -16.36* -0.82 -5.41* 8.97* -5.28* 2.29** -3.07* 4.72* -6.93* 1.81*** -8.53* 7.38* -7.06* S-10 N.A. N.A. 5.08* -4.13* 3.50* -14.37* N.A. N.A. 7.95* -3.73* 2.03** -2.14** 4.85* -3.94* 2.82* -4.88* 5.18* -5.84* S-11 N.A. N.A. 5.06* -3.35* 2.74* -13.57* N.A. N.A. 7.65* -2.20** 3.84* -0.78 2.80* -3.38* 0.33 -5.83* 4.05* -4.42* S-12 N.A. N.A. 3.60* -1.44* 1.76 -12.98* N.A. N.A. 6.37* -1.73*** 4.85* 0.94 N.A. N.A. 0.54 -3.88* 4.64* -2.24** S-13 N.A. N.A. 3.90* -1.48* 0.58 -12.52* N.A. N.A. 5.87* -0.74 2.97* -0.11 N.A. N.A. N.A. N.A. 2.77* -1.62 S-14 N.A. N.A. N.A. N.A. 0.08 -11.32* N.A. N.A. 3.55* -0.82 5.40* 2.95* N.A. N.A. N.A. N.A. N.A. N.A.S-15 N.A. N.A. N.A. N.A. 0.66 -10.16* N.A. N.A. 3.64* -1.08 2.92* -0.05 N.A. N.A. N.A. N.A. N.A. N.A.S-16 N.A. N.A. N.A. N.A. 2.37** -7.14* N.A. N.A. N.A. N.A. -0.17 -1.76*** N.A. N.A. N.A. N.A. N.A. N.A.S-17 N.A. N.A. N.A. N.A. 1.25 -6.40* N.A. N.A. N.A. N.A. -1.68*** -2.34** N.A. N.A. N.A. N.A. N.A. N.A.S-18 N.A. N.A. N.A. N.A. 1.40 -5.11* N.A. N.A. N.A. N.A. 0.61 -0.90 N.A. N.A. N.A. N.A. N.A. N.A.S-19 N.A. N.A. N.A. N.A. -1.33 -5.87* N.A. N.A. N.A. N.A. N.A. N.A. N.A. N.A. N.A. N.A. N.A. N.A.S-20 N.A. N.A. N.A. N.A. -0.05 -2.50** N.A. N.A. N.A. N.A. N.A. N.A. N.A. N.A. N.A. N.A. N.A. N.A.S-21 N.A. N.A. N.A. N.A. N.A. N.A. N.A. N.A. N.A. N.A. N.A. N.A. N.A. N.A. N.A. N.A. N.A. N.A.S-22 N.A. N.A. N.A. N.A. N.A. N.A. N.A. N.A. N.A. N.A. N.A. N.A. N.A. N.A. N.A. N.A. N.A. N.A.S-23 N.A. N.A. N.A. N.A. N.A. N.A. N.A. N.A. N.A. N.A. N.A. N.A. N.A. N.A. N.A. N.A. N.A. N.A.S-24 N.A. N.A. N.A. N.A. N.A. N.A. N.A. N.A. N.A. N.A. N.A. N.A. N.A. N.A. N.A. N.A. N.A. N.A.S-25 N.A. N.A. N.A. N.A. N.A. N.A. N.A. N.A. N.A. N.A. N.A. N.A. N.A. N.A. N.A. N.A. N.A. N.A.
C 2.86* 0.22 1.81*** 1.95** 2.26** 2.12** 0.54 0.67 -0.08 -0.06 0.90 0.94 2.54** 2.29** 0.40 0.43 1.11 1.15 Contd….

36
BEL(24) BHEL(18) BPCL(12) CANBK(10) CENTURYTEX(16) COLGATE(11) CUMMINSIND(25) DIVISLAB(14) ESCORTS(7) Symbol F S F S F S F S F S F S F S F S F S
F-1 -32.04* 79.65* -32.88* 85.57* -43.10* 85.06* -26.42* 80.91* -12.37* 70.21* -25.50* 68.94* -22.59* 65.96* -28.90* 43.91* -18.67* 53.08* F-2 -27.81* 43.99* -15.99* 50.87* -25.73* 52.75* -13.26* 45.74* -2.14* 49.14* -10.04* 45.39* -10.22* 46.58* -18.97* 34.33* -12.35* 29.19* F-3 -13.00* 39.66* -14.84* 32.05* -16.21* 36.73* -9.34* 29.57* -2.16* 34.62* -5.05* 31.99* -9.68* 30.70* -7.41* 29.40* -8.23* 19.42* F-4 -12.00* 27.79* -9.88* 24.18* -12.22* 27.41* -3.74* 23.30* -0.12 27.88* -3.09* 23.75* -8.74* 25.11* -8.21* 20.90* -3.91* 16.00* F-5 -11.20* 22.97* -10.17* 14.88* -10.46* 19.55* -4.69* 13.81* -1.55 21.07* -2.00** 17.15* -10.22* 17.62* -5.00* 18.92* -2.84* 10.61* F-6 -9.14* 17.84* -4.60* 14.61* -6.77* 15.08* -3.07* 11.49* -1.29 17.82* 2.45** 19.28* -9.53* 13.22* -7.95* 14.70* -0.60 10.56* F-7 -9.87* 14.56* -6.58* 9.44* -6.59* 8.51* -4.33* 6.67* -4.65* 11.03* -0.52 12.66* -5.79* 14.28* -6.13* 13.16* 0.99 6.89* F-8 -6.97* 13.64* -5.23* 7.37* -6.04* 6.97* -2.28** 5.12* -4.06* 9.46* -2.59* 7.47* -6.68* 12.20* -6.27* 11.03* N.A. N.A.F-9 -6.88* 10.02* -8.08* 4.19* -3.45* 6.26* -3.16* 1.90*** -4.51* 7.44* -1.08 7.37* -8.60* 10.13* -8.86* 7.97* N.A. N.A.F-10 -5.69* 9.55* -7.60* 4.31* -1.70*** 5.50* -0.21 4.72* -3.87* 5.62* -1.18 6.06* -7.99* 8.19* -7.67* 4.20* N.A. N.A.F-11 -6.11* 7.34* -8.22* 2.43** -2.31** 3.89* N.A. N.A. -4.82* 3.55* -0.57 5.25* -7.27* 8.52* -3.63* 6.74* N.A. N.A.F-12 -6.99* 5.82* -6.93* 0.40 -0.29 4.23* N.A. N.A. -5.50* 1.77*** N.A. N.A. -6.14* 7.31* -4.87* 5.09* N.A. N.A.F-13 -8.11* 4.06* -3.89* 0.86 N.A. N.A. N.A. N.A. -6.89* 0.09 N.A. N.A. -4.58* 6.87* -3.68* 3.20* N.A. N.A.F-14 -8.34* 4.50* -4.66* 0.30 N.A. N.A. N.A. N.A. -5.89* -0.66 N.A. N.A. -2.44** 9.58* -3.09* 2.00* N.A. N.A.F-15 -8.96* 4.87* -4.45* 0.98 N.A. N.A. N.A. N.A. -5.63* -1.37 N.A. N.A. -2.92* 7.58* N.A. N.A. N.A. N.A.F-16 -5.59* 7.57* -6.39* 0.45 N.A. N.A. N.A. N.A. -5.12* -1.03 N.A. N.A. -2.13** 7.73* N.A. N.A. N.A. N.A.F-17 -6.67* 6.18* -4.10* 1.23 N.A. N.A. N.A. N.A. N.A. N.A. N.A. N.A. -2.50** 6.72* N.A. N.A. N.A. N.A.F-18 -6.03* 6.41* -6.23* -2.00** N.A. N.A. N.A. N.A. N.A. N.A. N.A. N.A. -2.32** 6.29* N.A. N.A. N.A. N.A.F-19 -5.22* 6.41* N.A. N.A. N.A. N.A. N.A. N.A. N.A. N.A. N.A. N.A. -1.17 8.02* N.A. N.A. N.A. N.A.F-20 -1.95*** 6.23* N.A. N.A. N.A. N.A. N.A. N.A. N.A. N.A. N.A. N.A. -1.90*** 6.30* N.A. N.A. N.A. N.A.F-21 -4.47* 4.15* N.A. N.A. N.A. N.A. N.A. N.A. N.A. N.A. N.A. N.A. -1.35 6.44* N.A. N.A. N.A. N.A.F-22 -2.31** 6.09* N.A. N.A. N.A. N.A. N.A. N.A. N.A. N.A. N.A. N.A. 1.28 7.49* N.A. N.A. N.A. N.A.F-23 -2.16** 3.62* N.A. N.A. N.A. N.A. N.A. N.A. N.A. N.A. N.A. N.A. -0.45 6.21* N.A. N.A. N.A. N.A.F-24 -2.48** 0.84* N.A. N.A. N.A. N.A. N.A. N.A. N.A. N.A. N.A. N.A. -0.75 7.23* N.A. N.A. N.A. N.A.F-25 N.A. N.A. N.A. N.A. N.A. N.A. N.A. N.A. N.A. N.A. N.A. N.A. -1.21 7.51* N.A. N.A. N.A. N.A.S-1 24.80* -88.36* 23.15* -93.47* 32.83* -97.96* 15.48* -84.39* 6.00* -72.70* 10.68* -79.30* 10.11* -75.05* 23.18* -49.09* 9.30* -55.60* S-2 19.65* -51.92* 18.16* -48.81* 19.98* -55.45* 15.02* 42.38* 3.48* -45.33* 5.20* -48.02* 10.03* -44.58* 14.54* -32.79* 13.51* -24.28* S-3 16.34* -37.98* 16.13* -32.64* 18.97* -33.77* 13.75* -23.61* 3.93* -31.95* 6.34* -32.66* 11.60* -28.46* 8.03* -25.33* 9.55* -14.96* S-4 13.53* -28.13* 12.59* -22.99* 14.16* -23.29* 7.20* -17.24* 2.22** -25.71* 3.94* -23.70* 11.36* -21.58* 7.72* -20.35* 4.61* -14.04* S-5 12.64* -21.41* 10.70* -16.47* 8.08* -19.80* 6.59* -12.50* 3.01* -19.15* 4.52* -15.94* 12.55* -14.12* 7.78* -15.94* 4.51* -8.09* S-6 9.26* -18.76* 7.97* -13.48* 8.23* -12.98* 5.08* -9.55* 3.10* -15.12* 1.03 -16.40* 9.88* -12.64* 8.19* -13.40* 1.47 -9.23* S-7 9.26* -15.12* 8.01* -8.81* 7.20* -9.89* 5.25* -5.15* 4.61* -10.49* 1.35 -13.12* 6.29* -14.39* 5.89* -12.14* -0.70 -6.93* S-8 8.09* -13.59* 6.04* -7.69* 6.42* -7.36* 3.14* -4.24* 4.77* -8.51* 1.65* -7.96* 7.52* -11.50* 5.57* -9.31* N.A. N.A.S-9 6.47* -11.09* 5.99* -5.94* 2.10** -7.66* 1.12 -4.47* 3.37* -7.55* 2.57** -6.26* 8.22* -9.73* 7.65* -7.25* N.A. N.A.S-10 7.20* -8.58* 7.10* -4.64* 0.43 -6.71* 1.17 -2.82* 4.53* -4.78* 0.65 -6.42* 7.11* -8.23* 6.67* -5.52* N.A. N.A.S-11 6.28* -7.39* 6.24* -4.22* -0.19 -5.33* N.A. N.A. 5.32* -2.68* 0.46 -4.56* 7.11* -7.86* 6.01* -5.64* N.A. N.A.S-12 5.74* -7.60* 4.61* -3.18* 1.60 -3.76* N.A. N.A. 5.40* -1.23 N.A. N.A. 6.49* -6.62* 6.11* -3.93* N.A. N.A.S-13 8.21* -5.54* 4.69* -3.14* N.A. N.A. N.A. N.A. 6.17* -0.49 N.A. N.A. 3.60* -9.02* 3.39* -3.60* N.A. N.A.S-14 8.81* -5.43* 6.03* -2.02** N.A. N.A. N.A. N.A. 5.69* 0.10 N.A. N.A. 3.54* -9.42* 1.24 -3.16* N.A. N.A.S-15 9.37* -7.08* 5.72* -1.58 N.A. N.A. N.A. N.A. 5.88* 1.70 N.A. N.A. 3.51* -8.43* N.A. N.A. N.A. N.A.S-16 6.57* -8.37* 7.28* -1.14 N.A. N.A. N.A. N.A. 5.56* 1.77*** N.A. N.A. 3.05* -7.08* N.A. N.A. N.A. N.A.S-17 6.97* -7.60* 5.57* -1.45 N.A. N.A. N.A. N.A. N.A. N.A. N.A. N.A. 1.58 -8.95* N.A. N.A. N.A. N.A.S-18 5.87* -7.59* 3.91* -1.72*** N.A. N.A. N.A. N.A. N.A. N.A. N.A. N.A. 1.66*** -7.77* N.A. N.A. N.A. N.A.S-19 3.74* -7.70* N.A. N.A. N.A. N.A. N.A. N.A. N.A. N.A. N.A. N.A. 2.25** -7.44* N.A. N.A. N.A. N.A.S-20 4.83* -5.39* N.A. N.A. N.A. N.A. N.A. N.A. N.A. N.A. N.A. N.A. 0.40 -8.46* N.A. N.A. N.A. N.A.S-21 4.13* -4.70* N.A. N.A. N.A. N.A. N.A. N.A. N.A. N.A. N.A. N.A. 1.54 -6.33* N.A. N.A. N.A. N.A.S-22 2.52** -4.95* N.A. N.A. N.A. N.A. N.A. N.A. N.A. N.A. N.A. N.A. 0.94 -6.57* N.A. N.A. N.A. N.A.S-23 3.33* -2.75* N.A. N.A. N.A. N.A. N.A. N.A. N.A. N.A. N.A. N.A. 0.77 -6.60* N.A. N.A. N.A. N.A.S-24 4.02* 0.97 N.A. N.A. N.A. N.A. N.A. N.A. N.A. N.A. N.A. N.A. 0.47 -7.67* N.A. N.A. N.A. N.A.S-25 N.A. N.A. N.A. N.A. N.A. N.A. N.A. N.A. N.A. N.A. N.A. N.A. 3.87* -4.69* N.A. N.A. N.A. N.A.
C 2.12** 2.37** 2.83* 2.85* 0.38 0.31 0.45 0.46 0.98 0.98 0.86 0.90 0.96 1.03 1.64*** 1.88*** 0.36 0.43 Contd….

37
ESSAROIL(17) GAIL(21) GNFC(9) GRASIM(14) HCLTECH(14) HEROHONDA(9) HINDPETRO(16) HINDUNILVR(9) ICICIBANK(9) Symbol F S F S F S F S F S F S F S F S F S
F-1 -25.97* 62.86* -24.25* 65.28* -22.26* 57.48* -27.24* 93.04* -35.77* 59.18* -47.19* 79.46* -35.51* 79.82* -38.00* 76.82* -32.69* 80.95* F-2 -11.71* 44.78* -10.07* 37.31* -9.58* 47.74* -14.15* 59.73* -24.26* 33.10* -18.94* 51.98* -17.40* 48.60* -19.91* 48.02* -14.60* 50.45* F-3 -11.09* 30.96* 0.93 25.09* -5.85* 27.13* -9.24* 41.04* -19.97* 23.45* -11.36* 34.11* -8.37* 33.53* -13.94* 29.71* -5.84* 33.03* F-4 -10.34* 24.26* 3.32* 17.81* -5.23* 19.12* -6.19* 31.10* -11.65* 17.15* -6.87* 24.29* -8.46* 23.90* -11.64* 19.65* -4.96* 19.56* F-5 -8.64* 18.99* 0.24 9.40* -3.20* 13.82* -8.10* 19.67* -10.39* 11.59* -6.48* 15.35* -8.65* 14.69* -6.01* 13.73* -4.52* 13.43* F-6 -6.16* 16.94* -0.04 6.47* -1.65*** 12.18* -7.46* 15.71* -3.55* 10.39* -3.26* 11.82* -6.84* 11.51* -3.48* 10.57* -3.91* 8.92* F-7 -5.95* 13.42* 0.66 6.84* -0.79 10.03* -6.02* 12.98* -6.73* 6.19* -2.13** 8.92* -5.87* 8.36* -1.51 8.17* -5.06* 4.02* F-8 -6.27* 10.49* -2.16** 1.46 0.75 9.20* -4.89* 10.89* -1.41 5.96* -0.71 7.44* -5.21* 6.38* -0.84 5.60* -3.38* 3.92* F-9 -4.55* 9.09* -2.57** -1.08 -1.12 4.21* -5.81* 7.81* -3.91* 3.83* -2.28** 4.09* -7.25* 5.47* -2.56** 2.52** -3.48* 1.32 F-10 -4.24* 7.00* -3.66* -0.73 N.A. N.A. -2.76* 8.25* -5.48* 5.21* N.A. N.A. -4.61* 6.86* N.A. N.A. N.A. N.A.F-11 -4.56* 5.77* -4.73* -3.60* N.A. N.A. -4.00* 4.59* -9.49* 4.86* N.A. N.A. -6.23* 4.87* N.A. N.A. N.A. N.A.F-12 -4.29* 4.86* -6.45* -4.21* N.A. N.A. -3.05* 4.13* -12.19* 2.71* N.A. N.A. -4.18* 4.69* N.A. N.A. N.A. N.A.F-13 -4.60* 3.29* -7.81* -7.74* N.A. N.A. -3.02* 2.88* -11.22* 0.90 N.A. N.A. -7.95* 4.57* N.A. N.A. N.A. N.A.F-14 -5.10* 1.64*** -9.91* -5.87* N.A. N.A. -3.43* 1.02 -6.70* 0.64 N.A. N.A. -3.79* 5.92* N.A. N.A. N.A. N.A.F-15 -3.73* 2.21** -5.67* -0.30 N.A. N.A. N.A. N.A. N.A. N.A. N.A. N.A. -2.35** 3.58* N.A. N.A. N.A. N.A.F-16 -4.73* 0.46 -3.08* 0.79 N.A. N.A. N.A. N.A. N.A. N.A. N.A. N.A. 2.51** 3.03* N.A. N.A. N.A. N.A.F-17 -4.13* -0.23 -5.52* 4.58* N.A. N.A. N.A. N.A. N.A. N.A. N.A. N.A. N.A. N.A. N.A. N.A. N.A. N.A.F-18 N.A. N.A. -7.85* 3.90* N.A. N.A. N.A. N.A. N.A. N.A. N.A. N.A. N.A. N.A. N.A. N.A. N.A. N.A.F-19 N.A. N.A. -10.64* 2.03** N.A. N.A. N.A. N.A. N.A. N.A. N.A. N.A. N.A. N.A. N.A. N.A. N.A. N.A.F-20 N.A. N.A. -6.58* -0.20 N.A. N.A. N.A. N.A. N.A. N.A. N.A. N.A. N.A. N.A. N.A. N.A. N.A. N.A.F-21 N.A. N.A. -5.00* -2.97* N.A. N.A. N.A. N.A. N.A. N.A. N.A. N.A. N.A. N.A. N.A. N.A. N.A. N.A.F-22 N.A. N.A. N.A. N.A. N.A. N.A. N.A. N.A. N.A. N.A. N.A. N.A. N.A. N.A. N.A. N.A. N.A. N.A.F-23 N.A. N.A. N.A. N.A. N.A. N.A. N.A. N.A. N.A. N.A. N.A. N.A. N.A. N.A. N.A. N.A. N.A. N.A.F-24 N.A. N.A. N.A. N.A. N.A. N.A. N.A. N.A. N.A. N.A. N.A. N.A. N.A. N.A. N.A. N.A. N.A. N.A.F-25 N.A. N.A. N.A. N.A. N.A. N.A. N.A. N.A. N.A. N.A. N.A. N.A. N.A. N.A. N.A. N.A. N.A. N.A.S-1 17.86* -65.68* 17.94* -72.57* 9.16* -65.53* 18.27* -101.58* 26.75* -59.56* 29.42* -99.54* 22.09* -90.10* 22.27* -95.31* 15.18* -98.72* S-2 11.42* -41.49* 6.77* -41.04* 10.73* -37.23* 14.81* -58.20* 22.46* -31.12* 13.30* -57.63* 13.20* -50.17* 14.20* -53.82* 11.89* -51.78* S-3 12.76* -27.51* 5.72* -18.65* 9.66* -22.18* 11.37* -38.92* 18.25* -22.32* 13.78* -33.02* 12.64* -30.20* 17.16* -27.27* 7.65* -32.49* S-4 10.09* -23.26* 2.51** -13.78* 6.33* -16.93* 9.35* -29.25* 10.27* -17.68* 10.32* -22.13* 9.21* -20.81* 12.46* -18.51* 5.77* -20.35* S-5 9.43* -16.84* 1.94*** -10.08* 5.06* -13.65* 8.38* -20.67* 9.64* -11.19* 7.15* -15.28* 9.25* -12.86* 6.72* -13.89* 3.99* -14.14* S-6 6.29* -15.72* 1.58 -6.23* 2.25** -11.66* 7.92* -15.77* 4.66* -9.60* 2.83* -11.73* 6.04* -10.56* 5.15* -10.06* 4.31* -9.18* S-7 5.93* -13.01* 3.23* -3.45* 1.08 -9.31* 7.21* -12.43* 6.33* -5.73* 1.17 -9.19* 5.51* -8.48* 2.40** -7.51* 4.87* -5.46* S-8 6.66* -8.70* 3.03* -0.31 0.70 -5.80* 5.18* -10.24* 2.65* -4.54* -0.07 -7.37* 5.33* -6.86* 0.34 -6.83* 3.23* -4.43* S-9 4.45* -8.46* 1.88*** -0.88 -0.22 -4.13* 3.59* -9.83* 3.81* -3.42* 2.68* -2.93* 5.25* -7.52* 0.57 -3.02* 0.53 -3.79* S-10 4.23* -6.62* 2.70* -0.39 N.A. N.A. 3.32* -7.72* 6.23* -4.70* N.A. N.A. 3.29* -7.96* N.A. N.A. N.A. N.A.S-11 4.87* -5.59* 5.44* 2.12** N.A. N.A. 3.29* -5.80* 8.66* -4.66* N.A. N.A. 4.64* -5.61* N.A. N.A. N.A. N.A.S-12 4.14* -4.35* 7.73* 3.11* N.A. N.A. 2.65* -4.25* 10.54* -2.78* N.A. N.A. 5.58* -4.31* N.A. N.A. N.A. N.A.S-13 4.29* -4.45* 10.65* 7.29* N.A. N.A. 2.59* -4.17* 10.50* -0.18 N.A. N.A. 7.88* -4.15* N.A. N.A. N.A. N.A.S-14 5.58* -1.28 7.02* 0.44 N.A. N.A. 0.86 -3.17* 5.67* 0.99 N.A. N.A. 4.07* -5.58* N.A. N.A. N.A. N.A.S-15 4.56* -1.92*** 4.92* -1.36 N.A. N.A. N.A. N.A. N.A. N.A. N.A. N.A. 1.93*** -4.52* N.A. N.A. N.A. N.A.S-16 4.94* -1.20 5.27* -0.67 N.A. N.A. N.A. N.A. N.A. N.A. N.A. N.A. 0.38 -3.21* N.A. N.A. N.A. N.A.S-17 5.72* 2.18** 6.73* -4.19* N.A. N.A. N.A. N.A. N.A. N.A. N.A. N.A. N.A. N.A. N.A. N.A. N.A. N.A.S-18 N.A. N.A. 7.26* -3.15* N.A. N.A. N.A. N.A. N.A. N.A. N.A. N.A. N.A. N.A. N.A. N.A. N.A. N.A.S-19 N.A. N.A. 8.79* -1.39 N.A. N.A. N.A. N.A. N.A. N.A. N.A. N.A. N.A. N.A. N.A. N.A. N.A. N.A.S-20 N.A. N.A. 5.68* -0.92 N.A. N.A. N.A. N.A. N.A. N.A. N.A. N.A. N.A. N.A. N.A. N.A. N.A. N.A.S-21 N.A. N.A. 7.06* 4.59* N.A. N.A. N.A. N.A. N.A. N.A. N.A. N.A. N.A. N.A. N.A. N.A. N.A. N.A.S-22 N.A. N.A. N.A. N.A. N.A. N.A. N.A. N.A. N.A. N.A. N.A. N.A. N.A. N.A. N.A. N.A. N.A. N.A.S-23 N.A. N.A. N.A. N.A. N.A. N.A. N.A. N.A. N.A. N.A. N.A. N.A. N.A. N.A. N.A. N.A. N.A. N.A.S-24 N.A. N.A. N.A. N.A. N.A. N.A. N.A. N.A. N.A. N.A. N.A. N.A. N.A. N.A. N.A. N.A. N.A. N.A.S-25 N.A. N.A. N.A. N.A. N.A. N.A. N.A. N.A. N.A. N.A. N.A. N.A. N.A. N.A. N.A. N.A. N.A. N.A.
C 0.39 0.40 0.56 0.81 0.26 0.26 2.39** 2.35** 0.56 0.52 1.70*** 1.58 -0.19 -0.20 0.48 0.47 2.58* 2.33** Contd….

38
IDBI(11) IDFC(17) IPCL(11) JETAIRWAYS(9) KTKBANK(14) MARUTI(14) MATRIXLABS(6) MTNL(15) NATIONALUM(10) Symbol F S F S F S F S F S F S F S F S F S
F-1 -25.22* 62.54* -17.56* 57.50* -23.48* 87.44* -25.37* 56.75* -24.33* 48.88* -36.25* 28.51* -17.26* 53.10* -20.64* 93.93* -47.38* 72.17* F-2 -7.70* 46.23* -8.90* 36.36* -7.62* 57.50* -11.01* 34.15* -15.90* 31.01* -16.11* 61.19* -5.20* 35.64* -10.59* 58.12* -21.51* 47.92* F-3 -4.80* 32.40* -4.97* 27.27* -1.81*** 43.51* -10.11* 21.22* -21.20* 19.72* -14.84* 43.66* -1.31* 21.53* -6.74* 39.90* -11.89* 32.12* F-4 -5.43* 22.26* -6.72* 12.36* -0.69 32.06* -6.29* 13.63* -16.37* 17.05* -12.96* 31.79* -2.81* 12.37* -6.28* 27.87* -7.55* 22.56* F-5 -1.76*** 19.42* -7.84* 6.94* -1.38 22.54* -3.85* 10.07* -12.58* 15.41* -8.13* 25.37* 0.04 9.85* -8.86* 17.70* -8.97* 14.23* F-6 -2.74* 15.90* -5.45* 8.30* -1.57 18.07* -3.63* 6.94* -10.91* 12.36* -6.68* 18.79* 5.70* 10.16* -8.43* 14.21* -4.64* 11.92* F-7 -4.75* 10.58* -7.63* 1.59 -0.10 13.66* -4.82* 4.97* -8.79* 12.27* -5.19* 14.91* N.A. N.A. -6.51* 12.10* -5.17* 8.03* F-8 -3.46* 8.94* -6.86* 1.23 -4.12* 6.99* -2.76* 2.33** -9.07* 9.29* -3.89* 11.96* N.A. N.A. -6.81* 8.24* -0.18 9.80* F-9 -0.95 7.23* -5.28* 2.02** -3.03* 4.36* -2.65* 3.79* -7.25* 8.15* -4.78* 6.88* N.A. N.A. -6.55* 6.05* -0.61 6.81* F-10 -0.32 5.25* -5.60* 2.29** -0.45 5.07* N.A. N.A. -6.48* 8.42* -4.21* 6.28* N.A. N.A. -5.75* 4.61* -2.74* 2.87* F-11 1.07 5.31* -7.33* 1.70*** 0.89 5.81* N.A. N.A. -6.07* 6.01* -3.75* 5.93* N.A. N.A. -6.12* 3.37* N.A. N.A.F-12 N.A. N.A. -6.97* 1.51 N.A. N.A. N.A. N.A. -5.76* 4.16* -4.96* 4.17* N.A. N.A. -4.09* 3.03* N.A. N.A.F-13 N.A. N.A. -5.85* 1.82*** N.A. N.A. N.A. N.A. -6.92* 2.38** -4.43* 3.57* N.A. N.A. -4.65* 2.99* N.A. N.A.F-14 N.A. N.A. -6.41* 1.07 N.A. N.A. N.A. N.A. -2.39** 1.41 -4.21* 2.67* N.A. N.A. -3.99* 2.52** N.A. N.A.F-15 N.A. N.A. -4.99* 2.19** N.A. N.A. N.A. N.A. N.A. N.A. N.A. N.A. N.A. N.A. -3.98* 0.83 N.A. N.A.F-16 N.A. N.A. -3.46* 4.46* N.A. N.A. N.A. N.A. N.A. N.A. N.A. N.A. N.A. N.A. N.A. N.A. N.A. N.A.F-17 N.A. N.A. -4.35* 0.01 N.A. N.A. N.A. N.A. N.A. N.A. N.A. N.A. N.A. N.A. N.A. N.A. N.A. N.A.F-18 N.A. N.A. N.A. N.A. N.A. N.A. N.A. N.A. N.A. N.A. N.A. N.A. N.A. N.A. N.A. N.A. N.A. N.A.F-19 N.A. N.A. N.A. N.A. N.A. N.A. N.A. N.A. N.A. N.A. N.A. N.A. N.A. N.A. N.A. N.A. N.A. N.A.F-20 N.A. N.A. N.A. N.A. N.A. N.A. N.A. N.A. N.A. N.A. N.A. N.A. N.A. N.A. N.A. N.A. N.A. N.A.F-21 N.A. N.A. N.A. N.A. N.A. N.A. N.A. N.A. N.A. N.A. N.A. N.A. N.A. N.A. N.A. N.A. N.A. N.A.F-22 N.A. N.A. N.A. N.A. N.A. N.A. N.A. N.A. N.A. N.A. N.A. N.A. N.A. N.A. N.A. N.A. N.A. N.A.F-23 N.A. N.A. N.A. N.A. N.A. N.A. N.A. N.A. N.A. N.A. N.A. N.A. N.A. N.A. N.A. N.A. N.A. N.A.F-24 N.A. N.A. N.A. N.A. N.A. N.A. N.A. N.A. N.A. N.A. N.A. N.A. N.A. N.A. N.A. N.A. N.A. N.A.F-25 N.A. N.A. N.A. N.A. N.A. N.A. N.A. N.A. N.A. N.A. N.A. N.A. N.A. N.A. N.A. N.A. N.A. N.A.S-1 14.48* -68.27* 10.75* -60.75* 13.12* -94.45* 11.07* -70.88* 10.37* -50.66* 17.28* -111.85* 8.07* -58.70* 7.71* -104.09* 24.90* -84.39* S-2 10.30* -40.20* 8.29* -34.47* 4.15* -59.22* 14.17* -32.95* 16.18* -25.27* 17.96* -62.67* 6.26* -32.41* 8.84* -57.10* 17.66* -47.22* S-3 6.43* -28.64* 6.34* -21.71* 7.88* -37.88* 12.35* -18.31* 22.37* -14.85* 19.82* -40.13* 4.61* -17.89* 8.59* -37.00* 13.27* -29.51* S-4 5.43* -21.29* 7.21* -12.22* 3.79* -29.61* 9.33* -11.25* 17.85* -14.19* 16.62* -30.07* 3.72* -11.66* 9.24* -25.44* 8.43* -21.59* S-5 3.91* -17.20* 10.77* -6.63* 0.93 -22.08* 7.48* -9.18* 12.79* -13.75* 11.39* -23.38* -0.09 -9.54* 9.81* -16.60* 9.02* -13.66* S-6 4.59* -13.16* 8.64* -5.46* 0.45 -17.10* 5.46* -7.32* 8.95* -12.33* 7.86* -18.58* -2.26** -6.80* 8.59* -13.23* 6.30* -10.92* S-7 4.91* -9.44* 8.83* -0.62 2.28* -11.15* 4.03* -5.66* 9.68* -10.87* 7.58* -13.85* N.A. N.A. 7.31* -10.76* 3.33* -10.04* S-8 3.35* -7.92* 8.11* -0.43 4.19* -5.58* 3.38* -2.42** 7.80* -8.88* 5.18* -11.83* N.A. N.A. 7.05* -8.15* 0.59 -8.69* S-9 0.44 -6.52* 5.64* -2.49** 0.58 -6.75* 4.12* -1.21 5.55* -7.25* 3.90* -9.11* N.A. N.A. 6.38* -6.28* -0.62 -6.67* S-10 -0.36 -5.77* 4.44* -4.55* 0.21 -4.62* N.A. N.A. 4.25* -9.68* 3.17* -7.62* N.A. N.A. 5.82* -5.18* 2.46** -3.39* S-11 -2.58* -5.83* 7.06* -1.94*** -3.06* -6.56* N.A. N.A. 6.03* -5.36* 2.71* -6.78* N.A. N.A. 5.67* -3.49* N.A. N.A.S-12 N.A. N.A. 7.76* -2.27** N.A. N.A. N.A. N.A. 6.81* -2.17** 2.88* -5.30* N.A. N.A. 5.33* -2.52** N.A. N.A.S-13 N.A. N.A. 6.27* -2.96* N.A. N.A. N.A. N.A. 6.64* -4.77* 2.53** -4.27* N.A. N.A. 2.61* -4.21* N.A. N.A.S-14 N.A. N.A. 7.47* -3.56* N.A. N.A. N.A. N.A. 4.26* -1.03 2.88* -2.22** N.A. N.A. 4.31* -3.09* N.A. N.A.S-15 N.A. N.A. 5.60* -4.32* N.A. N.A. N.A. N.A. N.A. N.A. N.A. N.A. N.A. N.A. 4.43* -1.40 N.A. N.A.S-16 N.A. N.A. 4.39* -4.04* N.A. N.A. N.A. N.A. N.A. N.A. N.A. N.A. N.A. N.A. N.A. N.A. N.A. N.A.S-17 N.A. N.A. 3.36* -2.42** N.A. N.A. N.A. N.A. N.A. N.A. N.A. N.A. N.A. N.A. N.A. N.A. N.A. N.A.S-18 N.A. N.A. N.A. N.A. N.A. N.A. N.A. N.A. N.A. N.A. N.A. N.A. N.A. N.A. N.A. N.A. N.A. N.A.S-19 N.A. N.A. N.A. N.A. N.A. N.A. N.A. N.A. N.A. N.A. N.A. N.A. N.A. N.A. N.A. N.A. N.A. N.A.S-20 N.A. N.A. N.A. N.A. N.A. N.A. N.A. N.A. N.A. N.A. N.A. N.A. N.A. N.A. N.A. N.A. N.A. N.A.S-21 N.A. N.A. N.A. N.A. N.A. N.A. N.A. N.A. N.A. N.A. N.A. N.A. N.A. N.A. N.A. N.A. N.A. N.A.S-22 N.A. N.A. N.A. N.A. N.A. N.A. N.A. N.A. N.A. N.A. N.A. N.A. N.A. N.A. N.A. N.A. N.A. N.A.S-23 N.A. N.A. N.A. N.A. N.A. N.A. N.A. N.A. N.A. N.A. N.A. N.A. N.A. N.A. N.A. N.A. N.A. N.A.S-24 N.A. N.A. N.A. N.A. N.A. N.A. N.A. N.A. N.A. N.A. N.A. N.A. N.A. N.A. N.A. N.A. N.A. N.A.S-25 N.A. N.A. N.A. N.A. N.A. N.A. N.A. N.A. N.A. N.A. N.A. N.A. N.A. N.A. N.A. N.A. N.A. N.A.
C -0.11 -0.14 0.38 0.39 1.25 1.23 -0.94 -1.09 0.95 1.27 1.95*** 1.95*** 0.04 0.04 0.50 0.43 1.13 1.37 Contd….

39
NDTV(17) NTPC(15) ORIENTBANK(21) PNB(14) POLARIS(16) RELCAPITAL(14) RELIANCE(19) SBIN(13) SRF(14) Symbol F S F S F S F S F S F S F S F S F S
F-1 -33.74* 53.14* -47.48* 64.06* -33.32* 72.43* -26.93* 76.52* -28.65* 83.42* -14.18* 72.15* -12.73* 105.29* -35.85* 101.27* -22.43* 52.32* F-2 -20.53* 36.34* -19.67* 51.57* -20.46* 38.75* -12.08* 43.08* -9.38* 57.85* -6.03* 50.57* -3.31* 72.56* -14.10* 76.10* -8.60* 38.93* F-3 -16.03* 28.08* -14.97* 34.49* -12.64* 24.15* -6.01* 29.51* -7.96* 40.58* -3.98* 36.72* 1.71*** 54.75* -6.54* 59.84* -2.84* 31.02* F-4 -14.45* 20.44* -9.17* 25.36* -10.64* 15.55* -3.39* 23.21* -8.53* 28.31* -3.86* 28.00* 0.31 39.73* -4.60* 46.28* -1.36 23.90* F-5 -14.06* 14.64* -7.84* 16.85* -11.78* 8.14* -2.44** 17.52* -7.68* 20.62* -2.99* 21.45* -2.17** 28.09* -5.84* 34.33* -0.80 17.84* F-6 -10.05* 14.76* -3.77* 14.85* -9.37* 8.92* -0.17 15.02* -5.29* 18.39* -3.61* 17.15* -1.92*** 21.82* -2.92* 28.59* -0.71 13.30* F-7 -9.52* 11.52* -3.11* 11.67* -6.88* 7.42* 0.50 14.89* -7.53* 11.94* -4.47* 12.95* -1.39 17.83* -3.35** 21.76* -4.01* 6.84* F-8 -8.92* 8.78* -3.34* 9.16* -7.00* 6.44* 2.47** 15.97* -5.94* 10.59* -2.91* 10.85* -1.40 13.96* -2.06** 18.88* -2.54** 6.51* F-9 -8.30* 6.70* -4.82* 4.86* -6.17* 6.95* -0.81 11.55* -5.67* 9.13* -4.57* 7.52* -4.96* 9.59* -4.24* 13.65* -2.52** 6.03* F-10 -6.32* 5.78* -7.51* 1.44 -1.37 8.01* 0.64 10.47* -4.70* 8.39* -3.53* 6.58* -5.54* 7.59* -2.13** 12.31* -4.60* 2.97* F-11 -6.55* 3.74* -7.19* -0.48 -2.78* 8.09* 0.15 7.79* -1.97*** 9.41* -5.16* 3.56* -5.67* 6.83* -1.91**** 9.32* -3.81* 2.90* F-12 -7.21* 4.12* -11.72* -5.64* -0.94 9.40* -0.59 5.64* -2.50** 6.92* -3.96* 3.03* -6.84* 7.04* -1.61 6.72* -3.99* 2.93* F-13 -6.89* 3.04* -15.45* -9.44* -1.07 9.87* -3.82* 3.17* -3.33* 4.99* -3.13* 2.68* -8.92* 8.82* -1.07 4.04* -2.44** 3.05* F-14 -6.42* 2.44** -13.24* -6.77* -0.05 10.32* -5.40* -0.23 -2.61* 4.60* -1.66*** 2.43** -6.40* 9.61* N.A. N.A. -2.50** 4.78* F-15 -7.95* 0.19 -8.28* -5.85* -0.95 8.84* N.A. N.A. -1.52 4.47* N.A. N.A. -3.48* 10.61* N.A. N.A. N.A. N.A.F-16 -5.52* 2.91* N.A. N.A. 1.68*** 10.50* N.A. N.A. -3.73* 1.21 N.A. N.A. -2.93* 9.43* N.A. N.A. N.A. N.A.F-17 -3.14* 2.39** N.A. N.A. 4.20* 11.40* N.A. N.A. N.A. N.A. N.A. N.A. -3.11* 8.25* N.A. N.A. N.A. N.A.F-18 N.A. N.A. N.A. N.A. 1.21 7.92* N.A. N.A. N.A. N.A. N.A. N.A. -3.01* 6.25* N.A. N.A. N.A. N.A.F-19 N.A. N.A. N.A. N.A. 5.64* 10.13* N.A. N.A. N.A. N.A. N.A. N.A. -1.27 5.54* N.A. N.A. N.A. N.A.F-20 N.A. N.A. N.A. N.A. 5.82* 9.73* N.A. N.A. N.A. N.A. N.A. N.A. N.A. N.A. N.A. N.A. N.A. N.A.F-21 N.A. N.A. N.A. N.A. 3.39* 8.87* N.A. N.A. N.A. N.A. N.A. N.A. N.A. N.A. N.A. N.A. N.A. N.A.F-22 N.A. N.A. N.A. N.A. N.A. N.A. N.A. N.A. N.A. N.A. N.A. N.A. N.A. N.A. N.A. N.A. N.A. N.A.F-23 N.A. N.A. N.A. N.A. N.A. N.A. N.A. N.A. N.A. N.A. N.A. N.A. N.A. N.A. N.A. N.A. N.A. N.A.F-24 N.A. N.A. N.A. N.A. N.A. N.A. N.A. N.A. N.A. N.A. N.A. N.A. N.A. N.A. N.A. N.A. N.A. N.A.F-25 N.A. N.A. N.A. N.A. N.A. N.A. N.A. N.A. N.A. N.A. N.A. N.A. N.A. N.A. N.A. N.A. N.A. N.A.S-1 23.29* -51.58* 23.62* -86.09* 21.53* -75.99* 13.22* -82.58* 12.19* -92.15* 7.84* -79.70* 1.16 -143.63* 17.04* -132.85* 14.42* -55.64* S-2 20.81* -31.68* 16.43* -50.66* 19.65* -35.42* 12.60* -40.20* 10.91* -53.16* 9.34* -47.04* 3.08* -85.85* 14.34* -80.92* 9.12* -35.25* S-3 16.74* -23.63* 15.26* -32.65* 17.11* -18.48* 10.21* -23.72* 12.22* -34.25* 6.69* -34.43* 3.99* -58.38* 11.55* -57.69* 4.44* -27.55* S-4 14.60* -18.10* 13.81* -23.60* 14.28* -11.09* 4.36* -20.57* 10.25* -24.90* 4.86* -26.51* 4.66* -41.41* 9.52* -43.36* 2.37** -21.71* S-5 13.18* -14.12* 11.47* -16.95* 12.58* -5.71* 2.93* -16.84* 7.33* -20.52* 4.07* -20.57* 3.02* -31.47* 7.06* -34.49* 1.58 -16.36* S-6 10.43* -12.16* 9.79* -12.42* 9.31* -7.40* 1.66*** -13.38* 7.33* -15.71* 4.08* -15.93* 2.43** -24.74* 4.92* -27.46* 3.03* -9.90* S-7 9.00* -10.17* 6.95* -10.08* 8.01* -7.71* 0.76 -12.47* 7.99* -10.74* 4.07* -12.55* 2.40** -19.08* 4.42* -21.81* 2.47** -7.61* S-8 9.40* -7.06* 5.96* -6.80* 7.25* -7.06* -2.30** -15.11* 5.88* -10.42* 3.55* -10.03* 2.97* -14.92* 3.75* -18.00* 3.50* -4.95* S-9 7.26* -6.20* 5.85* -4.75* 4.34* -9.01* -2.51** -13.46* 5.03* -9.80* 4.50* -7.21* 3.95* -11.54* 2.60* -14.63* 2.16** -5.73* S-10 6.75* -4.67* 6.39* -1.85** 3.06* -8.21* -0.42 -10.01* 3.48* -8.52* 4.58* -5.21* 5.25* -9.65* 2.10** -11.81* 4.33* -2.86* S-11 6.59* -3.24* 9.17* 1.04 1.80*** -9.17* -0.06 -8.11* 2.01** -9.05* 5.03* -3.49* 5.42* -9.01* 1.03 -9.34* 5.10* -2.05** S-12 7.71* -2.43** 11.17* 3.51* 1.94*** -8.34* 0.50 -6.39* 2.67* -7.06* 2.94* -3.40* 6.56* -8.74* 1.40 -6.28* 3.24* -2.31** S-13 5.22* -3.97* 12.23* 5.38* 0.91 -9.08* 2.45** -3.67* 2.83* -4.57* 2.42** -2.41** 6.24* -9.78* 1.85*** -3.53* 2.32** -3.94* S-14 6.41* -2.73* 10.85* 4.89* -0.19 -10.42* 3.96* -0.33 1.62 -5.41* 3.47* -0.83 4.65* -10.67* N.A. N.A. -0.83 -3.87* S-15 8.20* -0.77 7.23* 3.09* 1.35 -8.05* N.A. N.A. 0.76 -4.36* N.A. N.A. 3.13* -10.78* N.A. N.A. N.A. N.A.S-16 4.80* -3.18* N.A. N.A. -2.54** -11.07* N.A. N.A. 2.55** 0.13 N.A. N.A. 2.56** -9.37* N.A. N.A. N.A. N.A.S-17 2.42** -2.25** N.A. N.A. -2.84* -10.18* N.A. N.A. N.A. N.A. N.A. N.A. 2.80* -7.89* N.A. N.A. N.A. N.A.S-18 N.A. N.A. N.A. N.A. -2.15** -8.15* N.A. N.A. N.A. N.A. N.A. N.A. 2.56** -5.99* N.A. N.A. N.A. N.A.S-19 N.A. N.A. N.A. N.A. -6.85* -10.87* N.A. N.A. N.A. N.A. N.A. N.A. 1.16 -4.21* N.A. N.A. N.A. N.A.S-20 N.A. N.A. N.A. N.A. -4.87* -8.98* N.A. N.A. N.A. N.A. N.A. N.A. N.A. N.A. N.A. N.A. N.A. N.A.S-21 N.A. N.A. N.A. N.A. -1.76*** -6.11* N.A. N.A. N.A. N.A. N.A. N.A. N.A. N.A. N.A. N.A. N.A. N.A.S-22 N.A. N.A. N.A. N.A. N.A. N.A. N.A. N.A. N.A. N.A. N.A. N.A. N.A. N.A. N.A. N.A. N.A. N.A.S-23 N.A. N.A. N.A. N.A. N.A. N.A. N.A. N.A. N.A. N.A. N.A. N.A. N.A. N.A. N.A. N.A. N.A. N.A.S-24 N.A. N.A. N.A. N.A. N.A. N.A. N.A. N.A. N.A. N.A. N.A. N.A. N.A. N.A. N.A. N.A. N.A. N.A.S-25 N.A. N.A. N.A. N.A. N.A. N.A. N.A. N.A. N.A. N.A. N.A. N.A. N.A. N.A. N.A. N.A. N.A. N.A.
C 0.53 0.58 1.11 1.50 0.05 0.09 1.17 1.16 0.32 0.34 1.72*** 1.66*** 2.36** 2.07** 1.75*** 1.70*** -0.15 -0.14 Contd….

40
SYNDIBANK(12) TATACHEM(15) TATAMOTORS(11) TATAPOWER(15) TITAN(7) UNIONBANK(11) Symbol F S F S F S F S F S F S
F-1 -40.43* 86.15* -28.22* 39.37* -22.17* 81.27* -34.80* 75.21* -12.67* 60.91* -29.54* 91.97* F-2 -16.34* 59.88* -13.38* 20.79* -9.23* 52.68* -14.76* 42.87* -6.26* 38.70* -20.76* 51.09* F-3 -12.96* 42.84* -9.65* 16.97* -4.70* 35.12* -4.47* 30.57* -6.19* 23.08* -9.93* 41.02* F-4 -8.04* 30.42* -6.79* 10.69* -4.98* 21.85* -6.49* 18.28* -2.45** 17.43* -7.03* 31.91* F-5 -8.84* 21.58* -6.73* 7.47* -6.59* 13.52* -5.85* 11.31* 0.21 12.76* -6.15* 24.27* F-6 -8.19* 16.52* -3.07* 6.92* -5.04* 10.39* -3.49* 11.05* 2.63* 9.95* -4.32* 18.24* F-7 -5.97* 13.84* -5.19* 4.48* -3.55* 7.35* -2.93* 7.88* 3.25* 7.15* -4.87* 14.49* F-8 -6.76* 9.25* -2.04** 5.47* -2.14** 6.32* -1.73*** 6.25* N.A. N.A. -5.33* 12.10* F-9 -4.02* 7.83* -2.46** 5.76* -3.81* 2.02** -1.95*** 3.68* N.A. N.A. -6.58* 6.42* F-10 -5.20* 5.45* -0.42 4.96* -0.47 3.62* -0.90 2.96* N.A. N.A. -5.15* 3.09* F-11 -3.12* 4.53* -4.84* 3.21* -2.60* -0.21 0.75 2.11** N.A. N.A. -2.03** 3.29* F-12 -2.71* 2.47** -6.35* 0.14 N.A. N.A. 3.46* 2.50** N.A. N.A. N.A. N.A. F-13 N.A. N.A. -7.30* -1.90*** N.A. N.A. 1.90*** 2.24** N.A. N.A. N.A. N.A. F-14 N.A. N.A. -5.41* -3.47* N.A. N.A. -1.63 -2.06** N.A. N.A. N.A. N.A. F-15 N.A. N.A. -4.42* -0.63 N.A. N.A. 4.96* 0.04 N.A. N.A. N.A. N.A. F-16 N.A. N.A. N.A. N.A. N.A. N.A. N.A. N.A. N.A. N.A. N.A. N.A. F-17 N.A. N.A. N.A. N.A. N.A. N.A. N.A. N.A. N.A. N.A. N.A. N.A. F-18 N.A. N.A. N.A. N.A. N.A. N.A. N.A. N.A. N.A. N.A. N.A. N.A. F-19 N.A. N.A. N.A. N.A. N.A. N.A. N.A. N.A. N.A. N.A. N.A. N.A. F-20 N.A. N.A. N.A. N.A. N.A. N.A. N.A. N.A. N.A. N.A. N.A. N.A. F-21 N.A. N.A. N.A. N.A. N.A. N.A. N.A. N.A. N.A. N.A. N.A. N.A. F-22 N.A. N.A. N.A. N.A. N.A. N.A. N.A. N.A. N.A. N.A. N.A. N.A. F-23 N.A. N.A. N.A. N.A. N.A. N.A. N.A. N.A. N.A. N.A. N.A. N.A. F-24 N.A. N.A. N.A. N.A. N.A. N.A. N.A. N.A. N.A. N.A. N.A. N.A. F-25 N.A. N.A. N.A. N.A. N.A. N.A. N.A. N.A. N.A. N.A. N.A. N.A. S-1 21 .55* -96.01* 15.19* -47.66* 13.77* -95.54* 15.88* -88.42* 7.16* -67.94* 15.71* -11.21* S-2 17.62* -55.15* 12.96* -21.04* 11.64* -51.79* 11.87* -44.67* 9.32* -36.14* 20.99* -48.98* S-3 16.83* -35.72* 8.72* -14.52* 11.28* -30.71* 10.71* -25.65* 7.59* -20.89* 14.13* -36.55* S-4 11.87* -27.02* 8.54* -9.23* 10.54* -19.33* 12.05* -12.87* 3.40* -15.86* 9.35* -29.09* S-5 10.17* -20.00* 8.00* -4.49* 7.80* -14.35* 7.75* -9.45* 0.89 -11.48* 7.74* -22.85* S-6 9.68* -14.59* 4.29* -6.75* 5.54* -11.27* 5.50* -8.35* -1.44 -7.65* 5.76* -18.45* S-7 8.44* -11.03* 6.86* -5.79* 4.57* -7.97* 3.36* -6.55* -2.10** -6.51* 4.70* -13.21* S-8 5.34* -9.15* 2.80* -4.93* 3.80* -6.44* 1.65*** -5.20* N.A. N.A. 6.05* -9.56* S-9 4.40* -6.28* 1.08 -6.63* 1.41 -5.55* 0.28 -5.00* N.A. N.A. 4.30* -7.87* S-10 3.69* -6.80* 0.20 -4.91* -0.13 -4.72* -1.10 -3.40* N.A. N.A. 4.43* -3.63* S-11 2.25* -5.53* 5.73* -2.56** -0.18 -4.06* -1.77*** -3.16* N.A. N.A. 1.55 -1.75*** S-12 2.61* -2.43** 4.32* -1.68*** N.A. N.A. -3.57* -2.49** N.A. N.A. N.A. N.A. S-13 N.A. N.A. 6.97* -1.36 N.A. N.A. -2.34** -2.39** N.A. N.A. N.A. N.A. S-14 N.A. N.A. 5.50* -0.51 N.A. N.A. 1.03 -0.43 N.A. N.A. N.A. N.A. S-15 N.A. N.A. 4.67* -0.66 N.A. N.A. 0.50 -1.33 N.A. N.A. N.A. N.A. S-16 N.A. N.A. N.A. N.A. N.A. N.A. N.A. N.A. N.A. N.A. N.A. N.A. S-17 N.A. N.A. N.A. N.A. N.A. N.A. N.A. N.A. N.A. N.A. N.A. N.A. S-18 N.A. N.A. N.A. N.A. N.A. N.A. N.A. N.A. N.A. N.A. N.A. N.A. S-19 N.A. N.A. N.A. N.A. N.A. N.A. N.A. N.A. N.A. N.A. N.A. N.A. S-20 N.A. N.A. N.A. N.A. N.A. N.A. N.A. N.A. N.A. N.A. N.A. N.A. S-21 N.A. N.A. N.A. N.A. N.A. N.A. N.A. N.A. N.A. N.A. N.A. N.A. S-22 N.A. N.A. N.A. N.A. N.A. N.A. N.A. N.A. N.A. N.A. N.A. N.A. S-23 N.A. N.A. N.A. N.A. N.A. N.A. N.A. N.A. N.A. N.A. N.A. N.A. S-24 N.A. N.A. N.A. N.A. N.A. N.A. N.A. N.A. N.A. N.A. N.A. N.A. S-25 N.A. N.A. N.A. N.A. N.A. N.A. N.A. N.A. N.A. N.A. N.A. N.A.
C 0.86 0.88 0.59 0.79 0.62 0.62 1.67*** 1.81*** 1.45 1.62 0.82 0.84
N.A. Not Applicable, * Significant at 1% level of significance, ** Significant at 5% level of significance and *** Significant at 10% level of significance.
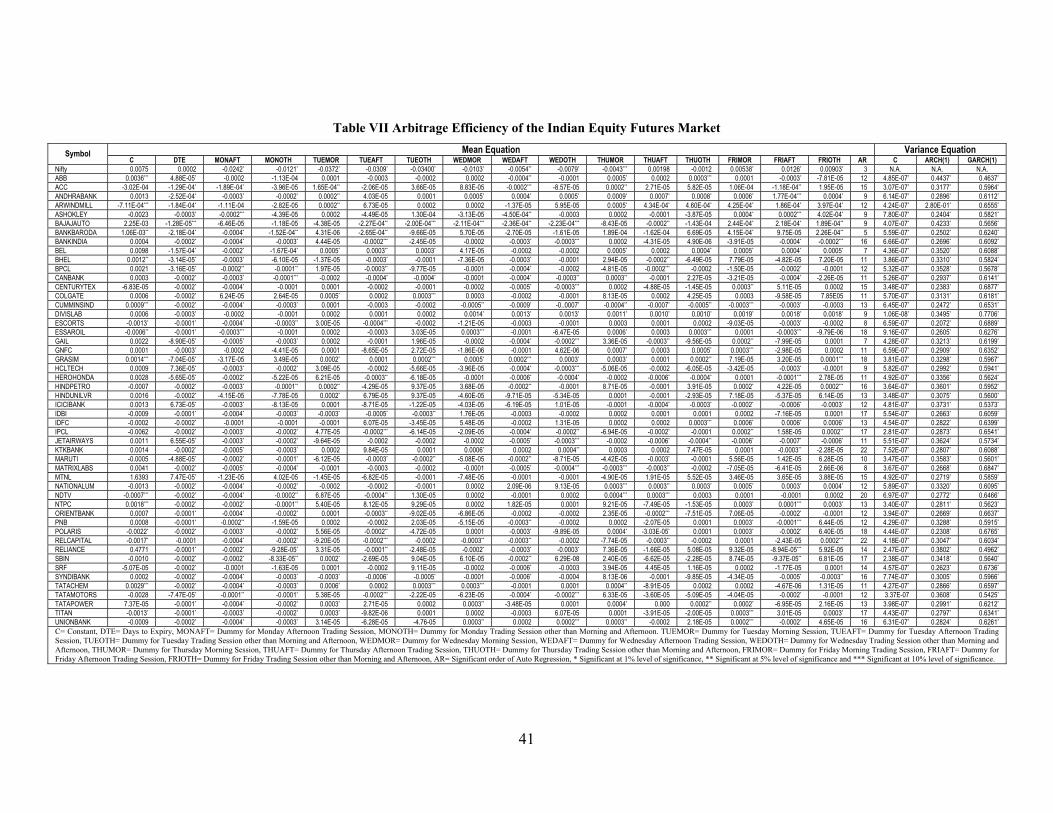
41
Table VII Arbitrage Efficiency of the Indian Equity Futures Market Mean Equation Variance Equation Symbol
C DTE MONAFT MONOTH TUEMOR TUEAFT TUEOTH WEDMOR WEDAFT WEDOTH THUMOR THUAFT THUOTH FRIMOR FRIAFT FRIOTH AR C ARCH(1) GARCH(1) Nifty 0.0075 0.0002 -0.0242* -0.0121* -0.0372* -0.0309* -0.03400* -0.0103* -0.0054** -0.0079* -0.0043*** 0.00198 -0.0012 0.00538* 0.0126* 0.00903* 3 N.A. N.A. N.A. ABB 0.0036*** 4.88E-05* -0.0002 -1.13E-04 0.0001 -0.0003 -0.0002 0.0002 -0.0004** -0.0001 0.0005* 0.0002 0.0003*** 0.0001 -0.0003* -7.81E-05 12 4.85E-07* 0.4437* 0.4637* ACC -3.02E-04 -1.29E-04* -1.89E-04* -3.96E-05 1.65E-04** -2.06E-05 3.66E-05 8.83E-05 -0.0002*** -8.57E-05 0.0002** 2.71E-05 5.82E-05 1.06E-04 -1.18E-04** 1.95E-05 15 3.07E-07* 0.3177* 0.5964* ANDHRABANK 0.0013 -2.52E-04* -0.0003* -0.0002* 0.0002** 4.03E-05 0.0001 0.0005* 0.0004* 0.0005* 0.0009* 0.0007* 0.0008* 0.0006* 1.77E-04*** 0.0004* 9 6.14E-07* 0.2896* 0.6112* ARWINDMILL -7.11E-04*** -1.84E-04* -1.11E-04 -2.82E-05 0.0002** 6.73E-05 0.0002 0.0002 -1.37E-05 5.95E-05 0.0005* 4.34E-04* 4.60E-04* 4.25E-04* 1.86E-04* 3.97E-04* 12 4.24E-07* 2.80E-01* 0.6555* ASHOKLEY -0.0023 -0.0003* -0.0002*** -4.39E-05 0.0002 -4.49E-05 1.30E-04 -3.13E-05 -4.50E-04** -0.0003 0.0002 -0.0001 -3.87E-05 0.0004* 0.0002*** 4.02E-04* 9 7.80E-07* 0.2404* 0.5821* BAJAJAUTO 2.25E-03 -1.28E-05*** -6.46E-05 -1.18E-05 -4.38E-05 -2.27E-04** -2.00E-04*** -2.11E-04*** -2.36E-04** -2.23E-04*** -8.43E-05 -0.0002** -1.43E-04 2.44E-04* 2.18E-04* 1.89E-04** 9 4.07E-07* 0.4233* 0.5656* BANKBARODA 1.06E-03** -2.18E-04* -0.0004* -1.52E-04** 4.31E-06 -2.65E-04** -9.66E-05 5.70E-05 -2.70E-05 -1.61E-05 1.89E-04 -1.62E-04 6.69E-05 4.15E-04* 9.75E-05 2.26E-04** 5 5.59E-07* 0.2502* 0.6240* BANKINDIA 0.0004 -0.0002* -0.0004* -0.0003* 4.44E-05 -0.0002*** -2.45E-05 -0.0002 -0.0003* -0.0003*** 0.0002 -4.31E-05 4.90E-06 -3.91E-05 -0.0004* -0.0002*** 16 6.66E-07* 0.2696* 0.6092* BEL 0.0098 -1.57E-04* -0.0002* -1.67E-04* 0.0005* 0.0003** 0.0003* 4.17E-05 -0.0002 -0.0002 0.0005* 0.0002 0.0004* 0.0005* 0.0004* 0.0005* 7 4.36E-07* 0.3520* 0.6088* BHEL 0.0012** -3.14E-05* -0.0003* -6.10E-05 -1.37E-05 -0.0003* -0.0001 -7.36E-05 -0.0003* -0.0001 2.94E-05 -0.0002** -6.49E-05 7.79E-05 -4.82E-05 7.20E-05 11 3.86E-07* 0.3310* 0.5824* BPCL 0.0021 -3.16E-05* -0.0002** -0.0001** 1.97E-05 -0.0003** -9.77E-05 -0.0001 -0.0004* -0.0002 -4.81E-05 -0.0002*** -0.0002 -1.50E-05 -0.0002* -0.0001 12 5.32E-07* 0.3528* 0.5678* CANBANK 0.0003 -0.0002* -0.0003* -0.0001*** -0.0002 -0.0004* -0.0004* -0.0001 -0.0004* -0.0003** 0.0003** -0.0001 2.27E-05 -3.21E-05 -0.0004* -2.26E-05 11 5.26E-07* 0.2937* 0.6141* CENTURYTEX -6.83E-05 -0.0002* -0.0004* -0.0001 0.0001 -0.0002 -0.0001 -0.0002 -0.0005* -0.0003*** 0.0002 -4.88E-05 -1.45E-05 0.0003** 5.11E-05 0.0002 15 3.48E-07* 0.2383* 0.6877* COLGATE 0.0006 -0.0002* 6.24E-05 2.64E-05 0.0005* 0.0002 0.0003*** 0.0003 -0.0002 -0.0001 8.13E-05 0.0002 4.25E-05 0.0003 -9.58E-05 7.85E05 11 5.70E-07* 0.3131* 0.6181* CUMMINSIND 0.0009*** -0.0002* -0.0004* -0.0003* 0.0001 -0.0003 -0.0002 -0.0005** -0.0009* -0..0007* -0.0004** -0.0007* -0.0005** -0.0003*** -0.0003* -0.0003 13 6.45E-07* 0.2472* 0.6531* DIVISLAB 0.0006 -0.0003* -0.0002 -0.0001 0.0002 0.0001 0.0002 0.0014* 0.0013* 0.0013* 0.0011* 0.0010* 0.0010* 0.0019* 0.0018* 0.0018* 9 1.06E-08* 0.3495* 0.7706* ESCORTS -0.0013* -0.0001* -0.0004* -0.0003** 3.00E-05 -0.0004*** -0.0002 -1.21E-05 -0.0003 -0.0001 0.0003 0.0001 0.0002 -9.03E-05 -0.0003* -0.0002 8 6.59E-07* 0.2072* 0.6889* ESSAROIL -0.0006** -0.0001* -0.0003*** -0.0001 0.0002 -0.0003 3.03E-05 0.0003*** -0.0001 -6.47E-05 0.0006* 0.0003 0.0003*** 0.0001 -0.0003*** -9.79E-06 18 9.16E-07* 0.2605* 0.6276* GAIL 0.0022 -8.90E-05* -0.0005* -0.0003* 0.0002 -0.0001 1.96E-05 -0.0002 -0.0004* -0.0002*** 3.36E-05 -0.0003** -9.56E-05 0.0002** -7.99E-05 0.0001 7 4.28E-07* 0.3213* 0.6199* GNFC 0.0001 -0.0003* -0.0002 -4.41E-05 0.0001 -8.65E-05 2.72E-05 -1.86E-06 -0.0001 4.62E-06 0.0007* 0.0003 0.0005* 0.0003*** -2.98E-05 0.0002 11 6.59E-07* 0.2909* 0.6352* GRASIM 0.0014*** -7.04E-05* -3.17E-05 3.49E-05 0.0002* 0.0001 0.0002*** 0.0005* 0.0002*** 0.0003* 0.0003* 0.0001 0.0002** 7.19E-05 3.20E-05 0.0001*** 18 3.81E-07* 0.3298* 0.5967* HCLTECH 0.0009 7.36E-05* -0.0003* -0.0002* 3.09E-05 -0.0002 -5.66E-05 -3.96E-05 -0.0004* -0.0003*** -5.06E-05 -0.0002 -6.05E-05 -3.42E-05 -0.0003* -0.0001 9 5.82E-07* 0.2992* 0.5941* HEROHONDA 0.0028 -5.65E-05* -0.0002* -5.22E-05 6.21E-05 -0.0003** -6.18E-05 -0.0001 -0.0006* -0.0004* -0.0002 -0.0006* -0.0004* 0.0001 -0.0001*** 2.78E-05 11 4.92E-07* 0.3356* 0.5624* HINDPETRO -0.0007 -0.0002* -0.0003* -0.0001** 0.0002** -4.29E-05 9.37E-05 3.68E-05 -0.0002** -0.0001 8.71E-05 -0.0001 3.91E-05 0.0002* 4.22E-05 0.0002*** 16 3.64E-07* 0.3601* 0.5952* HINDUNILVR 0.0016 -0.0002* -4.15E-05 -7.78E-05 0.0002* 6.79E-05 9.37E-05 -4.60E-05 -9.71E-05 -5.34E-05 0.0001 -0.0001 -2.93E-05 7.18E-05 -5.37E-05 6.14E-05 13 3.48E-07* 0.3075* 0.5600* ICICIBANK 0.0013 6.73E-05* -0.0003* -8.13E-05 0.0001 -8.71E-05 -1.22E-05 -4.03E-05 -6.19E-05 1.01E-05 -0.0001 -0.0004* -0.0003* -0.0002* -0.0006* -0.0003* 12 4.81E-07* 0.3731* 0.5373* IDBI -0.0009 -0.0001* -0.0004* -0.0003* -0.0003* -0.0005* -0.0003** 1.76E-05 -0.0003 -0.0002 0.0002 0.0001 0.0001 0.0002 -7.16E-05 0.0001 17 5.54E-07* 0.2663* 0.6059* IDFC -0.0002 -0.0002* -0.0001 -0.0001 -0.0001 6.07E-05 -3.45E-05 5.48E-05 -0.0002 1.31E-05 0.0002 0.0002 0.0003*** 0.0006* 0.0006* 0.0006* 13 4.54E-07* 0.2822* 0.6399* IPCL -0.0062 -0.0002* -0.0003* -0.0002* 4.77E-05 -0.0002*** -6.14E-05 -2.09E-05 -0.0004* -0.0002** -6.94E-05 -0.0002* -0.0001 0.0002** 1.58E-05 0.0002** 17 2.81E-07* 0.2873* 0.6541* JETAIRWAYS 0.0011 6.55E-05* -0.0003* -0.0002* -9.64E-05 -0.0002 -0.0002 -0.0002 -0.0005* -0.0003*** -0.0002 -0.0006* -0.0004** -0.0006* -0.0007* -0.0006* 11 5.51E-07* 0.3624* 0.5734* KTKBANK 0.0014 -0.0002* -0.0005* -0.0003* 0.0002 9.84E-05 0.0001 0.0006* 0.0002 0.0004** 0.0003 0.0002 7.47E-05 0.0001 -0.0003** -2.28E-05 22 7.52E-07* 0.2807* 0.6088* MARUTI -0.0005 -4.88E-05* -0.0002* -0.0001* -6.12E-05 -0.0003* -0.0002** -5.08E-05 -0.0002** -8.71E-05 -4.42E-05 -0.0003* -0.0001 5.56E-05 1.42E-05 6.28E-05 10 3.47E-07* 0.3583* 0.5601* MATRIXLABS 0.0041 -0.0002* -0.0005* -0.0004* -0.0001 -0.0003 -0.0002 -0.0001 -0.0005* -0.0004*** -0.0003*** -0.0003** -0.0002 -7.05E-05 -6.41E-05 2.66E-06 8 3.67E-07* 0.2668* 0.6847* MTNL 1.6393 7.47E-05* -1.23E-05 4.02E-05 -1.45E-05 -6.82E-05 -0.0001 -7.48E-05 -0.0001 -0.0001 -4.90E-05 1.91E-05 5.52E-05 3.46E-05 3.65E-05 3.88E-05 15 4.92E-07* 0.2719* 0.5859* NATIONALUM -0.0013 -0.0002* -0.0004* -0.0002* -0.0002 -0.0002 -0.0001 0.0002 2.09E-06 9.13E-05 0.0003*** 0.0003** 0.0003* 0.0005* 0.0003* 0.0004* 12 5.89E-07* 0.3320* 0.6095* NDTV -0.0007*** -0.0002* -0.0004* -0.0002** 6.87E-05 -0.0004** 1.30E-05 0.0002 -0.0001 0.0002 0.0004*** 0.0003*** 0.0003 0.0001 -0.0001 0.0002 20 6.97E-07* 0.2772* 0.6466* NTPC 0.0018*** -0.0002* -0.0002* -0.0001** 5.40E-05 8.12E-05 9.29E-05 0.0002 1.82E-05 0.0001 9.21E-05 -7.49E-05 -1.53E-05 0.0003* 0.0001*** 0.0003* 13 3.40E-07* 0.2811* 0.5623* ORIENTBANK 0.0007 -0.0001* -0.0004* -0.0002* 0.0001 -0.0003** -9.02E-05 -6.86E-05 -0.0002 -0.0002 2.35E-05 -0.0002*** -7.51E-05 7.06E-05 -0.0002* -0.0001 12 3.94E-07* 0.2669* 0.6637* PNB 0.0008 -0.0001* -0.0002** -1.59E-05 0.0002 -0.0002 2.03E-05 -5.15E-05 -0.0003** -0.0002 0.0002 -2.07E-05 0.0001 0.0003* -0.0001*** 6.44E-05 12 4.29E-07* 0.3288* 0.5915* POLARIS -0.0022* -0.0002* -0.0003* -0.0002* 5.56E-05 -0.0002** -4.72E-05 0.0001 -0.0003* -9.89E-05 0.0004* -3.03E-05* 0.0001 0.0003* -0.0002* 6.40E-05 18 4.44E-07* 0.2308* 0.6765* RELCAPITAL -0.0017* -0.0001 -0.0004* -0.0002* -9.20E-05 -0.0002*** -0.0002 -0.0003** -0.0003** -0.0002 -7.74E-05 -0.0003** -0.0002 0.0001 -2.43E-05 0.0002*** 22 4.18E-07* 0.3047* 0.6034* RELIANCE 0.4771 -0.0001* -0.0002* -9.28E-05* 3.31E-05 -0.0001** -2.48E-05 -0.0002* -0.0003* -0.0003* 7.36E-05 -1.66E-05 5.08E-05 9.32E-05 -8.94E-05*** 5.92E-05 14 2.47E-07* 0.3802* 0.4962* SBIN -0.0010 -0.0002* -0.0002* -8.33E-05** 0.0002* -2.69E-05 9.04E-05 6.10E-05 -0.0002** 6.29E-08 2.40E-05 -6.62E-05 -2.28E-05 8.74E-05 -9.37E-05** 6.81E-05 17 2.38E-07* 0.3418* 0.5640* SRF -5.07E-05 -0.0002* -0.0001 -1.63E-05 0.0001 -0.0002 9.11E-05 -0.0002 -0.0006* -0.0003 3.94E-05 4.45E-05 1.16E-05 0.0002 -1.77E-05 0.0001 14 4.57E-07* 0.2623* 0.6736* SYNDIBANK 0.0002 -0.0002* -0.0004* -0.0003* -0.0003* -0.0006* -0.0005* -0.0001 -0.0006* -0.0004 8.13E-06 -0.0001 -9.85E-05 -4.34E-05 -0.0005* -0.0003** 16 7.74E-07* 0.3005* 0.5966* TATACHEM 0.0029*** -0.0002* -0.0004* -0.0003* 0.0006* 0.0002 0.0003*** 0.0003*** -0.0001 0.0001 0.0004** -8.91E-05 0.0002 0.0002 -4.67E-06 1.31E-05 11 4.27E-07* 0.2866* 0.6597* TATAMOTORS -0.0028 -7.47E-05* -0.0001** -0.0001* 5.38E-05 -0.0002*** -2.22E-05 -6.23E-05 -0.0004* -0.0002*** 6.33E-05 -3.60E-05 -5.09E-05 -4.04E-05 -0.0002* -0.0001 12 3.37E-07 0.3608* 0.5425* TATAPOWER 7.37E-05 -0.0001* -0.0004* -0.0002* 0.0003* 2.71E-05 0.0002 0.0003** -3.48E-05 0.0001 0.0004* 0.000 0.0002** 0.0002* -6.95E-05 2.16E-05 13 3.98E-07* 0.2991* 0.6212* TITAN -0.0013* -0.0001* -0.0003* -0.0002* 0.0003* -9.82E-06 0.0001 0.0002 -0.0003 6.07E-05 0.0001 -3.91E-05 -2.00E-05 0.0003*** 3.01E-05 0.0003* 17 4.43E-07* 0.2797* 0.6341* UNIONBANK -0.0009 -0.0002* -0.0004* -0.0003* 3.14E-05 -6.28E-05 -4.76-05 0.0003** 0.0002 0.0002*** 0.0003** -0.0002 2.18E-05 0.0002*** -0.0002* 4.65E-05 16 6.31E-07* 0.2824* 0.6261* C= Constant, DTE= Days to Expiry, MONAFT= Dummy for Monday Afternoon Trading Session, MONOTH= Dummy for Monday Trading Session other than Morning and Afternoon. TUEMOR= Dummy for Tuesday Morning Session, TUEAFT= Dummy for Tuesday Afternoon Trading Session, TUEOTH= Dummy for Tuesday Trading Session other than Morning and Afternoon, WEDMOR= Dummy for Wednesday Morning Session, WEDAFT= Dummy for Wednesday Afternoon Trading Session, WEDOTH= Dummy for Wednesday Trading Session other than Morning and Afternoon, THUMOR= Dummy for Thursday Morning Session, THUAFT= Dummy for Thursday Afternoon Trading Session, THUOTH= Dummy for Thursday Trading Session other than Morning and Afternoon, FRIMOR= Dummy for Friday Morning Trading Session, FRIAFT= Dummy for Friday Afternoon Trading Session, FRIOTH= Dummy for Friday Trading Session other than Morning and Afternoon, AR= Significant order of Auto Regression, * Significant at 1% level of significance, ** Significant at 5% level of significance and *** Significant at 10% level of significance.
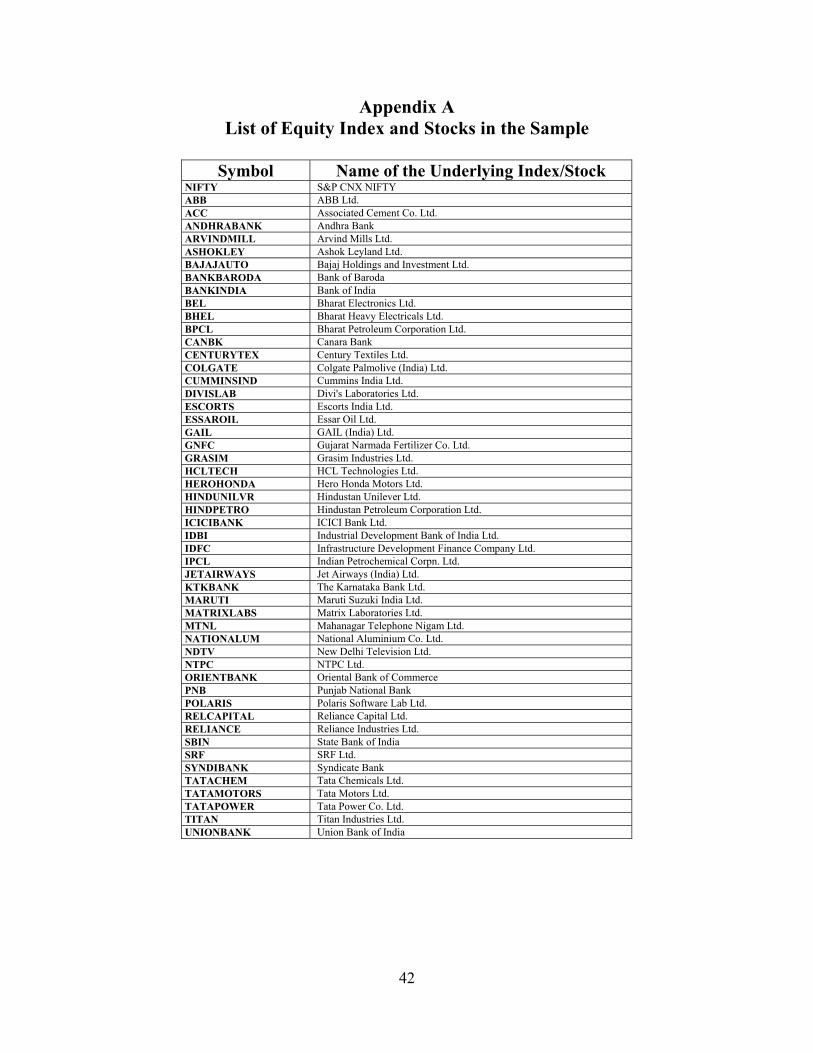
42
Appendix A List of Equity Index and Stocks in the Sample
Symbol Name of the Underlying Index/Stock
NIFTY S&P CNX NIFTY ABB ABB Ltd. ACC Associated Cement Co. Ltd. ANDHRABANK Andhra Bank ARVINDMILL Arvind Mills Ltd. ASHOKLEY Ashok Leyland Ltd. BAJAJAUTO Bajaj Holdings and Investment Ltd. BANKBARODA Bank of Baroda BANKINDIA Bank of India BEL Bharat Electronics Ltd. BHEL Bharat Heavy Electricals Ltd. BPCL Bharat Petroleum Corporation Ltd. CANBK Canara Bank CENTURYTEX Century Textiles Ltd. COLGATE Colgate Palmolive (India) Ltd. CUMMINSIND Cummins India Ltd. DIVISLAB Divi's Laboratories Ltd. ESCORTS Escorts India Ltd. ESSAROIL Essar Oil Ltd. GAIL GAIL (India) Ltd. GNFC Gujarat Narmada Fertilizer Co. Ltd. GRASIM Grasim Industries Ltd. HCLTECH HCL Technologies Ltd. HEROHONDA Hero Honda Motors Ltd. HINDUNILVR Hindustan Unilever Ltd. HINDPETRO Hindustan Petroleum Corporation Ltd. ICICIBANK ICICI Bank Ltd. IDBI Industrial Development Bank of India Ltd. IDFC Infrastructure Development Finance Company Ltd. IPCL Indian Petrochemical Corpn. Ltd. JETAIRWAYS Jet Airways (India) Ltd. KTKBANK The Karnataka Bank Ltd. MARUTI Maruti Suzuki India Ltd. MATRIXLABS Matrix Laboratories Ltd. MTNL Mahanagar Telephone Nigam Ltd. NATIONALUM National Aluminium Co. Ltd. NDTV New Delhi Television Ltd. NTPC NTPC Ltd. ORIENTBANK Oriental Bank of Commerce PNB Punjab National Bank POLARIS Polaris Software Lab Ltd. RELCAPITAL Reliance Capital Ltd. RELIANCE Reliance Industries Ltd. SBIN State Bank of India SRF SRF Ltd. SYNDIBANK Syndicate Bank TATACHEM Tata Chemicals Ltd. TATAMOTORS Tata Motors Ltd. TATAPOWER Tata Power Co. Ltd. TITAN Titan Industries Ltd. UNIONBANK Union Bank of India