prevalence,care-seeking neonatal behaviorsandtreatmentcost
TRANSCRIPT

Prevalence, care-seekingbehaviors and treatment costfor neonatal morbidities in
Karnataka (India)Javeed A. Golandaj, Mallikarjun S. Kampli and Jyoti S. Hallad
Population Research Centre, Dharwad, India
AbstractPurpose – Around three million infants die within the first fourweeks of life each year – nearly all (98%) ofthese deaths occur in developing countries. Approximately one million newborns die each year in India.Therefore, this study aims to determine the patterns of reported neonatal morbidity and care-seekingbehavior and identify factors associated with it.
Design/methodology/approach – A cross-sectional study was conducted during November 2016. Asystematic random sampling technique was used to select the sample. Statistical techniques like BinaryLogistic regression and chi-square test were used.
Findings – The results of the study showed that around 31% mothers of neonates reported that theirneonates suffered from some kind of morbidity. Fever, jaundice, cough and cold, the low birth-weight anddifficulty in breathing were the most common dangers signs reported. Birth order and mother’sknowledge of neonatal danger signs were found to be significantly associated with reporting of neonatalmorbidity. In all 95% of the mothers sought care for their newborns. Among those who had problems,59% consulted private hospitals/clinics, 30% visited District Hospital/Taluka Hospital or higher facilitiesand another 9% to Primary Health Centers/Community Health Centers. Further, findings show that nearlyhalf of the neonates taken to government facilities have got free treatment, whereas an average cost of7,156 INR were recorded for treatment, 935 INR for outpatient department and 13,774 INR for inpatientdepartment cases.
Originality/value – There is an urgent need to implement intervention modalities that focus on increasingthe level of parental education and access to treatment, and advocating the message regarding newborndanger signs during pregnancy is pinpointed.
Keywords India, Illness, Karnataka, Care seeking, Neonatal morbidity
Paper type Research paper
© Javeed A. Golandaj, Mallikarjun S. Kampli and Jyoti S. Hallad Published in Journal of Humanitiesand Applied Social Sciences. Published by Emerald Publishing Limited. This article is publishedunder the Creative Commons Attribution (CC BY 4.0) licence. Anyone may reproduce, distribute,translate and create derivative works of this article (for both commercial and non-commercialpurposes), subject to full attribution to the original publication and authors. The full terms of thislicence may be seen at http://creativecommons.org/licences/by/4.0/legalcode
The present study was carried out using the grant *provided by the MoHFW, Government ofIndia under the annual work plan budget of Population Research Centre (PRC), Dharwad. Authorsacknowledge the financial assistance and technical guidance provide by the MoHFW. The viewsexpressed in this article are those of the authors and do not necessarily reflect the official policy ofMoHFW and PRC.
Neonatalmorbidities in
Karnataka
115
Received 4 July 2019Revised 30 August 2019
Accepted 4 September 2019
Journal of Humanities and AppliedSocial Sciences
Vol. 1 No. 2, 2019pp. 115-131
EmeraldPublishingLimited2632-279X
DOI 10.1108/JHASS-07-2019-0007
The current issue and full text archive of this journal is available on Emerald Insight at:www.emeraldinsight.com/2632-279X.htm

IntroductionNeonatal and infant mortality pose a major public health challenge, especially in thedeveloping world, and progress in the reduction in neonatal mortality over the pastyears has been slow (You et al., 2015). According to the World Health Organization(hereafter WHO) in the year of 2015 around 5.4 million children aged under five yearsdied globally (WHO, 2016; WHO, 2018). Nearly half of all deaths in children under-fiveoccur in the neonatal period, within the first four weeks of life (WHO, 2016; WHO,2018). Hence, 2.7 million infants die within first four weeks of life each year (You et al.,2015) and nearly all (98 per cent) of these deaths occur in developing countries (Lawnet al., 2005; Dadhich and Paul, 2004). India contributes approximately 25 per cent ofall neonatal deaths in the world (Lawn et al., 2005). Although there are no reliableestimates, approximately one million newborns die each year in India. The sluggishdecline of infant mortality rates in the past decade in developing countries in generaland India in particular could be largely attributed to stagnation in neonatal mortality;deaths in the newborn period now contribute to two-thirds of all deaths under fiveyears (Dadhich and Paul, 2004). It is argued that further decline in infant mortalitywould require effective implementation of interventions to lower neonatal mortality(Lawn et al., 2005; Dadhich and Paul, 2004).
Infectious diseases such as sepsis, pneumonia, tetanus and diarrhea; preterm birthand complications of birth asphyxia are responsible for most deaths in this period(WHO, 2016; WHO, 2018). Prematurity and intra-uterine growth restrictions are alsoindirect causes or risk factors for neonatal deaths, especially those because ofinfection (Lawn et al., 2005). Most of these diseases are readily preventable ortreatable with proven, cost-effective and quality-delivered interventions. It ispostulated that delayed or inappropriate care seeking behavior contributessignificantly to the high neonatal mortality levels in the developing countriesincluding India (Lawn et al., 2005).
Integrated Management of Neonatal and Childhood Illnesses (IMNCI) also envisionsthat family and community health practices, especially health-seeking behavior, are tobe improved to reduce morbidity and mortality in the early years of age (WHO andMOHFW, 2003; Ingle and Malhotra, 2007; Black et al., 2003). But documented literaturepresent a picture of poor health-seeking; in the state of Maharashtra (India), forexample, less than 5 per cent of newborns suffering from a major illness were taken to acare provider outside the home for medical care (Bang et al., 2001). Even, thoughimproved a lot in the last two decade, recent round of National Family Health Survey(NFHS-4) says that in Karnataka only around 76.9 per cent children suffering fromacute respiratory infection and 69.7 per cent children suffering from Diarrhea weretaken to a health facility or provider (IIPS, 2016)
Health-seeking behavior is a function not only of the availability of health facilities andother sources of health care but also the motivation and ability of individuals to seekmedical treatment (Teerawichitchainan and Phillips, 2007). In this background, the presentstudy is intended to determine the patterns of reported neonatal morbidity and care-seekingbehavior and to identify factors associated with it in Karnataka, India.
Methods and materialsEthical considerationCommunication with the District Medical Officer (DHO) and Taluka Medical Officer(THO) was made through formal letter mentioning Ministry of Health and FamilyWelfare (MoHFW), Government of India’s approval to take up the study. Having
JHASS1,2
116
finished informing the purpose and objective of the study, the researchers obtainedoral consent from the study participants with an age greater than 18 years.Participants were informed that their participation was purely on a voluntary base,and the information obtained from them will be kept confidential and will be usedonly for the research purpose.
Study area and sample sizeA multi-stage sampling process was adopted to recruit sample from the sub-district.Bidar district[1] of Karnataka[2] state was selected on the bases of maternaland obstetric indicators, and two talukas[3], namely Basavakalyan and Homanabad,were selected purposively among others. Further, five Primary Health Centers(hereafter PHCs) from each block were selected randomly and from each PHC twovillages[4] were covered; one headquarters village and one big village in terms ofpopulation criteria were adopted, so that a sufficient number of recently deliveredwomen (hereafter RDW) can be obtained. Hence, total 20 villages from 10 PHCs werecovered.
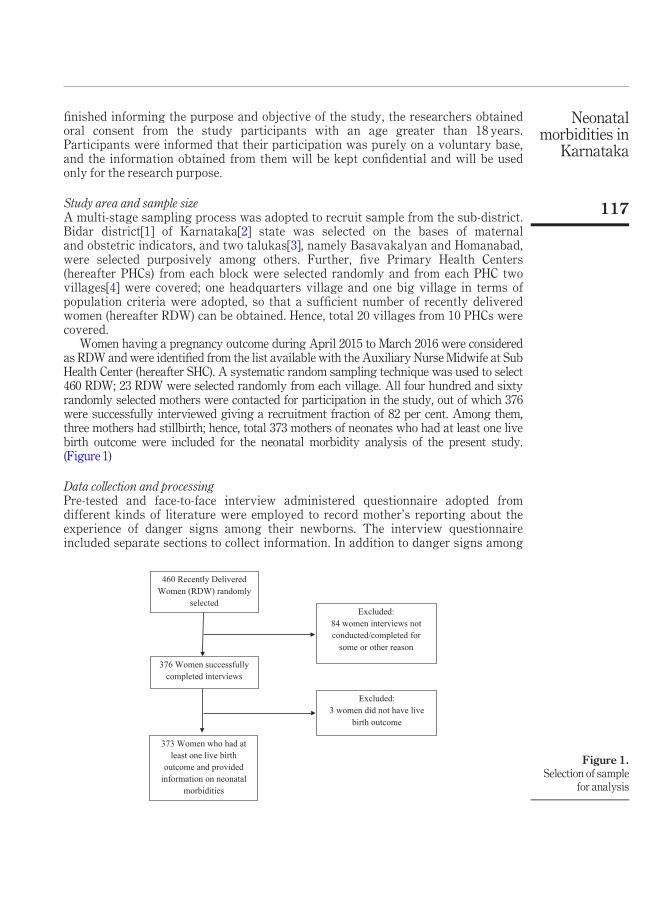
Women having a pregnancy outcome during April 2015 to March 2016 were consideredas RDW and were identified from the list available with the Auxiliary Nurse Midwife at SubHealth Center (hereafter SHC). A systematic random sampling technique was used to select460 RDW; 23 RDW were selected randomly from each village. All four hundred and sixtyrandomly selected mothers were contacted for participation in the study, out of which 376were successfully interviewed giving a recruitment fraction of 82 per cent. Among them,three mothers had stillbirth; hence, total 373 mothers of neonates who had at least one livebirth outcome were included for the neonatal morbidity analysis of the present study.(Figure 1)
Data collection and processingPre-tested and face-to-face interview administered questionnaire adopted fromdifferent kinds of literature were employed to record mother’s reporting about theexperience of danger signs among their newborns. The interview questionnaireincluded separate sections to collect information. In addition to danger signs among
Figure 1.Selection of sample
for analysis
460 Recently Delivered
Women (RDW) randomly
selected
376 Women successfully
completed interviews
373 Women who had at
least one live birth
outcome and provided
information on neonatal
morbidities
Excluded:
84 women interviews not
conducted/completed for
some or other reason
Excluded:
3 women did not have live
birth outcome
Neonatalmorbidities in
Karnataka
117
their newborns, socio-demographic, economic and obstetric related information werecollected. Seven trained professionals with vast experience in survey research anddata collection were conducted the structured interviews, and data was collectedduring November 14-23, 2016.
Completeness and consistency of the data were checked, cleaned and doubleentered using The Census and Survey Processing System (CSPro) software version5.0 and analyzed by Statistical Package for Social Sciences (SPSS) software version 20(IBM Corp, 2011). Frequencies, proportions and summary statistics were used todescribe the study population in relation to relevant variables and presented by usingtables and graphs.
Outcome variableThe variables used in this study were broadly categorized into outcome variable andpredictor variables. The outcome variable includes any neonatal danger signprevalence. Danger signs are symptoms that complicate the lives of the neonate andhappen during the neonatal period, the first 28 days of life. Prompted responses to thetotal number of 19 neonatal danger signs were recorded and a minimum score of “0”and maximum of “19” was used to measure the experience of neonatal danger signs.Further, two categories were developed for neonatal morbidity, mothers who reportedtheir neonates had at least one danger sign were categorized as “Yes = 1” otherwise“No = 0”.
Predictor variablesThe demographic and socio-economic variables, such as mother’s age, mother’seducation, father’s education, religion, caste, sex of the neonate, birth order of theneonate, number of birth the mother had, knowledge of neonatal danger signs havebeen used as predictor variables. In this analysis, the predictor variables werecategorized as follows:
� Mother’s age:<25 years, 25-29 years and 30 and above years.� Mother’s education: No schooling, 1-9 years and 10 and above years.� Father’s education: No schooling, 1-9 years and 10 and above years.� Religion: Hindu, Muslim, and Christian.� Caste[5]: Scheduled Castes (SCs), Scheduled Tribes (STs), Other Backward Classes
(OBCs), and General.� Sex of the child: Boy, and Girl.� Birth order of neonate: First, Second, and 3 or more.� Number of children: 2 or less children, and>2 children.� Knowledge of danger signs: None, and At least 1.� Household having BPL card: BPL, and APL.� Place of treatment: DH/TH and other higher facilities, PHC/CHC, and Private
hospital/clinics.
Analytical approachTo assess the determinants of reported neonatal morbidity, first, bivariate analyseswere used to examine the nature of association between neonatal morbidity and
JHASS1,2
118

selected socio economic and demographic characteristics using chi-square test ofsignificance. Second, to examine which factors best explain and predict reporting ofany neonatal morbidity among recently born neonates, binary logistic regressionmodel was fitted.
For all the statistical tests, p-values of <0.001, <0.01 and <0.05 were considered forstatistical significance and odds ratio (hereafter OR) with 95 per cent confidence interval(hereafter CI) was used to identify significant factors. Model fitness test was conducted withHosmer and Lemeshow goodness of fit test.
ResultsProfile of the study populationTable I depicts the percentage distribution of the neonates (0-28 days) born from April 2015to March 2016 in the study area. Results, as expected, show that the highest proportion ofthe neonates (around 53 per cent) included in the study were born to the women who wereless than 25 years of age and 37 per cent of the neonates were born to the women in the agegroup 25-29 years, whereas rest of the neonates (11 per cent) were born to 30 and above yearold women. Distribution of neonates, by their mother’s attainment of education, shows thatevery fourth neonate was born to the mother who has no schooling or completed less thanfive years of schooling, and one-fourth of the neonates were born to the mothers who havefive to eight years of schooling. Whereas, another one-third and one-fifth of neonates wereborn to mothers who have completed 9-10 years and more than 10 years of schoolingrespectively.
Around, 79 per cent of neonates included in the study were born to Hindu motherscompared to Muslim[6] (18 per cent) and Christian (2 per cent) mothers. Similarly,majority (42 per cent) of covered neonates were born to mothers belonged to ScheduledCastes (hereafter SCs)/Scheduled Tribes (hereafter STs), whereas, 35 per cent ofneonates were born to mothers belonged to Other Backward Castes (hereafter OBCs),and remaining (23 per cent) neonates were born to higher caste mothers. The proportionof male child (55.8 per cent) is more than the female child (44.2 per cent). Further, theproportion of neonates by their birth order reveals that little less than two-thirds of theneonates were of first or second birth order compared to higher birth orders. Seventy-one per cent of the neonates belong to below poverty line (hereafter BPL) families andthe remaining 29 per cent born in above poverty line (hereafter APL) families.Approximately, little more than two third of neonates were born to the mothers whomentioned at least one key danger sign during neonatal (0-28 days) compared to theircounterpart (Table I).
Prevalence of reported neonatal morbidityFigures 2 and 3 depicts the distribution of neonates included in the analysis had problem ornot. Mothers reported the experience of any danger signs in their recently deliverednewborns were considered as had problem. Among the total 373 neonatal included in theanalysis, nearly one-third (31 per cent) of the neonates were reported to have a morbidcondition (Figure 2).
Further, the result shows that of all mothers who have experienced these signs intheir recent delivered newborns, Fever (14.4 per cent) was the most common reportedmorbidity, followed by Jaundice (7.8 per cent). Six per cent had cough andcold, similarly, low birth weight/Premature (5.6 per cent), breathing difficulty(4.3 per cent) were the most frequent perceived danger signs experienced by mothers(Figure 3).
Neonatalmorbidities in
Karnataka
119

Differentials in neonatal morbidityPrevalence (per 100) of reported neonatal (0-28) morbidity in the study population accordingto background characteristics is presented in Table II. Information on danger signs thatmothers have real experience in their recently delivered newborns was collected in the
Table I.Percentagedistribution of studypopulation accordingto the sex of theneonatal (0-28 days)by backgroundcharacteristics
Per cent of the study populationBackground characteristics Boys Girls Total N
Mother’s Age<25 Years 52.4 52.7 52.5 19625-29 Years 37.5 35.8 36.7 13730 and above 10.1 11.5 10.7 40
Mother’s EducationNo Schooling 20.2 19.4 19.8 741-9 Years 32.2 44.2 37.5 14010 and above Years 47.6 36.4 42.6 159
Father’s EducationNo Schooling 21.6 22.4 22.0 821-9 Years 32.2 30.3 31.4 11710 and above Years 44.7 43.6 44.2 165
ReligionHindu 79.8 78.8 79.4 296Muslim 18.3 18.2 18.2 68Christian 1.9 3.0 2.4 9
CasteSCs 17.8 24.2 20.6 77STs 21.2 21.2 21.2 79OBCs 36.5 33.3 35.1 131General 24.5 21.2 23.1 86
Sex of the childBoy NA NA 55.8 208Girl NA NA 44.2 165
Birth orderFirst 27.9 29.7 28.7 107Second 36.5 37.6 37.0 1383 or more 35.6 32.7 34.3 128
Number of children2 or less 63.9 66.7 65.1 243More than 2 36.1 33.3 34.9 130
Household having BPL cardBPL 71.2 71.5 71.3 266APL 28.8 28.5 28.7 107
Knowledge of danger signsNone 28.8 36.4 32.2 120At least 1 71.2 63.6 67.8 253Total 100.0 100.0 100.0 373
Notes: N = Number of cases; SCs = scheduled castes; STs = scheduled tribes; OBCs = other backwardclasses; NA = not applicable; BPL = below poverty line; APL = above poverty line
JHASS1,2
120

study, and mothers who mentioned the experience of at least one danger sign is taken assuffering from morbidity. Expectedly, the neonates born to mothers in the early ages sayage group of less than 25 years (38 per cent) and later ages, say 30 and above (30 per cent)were more common than the women in age group 25-29 years (22 per cent), and it isstatistically significant. Educational attainment of mothers is showing that as the years ofschooling increases the reporting of experienced danger signs were also increasing, more orless similar pattern was reported in case of father’s educational attainment, but these are notsignificant.
Reported experience of neonatal danger signs by social and religious communityreveals that lower percentage of Muslim mothers reported the experience of any
Figure 3.Patterns of reported
neonatal morbidity inthe study population
(n=373)
13.4
7.86.4
5.64.3
2.4 2.4 2.11.3 1.3 1.3 1.1
9.9
0
2
4
6
8
10
12
14
16
Prev
alen
ce p
er 1
00 n
eona
tes
Note: Multiple responses were accepted; other
category includes omitting, swallowing of dirty
water, convulsion, loss of weight, oral ulcer and
redness and pus along with cord
Figure 2.Percentage
distribution ofneonates with
reportedmorbidity(n=373)
Had problem
31%
No problem
69%
Note: Prompted responses to the total number of 19 neonatal
danger signs were recorded and mothers who reported their
neonates had at least one danger sign were categorized as ‘Had
problem’ otherwise ‘No problem’
Neonatalmorbidities in
Karnataka
121

Table II.Prevalence (per 100)of reported neonatal(0-28 days) morbidityin the studypopulation bybackgroundcharacteristics(n=373)
Experience at least 1 neonatal morbidityBackground characteristics Yes, n (%) p-values^ N
Mother’s Age<25 Years 75 (38.3) 0.006 19625-29 Years 30 (21.9) 13730 and above 12 (30.0) 40
Mother’s EducationNo Schooling 19 (25.7) 0.447 741-9 Years 44 (31.4) 14010 and above Years 54 (34.0) 159
Father’s EducationNo Schooling 21 (25.6) 0.179 821-9 Years 34 (29.1) 11710 and above Years 60 (36.4) 165
ReligionHindu 95 (32.1) 0.462 296Muslim 18 (26.5) 68Christian 4 (44.4) 9
CasteSCs 27 (35.1) 0.358 77STs 22 (27.8) 79OBCs 36 (27.5) 131General 32 (37.2) 86
Sex of the childBoy 72 (34.6) 0.129 208Girl 45 (27.3) 165
Birth orderFirst 48 (44.9) 0.002 107Second 40 (29.0) 2263 or more 29 (22.7) 40
Number of children2 or less 87 (35.8) 0.012 243More than 2 30 (23.1) 130
Household having BPL cardBPL 84 (31.6) 0.890 266APL 33 (30.8) 107
Knowledge of danger signsNone 24 (20.0) 0.001 120At least 1 93 (36.8) 253
Notes: Prompted responses to the total number of 19 neonatal danger signs were recorded and motherswho reported their neonates had at least one danger sign were categorized as ‘Yes’ otherwise ‘No’; N =Number of cases; SCs = scheduled castes; STs = scheduled tribes; OBCs = other backward classes; BPL =below poverty line; APL = above poverty line; ^ = p-value represents the significance level estimated fromx 2 test
JHASS1,2
122

morbidity (27 per cent) compared to Christian (44 per cent) and Hindu (32 per cent)mothers. Similarly, mothers belonged to ST and OBC communities reportedany morbidity was 28 per cent and 27 per cent respectively, whereas, a higherpercentage of mothers reported any morbidity belonged to general (37 per cent) andSC (35 per cent) groups. Prevalence of neonatal danger signs by biological variablesshows that newborn danger signs were more common among male child (35 per cent)than among female child (27 per cent). Birth order of the neonate is significantlyevident in reporting any danger signs, as birth order increases the proportion ofmothers reporting neonate’s morbidity decreases. Neonates of the first order of birthwere more common to experience morbidity (45 per cent), followed by second-orderbirth (29 per cent) and third or higher (23 per cent) birth order. Mother who hadknowledge of at least one neonatal danger sign was more common to report neonatesexperience morbidity than their counterpart and it is statistically significant(Table II).
Determinants of neonatal morbidityTable III presents the results of the binary logistic regression model estimated toexamine the association between selected maternal, socioeconomic and demographicpredictors on reporting of any neonatal morbidity condition. Results reiterate thatmother’s age is negatively associated with the neonatal morbidity.
Women of age 25-29 years (odds ratio [OR] = 0.930, 95 per cent confidence interval[CI] = [0.351, 1.130]) were less likely to report any neonatal morbidity conditioncompared with women in the age group of less than 25 years. The odds of mothersreporting any neonatal morbidity are increasing for the neonates whose mother’syears of schooling increases and it is true in case of the father’s educationalattainment. Mothers of the female child were less likely to report any morbiditycompared with their counterparts (OR = 0.669, 95 per cent CI = [0.415, 1.076]). Theodds of neonatal morbidity are decreasing in higher birth order. The knowledge ofneonatal danger signs is positively and strongly associated with reporting anyneonatal morbidity, mother who had knowledge of at least one danger signs weremore likely to report any morbidity (OR = 2.394, 95 per cent CI = [1.362, 4.209])compared to their counterpart (Table III).
Care-seeking behaviorFigure 4 depicts the distribution of neonates for whom medical care was soughtfor danger signs. Among the total studied neonates, 117 mothers of the neonatesreported had a problem, of them 95 per cent (111) sought care for their neonates(Figure 4).
Types of health facilities usedAmong those who had problems, majority mothers of neonates (59 per cent) consultedprivate hospitals/clinics and two per cent took treatment at home. About 30 per cent went tothe higher-level government health facilities, such as District Hospitals (hereafter DHs),Taluka Hospitals (hereafter THs) and other higher-level government hospitals. Only 9 percent visited the lower level government health facilities, such as PHCs and CommunityHealth Centers (hereafter CHCs) (Figure 5), and only 5 per cent have not sought treatment(Figure 4).
Neonatalmorbidities in
Karnataka
123

Types of health facilities used by sex of neonatesFurther, simple cross-tabulation of the type of health facilities used for treatment bysex of the neonates shows that Care sought from the higher level government healthfacilities was found to be 9 per cent greater for the male neonates than their female
Table III.Factors associatedwith reportedneonatal morbidity inthe study populationby backgroundcharacteristics(n=364)
95% CI for Exp(B)Background characteristics OR p-values Lower Upper
Mother’s Age<25 Years 125-29 Years 0.631 0.120 0.353 1.12830 and above 0.951 0.911 0.395 2.289
Mother’s EducationNo Schooling 11-9 Years 1.247 0.555 0.599 2.59510 and above Years 0.996 0.993 0.446 2.227
Father’s EducationNo Schooling 11-9 Years 0.870 0.713 0.414 1.82710 and above Years 1.231 0.591 0.577 2.627
ReligionHindu 1Muslim 0.984 0.964 0.487 1.988Christian 2.516 0.230 0.558 11.347
CasteSC 1ST 0.647 0.251 0.307 1.361OBC 0.644 0.226 0.316 1.314General 1.084 0.827 0.525 2.237
Sex of the childBoy 1Girl 0.682 0.120 0.422 1.105
Birth orderFirst 1Second 0.548 0.047 0.302 0.9933 or more 0.519 0.279 0.158 1.700
Number of children2 or less 1More than 2 0.699 0.283 0.364 1.344
Knowledge of danger signsNone 1At least 1 2.336 0.003 1.362 4.209Constant 0.641Hosmer and Lemeshow Test x2 11.111�2 log likelihood 416.078
Notes: OR = Odds ratio; CI = confidence interval; SCs = scheduled astes; STs = scheduled tribes; OBCs =other backward classes
JHASS1,2
124

counterparts. Whereas, neonates visited the private hospitals/clinics were found to be11 per cent greater for female neonates. Such difference was not found among maleand female neonates who sought treatment from a lower level of health facilities(Figure 6).
Cost of treatment by providersAs shown in Table IV, many of the neonate cases going to DH/TH and other higher facilities(42 per cent) and PHCs/CHCs (38 per cent) received free treatment, and some other spent
Figure 5.Types of health
facilities used for thetreatment of neonatal
(0-28 days)morbidities (n=111)
DH/TH &
higher facility
30%
PHC/CHC
9%
Private
hospitals/clinic
s
59%
Others
2%
Notes: Percentages sought medical care by type of health provider
has been calculated only among those neonate cases who had
reported at least one problem and took to health providers; DH =
District Hospital; TH = Taluka Hospital; PHC=Primary Health
Centres; CHC = Community Health Centres
Figure 4.Percentage of ill
neonates to whommedical care wassought (n=117)
Sought care
95%
Did not seek
care
5%
Note: Percentages sought medical care has been calculated only
among those neonate cases who had reported at least one problem
Neonatalmorbidities in
Karnataka
125

very nominal amount. Whereas, even though free treatment is available in governmenthealth facilities, some of the neonate cases spent a big amount out of pocket, and thisproportion is more in higher-level facilities.Whereas, all most all the neonates who visited private hospitals/clinics have spent moneyout of pocket, moreover, around two-thirds (71 per cent) of them have spent ranging from1,000 to 70,000 Indian rupees (hereafter INRs), remaining 29 per cent cases have paid up to1,000 INRs. As the result shows among those who had problems, majority mothers ofneonates (59 per cent) consulted private hospitals/clinics, indicating still, with the strongnetwork of government health facilities at various level, many rural mothers are visitingprivate practitioners and spending out of pocket.
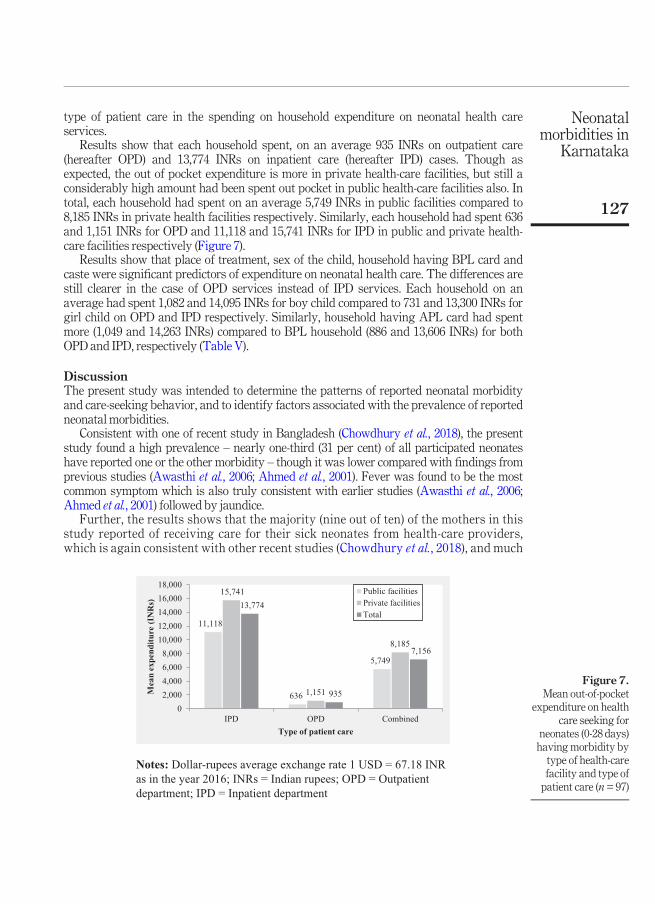
Mean out-of-pocket expenditureFigure 7 and Table V present the average expenditure incurred by the households forneonatal health care services by background characteristics and type of patient care. Theanalysis of expenditure on these services shows the considerable burden on households, onan average, each household, had spent 7,156 INRs. Further, the results revealed that thereare considerable differences among the population groups as well as the type of facility and
Figure 6.Types of healthfacilities used for thetreatment of neonatal(0-28 days)morbidities by sex ofneonates (n=67 Boysand n=44 Girls)
32.8
9.0
55.2
3.0
25.0
9.1
65.9
0.00
10
20
30
40
50
60
70
DH/TH & higher
facility
PHC/CHC Private
hospitals/clinics
Others
Perc
enta
ge o
f neo
nate
s
Boys
Girl
Notes: DH = District Hospital; TH = Taluka Hospital; PHC =
Primary Health Centres; CHC = Community Health Centres
Table IV.Percentagedistribution of costby place of treatmentsought (n=97)
Cost inINRs
DH/TH and higher facility(n=31)
PHC/CHC(n=8)
Private hospitals/clinics(n=56)
Home(n=2)
Free 42 38 � 1001-999 10 38 29 �1,000-9,999 29 13 46 �> =10,000 19 13 25 �Total 100 100 100 100
Note: Dollar-rupees average exchange rate 1 USD=67.18 INR as in the year 2016; INRs = Indian rupees;n = number of cases; DH = district hospital; TH = taluka hospital; PHC = primary health centers; CHC =community health centers
JHASS1,2
126
type of patient care in the spending on household expenditure on neonatal health careservices.
Results show that each household spent, on an average 935 INRs on outpatient care(hereafter OPD) and 13,774 INRs on inpatient care (hereafter IPD) cases. Though asexpected, the out of pocket expenditure is more in private health-care facilities, but still aconsiderably high amount had been spent out pocket in public health-care facilities also. Intotal, each household had spent on an average 5,749 INRs in public facilities compared to8,185 INRs in private health facilities respectively. Similarly, each household had spent 636and 1,151 INRs for OPD and 11,118 and 15,741 INRs for IPD in public and private health-care facilities respectively (Figure 7).
Results show that place of treatment, sex of the child, household having BPL card andcaste were significant predictors of expenditure on neonatal health care. The differences arestill clearer in the case of OPD services instead of IPD services. Each household on anaverage had spent 1,082 and 14,095 INRs for boy child compared to 731 and 13,300 INRs forgirl child on OPD and IPD respectively. Similarly, household having APL card had spentmore (1,049 and 14,263 INRs) compared to BPL household (886 and 13,606 INRs) for bothOPD and IPD, respectively (Table V).
DiscussionThe present study was intended to determine the patterns of reported neonatal morbidityand care-seeking behavior, and to identify factors associated with the prevalence of reportedneonatal morbidities.
Consistent with one of recent study in Bangladesh (Chowdhury et al., 2018), the presentstudy found a high prevalence – nearly one-third (31 per cent) of all participated neonateshave reported one or the other morbidity – though it was lower compared with findings fromprevious studies (Awasthi et al., 2006; Ahmed et al., 2001). Fever was found to be the mostcommon symptom which is also truly consistent with earlier studies (Awasthi et al., 2006;Ahmed et al., 2001) followed by jaundice.
Further, the results shows that the majority (nine out of ten) of the mothers in thisstudy reported of receiving care for their sick neonates from health-care providers,which is again consistent with other recent studies (Chowdhury et al., 2018), and much
Figure 7.Mean out-of-pocket
expenditure on healthcare seeking for
neonates (0-28 days)having morbidity bytype of health-carefacility and type ofpatient care (n=97)
11,118
636
5,749
15,741
1,151
8,185
13,774
935
7,156
0
2,000
4,000
6,000
8,000
10,000
12,000
14,000
16,000
18,000
IPD OPD Combined
Mea
n ex
pend
iture
(IN
Rs)
Type of patient care
Public facilities
Private facilities
Total
Notes: Dollar-rupees average exchange rate 1 USD = 67.18 INR
as in the year 2016; INRs = Indian rupees; OPD = Outpatient
department; IPD = Inpatient department
Neonatalmorbidities in
Karnataka
127

better than the earlier studies in the Indian context which is obviously expected(Awasthi et al., 2006).
Strengths and limitations of the studyPresent study, though the sample is relatively small, was conducted in rural and hard-to-reach areas. However, data in this study were from interviews with an 18-20months recallperiod and therefore, were susceptible to recall errors when reporting symptoms and care-seeking practice. To address this issue, experienced research staffs were collected the datacollection task after receiving rigorously training on appropriate questioning methods andother potential issues related to neonatal danger signs and health-care utilization amongothers.
Table V.Mean out-of-pocketexpenditure onhealth care seekingfor neonates (0-28 days) havingmorbidity bybackgroundcharacteristics(N=97)
OPD IPD
Background variablesMean6 SD
(INRs) Median (INRs) N Mean6 SD (INRs) Median (INRs) N
Place of treatmentDH/TH and other higher facility 8586 1767 0 13 9,1316 14,008 1,100 18PHC/CHC 2006 245 100 6 29,0006 29,698 29,000 2Private hospitals/clinics 11516 1162 600 29 15,7416 17,927 10,000 27
Sex of the childBoy 10826 1572 400 29 14,0956 16,809 7,500 28Girl 7316 722 500 21 13,3006 18,095 10,000 19
Birth orderFirst 8076 928 500 15 11,2506 13,533 7,500 26Second 9816 1,506 400 17 17,5266 19,298 12,000 143 or more 9976 1,380 500 18 15,6436 24,908 8,000 7
Number of children2 or less 8806 1,268 400 31 13,4476 15,834 8,500 40More than 2 10246 1,346 500 19 15,6436 24,908 8,000 7
Mother’s EducationNo Schooling 8306 1,281 100 5 19,6506 20,306 14,000 81-9 Years 1,1396 1,662 500 20 14,7706 17,212 10,000 2110 and above Years 7926 928 400 25 10,0006 15,652 5,250 18
Household having BPL cardBPL 8866 1,209 500 35 13,6066 16,970 7,000 35APL 10496 1,492 380 15 14,2636 18,425 10,000 12
CasteSCs 6466 853 500 13 12,4476 14,027 9,000 12STs 15356 2,468 290 8 12,3336 15,930 8,000 9OBCs 7966 991 400 12 19,3166 20,828 14,000 19General 9716 960 750 17 2,8576 3,388 1,000 7Total 93561,287 500 50 13,774617,150 8,000 47
Note: Dollar-rupees average exchange rate 1 USD=67.18 INRs as in the year 2016; INRs = Indian rupees;OPD = outpatient department; IPD = inpatient department; SD = standard deviation; N = number of cases;DH = district Hospital; TH = taluka hospital; PHC = primary health centers; CHC = community healthcenters; BPL = below poverty line; APL=above poverty line; SCs = scheduled castes; STs = scheduledtribes; OBCs = other backward classes
JHASS1,2
128
Further, information on the timing and duration of the symptoms after delivery, andcare-seeking were not collected during the survey which restricted us from analyzing andexplaining the number of incidence and duration of the morbidities and care-seeking;similarly, the different socio-economic and demographic factors affecting the care-seekingpractice was also not analyzed in the present study due to less number of samples. Wepropose that studies are needed with a relatively large number of samples to address theseissues in details.
ConclusionOver the recent years, with a formulated policy, a lot of money is being pumped bycentral as well as the state government to empower the health-care facilities/providersto improve neonatal and infant health services at the grass root level, especially in ruralareas. By the results of the study, by socio-demographic variables, it is evident that thereporting of neonatal morbidity was more prevalent among young, educated, highercaste mothers. It may be due to the level of awareness of danger signs was more linkedto belonging of well off and higher educational attainment of women (Nigatu et al.,2015). On the other hand, the older women less educated and belonging to sociallymarginalized class respondents were poorly reported the morbidities. Whereas, byobstetric variables, it is mothers of the boy child, first order birth and mother of two orless number of children have reported more neonatal morbidity compared to theircounterparts.
Further, interestingly the study found that the majority of mothers were seekingcare from private practitioners for their sick neonates, though the strong network ofgovernment health facilities is available at various levels, and consequently spendingmore money out of pocket.
The results of the study suggest that efforts should be made to raise awarenessregarding neonatal morbidity, its prevention and the importance of seeking care fromtrained personnel among expectant mothers, especially mothers belonging tomarginalized communities. Therefore, intervention modalities that focus onincreasing the level of parental education, access to treatment, and advocating themessage regarding newborn danger signs during pregnancy were pinpointed. Thereis a well-established network of government health-care facilities and medicalpractitioners along with front line workers at gross root level, they are the majorcontributors in this regard, hence proper utilization of this government setup isemphasizes. Furthermore, different non-government organizations, private health-care providers and international organization need to play crucial role. Further, thistask can be done using strong Information, Education and Communication materialsthrough using mass media broadcasts including radio, television and even socialnetwork forums. While doing so focus should be given for improving the utilization ofservices in government health facilities, especially PHCs and CHCs, to minimize out ofpocket spending.
Notes
1 Districts are local administrative units; they generally for the tier of local governmentimmediately below that of India’s sub-national states and territories.
2 Karnataka is a state in the southwestern region of India. It was formed on November 1, 1956, withthe passage of the States Reorganization Act. Originally, known as the State of Mysore, it wasrenamed as Karnataka in 1973.
Neonatalmorbidities in
Karnataka
129

3 Taluka, which is also called as Tehsil or Block, is an administrative sub-district division,typically comprising a number of villages.
4 Village is a group of houses and associated buildings, larger than a hamlet and smaller than atown, situated in a rural area.
5 The Scheduled Caste (SCs) and Scheduled Tribe (STs) are the official designations given tovarious groups of historically marginalized people, recognized in the Constitution of India.During the period of British rule, they were known as the Depressed Classes. In modernliterature, the SCs are sometimes referred as “Dalits”, whereas STs are mentioned as“Adivasis” (i.e. traditional forest dwellers). The SCs and STs comprise about 16.6 per centand 8.6 per cent of India’s population respectively (RGI, 2013). OBCs represent otherbackward classes.
6 It is very important to know here that the proportion of Muslim population is high in the Bidardistrict compared to most of the other districts of Karnataka and more so in the selected taluka.Hence, the coverage of higher proportion of women goes with the higher representation of Muslimcommunity in the district.
ReferencesAhmed, S., Sobhan, F., Islam, A. and Barkate, K. (2001), “Neonatal morbidity and care-seeking
behaviour in rural Bangladesh”, Journal of Tropical Pediatrics, Vol. 47 No. 2, pp. 98-105.Awasthi, S., Verma, T. and Agarwal, M. (2006), “Danger signs of neonatal illnesses: perceptions of
caregivers and health workers in Northern India”, Bulletin of the World Health Organization,Vol. 84 No. 10, pp. 819-826.
Bang, A.T., Bang, R.A., Baitule, S., Deshmukh, M. and Reddy, M.H. (2001), “Burden of morbidities andthe unmet need for health care in rural neonates - a prospective observational study inGadchiroli, India”, Indian Pediatrics, Vol. 38 No. 9, pp. 952-965.
Black, R.E., Morris, S.S. and Bryce, J. (2003), “Child survival-where and why are 10 million childrendying every year”,The Lancet, Vol. 361 No. 9376, pp. 2226-2234.
Chowdhury, S.K., Billah, S.M., Arifeen, S.E. and Hoque, D.M.E. (2018), “Care-seeking practices for sickneonates: findings from cross-sectional survey in 14 rural sub-districts of Bangladesh”, PLoSOne, Vol. 3 No. 9, p. e0204902.
Dadhich, J.P. and Paul, V. (2004), “State of India’s Newborns”, National Neonatology Forum and savethe children, New Delhi/Washington, DC.
IBMCorp (2011), “IBMSPSS Statistics forWindows”, Version 20.0, IBM Corp, Armonk, NewYork, NY.Ingle, G.K. and Malhotra, C. (2007), “Integrated management of neonatal and childhood illness: an
overview”, Indian Journal of CommunityMedicine, Vol. 32 No. 2, pp. 108-10.International Institute for Population Sciences (IIPS), Mumbai (2016), “National family health survey-2015-
16”, available at: http://rchiips.org/nfhs/pdf/NFHS4/KA_FactSheet.pdf (accessed 26 July 2017).Lawn, J.E., Cousens, S. and Zupan, J., Lancet Neonatal Survival Steering Team (2005), “4 Million
neonatal deaths: when?Where?Why?”,The Lancet, Vol. 365 No. 9462, pp. 891-900.Nigatu, S.G., Worku, A.G. and Dadi, A.F. (2015), “Level of mother’s knowledge about neonatal danger
signs and associated factors in North West of Ethiopia: a community based study”, BMCResearch Notes, Vol. 8 No. 1.
Registrar General of India. Primary Census Abstract, population Census- 2011 (2013), Registrar Generaland Census Commissioner of India, New Delhi.
Teerawichitchainan, B. and Phillips, J.F. (2007), “Ethnic differentials in parental health seeking forchildhood illness in Vietnam”, Working paper No. 3, Population Council, New York, NY.
JHASS1,2
130

WHO andMOHFW (2003), “Student’s Handbook for IntegratedManagement of Neonatal and ChildhoodIllness”, World Health Organization (WHO), Department of Child and Adolescent Health andDevelopment (CAH), andMinistry of Health and FamilyWelfare (MOHFW), New Delhi.
World Health Organization (WHO) (2016), Children: reducing Mortality, World Health Organization:Fact sheet, available atwww.who.int/mediacentre/factsheets/fs178/en/ (accessed 26 July 2017).
World Health Organization (WHO) (2018), Children: reducing Mortality, World Health Organization:Fact sheet, available at: www.who.int/en/news-room/fact-sheets/detail/children-reducing-mortality (accessed 30 December 2017).
You, D., Hug, L., Ejdemyr, S., Beise, J. and Idele, P. (2015), Level and Trends in Child Mortality: TheUnited Nations Inter-Agency Group for Child Mortality Estimation (UN IGME), United NationsChildren’s Fund, New York, NY, available at: http://data.unicef.org/wp-content/uploads/2015/12/IGME-report-2015-child-mortality-final_236.pdf (accessed 26 July 2017).
Corresponding authorJaveed A. Golandaj can be contacted at: [email protected]
For instructions on how to order reprints of this article, please visit our website:www.emeraldgrouppublishing.com/licensing/reprints.htmOr contact us for further details: [email protected]
Neonatalmorbidities in
Karnataka
131