prevalence, risk, and outcome of deep vein thrombosis in
TRANSCRIPT
RESEARCH Open Access
Prevalence, risk, and outcome of deep veinthrombosis in acute respiratory distresssyndromeNa Cui1,2, Chunguo Jiang1,2, Hairong Chen3, Liming Zhang1,2* and Xiaokai Feng1,2*
Abstract
Background: Few data exist on deep vein thrombosis (DVT) in patients with acute respiratory distress syndrome(ARDS), a group of heterogeneous diseases characterized by acute hypoxemia.
Study design and methods: We retrospectively enrolled 225 adults with ARDS admitted to the Beijing Chao-YangHospital and the First Affiliated Hospital of Shandong First Medical University between 1 January 2015 and 30 June2020. We analyzed clinical, laboratory, and echocardiography data for groups with and without DVT and for direct(pulmonary) and indirect (extrapulmonary) ARDS subgroups.
Results: Ninety (40.0%) patients developed DVT. Compared with the non-DVT group, patients with DVT were older,had lower serum creatinine levels, lower partial pressure of arterial oxygen/fraction of inspired oxygen, higherserum procalcitonin levels, higher Padua prediction scores, and higher proportions of sedation and invasivemechanical ventilation (IMV). Multivariate analysis showed an association between age, serum creatinine level, IMV,and DVT in the ARDS cohort. The sensitivity and specificity of corresponding receiver operating characteristic curveswere not inferior to those of the Padua prediction score and the Caprini score for screening for DVT in the threeARDS cohorts. Patients with DVT had a significantly lower survival rate than those without DVT in the overall ARDScohort and in the groups with direct and indirect ARDS.
Conclusions: The prevalence of DVT is high in patients with ARDS. The risk factors for DVT are age, serumcreatinine level, and IMV. DVT is associated with decreased survival in patients with ARDS.
Keywords: Acute respiratory distress syndrome, Caprini score, Deep vein thrombosis, Invasive mechanicalventilation, Padua prediction score
IntroductionDeep vein thrombosis (DVT) and pulmonary embolism(PE), collectively referred to as venous thromboembol-ism (VTE), constitute a major global burden of disease[1]. Some studies demonstrated an increased risk of VTEin patients in the intensive care unit (ICU) [2–4]. Pa-tients with acute respiratory distress syndrome (ARDS)
are at high risk for DVT because they are susceptibleboth to general risk factors for VTE and to those specificto the critically ill, such as advanced age, sedation,immobilization, insertion of a central venous catheter,and mechanical ventilation (MV), combined with a se-vere inflammatory response and hypercoagulable states[2–6]. ARDS remains under-recognized clinically; how-ever, therapies are limited, complications are frequent,and mortality remains significantly high [7–11]. Patientswith ARDS are a heterogeneous group with significantvariability in clinical presentation and outcomes. One
© The Author(s). 2021 Open Access This article is licensed under a Creative Commons Attribution 4.0 International License,which permits use, sharing, adaptation, distribution and reproduction in any medium or format, as long as you giveappropriate credit to the original author(s) and the source, provide a link to the Creative Commons licence, and indicate ifchanges were made. The images or other third party material in this article are included in the article's Creative Commonslicence, unless indicated otherwise in a credit line to the material. If material is not included in the article's Creative Commonslicence and your intended use is not permitted by statutory regulation or exceeds the permitted use, you will need to obtainpermission directly from the copyright holder. To view a copy of this licence, visit http://creativecommons.org/licenses/by/4.0/.The Creative Commons Public Domain Dedication waiver (http://creativecommons.org/publicdomain/zero/1.0/) applies to thedata made available in this article, unless otherwise stated in a credit line to the data.
* Correspondence: [email protected]; [email protected] of Pulmonary and Critical Care Medicine, Beijing Chao-YangHospital, Capital Medical University, No. 8, Gongti South Road, ChaoyangDistrict, Beijing 100020, People’s Republic of ChinaFull list of author information is available at the end of the article
Cui et al. Thrombosis Journal (2021) 19:71 https://doi.org/10.1186/s12959-021-00325-3

approach to reducing these heterogeneities is to subclas-sify patients with ARDS as having direct (pulmonary) orindirect (extrapulmonary) ARDS based on variabilities inthe pathological, radiological, and respiratory mechanicalresponses to different management strategies [12–19].The incidence of DVT in patients with direct and in-
direct ARDS has not been investigated.We performed a multi-institutional study to identify
the prevalence, risk factors, and prognosis of DVT andto determine whether the predictors of DVT differed be-tween direct and indirect ARDS in a cohort of patientsidentified with ARDS.
MethodsStudy design and populationWe retrospectively enrolled adult patients (≥ 18 yearsold) with ARDS (according to the Berlin definition) [8]who were admitted to the Department of Pulmonaryand Critical Care Medicine, Beijing Chao-Yang Hospitaland the Intensive Care Unit, the First Affiliated Hospitalof Shandong First Medical University, from 1 January2015 to 30 June 2020. All patients were included con-secutively. Patients with ARDS were classified as havingdirect ARDS or indirect ARDS based on the underlyingrisk factors for ARDS recorded by study personnel. Pa-tients with pneumonia and aspiration as risk factors andthose with pulmonary sepsis were assigned to the directARDS group, whereas those with pancreatitis or non-pulmonary sepsis were assigned to the indirect ARDSgroup. Patients who could not be classified as uniquelydirect or indirect ARDS and patients with both pneumo-nia and non-pulmonary sepsis were excluded. Other
exclusion criteria include: active malignant tumor, cere-bral stroke, acute myocardial infarction, serious trauma,major operation lasting longer than 45min, fracture oflower limb, joint replacement for hip or knee, and lackof lower extremity venous compression ultrasound data.The first ultrasound examination was performed within1–3 days after the diagnosis of ARDS, and then theultrasound scan was reexamined again according to thepatient’s condition. After intensive treatment, if the pa-tient remained unstable because of conditions such asunexplained hypoxemia or cardiac insufficiency, he orshe should be reexamined by ultrasound. If there wasmore than one ultrasound scan for a single patient, allthe results were recorded. Patients were divided into aDVT and a non-DVT group according to the results ofthe venous ultrasound scans. The flow chart is shown inFig. 1 (A, B).The study was approved by the ethics committees of
the Beijing Chao-Yang Hospital (2020-ke-429) and theFirst Affiliated Hospital of Shandong First Medical Uni-versity (S003) and was conducted in accordance with the1964 Helsinki Declaration and its later amendments orcomparable ethical standards.
Clinical dataWe analyzed the medical records of the enrolled pa-tients. Data, which included demographic information,clinical history, vital signs, laboratory findings, treat-ments, complications, and outcomes of the patients dur-ing hospitalization, were collected and analyzed. Weanalyzed the survival rates of all patients within 28 daysafter a diagnosis of ARDS. For the patients discharged
Fig. 1 A, B, Study flow chart. A, flow chart for including patients; B, flow chart for screening for DVT. The interval from the diagnosis of ARDS tothe occurrence of DVT in the DVT group was 5 (2, 9) days, and the interval from the diagnosis of ARDS to the last ultrasound examination in thenon-DVT group was 5 (2, 11) days. There were no differences between the two groups (P = 0.784). Abbreviations: ARDS, acute respiratory distresssyndrome; DVT, deep vein thrombosis; US, ultrasound
Cui et al. Thrombosis Journal (2021) 19:71 Page 2 of 15

within 28 days, we followed up by telephone concerningtheir survival status after discharge.
Ultrasound assessmentBedside ultrasound examinations were performed usinga portable color ultrasound scanner (CX50, Philips Med-ical Systems, the Netherlands, equipped with an L12–3/S5–1 probe). The lower extremity venous compressionultrasound and echocardiographic data were obtainedfrom the institution’s Picture Archiving and Communi-cation System. The levels of DVT included the bilateralcommon femoral, deep and superficial femoral veins, thepopliteal veins, and the anterior tibial, posterior tibial,peroneal, and calf muscle veins. Left ventricular andright ventricular function parameters were captured.The presence of pulmonary artery hypertension wasevaluated by adding a tricuspid regurgitation pressuregradient to the estimated right atrial pressure [20].
DefinitionsARDS was defined according to the Berlin definition [8].Sepsis was defined according to the Third InternationalConsensus Definitions for Sepsis and Septic Shock [21].A distal thrombosis was defined as a thrombosis in theveins of the calf muscle or in at least 1 branch of the 3pairs of deep calf veins (anterior tibial vein, posterior tib-ial vein, or peroneal vein); a proximal thrombosis wasdefined as a thrombosis in the popliteal vein or above.The Caprini score was defined according to the updatedCaprini Risk Assessment Model (2013 Version) [22].The Padua prediction score was defined according tothe Barbar model [23]. We applied the Acute Physiologyand Chronic Health Evaluation (APACHE) II score andthe Sequential Organ Failure Assessment (SOFA) scoreto assess the severity of disease [21, 24, 25].
Statistical analysesCategorical variables were described as number and per-centage (%) and continuous variables, as mean, standarddeviation, median, and interquartile range. The Shapiro-Wilk test was used to verify normality. Differences be-tween the DVT and the non-DVT groups were assessedby a two-sample t-test for normally distributed continu-ous variables, the Mann-Whitney U test for non-normally distributed continuous variables, and the χ2 orFisher exact test for categorical variables. To determinerisk factors for DVT, multivariable logistic regressionanalysis which was based on the factors with significantdifferences between DVT and non-DVT groups in uni-variate analysis and the factors that may be related todependent variables from the perspective of professionalknowledge was performed on the direct and the indirectARDS subgroups. The adjusted odds ratio (OR) with95% confidence intervals (CI) was reported. To further
evaluate the observed differences in risk factors for DVTbetween direct and indirect ARDS, we utilized inter-action terms between ARDS type and each risk factor. Areceiver operating characteristic (ROC) analysis was per-formed to calculate the sensitivity and specificity of riskfactors for screening for DVT. The comparison methodsof diagnostic accuracy for screening for DVT of differentROCs in three ARDS cohorts are as follows: Patientswere split by generating random numbers to produce atraining data set (n*0.7) and a validation data set (n*0.3)in the overall, direct, and indirect groups respectively.The area under receiver operating characteristic curves(ROC-AUCs) for different risk factors were comparedusing the method of DeLong et al. [26]. Survival curveswere plotted using the Kaplan-Meier method and com-pared between patients with or without DVT using thelog-rank test. To further explore the incidence rate ofDVT in patients with ARDS in ICU, we selected non-ARDS patients in ICU consecutively during the sameperiod as controls. And then, we took death as the com-petitive risk and plotted 28-day cumulative incidencecurves (and points estimates with 95% CI) for ARDS andnon-ARDS patients. Fine-Gray test was used to comparethe incidence rate of DVT between the two groups. Allstatistical analyses were performed using the StatisticalAnalysis System, version 9.4 (SAS Institute, Cary, NC,USA). All tests were two-tailed; P < 0.05 was consideredstatistically significant.
ResultsA total of 225 patients with ARDS were enrolled in thisstudy; 111 patients were considered to belong in the dir-ect ARDS group and 114 patients in the indirect ARDSgroup. The flow chart is shown in Fig. 1 (A, B).
Ultrasound scan for screening for DVTLower extremity venous ultrasound scanning was per-formed whenever feasible for 225 patients regardless ofclinical symptoms of the lower limbs (Fig. 1B), and themedian number of ultrasound examinations was 1(range, 1–5). Fifty-two (52/225) developed DVT wasfound and the other 173 was a negative result at the firstultrasound scan. Subsequently, 102 patients underwentmore than one ultrasound scan, for whom 38 developedDVT and 64 had no DVT with 2 (range, 2–5) ultrasoundexaminations. The interval from the diagnosis of ARDSto the occurrence of DVT in the 38 developed DVTgroup was 7 (4, 14) days, and the interval from the diag-nosis of ARDS to the last ultrasound examination in the64 non-DVT group was 10 (4, 16) days. There was nodifference between the two groups (P = 0.542). Finally, ofthe 225 patients, 90 (40.0%) developed DVT, including 7with proximal DVT and 83 with distal DVT, 73 of whomhad muscular calf vein thrombosis only. The incidence
Cui et al. Thrombosis Journal (2021) 19:71 Page 3 of 15

of asymptomatic DVT was 75 (33.3%) including 2 (0.9%)proximal DVT and 73 (32.4%) distal DVT, of whom mus-cular calf vein thrombosis accounted for 70 (31.1%). Forall the 225 patients, the interval from the diagnosis ofARDS to the occurrence of DVT in DVT group was 5 (2,9) days, and the interval from the diagnosis of ARDS tothe last ultrasound examination in non-DVT group was 5(2, 11) days. There was no difference between the twogroups (P = 0.784). Five patients were clinically suspectedof having PE; three were further confirmed by computedtomography pulmonary angiography (CTPA) examin-ation. There was no difference in the prevalence of DVTin patients with direct and indirect ARDS (39.6% [44/111]vs 40.4% [46/114], respectively; P = 0.913; Table 1).
Demographic and clinical characteristics of patients withdirect and indirect ARDSCompared with the direct ARDS group (Table 1), pa-tients with indirect ARDS had higher APACHE II scores
(P = 0.010), higher SOFA scores (P < 0.001), higherwhite blood cell counts (P < 0.001), higher neutrophilcounts (P < 0.001), higher levels of procalcitonin (P =0.008), higher levels of serum creatinine (P = 0.019), andhigher levels of D-dimer (P < 0.001). There were moremen in the direct ARDS group (P < 0.001). Patients withdirect ARDS had lower PaO2/FiO2 than those with indir-ect ARDS (P < 0.001).
Demographic and clinical characteristics of DVT vs non-DVT patients in overall ARDS cohortCompared with the non-DVT group (Table 2), patientswith DVT were older (P < 0.001) and had lower levels ofserum creatinine (P = 0.007), lower levels of partial pres-sure of arterial oxygen/fraction of inspired oxygen(PaO2/FiO2; P = 0.002), higher levels of serum procalci-tonin (PCT; P < 0.001), higher Padua prediction scores(P = 0.023), and a higher proportion of patients givensedative therapy (P = 0.001) and invasive mechanical
Table 1 Demographic and Clinical Characteristics of Patients with Direct and Indirect ARDS
Characteristic Total(N = 225)
Direct ARDS(N = 111)
IndirectARDS (N = 114)
P value
Age (years) 66 ± 17 64 ± 15 67 ± 18 0.192
Male, n (%) 144 (64.0) 84 (75.7) 60 (52.6) < 0.001
BMI 24.1 (21.6, 26.8) 24.0 (21.0, 26.2) 24.4 (21.9, 27.0) 0.274
Bedridden time (days) 8 (4, 15) 9 (5, 15) 8 (4, 16) 0.400
APACHE II score 23 (19, 28) 22 (17, 27) 25 (19, 31) 0.010
SOFA score 8 (5, 10) 6 (4, 6) 9 (6, 11) < 0.001
Laboratory data
White blood cells (×109/L) 16.9 (12.0, 21.5) 14.3 (10.1, 20.3) 18.2 (14.4, 23.5) < 0.001
Neutrophils (×109/L) 14.5 (10.4, 19.7) 12.8 (9.0, 17.7) 16.1 (12.6, 20.8) < 0.001
Platelets (×109/L) 183.0 (101.0, 253.5) 190.0 (120.0, 270.0) 167.0 (73.8, 238.0) 0.094
C-reactive protein (mg/L) 120.0 (89.4, 120.0) 120.0 (85.0, 120.0) 120.0 (92.2, 120.0) 0.391
Procalcitonin (ng/mL) 5.6 (2.0, 16.2) 4.1 (1.5, 13.5) 7.3 (3.0, 21.2) 0.008
Serum creatinine (μmol/L) 116.7 (66.6, 209.5) 90.5 (65.0, 193.0) 136.9 (67.9, 248.8) 0.019
D-dimer (μg/ml) 1.9 (0.9, 3.8) 1.3 (0.6, 2.5) 2.4 (1.3, 5.3) < 0.001
PaO2/FiO2 158 (103, 199) 136 (80, 186) 170 (130, 208) < 0.001*
Mild, n (%) 54 (24.0) 22 (19.8) 32 (28.1) < 0.001#
Moderate, n (%) 116 (51.6) 49 (44.1) 67 (58.8)
Severe, n (%) 55 (24.4) 40 (36.0) 15 (13.2)
DVT, n (%) 90 (40.0%) 44 (39.6) 46 (40.4) 0.913
ICU length of stay (days) 11 (6, 24) 13 (7, 25) 10 (5, 24) 0.103
Hospital length of stay (days) 19 (12, 32) 17 (10, 29) 22 (13, 34) 0.055
Mortality, n (%) 77 (34.2) 36 (32.4) 41 (36.0) 0.577
Data are mean ± SD, median (IQR) or n (%). P values comparing Direct and Indirect ARDS groups were from a two-sample t-test, Mann- Whitney U test, or χ2 test.P < 0.05 was considered statistically significant*χ2 test comparing Direct and Indirect ARDS groups#χ2 test comparing all subcategoriesAbbreviations: APACHE Acute Physiology and Chronic Health Evaluation, ARDS acute respiratory distress syndrome, BMI body mass index, DVT deep venousthrombosis, FiO2, fraction of inspired oxygen, ICU intensive care unit, IQR interquartile range, mild 200 mmHg<PaO2/FiO2 ≤ 300 mmHg, moderate 100 mmHg<PaO2/FiO2 ≤ 200 mmHg, PaO2 partial pressure of arterial oxygen, SD standard deviation, severe PaO2/FiO2 ≤ 100 mmHg, SOFA Sequential Organ Failure Assessment
Cui et al. Thrombosis Journal (2021) 19:71 Page 4 of 15

Table 2 Demographic and Clinical Characteristics of DVT Vs Non-DVT Patients in Overall ARDS Cohort
Characteristic Total DVT Non-DVT P value
(N = 225) (N = 90) (N = 135)
Age (years) 66 ± 17 70 ± 13 63 ± 18 < 0.001
Male, n (%) 144 (64.0) 52 (57.8) 92 (68.1) 0.112
BMI 24.1 (21.6, 26.8) 24.0 (20.8, 26.0) 24.2 (22.0, 27.2) 0.146
Direct ARDS
Pneumonia 96 (86.5) 40 (90.9) 56 (83.6) 0.412
Aspiration 15 (13.5) 4 (9.1) 11 (16.4)
Indirect ARDS
Non-pulmonary sepsis 81 (71.1) 33 (71.7) 48 (70.6) 0.894
Pancreatitis 33 (28.9) 13 (28.3) 20 (29.4)
Bedridden time (days) 8 (4, 15) 10 (5, 18) 7 (4, 15) 0.216
Caprini score 7 (5, 9) 7 (5, 10) 7 (5, 9) 0.135
Padua prediction score 6 (5, 6) 6 (5, 8) 5 (5, 6) 0.023
APACHE II score 23 (19, 28) 24 (20, 28) 23 (18, 29) 0.596
SOFA score 8 (5, 10) 7 (5, 9) 8 (5, 11) 0.622
Laboratory data
White blood cells (×109/L) 16.9 (12.0, 21.4) 16.5 (13.4, 21.0) 17.1 (11.6, 22.6) 0.733
Neutrophils (×109/L) 14.5 (10.4, 19.7) 14.7 (11.4, 19.3) 14.4 (9.9, 20.1) 0.709
Platelets (×109/L) 183.0 (101.0, 253.5) 196.5 (124.3, 263.3) 172.0 (84.0, 253.0) 0.141
C-reactive protein (mg/L) 120.0 (89.4, 120.0) 120.0 (82.0, 120.0) 120.0 (92.5, 120.0) 0.471
Procalcitonin (ng/mL) 5.6 (2.0, 16.2) 12.7 (3.4, 21.5) 3.5 (1.5, 10.3) < 0.001
Serum creatinine (μmol/L) 116.7 (66.6, 209.5) 95.1 (58.8, 165.5) 125.6 (70.6, 250.3) 0.007
D-dimer (μg/ml) 1.9 (0.9, 3.8) 2.1 (0.9, 5.0) 1.8 (0.9, 3.3) 0.070
PaO2 /FiO2 158 (103, 199) 137 (87, 179) 172 (116, 209) 0.002*
Mild, n (%) 54 (24.0) 14 (15.6) 40 (29.6) 0.026#
Moderate, n (%) 116 (51.6) 48 (53.3) 68 (50.4)
Severe, n (%) 55 (24.4) 28 (31.1) 27 (20.0)
Treatments
Glucocorticoid therapy, n (%) 51 (22.7) 22 (24.4) 29 (21.5) 0.603
Immunoglobulin, n (%) 5 (2.2) 2 (2.2) 3 (2.2) 1.000
Sedative therapy, n (%) 96 (42.7) 50 (55.6) 46 (34.1) 0.001
Vasoactive agent therapy, n (%) 55 (24.4) 25 (27.8) 30 (22.2) 0.342
CRRT, n (%) 33 (14.7) 10 (11.1) 23 (17.0) 0.218
CVC, n (%) 125 (55.6) 55 (61.1) 70 (51.9) 0.171
IMV, n (%) 122 (54.2) 66 (73.3) 56 (41.5) < 0.001
Length of IMV (days) 3 (2, 7) 3 (2, 6) 3 (2, 8) 0.543
Length of IMV≥ 3 days, n (%) 80 (65.6) 43 (65.2) 37 (66.1) 0.915
VTE prophylaxis, n (%) 135 (60.0) 50 (55.6) 85 (63.0) 0.267
LMWH, n (%) 108 (48.0) 39 (43.3) 69 (51.1) 0.253
LMWH + physical prophylaxis, n (%) 75 (33.5) 29 (32.6) 46 (34.1) 0.817
Physical prophylaxis only, n (%) 23 (10.3) 9 (10.1) 14 (10.4) 0.950
ICU length of stay (days) 11 (6, 24) 12 (5, 24) 11 (6, 26) 0.563
Hospital length of stay (days) 19 (12, 32) 20 (11, 32) 19 (12, 31) 0.816
Mortality, n (%) 77 (34.2) 45 (50.0) 32 (23.7) < 0.001
Cui et al. Thrombosis Journal (2021) 19:71 Page 5 of 15

ventilation (IMV; P < 0.001). Patients with DVT hadmore deaths within 28 days after ARDS than those with-out DVT (P < 0.001). There were no differences in co-morbidities (P > 0.05 for all; data are not shown)between the DVT and the non-DVT groups. All patientswere bedridden for more than 3 days with no differencebetween the DVT and the non-DVT groups (P = 0.216).For the 135 (60.0%) patients who received VTE prophy-laxis, the incidence of DVT was 37.0% (50/135); how-ever, for the patients who did not receive VTEprophylaxis, it was 44.4% (40/90), and there was no sig-nificant difference between the two groups (P = 0.271).For the 108 (48.0%) patients who received low molecularweight heparin (LMWH), the incidence of DVT was36.1% (39/108), and for the 75 (33.5%) patients who re-ceived combined treatment with LMWH and physicalprevention, it was 37.3% (28/75). There was no signifi-cant difference between the two groups (P = 0.866).Among the 90 patients who did not receive VTEprophylaxis, 32 had anticoagulant therapy contraindica-tions, such as stress ulcers and gastrointestinal bleeding(17 patients), platelet counts less than 50 × 109/L (13 pa-tients), and haemoptysis (2 patients). The remaining 58(25.8%) patients had no clear high-risk factors for bleed-ing but did not receive VTE prophylaxis due to patientpreference of non-adherence to guidelines at that time
in this retrospective observational study. All the 90 pa-tients with DVT were treated with LMWH (66 receiveddalteparin 5000 IU once per 12 h, 24 received nadroparin0.1 ml/10 kg once per 12 h).
Echocardiographic findings of DVT vs non-DVT patients inoverall ARDS cohortA total of 215 (95.6%) patients received echocardio-graphic examinations, with 86 patients in the DVTgroup and 129 patients in the non-DVT group (Table 3).Compared with the non-DVT group, patients with DVThad a lower left ventricular end-systolic volume index(P = 0.041) and higher pulmonary artery systolic pressure(P = 0.007).
Demographic and clinical characteristics of DVT vs non-DVT patients in direct and indirect ARDS cohortsIn the direct and indirect ARDS cohorts (Table 4), pa-tients with DVT were older, had a lower PaO2/FiO2, ahigher level of PCT, and a higher proportion who weregiven sedative therapy and IMV than patients withoutDVT (P < 0.05 for all). Patients with DVT had lowerserum creatinine levels (P = 0.003) in the direct ARDScohort and higher Caprini scores (P = 0.021) and higherPadua prediction scores (P = 0.008) in the indirect ARDScohort. More patients with DVT died within 28 days
Data are presented as mean ± SD, median (IQR), or n (%). P values comparing DVT and non-DVT groups were from a two-sample t-test, Mann-Whitney U test, χ2
test, or Fisher exact test. P < 0.05 was considered statistically significant*χ2 test comparing DVT and non-DVT groups#χ2 test comparing all subcategoriesAbbreviations: APACHE Acute Physiology and Chronic Health Evaluation, ARDS acute respiratory distress syndrome, BMI body mass index, CRRT continuous renalreplacement therapy, CVC central venous catheterization, DVT deep venous thrombosis, FiO2 fraction of inspired oxygen, ICU intensive care unit, IMV invasivemechanical ventilation, IQR interquartile range, LMWH low molecular weight heparin, mild 200 mmHg<PaO2/FiO2 ≤ 300 mmHg, moderate 100 mmHg<PaO2/FiO2 ≤200 mmHg, PaO2 partial pressure of arterial oxygen, SD standard deviation, severe PaO2/FiO2 ≤ 100 mmHg, SOFA Sequential Organ Failure Assessment, VTEvenous thromboembolism
Table 3 Echocardiographic Findings of DVT Vs Non-DVT Patients in Overall ARDS Cohort
Variables Total DVT Non-DVT P value
LA diameter (mm) 48 (43, 53) 47 (42, 53) 48 (43, 52) 0.764
LVESVI (mL/m2) 46 (43, 49) 46 (42, 48) 47 (44, 49) 0.041
LVEDVI (mL/m2) 29 (27, 32) 29 (26, 31) 30 (27, 32) 0.107
Simpson biplane EF (%) 66 (62, 70) 67 (62, 70) 66 (61, 70) 0.513
RA diameter (mm) 45 (41, 48) 45 (41, 48) 44 (40, 48) 0.236
RV diameter (mm) 30 (26, 32) 30 (27, 32) 29 (26, 32) 0.839
PA diameter (mm) 23 (21, 25) 23 (22, 25) 23 (21, 25) 0.933
PASP (mmHg) 40 (36, 48) 43 (38, 60) 38 (35, 46) 0.007
PAH, n (%) 55 (25.6) 25 (29.1) 30 (23.3) 0.338
Pericardial effusion, n (%) 12 (5.6) 4 (4.7) 8 (6.2) 0.628
Tricuspid regurgitation, n (%) 86 (40.0) 38 (44.2) 48 (37.2) 0.306
Data are presented as median (IQR) or n (%). P values comparing DVT and non-DVT were from Mann-Whitney U test, or χ2 test. P < 0.05 was consideredstatistically significantAbbreviations: ARDS acute respiratory distress syndrome, DVT deep vein thrombosis, EF ejection fraction, LA left atrial, LVEDVI left ventricular end-diastolic volumeindex, LVESVI left ventricular end-systolic volume index, PA pulmonary artery, PAH pulmonary artery hypertension, PASP pulmonary artery systolic pressure, RAright atrial, RV right ventricular
Cui et al. Thrombosis Journal (2021) 19:71 Page 6 of 15

after being diagnosed with ARDS than those withoutDVT in both groups (P = 0.005 and P = 0.003, respect-ively). There were no differences in APACHE II scoresand SOFA scores between patients with and withoutDVT regardless of ARDS subgroup.
Independent predictors of DVT in patients with direct andindirect ARDSMultivariable logistic regression models for DVT wereapplied in the overall study cohort and then in the directand indirect ARDS groups, respectively (Table 5). In
Table 4 Demographic and Clinical Characteristics of DVT Vs Non-DVT Patients in Direct and Indirect ARDS Cohorts
Characteristics Direct ARDS (n = 111) Indirect ARDS (n = 114)
DVT(n = 44)
Non-DVT(n = 67)
PValue
DVT(n = 46)
Non-DVT(n = 68)
Pvalue
Age (years) 68 ± 11 62 ± 17 0.015 72 ± 15 64 ± 19 0.009
Male, n (%) 32 (72.7) 52 (77.6) 0.557 20 (43.5) 40 (58.8) 0.107
BMI 23.5 (20.6, 25.2) 24.2 (22.2, 27.2) 0.076 24.5 (21.3, 26.8) 24.0 (22.0, 27.3) 0.716
Bedridden time (days) 9 (6, 17) 9 (5, 15) 0.431 10 (4, 19) 7 (4, 14) 0.356
Caprini score 7 (5, 8) 7 (5, 9) 0.891 9 (6, 11) 7 (5,10) 0.021
Padua prediction score 5 (5, 6) 5 (5, 6) 0.689 7 (5, 8) 6 (4, 7) 0.008
APACHE II score 22 (17, 26) 21 (16, 27) 0.568 25 (21, 30) 25 (19, 32) 0.913
SOFA score 6 (5, 9) 6 (4, 10) 0.780 9 (7, 10) 9 (6,11) 0.772
Laboratory data
White blood cells (×109/L) 14.5 (10.0, 18.3) 14.1 (10.2, 20.7) 0.921 18.4 (15.0, 21.5) 18.1 (13.1, 24.2) 0.630
Neutrophils (×109/L) 12.8 (9.1, 16.8) 12.8 (8.9, 18.0) 0.935 16.1 (13.3, 19.8) 16.1 (11.0, 21.8) 0.669
Platelets (× 109/L) 193.5 (155.3, 279.0) 181.0 (108.0, 257.0) 0.301 202.0 (84.3, 246.5) 148.5 (70.8, 234.0) 0.267
C-reactive protein (mg/L) 120.0 (82, 120.0) 120.0 (89.0,120.0) 0.490 120.0 (86.8, 120.0) 120.0 (94.4, 120.0) 0.758
Procalcitonin (ng/mL) 8.3 (2.6, 17.6) 2.6 (1.1, 9.6) 0.002 15.0 (4.9, 25.0) 4.9 (2.6, 13.5) 0.001
Serum creatinine (μmol/L) 77.3 (56.2, 122.4) 119.0 (70.6, 225.1) 0.003 135.5 (67.3, 208.8) 140.7 (70.0, 275.7) 0.377
D-dimer (μg/ml) 1.8 (0.7, 3.2) 1.2 (0.6, 2.1) 0.211 3.2 (1.6, 7.3) 2.1 (1.3, 4.7) 0.123
PaO2/FiO2 111 (71, 176) 150 (86, 203) 0.035* 152 (117, 184) 179 (140, 217) 0.017*
Mild, n (%) 5 (11.4) 17 (25.4) 0.062# 9 (19.6) 23 (33.8) 0.249#
Moderate, n (%) 18 (40.9) 31 (46.3) 30 (65.2) 37 (54.4)
Severe, n (%) 21 (47.7) 19 (28.4) 7 (15.2) 8 (11.8) 21 (47.7) 19 (28.4) 7 (15.2) 8 (11.8)
Treatments
Glucocorticoid therapy, n (%) 16 (36.4) 15 (22.4) 0.108 6 (13.0) 14 (20.6) 0.299
Immunoglobulin, n (%) 1 (2.3) 2 (3.0) 1.000 1 (2.2) 1 (1.5) 1.000
Sedative therapy, n (%) 25 (56.8) 25 (37.3) 0.043 25 (54.3) 21 (30.9) 0.012
Vasoactive agent therapy, n (%) 10 (22.7) 12 (17.9) 0.533 15 (32.6) 18 (26.5) 0.478
CRRT, n (%) 3 (6.8) 9 (13.4) 0.432 7 (15.2) 14 (20.6) 0.468
CVC, n (%) 19 (43.2) 26 (38.8) 0.646 36 (78.3) 44 (64.7) 0.121
IMV, n (%) 34 (77.3) 31 (46.3) 0.001 32 (69.6) 25 (36.8) 0.001
Length of IMV (days) 3 (2, 6) 3 (2, 10) 0.646 3 (2, 7) 3 (2, 8) 0.586
Length of IMV≥ 3 days, n (%) 21 (61.8) 19 (61.3) 0.969 22 (68.8) 18 (72.0) 0.790
Mortality, n (%) 21 (47.7) 15 (22.4) 0.005 24 (52.2) 17 (25.0) 0.003
Data are presented as mean ± SD, median (IQR), or n (%). P values comparing DVT and non-DVT groups were from a two-sample t-test, Mann-Whitney U test, χ2
test, or Fisher exact test. P < 0.05 was considered statistically significant*χ2 test comparing DVT and non-DVT groups#χ2 test comparing all subcategoriesAbbreviations: APACHE Acute Physiology and Chronic Health Evaluation, ARDS acute respiratory distress syndrome, BMI body mass index, CRRT continuous renalreplacement therapy, CVC central venous catheterization, DVT deep venous thrombosis, FiO2, fraction of inspired oxygen, ICU intensive care unit, IMV invasivemechanical ventilation, IQR interquartile range, LMWH low molecular weight heparin, mild 200 mmHg<PaO2/FiO2 ≤ 300 mmHg, moderate 100 mmHg<PaO2/FiO2 ≤200 mmHg, PaO2 partial pressure of arterial oxygen, SD standard deviation, severe, PaO2/FiO2 ≤ 100 mmHg, SOFA Sequential Organ Failure Assessment, VTEvenous thromboembolism
Cui et al. Thrombosis Journal (2021) 19:71 Page 7 of 15

order to reduce data duplication, we did not includethrombus prediction scores and disease severity scoresin the multiple regression models. Because all patientswith sedation received IMV, there was a certain degreeof overlap between these two variables, so we did not in-corporate sedative therapy in the multivariate regression.In the combined and direct ARDS cohorts, age, serumcreatinine level, and IMV were independently associatedwith DVT. In the indirect ARDS group, the independentcontributors to DVT were age (P = 0.015) and IMV (P =0.024). However, in contrast, the occurrence of DVT in-creased more significantly with increasing age in thosewith direct ARDS than in those with indirect ARDS (testfor interaction, P = 0.030; Fig. 2). Distinct from directARDS, the serum creatinine level was not independentlyassociated with increased DVT in the indirect ARDSgroup (test for interaction, P = 0.006; Fig. 3).
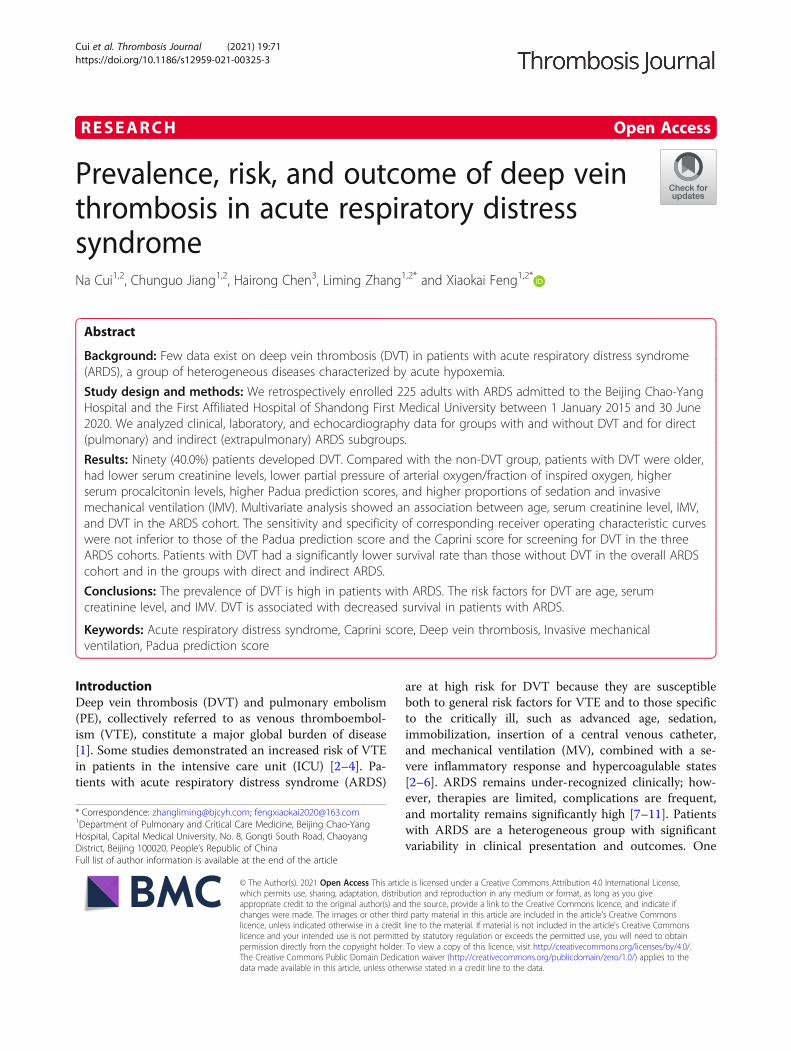
Comparison of diagnostic accuracy for screening for DVTof different ROCs in three ARDS cohortsWe propose three new ways of combining forecastingmodels for screening for DVT based on the significantrisk factors. The sensitivity and specificity of the corre-sponding ROC curves of the proposed models were notinferior to those of the Padua prediction score and theCaprini score for screening for DVT (Fig. 4 A - C).
Survival curves for patients with and without DVT inthree ARDS cohortsKaplan-Meier survival curves showed that patients withDVT had a significantly lower survival rate within 28days after ARDS than patients without DVT, not only inthe overall ARDS cohort but also in the direct and indir-ect ARDS groups (P < 0.001 [Fig. 5A]; P = 0.004 [Fig.5B]; and P = 0.007 [Fig. 5C], respectively).
The 28-day cumulative incidence rate of DVT in ARDS andnon-ARDS patientsTo further explore the incidence rate of DVT in patientswith ARDS in ICU, we selected non-ARDS patients (n =266) in ICU during the same period consecutively (withthe same exclusion criteria as for the ARDS group) ascontrols (Fig. 6). The 28-day cumulative incidence rate(95% CI) of DVT in patients with ARDS and non-ARDSwere 40.2% (33.8, 46.6%) and 15.2% (10.5, 19.9%) re-spectively. Fine-Gray test showed that the 28-day cumu-lative incidence of DVT in ARDS group was significantlyhigher than that in non-ARDS group (P < 0.001). Inaddition, the 28-day mortality in ARDS group was sig-nificantly higher than that in non-ARDS group(P < 0.001).
DiscussionWe eventually enrolled 225 patients with ARDS in thisstudy, 111 of whom had direct ARDS and 114 had indir-ect ARDS. The prevalence of DVT on ultrasound scansin the overall group of patients with ARDS was as highas 40.0%, followed by an undifferentiated prevalence be-tween the cohorts with direct and indirect ARDS (39.6%vs 40.4%, P = 0.913). Advanced age, serum creatininelevel, and IMV were independently associated with DVTin the overall ARDS group as well as in the direct ARDScohort. In the indirect ARDS cohort, however, increasedDVT was only associated with advanced age and IMV.Patients with DVT had more adverse outcomes thanthose without DVT, not only in the overall ARDS cohortbut also in the direct and indirect ARDS groups.To the best of our knowledge, this research is the
earlier systematic description of DVT in patients withARDS and of distinct associations among clinicalcharacteristics and DVT in patients with direct andindirect ARDS.
Table 5 Independent Predictors of Deep Vein Thrombosis in Patients with Direct and Indirect Acute Respiratory Distress Syndrome
Characteristics Total ARDS (N = 225) Direct ARDS (N = 111) Indirect ARDS (N = 114) P Value forInteractionWith ARDSType
Adjusted OR (95%CI)
Pvalue
Adjusted OR (95%CI)
Pvalue
Adjusted OR (95%CI)
Pvalue
Age (per 10 years) 1.422 (1.147–1.763) 0.001 1.504 (1.025–2.207) 0.037 1.410 (1.070–1.856) 0.015 0.030
Serum creatinine (per 10 μmol/L)
0.939 (0.908–0.970) < 0.001 0.857 (0.789–0.930) < 0.001 0.971 (0.936–1.008) 0.120 0.006
Procalcitonin (ng/mL) 1.033 (0.997–1.070) 0.071 1.035 (0.975–1.099) 0.264 1.035 (0.989–1.084) 0.134
D-dimer (μg/ml) 1.065 (0.985–1.151) 0.114 1.059 (0.852–1.317) 0.606 1.056 (0.971–1.149) 0.205
PaO2/FiO2 0.996 (0.990–1.002) 0.223 0.996 (0.986–1.006) 0.453 0.995 (0.987–1.004) 0.295
IMV 3.168 (1.579–6.356) 0.001 5.272 (1.536–18.100) 0.008 2.787 (1.144–6.792) 0.024
Multivariable logistic regression was performed in the overall ARDS cohort and then in the direct ARDS and indirect ARDS groups separately. The interactions ofARDS type (direct or indirect) with age, serum creatinine level, level of procalcitonin, level of D-dimer, PaO2/FiO2, and IMV were included in the regression analysisAbbreviations: ARDS acute respiratory distress syndrome, CI confidence interval, DVT deep venous thrombosis, FiO2 fraction of inspired oxygen, IMV invasivemechanical ventilation, OR odds ratio, PaO2 partial pressure of arterial oxygen
Cui et al. Thrombosis Journal (2021) 19:71 Page 8 of 15

Prevalence of DVT in patients with ARDSIn 2002, Greets et al. reported that the rates of object-ively confirmed DVT in 4 prospective studies rangedfrom 13 to 31% [27]. In recent years, some researchshowed that, despite the use of guideline-recommended
thromboprophylaxis, the incidence of DVT is still ashigh as 14 to 37.2% in critically ill patients [2, 3]. Zhanget al. reported that the cumulative incidence of VTE at7, 14, 21, and 28 days was 4.45, 7.14, 7.53, and 9.55%, re-spectively, in patients admitted to ICUs in China, even
Fig. 2 Prevalence of DVT increased with age in patients with ARDS. The prevalence of DVT increased with age in patients with both direct (redline) and indirect ARDS (blue line). However, the occurrence of DVT increased more significantly with increasing age in the direct ARDS than inthe indirect ARDS group (test for interaction; P = 0.030). Data are adjusted for level of serum creatinine, procalcitonin levels, D- dimer levels, PaO2/FiO2, and invasive mechanical ventilation. Abbreviations: ARDS, acute respiratory distress syndrome; DVT, deep vein thrombosis; FiO2, fraction ofinspired oxygen; PaO2, partial pressure of arterial oxygen
Fig. 3 Prevalence of DVT decreased with serum creatinine levels only in the direct ARDS group. The occurrence of DVT in the direct ARDS group(red line) decreased with increasing serum creatinine levels, whereas serum creatinine levels had no association with DVT in the indirect ARDSgroup (blue line; test for interaction, P = 0.006). Data are adjusted for age, procalcitonin levels, D-dimer levels, PaO2/FiO2, and invasive mechanicalventilation. Abbreviations: ARDS, acute respiratory distress syndrome; DVT, deep vein thrombosis; FiO2, fraction of inspired oxygen; PaO2, partialpressure of arterial oxygen
Cui et al. Thrombosis Journal (2021) 19:71 Page 9 of 15
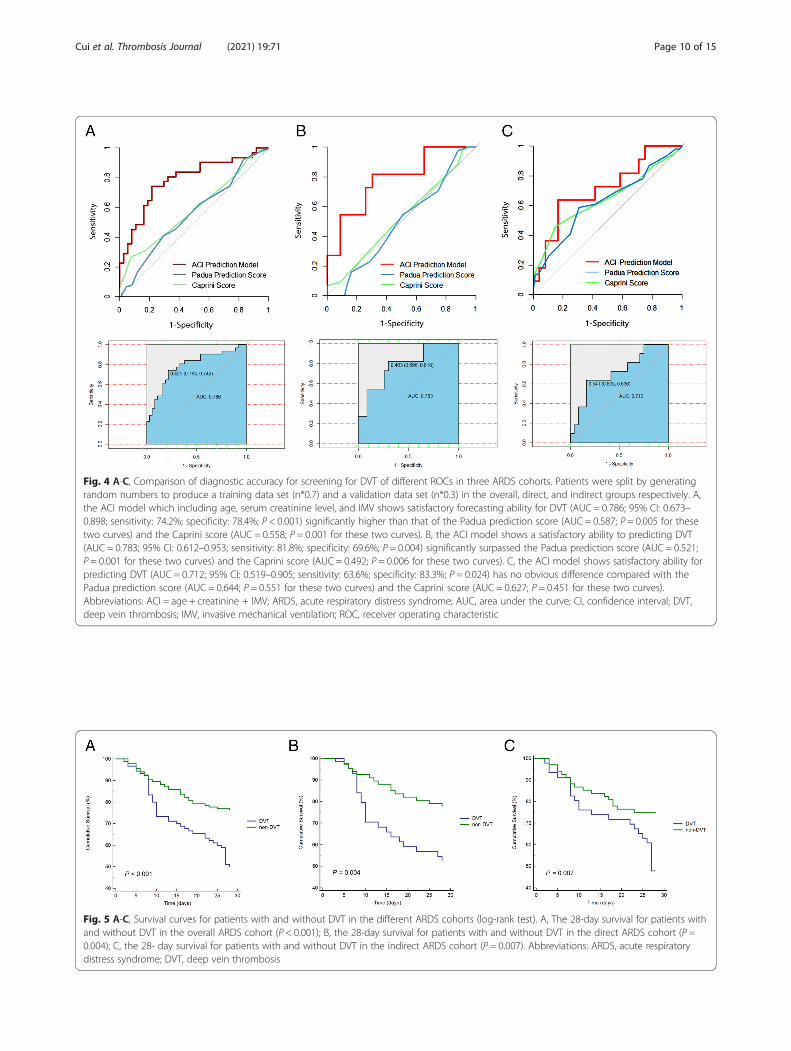
Fig. 4 A-C, Comparison of diagnostic accuracy for screening for DVT of different ROCs in three ARDS cohorts. Patients were split by generatingrandom numbers to produce a training data set (n*0.7) and a validation data set (n*0.3) in the overall, direct, and indirect groups respectively. A,the ACI model which including age, serum creatinine level, and IMV shows satisfactory forecasting ability for DVT (AUC = 0.786; 95% CI: 0.673–0.898; sensitivity: 74.2%; specificity: 78.4%; P < 0.001) significantly higher than that of the Padua prediction score (AUC = 0.587; P = 0.005 for thesetwo curves) and the Caprini score (AUC = 0.558; P = 0.001 for these two curves). B, the ACI model shows a satisfactory ability to predicting DVT(AUC = 0.783; 95% CI: 0.612–0.953; sensitivity: 81.8%; specificity: 69.6%; P = 0.004) significantly surpassed the Padua prediction score (AUC = 0.521;P = 0.001 for these two curves) and the Caprini score (AUC = 0.492; P = 0.006 for these two curves). C, the ACI model shows satisfactory ability forpredicting DVT (AUC = 0.712; 95% CI: 0.519–0.905; sensitivity: 63.6%; specificity: 83.3%; P = 0.024) has no obvious difference compared with thePadua prediction score (AUC = 0.644; P = 0.551 for these two curves) and the Caprini score (AUC = 0.627; P = 0.451 for these two curves).Abbreviations: ACI = age + creatinine + IMV; ARDS, acute respiratory distress syndrome; AUC, area under the curve; CI, confidence interval; DVT,deep vein thrombosis; IMV, invasive mechanical ventilation; ROC, receiver operating characteristic
Fig. 5 A-C, Survival curves for patients with and without DVT in the different ARDS cohorts (log-rank test). A, The 28-day survival for patients withand without DVT in the overall ARDS cohort (P < 0.001); B, the 28-day survival for patients with and without DVT in the direct ARDS cohort (P =0.004); C, the 28- day survival for patients with and without DVT in the indirect ARDS cohort (P = 0.007). Abbreviations: ARDS, acute respiratorydistress syndrome; DVT, deep vein thrombosis
Cui et al. Thrombosis Journal (2021) 19:71 Page 10 of 15

though the patients received guideline-recommendedthromboprophylaxis [4]. Several factors probably ac-count for the notably higher prevalence of DVT in ourpatients. First, most of the previously mentioned studiesfocused on critically ill patients who were in the ICU fordifferent diseases. ARDS is a more serious type of criticalillness that shows an overwhelming systemic inflamma-tory process accompanied by alveolar epithelial and vas-cular endothelial injury and an abnormal bloodcoagulation mechanism associated with significant deathand may have a higher risk of DVT. We compared the28-day cumulative incidence of DVT between ARDSgroup and non-ARDS group and found a significantlyhigher incidence of DVT in ARDS group than that innon-ARDS group. Multiple studies have also suggestedthat the incidence of DVT in patients with ARDS forcoronavirus disease 2019 or influenza A (H1N1) was ashigh as 42.2 to 85.4% [28–31]. These conditions indicatethat direct ARDS itself may be a risk factor for DVT. Asthe results shown, both direct and indirect ARDS hadextremely high incidence rates of DVT. Second, someresearchers defined VTE as a pulmonary embolism,proximal DVT, and/or symptomatic distal DVT, therebyexcluding asymptomatic isolated distal DVT, whichcould probably be identified only by screening ultra-sound [3]. Furthermore, the heterogeneous patient pop-ulations, such as those with different primary conditions,different numbers of days in the hospital, and differentpreventive measures, may represent a variety incidence.In recent years, a study of COVID-19 showed a low
proportion (14.7%, 23/156) of asymptomatic DVT in acohort of patients admitted in non-ICUs [32]. The inci-dence is similar to that reported in other studies aboutasymptomatic DVT in internal medicine settings andorthopedic surgery settings [33, 34]. Compared withthese studies above, the incidence of asymptomatic DVT
in ARDS was higher in our study. Also of note is the dis-tal DVT rate (92.2%, 83/90) in patients with ARDSwould be significantly higher than that reported in manyother hospitalized patients (24.4%, 202/831) [35]. Fromthis article, the conclusions drawn are high proximalDVT or PE recurrent rates (7.9%,16/202) and high mor-tality (52/202, 25.7%) after isolated distal DVT. So, weought to pay more attention to the distal DVT in pa-tients with ARDS in order to reduce the mortality.
Risk factors for DVT in patients with ARDSAdvanced age is a well-recognized risk factor for DVTin hospitalized patients, especially in critically ill pa-tients, which has been included in a variety of throm-bosis prevention scoring systems [22, 23]. As expected,in this study, the independent association of increasedDVT with advanced age was found in both the directand indirect ARDS cohorts. Interestingly, however, thecontribution of advanced age to DVT differed in the dif-ferent ARDS cohorts. The prevalence of DVT increasedmore significantly with advancing age in patients withdirect ARDS than in those with indirect ARDS. The rea-son for this phenomenon may be partly, as previousstudies have shown [14, 36] that, in our study, the pa-tients in the indirect ARDS group also displayed moresevere disease (higher APACHE II scores and higherSOFA scores) than those in the direct ARDS group, sothe effect of advanced age on the overall condition of in-direct ARDS was relatively small.We found an independent association between serum
creatinine levels and DVT in our patients. To our know-ledge, however, this study earlier assessed the differencesin DVT related to renal function in ARDS by direct orindirect etiology. We found that the independent associ-ation between the serum creatinine level and the inci-dence of DVT in ARDS is modified by the underlying
Fig. 6 The 28-day cumulative incidence curves of DVT in ICU patients with and without ARDS. Fine-Gray test showed that the 28-day cumulativeincidence of DVT and the 28-day mortality in ARDS group were significantly higher than that in non-ARDS group (P < 0.001 for both).Abbreviations: ARDS, acute respiratory distress syndrome; DVT, deep vein thrombosis; ICU, intensive care unit
Cui et al. Thrombosis Journal (2021) 19:71 Page 11 of 15

ARDS risk factors, with the protective effect on DVT ofhigher levels of serum creatinine being limited to pa-tients with direct ARDS. However, we did not find a cor-relation between serum creatinine level and DVT inpatients with indirect ARDS, which may be due to themore serious renal impairment and coagulation dysfunc-tion in indirect ARDS, thus weakening the correlationbetween these two factors. Renal function was associatedwith dysregulation in coagulation in proportion to theseverity of the renal impairment [37]. Some studies havedemonstrated that chronic kidney disease and acute kid-ney injury (AKI) are independent risk factors for VTE[38, 39]. Al-Dorzi et al. pointed out that, for critically illpatients, neither AKI nor end-stage renal disease was anindependent risk factor for VTE [40]. McMahon et al.reported that AKI increases the risk for hospitalization-related VTE in a large, heterogeneous population thatincludes medical and surgical patients. However, this re-lationship was not seen in patients with traumatic injur-ies [41]. Some studies have shown that LWMH mayhave different levels of bioaccumulation in the case ofrenal insufficiency [42, 43]. The study by Cook et al. in-dicated that the incidence of DVT for patients with renalinsufficiency in ICU who received dalteparin 5000 IUonce daily was 5.1% [44], which was far lower than thatin the overall population of critically ill patients who re-ceived preventive treatment recommended by the guide-lines [2–4]. So, we speculate that the same dose ofLWMH may play a stronger role in the prevention ofDVT in the case of renal insufficiency. Unfortunately,due to the retrospective nature of the study, the decreaseof LWMH metabolism in patients with AKI and higherlevel of serum creatinine was based on the conjecture ofclinical data analysis, and we did not detect the activityof anti-factor Xa.ARDS is a clinical syndrome with high mortality mani-
fested by severe acute hypoxemia, which usually requiresMV, especially IMV [8]. With IMV, sedation andimmobilization are often performed simultaneously, whichwould aggravate blood stasis and increase the risk of DVT.Some studies have shown that IMV is a high-risk factor forDVT [29, 45]. Knudso et al. pointed out that IMV adminis-tered for more than 3 days is an independent risk factor forVTE [46]. As the duration of IMV increased, the risk ofDVT increased [3]. Our research showed that both IMVand sedation were risk factors for DVT. Because all sedatedpatients in our study were treated with IMV, we only in-cluded IMV in the multivariate regression analysis. The re-sults showed that IMV was an independent risk factor forDVT in both direct and indirect ARDS cohorts. However,in this study, compared with patients in the non-DVTgroup, the duration of IMV in the DVT group did not in-crease significantly, possibly because our small number ofcases resulted in no statistically significant difference.
In direct and indirect ARDS cohorts, neither the APA-CHE II score nor the SOFA score was associated withthe occurrence of DVT, presumably because the serumcreatinine level, which was negatively correlated with theoccurrence of DVT, was included in these two scoringsystems [24, 25], thus weakening the correlation betweenseverity scores and DVT.
Different ROCs for screening for DVT in ARDS cohortsDifferences in predictors of DVT between direct and in-direct ARDS partly support the growing body of litera-ture suggesting that there are subphenotypes of ARDSthat affect clinical outcomes [12–14, 16]. Our resultssuggest that subgroup analyses of ARDS are probablybeneficial for stratifying and predicting the risk of DVT.We used age, IMV, and serum creatinine levels to pre-dict DVT in the overall and the direct and indirectARDS cohorts, respectively, and found that, in ARDS,the combined application of these indicators was not in-ferior to the current commonly used thrombus predic-tion scores, such as the Padua prediction score [23] andthe Caprini score [22], for screening for DVT. Especiallyfor direct ARDS, the combination of age, IMV, andserum creatinine level yielded a sensitivity of 81.8% anda specificity of 69.6% for scanning for DVT. A possiblereason is that the Padua prediction score and theCaprini score apply to the general medical and surgicalpatients in the hospital. As a serious clinical patho-physiological syndrome with an overwhelming inflam-matory response and coagulation abnormalities, ARDShas unique clinical characteristics and serious complica-tions. The predictive value of the commonly usedthrombus prediction method may be limited to screen-ing for DVT in a patient with a critical illness such asARDS.
Prognosis of DVT in patients with ARDSSimilar to the results of some previous studies [30, 47,48], our results showed that DVT was associated withadverse outcomes in all the ARDS cohorts. Althoughthere was no significant difference between length ofstay in hospital and length of stay in ICU, Kaplan-Meiercurves showed that the 28-day survival rate of patientswith DVT was significantly lower than that of patientswithout DVT in all the ARDS cohorts. To validate theprognosis of DVT in patients with ARDS, we furtherplotted 28-day cumulative incidence curve of DVT, withdeath as the competitive risk, and found that the mortal-ity increased with increasing incidence of DVT. The re-lationship between inflammation and thrombosis hasbeen identified in different clinical scenarios where theinflammatory process and coagulation abnormalities areclearly interlinked [49, 50]. The high incidence of DVTin ARDS may be a manifestation of a severe
Cui et al. Thrombosis Journal (2021) 19:71 Page 12 of 15

inflammatory response with significant coagulation andfibrinolytic dysfunction [50]. In addition, there is a 50%chance for patients with untreated proximal DVT to de-velop symptomatic PE within 3 months [51]. PE mightaggravate the hypoxemia of ARDS patients and then re-sult in lower actuarial survival rates. If there was anyclinical suspicion of PE, a CTPA would be consideredand obtained, if possible. Unfortunately, due to the crit-ical condition of ARDS patients, CTPA examination wasrestricted. We only underwent CTPA examination on 3patients with highly suspected PE and diagnosed withPE, which significantly underestimated the incidence ofPE. The presence of PE associated with DVT may alsobe a cause of poor survival in patients with DVT.Our study has some limitations. First, our sample size
was small, which may underestimate the influence onDVT of factors such as obesity, being bedridden, and theinsertion of a central venous catheter. Second, some pa-tients had ultrasound scans only in the early stage ofARDS and did not have continuous dynamic monitoring,which may cause the incidence of DVT to be underesti-mated. Third, due to the critical condition of patientswith ARDS, CTPA examinations were restricted. Weperformed CTPA examinations on only 3 patients with ahigh suspicion of PE and then confirmed the diagnosisof PE, which significantly underestimated the incidenceof PE. Finally, this study is a retrospective study. Wehope to conduct a prospective larger cohort to furtherclarify the incidence of DVT in patients with differentsubtypes of ARDS, to determine the corresponding riskfactors, and to explore optimized individualized prevent-ive measures in the case of ARDS to reduce DVT-related adverse prognoses.
ConclusionsThe incidence of DVT is extremely high in patients withARDS and may be associated with adverse outcomes.The risk factors for DVT are age, serum creatinine level,and IMV in ARDS. We suspect that DVT is probably anadditional risk factor for the death of ARDS in hospital-ized patients. The classification and analysis of ARDSmay help to provide more accurate screening for DVTand risk stratification and lead to corresponding mea-sures to improve the clinical outcome of patients withARDS.
AbbreviationsAKI: Acute kidney injury; APACHE: Acute Physiology and Chronic HealthEvaluation; ARDS: Acute respiratory distress syndrome; AUC: Area under thecurve; CI: Confidence interval; CTPA: Computed tomography pulmonaryangiography; DVT: Deep vein thrombosis; FiO2: Fraction of inspired oxygen;ICU: Intensive care unit; IMV: Invasive mechanical ventilation;IQR: Interquartile range; MV: Mechanical ventilation; OR: Odds ratio;PaO2: Partial pressure of arterial oxygen; PCT: Procalcitonin; PE: Pulmonaryembolism; ROC: Receiver operating characteristic; SD: Standard deviation;SOFA: Sequential Organ Failure Assessment; VTE: Venous thromboembolism
AcknowledgementsWe would like to thank the following doctors for taking part in the diagnosisand treatment of patients with ARDS: Jing Wang, Ling Wang, Jun Zhang andSong Mi from the Department of Pulmonary and Critical Care Medicine,Beijing Chao-Yang Hospital, Capital Medical University, Beijing, People’s Re-public China.
Authors’ contributionsNC designed the study, collected clinical data, analyzed the data, and wrotethe manuscript. CJ and HC collected clinical data. XF and LZ helped managethe research, performed the statistical analyses, and revised the paper. XFand LZ contributed equally to this article and share correspondingauthorship. All authors read and approved the final manuscript.
FundingThis work was supported by the Research on prevention and control ofmajor chronic noncommunicable diseases of China (Grant NO.2016YFC1304603 to Dr. Xiaokai Feng).
Availability of data and materialsAll data analyzed during the study are presented in the main manuscript.The anonymous dataset is available from the corresponding author uponreasonable request.
Declarations
Ethics and approval and consent to participateThis retrospective study involving human participants was approved by theethics committee of the Beijing Chao-Yang Hospital, Capital Medical Univer-sity (2020-ke-429) and the First Affiliated Hospital of Shandong First MedicalUniversity (S003) and was conducted in accordance with the 1964 HelsinkiDeclaration and its later amendments or comparable ethical standards.
Consent for publicationNot applicable.
Competing interestsThe authors declare that they have no competing interests.
Author details1Department of Pulmonary and Critical Care Medicine, Beijing Chao-YangHospital, Capital Medical University, No. 8, Gongti South Road, ChaoyangDistrict, Beijing 100020, People’s Republic of China. 2Beijing Institute ofRespiratory Medicine, Beijing 100020, People’s Republic of China.3Department of Intensive Care Unit, Shandong Provincial QianfoshanHospital, The First Affiliated Hospital of Shandong First Medical University,Ji’nan, People’s Republic of China.
Received: 19 June 2021 Accepted: 3 October 2021
References1. Di Nisio M, van Es N, Büller HR. Deep vein thrombosis and pulmonary
embolism. Lancet. 2016;388(10063):3060–73. https://doi.org/10.1016/S0140-6736(16)30514-1.
2. Gibson CD, Colvin MO, Park MJ, Lai Q, Lin J, Negassa A, et al. Prevalenceand predictors of deep vein thrombosis in critically ill medical patients whounderwent diagnostic duplex ultrasonography. J Intensive Care Med. 2020;35(10):1062–6. https://doi.org/10.1177/0885066618813300.
3. Kaplan D, Casper TC, Elliott CG, Men S, Pendleton RC, Kraiss LW, et al. VTEincidence and risk factors in patients with severe sepsis and septic shock.Chest. 2015;148(5):1224–30. https://doi.org/10.1378/chest.15-0287.
4. Zhang C, Zhang Z, Mi J, Wang X, Zou Y, Chen X, et al. The cumulativevenous thromboembolism incidence and risk factors in intensive carepatients receiving the guideline-recommended thromboprophylaxis.Medicine (Baltimore). 2019;98(23):e15833. https://doi.org/10.1097/MD.0000000000015833.
5. Chang JC. Acute respiratory distress syndrome as an organ phenotype ofvascular microthrombotic disease: based on hemostatic theory andendothelial molecular pathogenesis. Clin Appl Thromb Hemost. 2019;25:1076029619887437. https://doi.org/10.1177/1076029619887437.
Cui et al. Thrombosis Journal (2021) 19:71 Page 13 of 15

6. Gando S, Kameue T, Matsuda N, Sawamura A, Hayakawa M, Kato H.Systemic inflammation and disseminated intravascular coagulation in earlystage of ALI and ARDS: role of neutrophil and endothelial activation.Inflammation. 2004;28(4):237–44. https://doi.org/10.1023/B:IFLA.0000049049.81688.fe.
7. Fan E, Brodie D, Slutsky AS. Acute respiratory distress syndrome: advances indiagnosis and treatment. JAMA. 2018;319(7):698–710. https://doi.org/10.1001/jama.2017.21907.
8. Definition Task Force ARDS, Ranieri VM, Rubenfeld GD, et al. Acuterespiratory distress syndrome: the Berlin definition. JAMA. 2012;307(23):2526–33.
9. Bellani G, Laffey JG, Pham T, Fan E, Brochard L, Esteban A, et al.Epidemiology, patterns of care, and mortality for patients with acuterespiratory distress syndrome in intensive care units in 50 countries. JAMA.2016;315(8):788–800. https://doi.org/10.1001/jama.2016.0291.
10. Eworuke E, Major JM, Gilbert McClain LI. National incidence rates for acuterespiratory distress syndrome (ARDS) and ARDS cause-specific factors in theUnited States (2006- 2014). J Crit Care. 2018;47:192–7. https://doi.org/10.1016/j.jcrc.2018.07.002.
11. Li S, Zhao D, Cui J, Wang L, Ma X, Li Y. Prevalence, potential risk factors andmortality rates of acute respiratory distress syndrome in Chinese patientswith sepsis. J Int Med Res. 2020;48(2):300060519895659. https://doi.org/10.1177/0300060519895659.
12. Shaver CM, Bastarache JA. Clinical and biological heterogeneity in acuterespiratory distress syndrome: direct versus indirect lung injury. Clin ChestMed. 2014;35(4):639–53. https://doi.org/10.1016/j.ccm.2014.08.004.
13. Anan K, Kawamura K, Suga M, Ichikado K. Clinical differences betweenpulmonary and extrapulmonary acute respiratory distress syndrome: aretrospective cohort study of prospectively collected data in Japan. J ThoracDis. 2018;10(10):5796–803. https://doi.org/10.21037/jtd.2018.09.73.
14. Luo L, Shaver CM, Zhao Z, Koyama T, Calfee CS, Bastarache JA, et al. Clinicalpredictors of hospital mortality differ between direct and indirect ARDS.Chest. 2017;151(4):755–63. https://doi.org/10.1016/j.chest.2016.09.004.
15. Morisawa K, Fujitani S, Taira Y, et al. Difference in pulmonary permeabilitybetween indirect and direct acute respiratory distress syndrome assessed bythe transpulmonary thermodilution technique: a prospective, observational,multi-institutional study. J Intensive Care. 2014;2(1):24. https://doi.org/10.1186/2052-0492-2-24.
16. Calfee CS, Janz DR, Bernard GR, May AK, Kangelaris KN, Matthay MA, et al.Distinct molecular phenotypes of direct vs indirect ARDS in single-centerand multicenter studies. Chest. 2015;147(6):1539–48. https://doi.org/10.1378/chest.14-2454.
17. Perl M, Lomas-Neira J, Venet F, Chung CS, Ayala A. Pathogenesis of indirect(secondary) acute lung injury. Expert Rev Respir Med. 2011;5(1):115–26.https://doi.org/10.1586/ers.10.92.
18. Gong MN, Wei Z, Xu LL, Miller DP, Thompson BT, Christiani DC.Polymorphism in the surfactant protein-B gene, gender, and the risk ofdirect pulmonary injury and ARDS. Chest. 2004;125(1):203–11. https://doi.org/10.1378/chest.125.1.203.
19. Pelosi P, D'Onofrio D, Chiumello D, et al. Pulmonary and extrapulmonaryacute respiratory distress syndrome are different. Eur Respir J Suppl. 2003;42:48s–56s.
20. Rudski LG, Lai WW, Afilalo J, et al. Guidelines for the echocardiographicassessment of the right heart in adults: a report from the American Societyof Echocardiography endorsed by the European Association ofEchocardiography, a registered branch of the European Society ofCardiology, and the Canadian Society of Echocardiography. J Am SocEchocardiogr. 2010;23(7):685–713 quiz 786-8.
21. Singer M, Deutschman CS, Seymour CW, Shankar-Hari M, Annane D, BauerM, et al. The third international consensus definitions for Sepsis and septicshock (Sepsis-3). JAMA. 2016;315(8):801–10. https://doi.org/10.1001/jama.2016.0287.
22. Cronin M, Dengler N, Krauss ES, Segal A, Wei N, Daly M, et al. Completion ofthe updated Caprini risk assessment model (2013 version). Clin ApplThromb Hemost. 2019;25:1076029619838052. https://doi.org/10.1177/1076029619838052.
23. Barbar S, Noventa F, Rossetto V, et al. A risk assessment model for theidentification of hospitalized medical patients at risk for venousthromboembolism: the Padua prediction score. J Thromb Haemost. 2010;8(11):2450–7. https://doi.org/10.1111/j.1538-7836.2010.04044.x.
24. Knaus WA, Draper EA, Wagner DP, Zimmerman JE. APACHE II: A severity ofdisease classification system. Crit Care Med. 1985;13(10):818–29. https://doi.org/10.1097/00003246-198510000-00009.
25. Lambden S, Laterre PF, Levy MM, Francois B. The SOFAscore—development, utility and challenges of accurate assessment inclinical trials. Crit Care. 2019;23(1):374. https://doi.org/10.1186/s13054-019-2663-7.
26. DeLong ER, DeLong DM, Clarke-Pearson DL. Comparing the areas undertwo or more correlated receiver operating characteristic curves: anonparametric approach. Biometrics. 1988;44(3):837–45. https://doi.org/10.2307/2531595.
27. Geerts W, Cook D, Selby R, Etchells E. Venous thromboembolism and itsprevention in critical care. J Crit Care. 2002;17(2):95–104. https://doi.org/10.1053/jcrc.2002.33941.
28. Chen S, Zhang D, Zheng T, Yu Y, Jiang J. DVT incidence and risk factors incritically ill patients with COVID-19. J Thromb Thrombolysis. 2021;51(1):33–9.https://doi.org/10.1007/s11239-020-02181-w.
29. Ren B, Yan F, Deng Z, Zhang S, Xiao L, Wu M, et al. Extremely highincidence of lower extremity deep venous thrombosis in 48 patients withsevere COVID-19 in Wuhan. Circulation. 2020;142(2):181–3. https://doi.org/10.1161/CIRCULATIONAHA.120.047407.
30. Zhang L, Feng X, Zhang D, Jiang C, Mei H, Wang J, et al. Deep veinthrombosis in hospitalized patients with COVID-19 in Wuhan, China:prevalence, risk factors, and outcome. Circulation. 2020;142(2):114–28.https://doi.org/10.1161/CIRCULATIONAHA.120.046702.
31. Obi AT, Tignanelli CJ, Jacobs BN, Arya S, Park PK, Wakefield TW, et al.Empirical systemic anticoagulation is associated with decreased venousthromboembolism in critically ill influenza a H1N1 acute respiratory distresssyndrome patients. J Vasc Surg Venous Lymphat Disord. 2019;7(3):317–24.https://doi.org/10.1016/j.jvsv.2018.08.010.
32. Demelo-Rodríguez P, Cervilla-Muñoz E, Ordieres-Ortega L, Parra-Virto A,Toledano-Macías M, Toledo-Samaniego N, et al. Incidence of asymptomaticdeep vein thrombosis in patients with COVID-19 pneumonia and elevatedD-dimer levels. Thromb Res. 2020;192:23–6. https://doi.org/10.1016/j.thromres.2020.05.018.
33. Ciuti G, Grifoni E, Pavellini A, Righi D, Livi R, Perfetto F, et al. Incidence andcharacteristics of asymptomatic distal deep vein thrombosis unexpectedlyfound at admission in an internal medicine setting. Thromb Res. 2012;130(4):591–5. https://doi.org/10.1016/j.thromres.2012.05.018.
34. Kassaï B, Boissel JP, Cucherat M, Sonie S, Shah NR, Leizorovicz A. Asystematic review of the accuracy of ultrasound in the diagnosis of deepvenous thrombosis in asymptomatic patients. Thromb Haemost. 2004;91(4):655–66. https://doi.org/10.1160/TH03-11-0722.
35. Barco S, Corti M, Trinchero A, Picchi C, Ambaglio C, Konstantinides SV, et al.Survival and recurrent venous thromboembolism in patients with firstproximal or isolated distal deep vein thrombosis and no pulmonaryembolism. J Thromb Haemost. 2017;15(7):1436–42. https://doi.org/10.1111/jth.13713.
36. Sevransky JE, Martin GS, Mendez-Tellez P, Shanholtz C, Brower R, PronovostPJ, et al. Pulmonary vs nonpulmonary sepsis and mortality in acute lunginjury. Chest. 2008;134(3):534–8. https://doi.org/10.1378/chest.08-0309.
37. Dobrowolski C, Clark EG, Sood MM. Venous thromboembolism in chronickidney disease: epidemiology, the role of proteinuria, CKD severity andtherapeutics. J Thromb Thrombolysis. 2017;43(2):241–7. https://doi.org/10.1007/s11239-016-1437-1.
38. Kuo TH, Li HY, Lin SH. Acute kidney injury and risk of deep vein thrombosisand pulmonary embolism in Taiwan: a nationwide retrospective cohortstudy. Thromb Res. 2017;151:29–35. https://doi.org/10.1016/j.thromres.2017.01.004.
39. Christiansen CF, Schmidt M, Lamberg AL, Horváth-Puhó E, Baron JA,Jespersen B, et al. Kidney disease and risk of venous thromboembolism: anationwide population-based case-control study. J Thromb Haemost. 2014;12(9):1449–54. https://doi.org/10.1111/jth.12652.
40. Al-Dorzi HM, Al-Heijan A, Tamim HM, Al-Ghamdi G, Arabi YM. Renal failureas a risk factor for venous thromboembolism in critically ill patients: acohort study. Thromb Res. 2013;132(6):671–5. https://doi.org/10.1016/j.thromres.2013.09.036.
41. McMahon MMJ, Collen CJF, Chung CKK, et al. Acute kidney injury duringhospitalization increases the risk of VTE. Chest. 2021;159(2):772–80. https://doi.org/10.1016/j.chest.2020.09.257.
Cui et al. Thrombosis Journal (2021) 19:71 Page 14 of 15

42. Mahé I, Aghassarian M, Drouet L, Bal Dit-Sollier C, Lacut K, Heilmann JJ, et al.Tinzaparin and enoxaparin given at prophylactic dose for eight days inmedical elderly patients with impaired renal function: a comparativepharmacokinetic study. Thromb Haemost. 2007;97(4):581–6. https://doi.org/10.1160/TH06-09-0513.
43. Schmid P, Brodmann D, Odermatt Y, Fischer AG, Wuillemin WA. Study ofbioaccumulation of dalteparin at a therapeutic dose in patients with renalinsufficiency. J Thromb Haemost. 2009;7(10):1629–32. https://doi.org/10.1111/j.1538-7836.2009.03556.x.
44. Cook D, Douketis J, Meade M, Guyatt G, Zytaruk N, Granton J, et al. Venousthromboembolism and bleeding in critically ill patients with severe renalinsufficiency receiving dalteparin prophylaxis: prevalence, incidence and riskfactors. Crit Care. 2008;12(2):R32. https://doi.org/10.1186/cc6810.
45. Rali P, O'Corragain O, Oresanya L, et al. Incidence of venousthromboembolism in coronavirus disease 2019: An experience from a singlelarge academic center. J Vasc Surg Venous Lymphat Disord. 2020;S2213-333X(20):30524–2.
46. Knudson MM, Ikossi DG, Khaw L, Morabito D, Speetzen LS.Thromboembolism after trauma: an analysis of 1602 episodes from theAmerican College of Surgeons National Trauma Data Bank. Ann Surg. 2004;240(3):490–6; discussion 496-8. https://doi.org/10.1097/01.sla.0000137138.40116.6c.
47. Malato A, Dentali F, Siragusa S, Fabbiano F, Kagoma Y, Boddi M, et al. Theimpact of deep vein thrombosis in critically ill patients: a meta-analysis ofmajor clinical outcomes. Blood Transfus. 2015;13(4):559–68. https://doi.org/10.2450/2015.0277-14.
48. Zerwes S, Hernandez Cancino F, Liebetrau D, Gosslau Y, Warm T, Märkl B,et al. Increased risk of deep vein thrombosis in intensive care unit patientswith CoViD-19 infections?-preliminary data. [article in German]. Chirurg.2020;91(7):588–94. https://doi.org/10.1007/s00104-020-01222-7.
49. van Deventer SJ, Büller HR, ten Cate JW, et al. Experimental endotoxemia inhumans: analysis of cytokine release and coagulation, fibrinolytic, andcomplement pathways. Blood. 1990;76(12):2520–6. https://doi.org/10.1182/blood.V76.12.2520.2520.
50. Jezovnik MK, Fareed J, Poredos P. Patients with a history of idiopathic deepvenous thrombosis have long-term increased levels of inflammatorymarkers and markers of endothelial damage. Clin Appl Thromb Hemost.2017;23(2):124–31. https://doi.org/10.1177/1076029616670259.
51. Moheimani F, Jackson DE. Venous thromboembolism: classification, riskfactors, diagnosis, and management. ISRN Hematol. 2011;2011:124610–7.https://doi.org/10.5402/2011/124610.
Publisher’s NoteSpringer Nature remains neutral with regard to jurisdictional claims inpublished maps and institutional affiliations.
Cui et al. Thrombosis Journal (2021) 19:71 Page 15 of 15