prevalence of food allergy - ilsi north...
TRANSCRIPT

Prevalence of Food Allergy
Clare Mills, Kirsten Beyer, Peter Burney, Rene Crevel, Erna Botjes, Charlotte
Madsen, Lynn Frewer, Ronald van Ree

Declaration of interests Funding: UK Food Standards Agency UK Biological and Biotechnological Sciences Research Council UK Technology Strategy Board European Union European Food Safety Authority Pepsico International DBV Technology Novartis Solazyme In-kind sponsorship of students Waters Corp Genon Laboratories Campden BRI Spin-out company ReactaBiotech
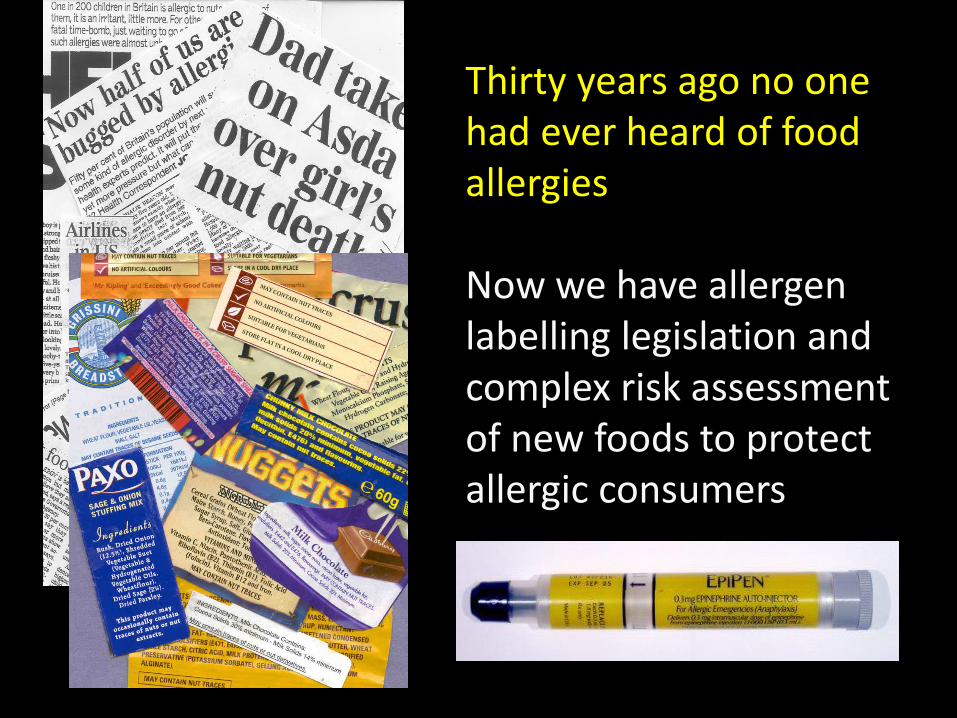
Thirty years ago no one had ever heard of food allergies Now we have allergen labelling legislation and complex risk assessment of new foods to protect allergic consumers

•How many people suffer from food allergy in Europe? •Which are the major foods? •What is the relationship with severity/minimum eliciting doses? •What are the risk factors/causes? •What is the impact of quality of life? •How much does food allergy cost society?
But managing food allergies needs data which have been lacking…………………….

Overall allergy prevalence varied 3-35%!
How many people suffer from food allergy in Europe? …………self-reported symptoms
Studies using challenge procedures for diagnosis had a prevalence of 1-4%

General Conclusions
The rates of food allergy determined in previous studies are HIGHLY HETEROGENEOUS
This is probably due to •Variations in response rates •Variations in diagnostic procedures
Rona RJ, Keil T, Summers C, Gislason D, Zuidmeer L, Sodergren E, et al. J Allergy Clin Immunol 2007;120:638-46. Zuidmeer L, Goldhahn K, Rona RJ, Gislason D, Madsen C, Summers C, et al. J Allergy Clin Immunol 2008;121:1210-8
Only a cohesive study such as EuroPrevall can define the reasons for this heterogeneity
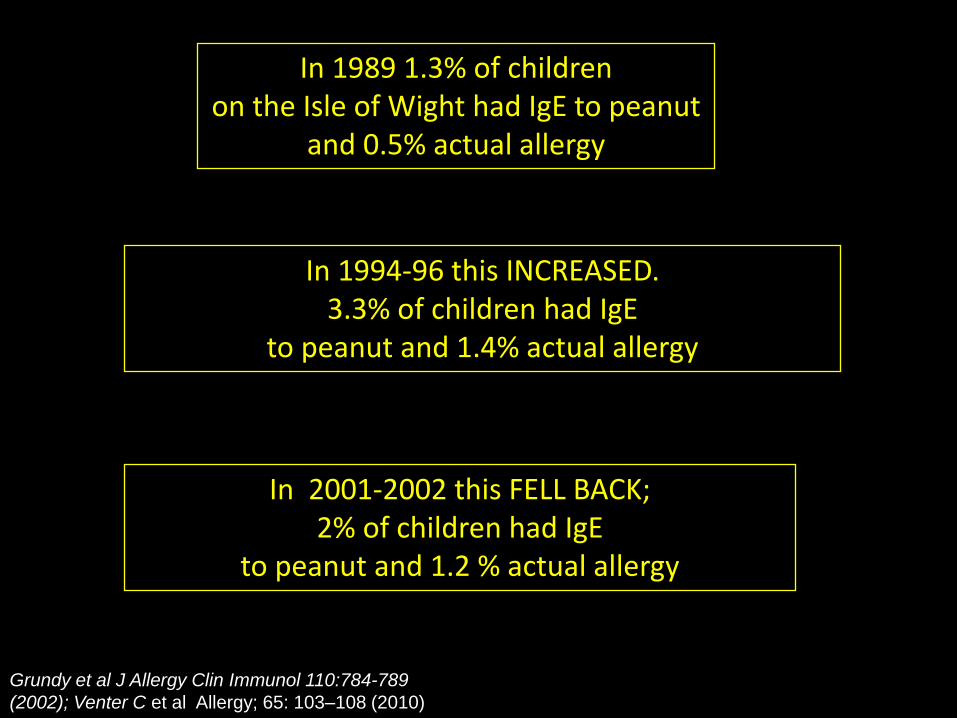
In 1989 1.3% of children on the Isle of Wight had IgE to peanut
and 0.5% actual allergy
In 1994-96 this INCREASED. 3.3% of children had IgE
to peanut and 1.4% actual allergy
Grundy et al J Allergy Clin Immunol 110:784-789
(2002); Venter C et al Allergy; 65: 103–108 (2010)
In 2001-2002 this FELL BACK; 2% of children had IgE
to peanut and 1.2 % actual allergy

Ma n c h e
t
s t e r
e
A
A
s t
d
h
nm a a
l l r g y S u d y
Nicolaou et al J Allergy Clin Immunol 2010;125:191-7
•Of 933 children aged ~12 years, 110 (11.8%) were peanut-sensitized. •Of the 110 children, 12 had a convincing history of peanut allergy and of 79 challenged 7 had objective reactions •The prevalence of clinical peanut allergy is ~2% in this population
Manchester Asthma and Allergy Study

The Prevalence, Cost and Basis of Food Allergy Across Europe (IP, 4 years 7months; €14.3M)
•Investigating environmental, dietary & genetic influences on food allergy. •Delivering information (patterns & prevalence, socioeconomic cost) & new tools to improve management
63 Partners from 23 countries including Europe (UK, NL, D, B, S, F, I, IRL, E, GR, PL, CZ, HU, lT CH, A, DK, IS, BG, RU)Africa (Ghana) and Asia (India, China) with collaborating centres from USA, Canada, NZ and Australia
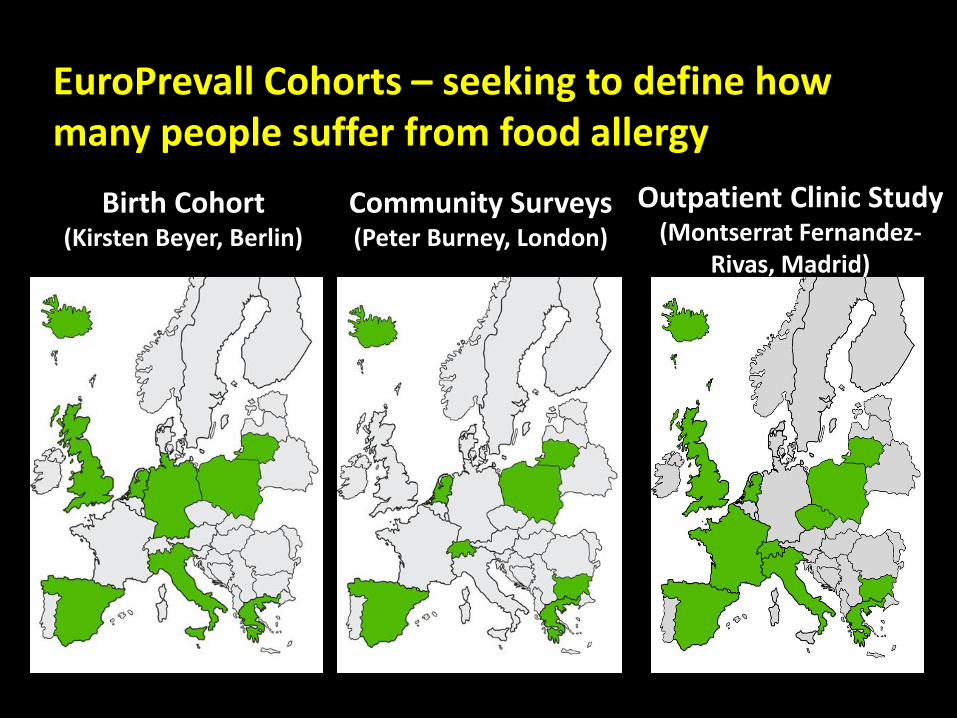
EuroPrevall Cohorts – seeking to define how many people suffer from food allergy
Outpatient Clinic Study (Montserrat Fernandez-
Rivas, Madrid)
Birth Cohort (Kirsten Beyer, Berlin)
Community Surveys (Peter Burney, London)

……and across the world in •Russia (Tomsk) •China (Hong Kong, Beijing) •India (Mysore, Bangalore) (Led by Gary Wong, Hong Kong)
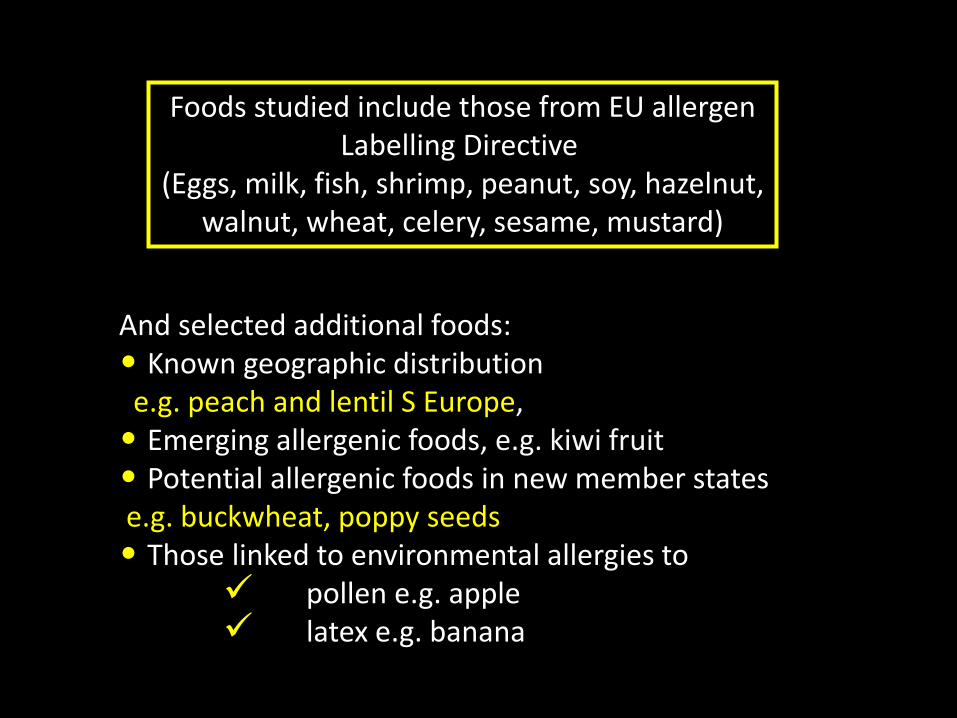
Foods studied include those from EU allergen Labelling Directive
(Eggs, milk, fish, shrimp, peanut, soy, hazelnut, walnut, wheat, celery, sesame, mustard)
And selected additional foods: • Known geographic distribution e.g. peach and lentil S Europe, • Emerging allergenic foods, e.g. kiwi fruit • Potential allergenic foods in new member states e.g. buckwheat, poppy seeds • Those linked to environmental allergies to
pollen e.g. apple latex e.g. banana

DBPCFC: Common protocols and materials for older children and adults Clinical leader: Barbara Ballmer-Weber; Food Materials leader: Alan Mackie
Priority 1 foods blinded in (1) Chocolate desert (stored at room
temp, just add water) (2) Chocolate (peanut, hazelnut only) (3) Puree desert peach and apple
(freshly prepared; no threshold) (4) Burgers and tomato sauce
(shrimp)

Dose 1: designed to give the no observed adverse effect level (NOEL) and : lowest observed adverse effect level (LOAEL) Dose 9: Equivalent to a daily serving
Dose
no
Mass Protein Matrix
dose (%)
Cumulative
Dose
(mass)
1 6µg 3µg 0.0006 6µg
2 60µg 30µg 0.0006 66µg
3 600µg 300µg 0.06 666µg
4 6mg 3mg 0.06 6.67mg
5 60mg 30mg 3 66.67mg
6 0.12g 600mg 3 0.186g
7 0.6g 0.3g 3 0.786g
8 4.5g 2.2g 3 5.286g
9 6g 3g 3 11.286g
Dosing protocol – used for ALL challenges

Child with signs of allergic diseases
SPT Specific IgE
DBPCFC
Patient history
Birth cohort (Kirsten Beyer, Berlin) – final size ~ 12,000

3000 Subjects
x Cases (500-x) Controls
Extended Questionnaire
Serology (IgE)
1: Egg, milk, peanut, soy, wheat, fish 2: Sesame seed, wheat, buckwheat, corn, rice 3: Hazelnut, tomato, walnut, carrot, celery 4: Shrimp, poppy seed, lentil, mustard, sunflower 5: Apple, kiwi, melon, banana, peach
History+/IgE+ History+/IgE- History-/IgE+ History-/IgE-
Clinical evaluation (with DBPCFC) as outpatient clinic study
All Only if workload permits Outcome: • Prevalence • Thresholds • Serum bank
Community Surveys (Peter Burney, London)
IgE determined to: • food mixes • individual foods
N = 1721
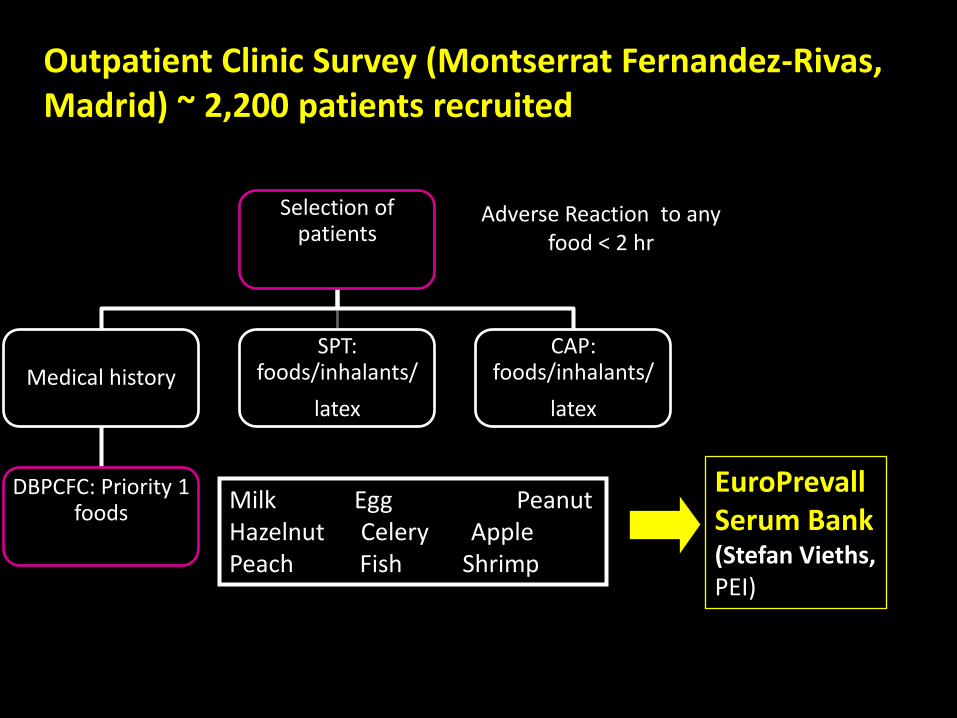
Outpatient Clinic Survey (Montserrat Fernandez-Rivas, Madrid) ~ 2,200 patients recruited
EuroPrevall Serum Bank (Stefan Vieths, PEI)
Adverse Reaction to any food < 2 hr
Selection of patients
Medical history
DBPCFC: Priority 1 foods
SPT: foods/inhalants/
latex
CAP: foods/inhalants/
latex
Milk Egg Peanut Hazelnut Celery Apple Peach Fish Shrimp

EuroPrevall – definitions applied in the cohorts
“Perceived [possible] food allergy” to any foodstuff: reported reactivity collected with the questionnaire.
“Probable food allergy” to the 24 selected foods: reported immediate reactions to a food item and specific
IgE (positive SPT and/or CAP) to the same food.
Screening Questionnaires
Serum IgE +/- SPT, History
“Confirmed food allergy” to the 9 foods selected for DBPCFC: reported immediate reactions together with
specific IgE and a positive DBPCFC (or a positive open food challenge after a negative DBPCFC).
Food Challenge
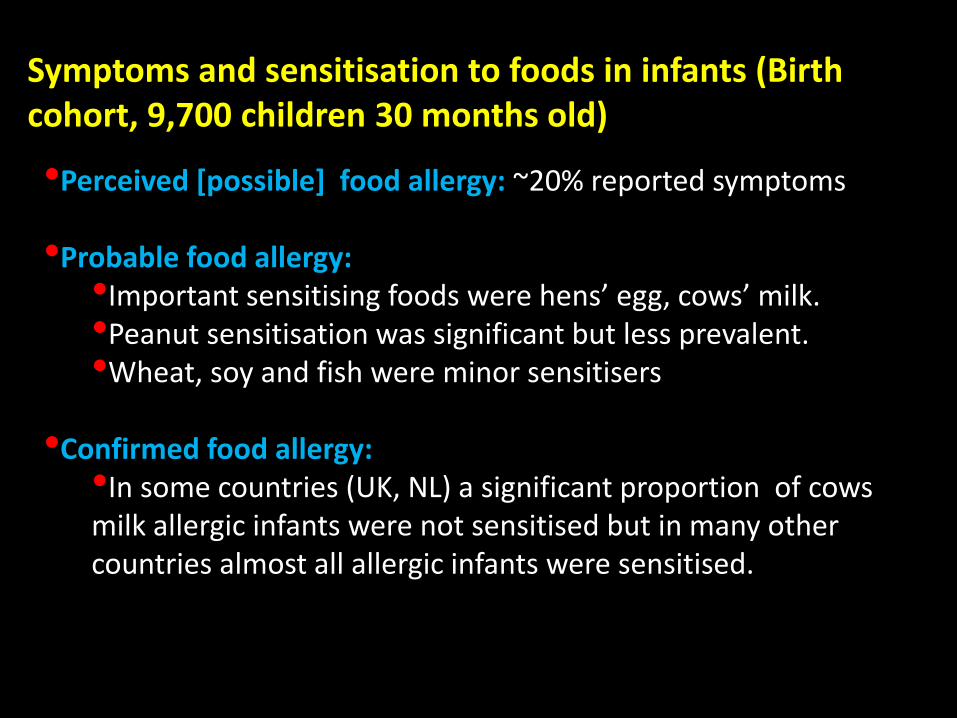
Symptoms and sensitisation to foods in infants (Birth cohort, 9,700 children 30 months old)
•Perceived [possible] food allergy: ~20% reported symptoms
•Probable food allergy: •Important sensitising foods were hens’ egg, cows’ milk. •Peanut sensitisation was significant but less prevalent. •Wheat, soy and fish were minor sensitisers
•Confirmed food allergy: •In some countries (UK, NL) a significant proportion of cows milk allergic infants were not sensitised but in many other countries almost all allergic infants were sensitised.
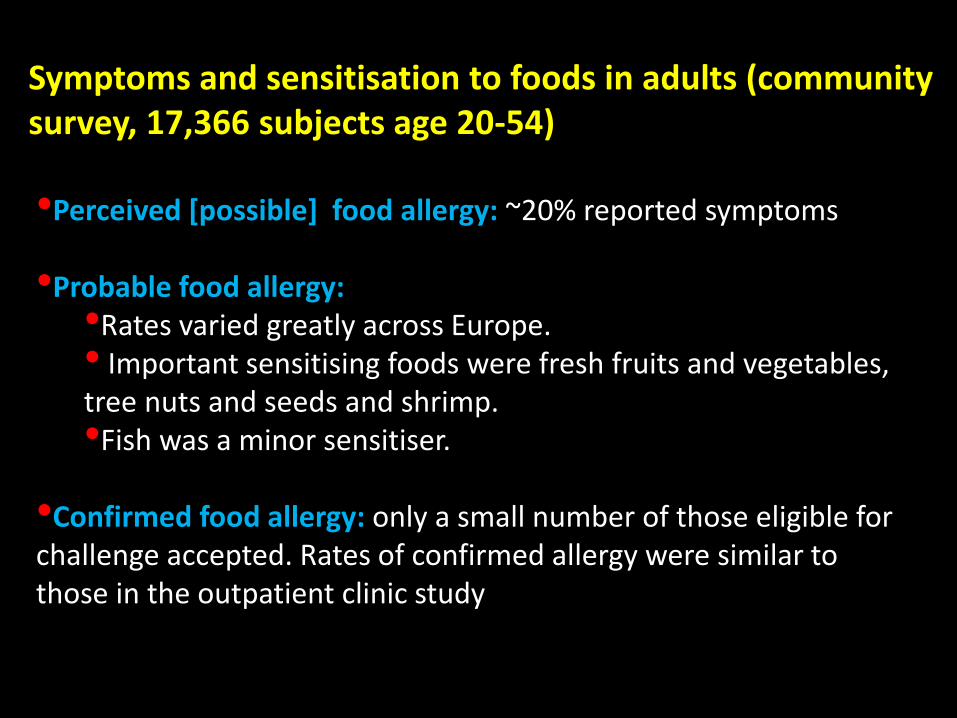
Symptoms and sensitisation to foods in adults (community survey, 17,366 subjects age 20-54)
•Perceived [possible] food allergy: ~20% reported symptoms •Probable food allergy: •Rates varied greatly across Europe. • Important sensitising foods were fresh fruits and vegetables, tree nuts and seeds and shrimp. •Fish was a minor sensitiser.
•Confirmed food allergy: only a small number of those eligible for challenge accepted. Rates of confirmed allergy were similar to those in the outpatient clinic study

DBPCFC: Comparison between outpatient and community studies
42.047.5
10.5
63.6
36.4
0.0
0
10
20
30
40
50
60
70
80
Only subjectiv e Only objectiv e Both
%WP 1.3
WP 1.2
Symptoms
Outcomes
Community study
Outpatient study
56.0
32.1
64.4
20.7
11.914.9
0
10
20
30
40
50
60
70
80
Placebo reactor Reactiv e Tolerant
%
WP 1.3 WP 1.2
p =0.54
p =0.18
p =0.05
n= 461 n= 87
n =258
n= 56

EuroPrevall Threshold Database
Food Total Reactive Tolerant Placebo reactors
% Reactive
Peanut 135 61 61 13 45.2%
Hazelnut 132 91 24 17 68.9%
Fish 50 34 12 4 68%
Shrimp 55 31 19 5 56.4%
Celery 64 41 19 4 64.1%
Apple 71 41 17 13 57.7%
Peach 54 32 13 9 59.3%
Milk 418 146 239 33 34.9%
Egg 314 178 122 14 56.7%

Challenge stopped at dose 8
Urticaria appears transiently
during a challenge (3mg, 0.3g)
At 1g multiple symptoms appear
and the challenge is stopped
Visualising symptoms during an challenge using fish
(Icelandic patient) with freeze-dried cod in chocolate
dessert
Marianne Defernez
710158,Fish,26/05/2009
reactive,Prtc17,wp1.3
Dose number
710222,Fish,25/03/2009
reactive,Prtc17,wp1.3
Dose number
710264,Fish,21/04/2009
reactive,Prtc17,wp1.3
Dose number
4810118,Fish,03/03/2009
reactive,Prtc18,wp1.3
Dose number
4810008,Fish,23/11/2007
reactive,Prtc16,wp1.3
Dose number
4810107,Fish,21/11/2008
reactive,Prtc16,wp1.3
Dose number
4810141,Fish,02/10/2009
reactive,Prtc18,wp1.3
Dose number
1710162,Fish,11/04/2008
reactive,Prtc16,wp1.3
Dose number
4710167,Fish,02/04/2009
reactive,Prtc16,wp1.3
Dose number
4810047,Fish,
reactive,Prtc16,wp1.3
Dose number

Dose-response modelling using Lowest Observed
Adverse Effect Levels (LOAELs) and interval censoring
survival analysis
Total of 135 peanut challenges undertaken in EuroPrevall
•Birth cohort: 60 challenges, 47% reactive, median age 2 years;
•Outpatient clinic study: 75 challenges, 43% reactive, median age 30
years
• Of the reactive population, 9 individuals experienced delayed and
other types of reaction and were excluded from the reference
population
68% of the reference
population (n=51) reacted with objective symptoms
Defernez, Ballmer-Weber, Beyer, Fernandez-Rivas, Hourihane, Mackie, Mills et al

•Dose-response modelling using LOAELs from the combined population (median age 15.6) gave a ED10 value of ~3 mg peanut protein depending (log-normal model). This equates to ~12 mg of peanut seed.
•95% Confidence intervals are wide (0.2, 36)
•This value is similar to the 12.3 (9.0, 16.8 95% confidence intervals) mg of peanut (median age 7) reported previously (Taylor et al Food Chem 2010)
These data indicate that sufficient evidence is becoming available to allow action levels to be set for allergens in foods in the coming years

There are still gaps in our knowledge to allow effective evidence-based allergenic risk assessment We still lack •Effective methods for determining allergens in foods, naturally-incurred reference materials and reference methods
•Data on levels of cross-contact allergens in foods and their distribution
•Information on factors such as the food matrix, exercise, stress, infections and alcohol consumption which may alter thresholds
Any risk assessment/management method will also need validation and verification!

Integrated Approaches to Food Allergen and Allergy Management (iFAAM)
•Developing evidence-based approaches and tools for MANAGEMENT of ALLERGENS in FOOD •Integrating knowledge derived from their application into FOOD ALLERGY MANAGEMENT plans and dietary advice. •The resulting holistic strategies will reduce the burden of food allergies in Europe and beyond whilst enabling the European food industry to compete in the global market place.
36 Partners from 15 countries including Europe (UK, AU, BE, DK, CH, CR, DE, FR, IE, IS,IT, ES, GR, LT, NL,PL,), Turkey and the USA
Coordinated by Professor Clare Mills, University of Manchester

Objective 1: Nutrition and allergy throughout life (Module 1)
•Early life nutrition and allergy •Dietary interventions for allergy prevention
Objective 3: Validated Risk Models (Module 3)
•Modelling allergenic risk •Clinical evidence and validation of models
Objective 5: Delivery of
evidence-based integrated tools for food allergen
and allergy management
across the food chain to key stakeholders
groups (Module 5)
•Biomarkers for severe reactions to food •Intrinsic and extrinsic risk factors
Objective 4: Tools for Allergen Management (Module 4)
•Multi-analyte allergen analysis •Clinically-relevant analysis
INNOVATION, INDUSTRIAL COMPETITIVENESS AND SMEs
Objective 2: Risk factors and severity (Module 2)

iFAAM Stakeholder Engagement Patient Groups and Clinicians •Championed by DAAB with UK, NL and IE patient groups as partners and the European Academy of Allergy and Clinical Immunology (EAACI) facilitating dissemination to the clinical community (through Food Allergy Interest Group and the Dieticians)
Industry •Championed by Unilever with SME partners and Nestle •Industrial platform run by Manchester including all major manufacturers of allergen test kits, analytical service providers, reference laboratories, food manufacturers and retailers.
Risk Assessors and Managers •Championed by DTU to which regulators are being invited including UK FSA, Health Canada, USFDA, FSANZ, EFSA
Delivering harmonised integrated approaches to manage population
risk, ensure consumer protection, food allergy management plans and
dietary advice .

Developing transparent, knowledge-based validated risk assessment strategies will help reduce the use of precautionary statements. This will help consumers and the health professionals who advise them, to make safe food choices!

All only possible through the 63 EuroPrevall partners and collaborating centres
AND those individuals who have participated in the
studies!
MoniQA