pretreatment optimization a key to excellent water chemistry … 2013 presentations/day-2 at...
TRANSCRIPT

PRETREATMENT
OPTIMIZATION
– A Key to Excellent Water Chemistry
By D K Bhargava AGM (Chem) Sandipt Varshney DGM (Chem) Rakesh Tatawat Chemist
WATER REQUIREMENTS IN POWER
PLANTS
CONDENSOR COOLING
AUXILLARY COOLING
FIRE FIGHTING
WATER TREATMENT PLANT
CLARIFIED WATER
DRINKING WATER
DM WATER FOR STEAM GENERATION

SOURCES OF RAW
WATER
SEA/OCEAN
RIVER
CANAL
PONDS
BOREWELL
The properties of water vary depending upon
its source.

Impurities Present
contain variable amounts of Suspended impurities Dissolved solids Organic impurities; These may be due to natural origin or due to
human activities (agriculture, industry, sewage), and these may vary with seasons, thus intake water quality will vary with change of seasons.
Problems due to Organics if not properly removed
in PT process
Some of the problems are: - Fouling of resin in DM plant leading to poor quality of
DM water. Extended rinse time for Anion during regeneration
resulting in lower output. High COD and TOC values of DM water High TOC and COD result in
Formation of organic acids in boiler water High ACC values of feed water & boiler water Boiler Tube Failures
1. 6 Feb 14, 2013
Due to long periods of water storage in reservoir and putrefaction of organic matter, aquatic plants ,leaves and branches of trees that fall in the reservoirs leads to deterioration of water quality. Thus the water received in PT plant contains low oxygen concentration & high load of organic, (COD & TOC values) & colloidal Silica.
Anta receives water from the RMC of river Chambal. Our station has three reservoirs of 20 lac M3 capacity. Reservoir water is enough for 90 to 100 days of power plant operations. Water treatment plant receives water from reservoir through Raw water pump house as per requirement.
Anta Experience
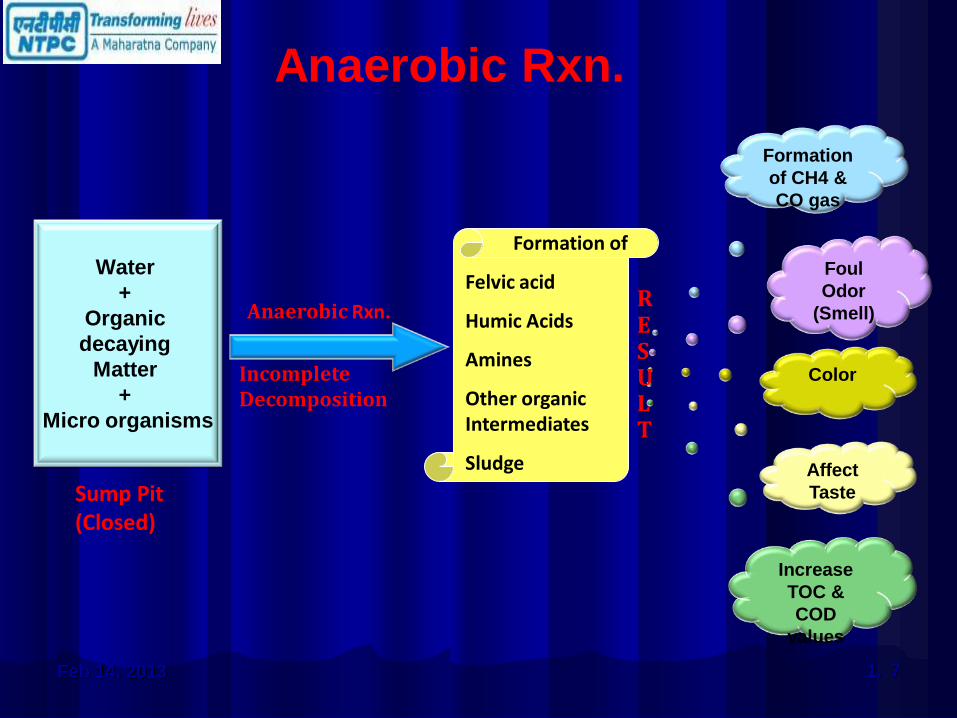
Affect
Taste
Color
Foul
Odor
(Smell)
Formation
of CH4 &
CO gas
Water
+
Organic
decaying
Matter
+
Micro organisms
Sump Pit (Closed)
Anaerobic Rxn.
Incomplete Decomposition
Formation of
Felvic acid
Humic Acids
Amines
Other organic Intermediates
Sludge
R E S U L T
Increase
TOC &
COD
values
Anaerobic Rxn.
1. 7 Feb 14, 2013

Process Raw water received from reservoir contains number of impurities. The impurities can be broadly divided into three categories;
1. Suspended clay / silt, colloidal silica. 2. Organic matter:- microorganisms, vegetation matter, organic matter & their
decay products such as Humus & Fulvic acid. etc. 3. Dissolved impurities First and Second type of impurities are removed in Pretreatment plant and the
dissolved impurities are removed in DM plant during formation of DM water. In the conventional pretreatment process Chlorine, Alum and Lime are mixed with
raw water in different quantities as per the impurities present in the raw water. • Chlorine is added to remove any microorganisms, organic acids & vegetable
matter etc. • Alum is added to remove suspended impurities like clay including colloidal
silica along with organic impurities, • Lime is added to control the pH of the clarified water
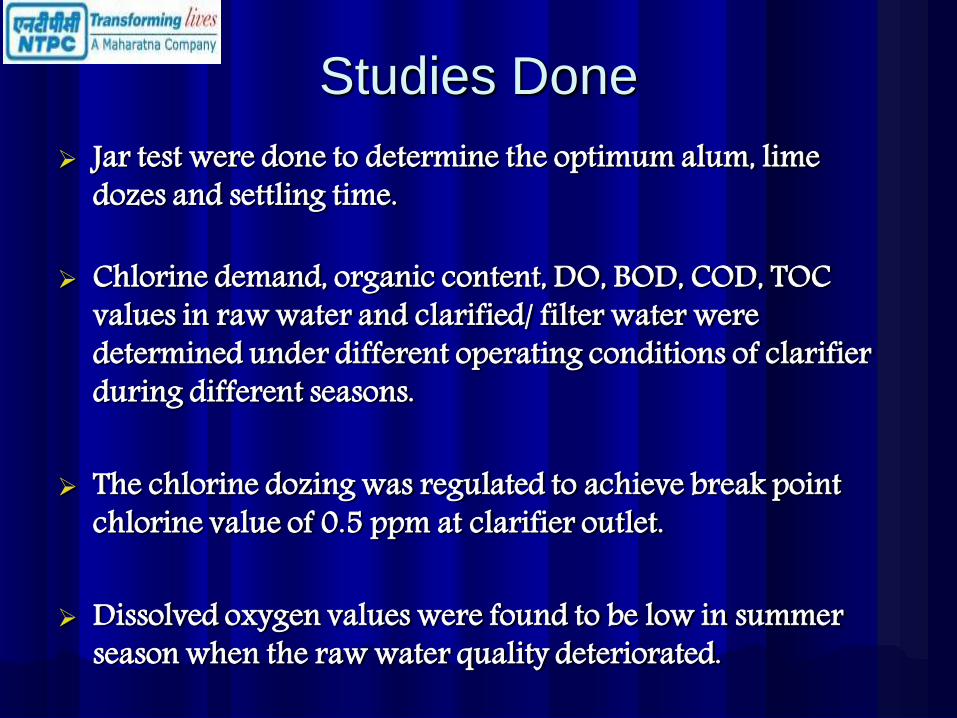
Studies Done
Jar test were done to determine the optimum alum, lime dozes and settling time.
Chlorine demand, organic content, DO, BOD, COD, TOC
values in raw water and clarified/ filter water were determined under different operating conditions of clarifier during different seasons.
The chlorine dozing was regulated to achieve break point
chlorine value of 0.5 ppm at clarifier outlet. Dissolved oxygen values were found to be low in summer
season when the raw water quality deteriorated.

Changes in Operation Philosophy
Both clarifiers were put into operation in January 2009 increasing the contact period in clarifier during
pretreatment and slightly higher Alum concentration then required to settle suspended impurities also helps in removing colloidal Silica and reducing organic loads during clarification process.
lime addition during post clarification also helped in improvement in Filtered water quality.

Storage Tank
Pressure Filter
Raw Water from Reservoir
Chlorine Lime Alum Clarifier 1
PROCESS FLOW SHEET OF PRETREATMENT PLANT
To DMplant
Raw Water
Clarifier 2
Retention Period with one clarifier in operation is around 3-3.5 hrs, where as in case of two clarifier operation it is around 6-7 hrs.

Changes in Operation Philosophy
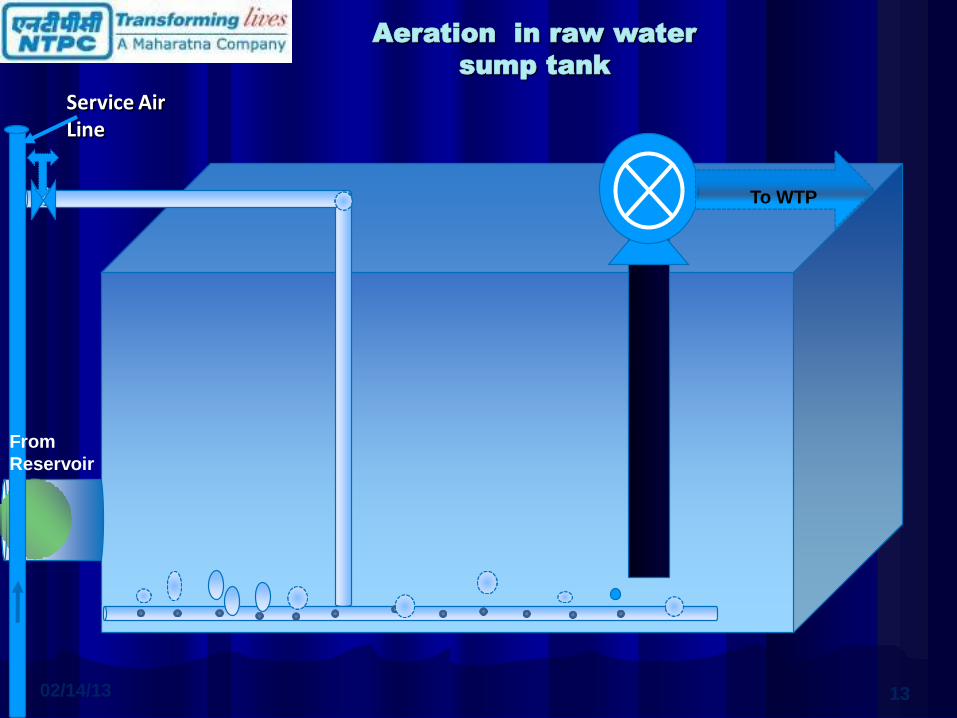
Aeration in Raw water sump tank was started in March 2011 Aerating the raw water before pretreatment helps
in increasing the oxygen concentration in water, which helps in reducing the organic acids in water and bring down COD values (reduction in organic content).
No formation of sludge in raw water sump tank.
02/14/13 13
To WTP
Aeration in raw water
sump tank
Service Air Line
From
Reservoir
1. 14 Feb 14, 2013
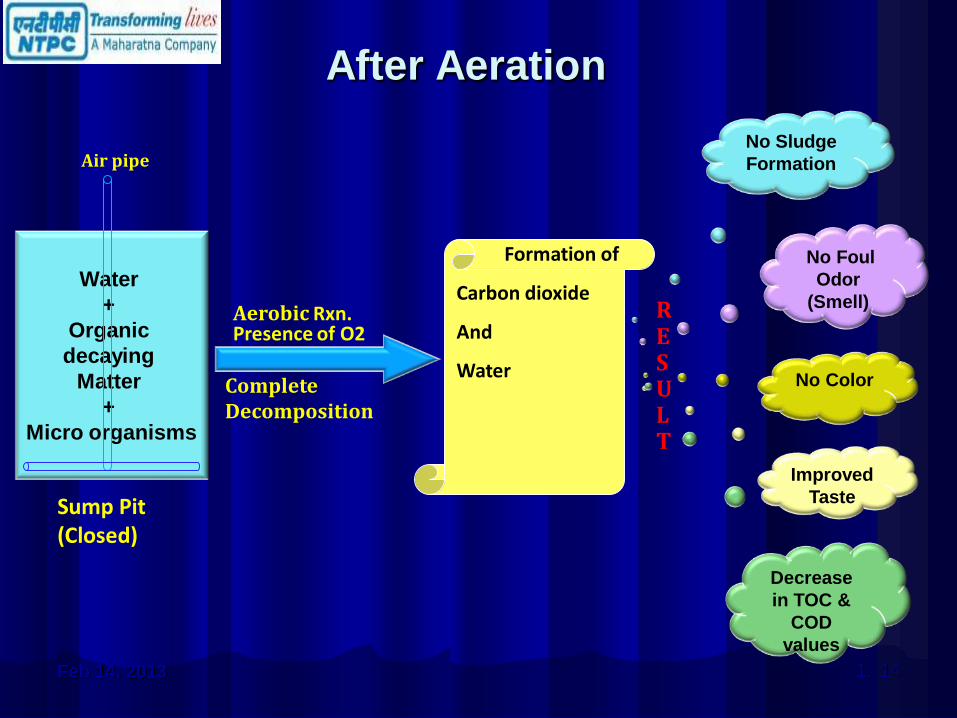
After Aeration
Improved
Taste
No Color
No Foul
Odor
(Smell)
No Sludge
Formation
Water
+
Organic
decaying
Matter
+
Micro organisms
Sump Pit (Closed)
Aerobic Rxn. Presence of O2
Complete Decomposition
Formation of
Carbon dioxide
And
Water
R E S U L T
Decrease
in TOC &
COD
values
Air pipe

RESULTS
Results of Two clarifier operations Lower COD values of filtered water Decrease Colloidal silica. Less fouling of Anion resin Better output from DM plant. Achieved Mixed bed outlet K, as low as 0.08 µS/cm in summers. ACC (After Cation Conductivity) values of feed waters and steam
samples came down below 0.20 µS/ cm. low pH & high ACC problem frequently seen previously , disappeared.
Results of Aeration in Raw water sump pit. Low organics (COD) in feed water in PT plant, thus improving the
quality of filtered water further w r t organics. Foul smell, discoloration of raw water not seen. No Sludge formation in Raw water sump pit.

1. 17 Feb 14, 2013
Effect on ACC values
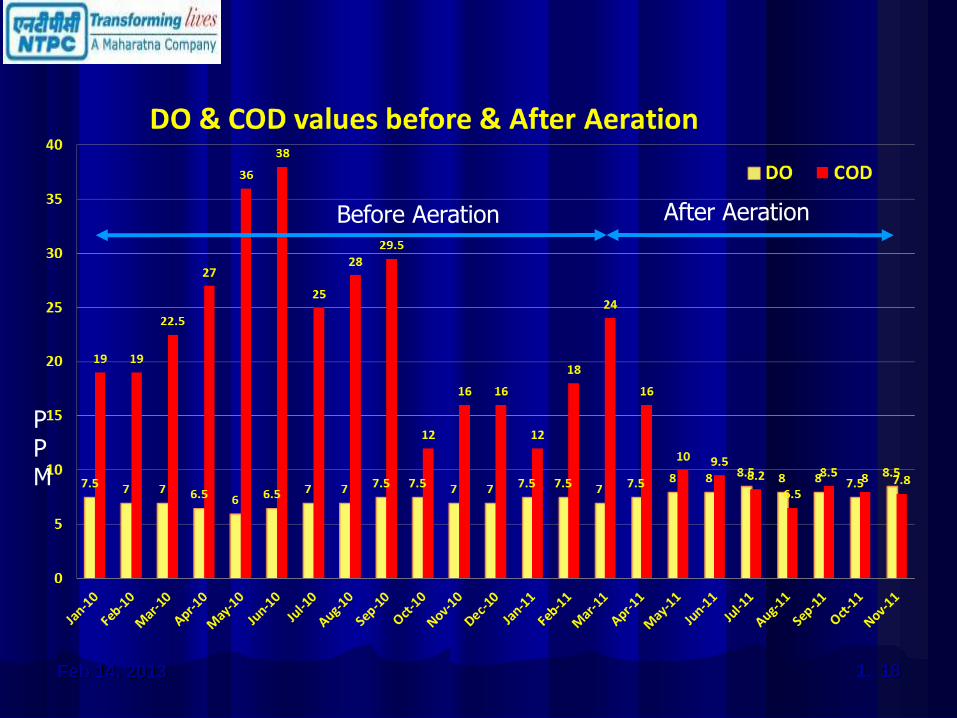
1. 18 Feb 14, 2013
Before Aeration After Aeration
PPM

Conclusion
Optimizing pretreatment would not only help in producing good quality clarified water, drinking water and DM water, but would also help in maintaining better feed cycle & boiler chemistry. Various hydro-chemical parameters like COD, BOD, organics, colloidal Silica, dissolved solids and suspended solids are to be monitored regularly during pre treatment process. Study shows that once the above parameters are controlled / removed during pre treatment then it is easier to maintain excellent feed cycle and boiler water chemistry in all respects.

JALDHARA QUALITY
CIRCLE
1. 20 Feb 14, 2013 Plant a Tree To get Oxygen Free
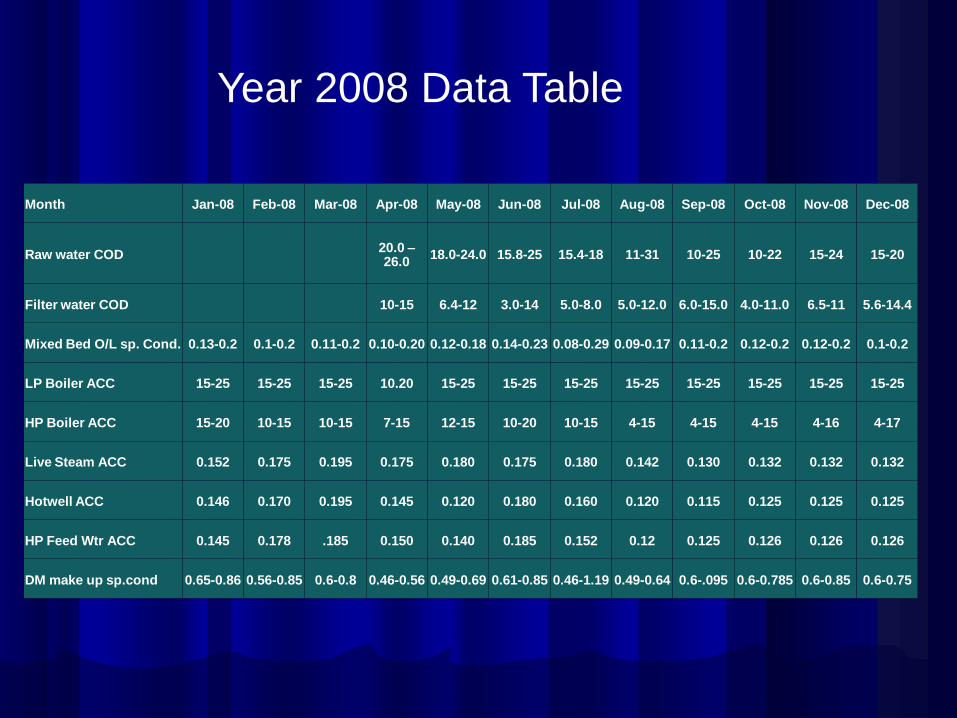
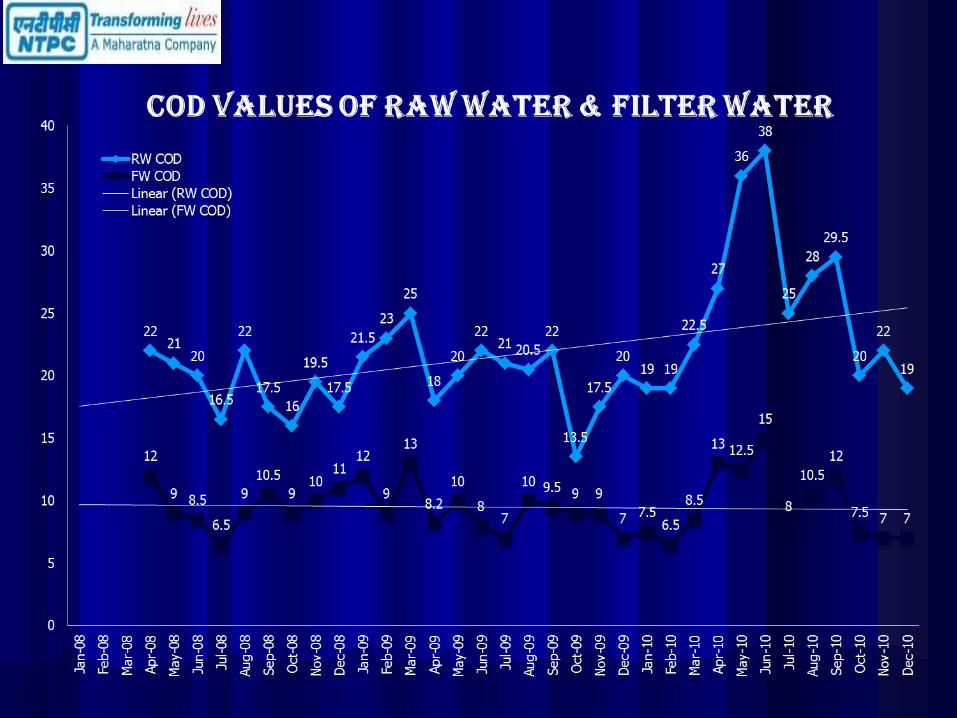
Month Jan-08 Feb-08 Mar-08 Apr-08 May-08 Jun-08 Jul-08 Aug-08 Sep-08 Oct-08 Nov-08 Dec-08
Raw water COD 20.0 – 26.0
18.0-24.0 15.8-25 15.4-18 11-31 10-25 10-22 15-24 15-20
Filter water COD 10-15 6.4-12 3.0-14 5.0-8.0 5.0-12.0 6.0-15.0 4.0-11.0 6.5-11 5.6-14.4
Mixed Bed O/L sp. Cond. 0.13-0.2 0.1-0.2 0.11-0.2 0.10-0.20 0.12-0.18 0.14-0.23 0.08-0.29 0.09-0.17 0.11-0.2 0.12-0.2 0.12-0.2 0.1-0.2
LP Boiler ACC 15-25 15-25 15-25 10.20 15-25 15-25 15-25 15-25 15-25 15-25 15-25 15-25
HP Boiler ACC 15-20 10-15 10-15 7-15 12-15 10-20 10-15 4-15 4-15 4-15 4-16 4-17
Live Steam ACC 0.152 0.175 0.195 0.175 0.180 0.175 0.180 0.142 0.130 0.132 0.132 0.132
Hotwell ACC 0.146 0.170 0.195 0.145 0.120 0.180 0.160 0.120 0.115 0.125 0.125 0.125
HP Feed Wtr ACC 0.145 0.178 .185 0.150 0.140 0.185 0.152 0.12 0.125 0.126 0.126 0.126
DM make up sp.cond 0.65-0.86 0.56-0.85 0.6-0.8 0.46-0.56 0.49-0.69 0.61-0.85 0.46-1.19 0.49-0.64 0.6-.095 0.6-0.785 0.6-0.85 0.6-0.75
Year 2008 Data Table

Month Jan-09 Feb-09 Mar-09 Apr-09 May-09 Jun-09 Jul-09 Aug-09 Sep-09 Oct-09 Nov-09 Dec-09
Raw water COD 18-25 12-34 18-32 15-21 18-22 17.6-25 15-27 15.4-26.4 11.3-32 12.6-16 15-20 18-22
Filter water COD 12-13 8-11 10-17 6.3-10 8-12 5-12 3-12 8-12 5-14 8-10 8-10 4-10
Mixed Bed O/L sp. Cond. 0.08-0.14 0.08-0.14 0.09-0.14 0.09-0.15 0.10-0.2 0.10-0.15 0.10-0.13 0.07-0.12 0.08-0.11 0.09-0.12 0.09-0.1 0.08-0.1
LP Boiler ACC 10-15 10-15 40-60 10-25 10-20 20-30 20-25 10-14 10-14 10-15 8-15 14-20
HP Boiler ACC 9-13 6-12 40-60 8-15 8-15 15-35 30-40 4-10 4-10 4-11 8-12 5-15
Live Steam ACC 0.16 0.11 0.125 0.150 0.170 0.2 0.17 0.13 0.09 0.1 0.168 0.18
Hotwell ACC 0.08 0.095 0.095 0.105 0.115 0.17 0.125 0.08 0.08 0.08 0.14 0.17
HP Feed Wtr ACC 0.1 0.100 0.130 0.127 0.140 0.12 0.140 0.138 0.095 0.10 0.184 0.17
DM make up sp.cond 0.4-0.6 0.42-0.6 0.45-0.6 0.42-0.65 0.41-0.65 0.5-0.65 0.49-0.6 0.37-0.55 0.45-0.6 0.48-0.6 0.53-0.6 0.5-0.6
Year 2009 Data Table
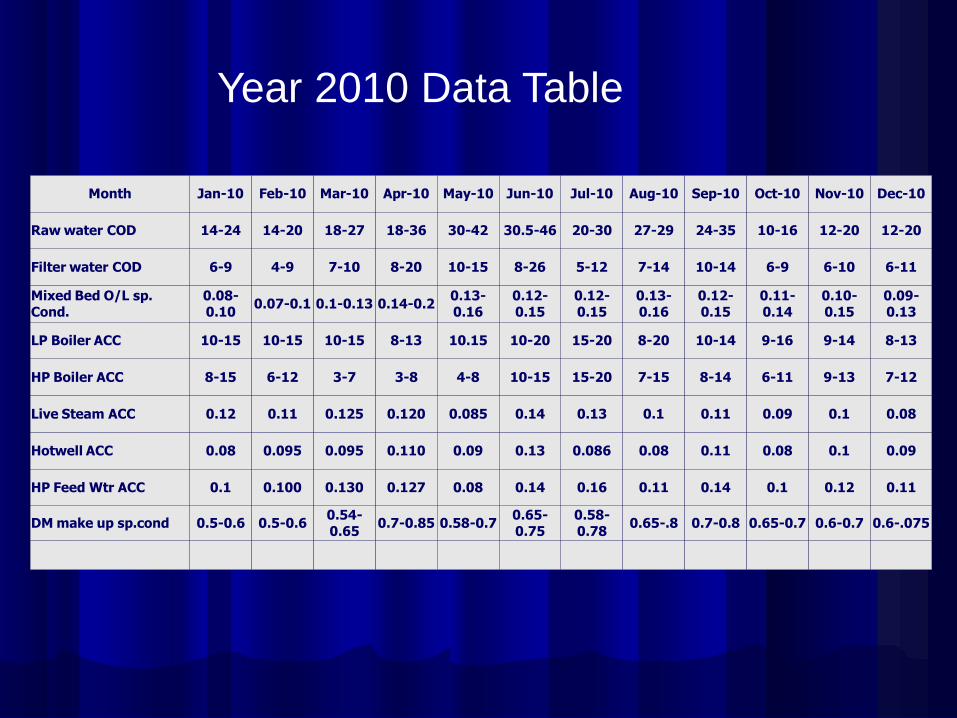
Month Jan-10 Feb-10 Mar-10 Apr-10 May-10 Jun-10 Jul-10 Aug-10 Sep-10 Oct-10 Nov-10 Dec-10
Raw water COD 14-24 14-20 18-27 18-36 30-42 30.5-46 20-30 27-29 24-35 10-16 12-20 12-20
Filter water COD 6-9 4-9 7-10 8-20 10-15 8-26 5-12 7-14 10-14 6-9 6-10 6-11
Mixed Bed O/L sp.
Cond. 0.08-
0.10 0.07-0.1 0.1-0.13 0.14-0.2
0.13-
0.16 0.12-
0.15 0.12-
0.15 0.13-
0.16 0.12-
0.15 0.11-
0.14 0.10-
0.15 0.09-
0.13
LP Boiler ACC 10-15 10-15 10-15 8-13 10.15 10-20 15-20 8-20 10-14 9-16 9-14 8-13
HP Boiler ACC 8-15 6-12 3-7 3-8 4-8 10-15 15-20 7-15 8-14 6-11 9-13 7-12
Live Steam ACC 0.12 0.11 0.125 0.120 0.085 0.14 0.13 0.1 0.11 0.09 0.1 0.08
Hotwell ACC 0.08 0.095 0.095 0.110 0.09 0.13 0.086 0.08 0.11 0.08 0.1 0.09
HP Feed Wtr ACC 0.1 0.100 0.130 0.127 0.08 0.14 0.16 0.11 0.14 0.1 0.12 0.11
DM make up sp.cond 0.5-0.6 0.5-0.6 0.54-
0.65 0.7-0.85 0.58-0.7
0.65-
0.75
0.58-
0.78 0.65-.8 0.7-0.8 0.65-0.7 0.6-0.7 0.6-.075
Year 2010 Data Table