pressure differences caused by wind on two tall buildings
TRANSCRIPT

No. 2085
G . T . TAMURA Member ASHRAE
A . G . WILSON Member ASHRAE
Pressure Differences Caused by Wind on Two Tall Buildings
Estimating the quantity of a ir leakage for a building phase of this investigation deal t with the exterior requires a knowledge of the pressure difference 1 wal l pressure differences caused by chimney action pattern over the exterior wall, a s well a s the air leakage characteris tics of the exterior wall com-
and mechanical ven cilacion sys tem operation. Pres - sure differences across the exterior wall and interior
ponents . Wind i s one of rhe major forces causing the separations were measured during calm periods a t pressure differences which result in air leakages. The ocher forces are chimney action and the im-
various outside temperatures, The resul ts of these measurements have been reported2.
balance of supply and exhaus t air of the mechanical I The second phase dealt with the pressure differ- ventilation system. / ences across che exterior wall which were caused by
Information on the pressure patterns resulting / ~ i n d . For this s tudy, continuous wind and pressure from wind, a s a l n c r i o n of building configuration, 1 records were obtained and a regression anilysir was can be found in many references dealing with model 1 carried out with the aid of a digital computer to de- s t ud i e s in wind tunnels1. Velocity conditions in / [ermine wind pressure coefficients for both buildings. such s tud ies are usually idealized. In reality, wind The results of the ana lys i s are given in this paper. conditions are affected by the surrounding terrain 1 and adjacent buildings. Because of the complex na- ture of the wind, and the difficulties of measuring it under the non-steady conditions that occur in nature, there i s l i t t le information on pressure patterns for ac tua l buildings.
A s part of a study on the pressure differences that occur across building enc losures , pressure measurements were conducted on two tall buildings (44 and 34 s tor ies ) located in Montreal. The first
G T Tamura I S a Research O f f i c e r , and A G. W ~ l s o n i s H e a d a f the B u l l d l n g Serv ice S e c t ~ o n , D ~ v ~ s ~ o n o f B u ~ l d ~ n g Research,
N a t ~ o n a l Research C a u n c ~ l o f Canada, Ot tawa. T h t s paper I S a
con t r ibu t ion o f the D i v ~ s i o n o f B u i l d i n g Research o f the
N a t ~ o n a l Research C o u n c i l o f Canada and I S p u b l ~ s h e d w ~ t h the
approval o f t h e D i r e c t o r o f the D i v ~ s ~ o n . T h i s paper w a s prepared 3
1 for p resen ta t ion a t t h e A S H R A E A n n u a l M e e t ~ n g , L a k e P l a c ~ d ,
New Yark, June 24-26, 1968. I
DESCRIPTION OF THE TEST BUILDINGS
Buildings A and B, shoxn in F igs . 1 and 2 , are com- mercial office buildings located in downtown bionc- real. A contour map describing the character is t ics of the terrain in which Buildings A and B are located i s given in Fig. 3.
Building A has 44 s tor ies and i s 60' f t above s t reet level to the top of the architectural fence on the roof. Rectangular i n shape, i t has dimensions of 100 by 140 f t . The 34-story Building B i s 436 f t high and has floor dimensions of 117 by 173 ft. A more complete description of the buildings i s gi\ren in Reference 2 .
Fig. 4 shows the location and s i z e of buildings in the immediate vicinity of the two test buildings

I'ig I Bui lding A
l n d g i v e s a n i n d i c a t i o n of t h e e x t e n t to w h i c h the Ire s h i e l d e d .
F o r c o n v e n i e n c e t h e c a r d i n a l d i r e c t i o n s w e r e i rb ic ra r i ly c h o s e n a t r igh t a n g l e s to t h e b u i l d i n g a c e s . U n l e s s o t h e r w i s e s t a t e d , t h e c a r d i n a l d i r e
: ions a r e a s i n d i c a t e d i n F i g . 3.
NSTRUXIENTATION
T h e o u t s i d e p r e s s u r e t a p s w e r e l o c a t e d i n t h e m i d d l e
Fig . 2 Building B
to i n s i d e p r e s s u r e t a p s l o c a t e d t w o f l o o r s a w a y from t h e c o r r e s p o n d i n g m e c h a n i c a l e q u i p m e n t f loor . In a d d i t i o n to t h e p r e s s u r e t a p s ac t h e t w o u p p e r l e v e l s , o u t s i d e t a p s w e r e i n s t a l l e d on e a c h of t h e f o u r w a l l s of B u i l d i n g B a t t h e g r o u n d f loor l e v e l .
T h e o u t s i d e a n d i n s i d e t a p s w e r e c o n n e c t e d to a s t r a i n g a u g e d i a p h r a g m - t y p e p r e s s u r e t r a n s d u c e r ( s e n s i t i v i t y 0.002 i n . of w a t e r ) of t h e p r e s s u r e re - c o r d i n g s y s t e m l o c a t e d i n o n e o f t h e m e c h a n i c a l e q u i p m e n t f l o o r s . T h e c o n n e c t i o n b e t s e e n t h e p r e s - s u r e tap a n d t h e p r e s s u r e t r a n s d u c e r was made wi th %-in. p l a s t i c t u b i n g w h i c h c o n t r i b u t e d t o t h e l a g of t h e r e c o r d i n g s y s t e m . With 400 f t of %-in. p l a s t i c t u b i n g ( t h e l o n g e s t c o n n e c t i o n u s e d ) t h e t i m e c o n - s t a n t o f t h e r e c o r d i n g s y s t e m for a s t e p i n p u t was
2.7 sec. T h e t i m e c o n s t a q t of e a c h p r e s s u r e cap w a s
level. T h e e x r e r i o r w a l l p r e s s u r e s w e r e r e f e r e n c e d -
I t h e r m i s t o r l o c a r e d in a s h e l t e r e d a r e a o n t h e roof o f
) f e a c h w a l l of t h e t w o m e c h a n i c a l e q u i p m e n t f l o o r s : -or B u i l d i n g A a t h e i g h t s of 195 a n d 545 f t , a n d f o r Bui ld ing B a t h e i g h t s of 135 a n d 410 f t a b o v e s t r e e t
d i f f e r e n t b e c a u s e of t h e v a r y i n g l e n g t h s of t h e t ube
c o n n e c t i o n s . T h e o u t s i d e a i r t e m p e r a t u r e w a s m e a s u r e d w i th a

Fig . 3 Contour map of the terrain surrounding f e s f bui ldings

MomTn MLATIVL TO TEST OUILDIY6$
Fig. 4 Plan showing heights of adjacent buildings
: building. T h e wind s p e e d and d i r ec t ion were a su red with a cup-type anemometer t ha t had a chan i sm to ind ica t e one of e i g h t wind d i r ec t ions . ch wind d i r ec t ion , therefore , c o v e r s a 45-deg Srnent. T h e anemometer w a s l o c a t e d o n a radio st on top of Bui ld ing A, 2 0 0 f t a b o v e roof l e v e l o r ?roximately 800 ft above s t r e e t l eve l . T h e wind ormation from t h i s anemometer w a s t ransmit ted by ephone connec t ion and recorded on t h e p r e s s u r e :ording s y s t e m of Bui ld ing B , l o c a t e d 0.3 mile j t of Bui ld ing A. T o compare on - s i t e and meteorologica l s t a t i o n i d v e l o c i t i e s , an add i t iona l record of wind informa- n w a s ob ta ined on a n ope ra t iona l recorder. T h e teorologica l s t a t ion i s l o c a t e d 8.3 mi l e s nor thwest Building A. P r e s s u r e d i f f e rences a t e a c h p r e s s u r e t ap loca t ion
id s p e e d a n d d i rec t ion , and o u t s i d e a i r tempera ture re recorded every 4 mins . on a 16-point mil l ivolt order. Wind s p e e d r ead ings , which a l w a y s followed ) p r e s s u r e readings , were an a v e r a g e s p e e d ove r a sec in terval . T h e r ead ings were recorded on a
ip c h a r t for v i s u a l checking. A d i g i t a l encode r a t - hed t o the s l i d e r arm s h a f t of t he recording po-
tent iometer w a s u s e d to record e a c h reading o n e i t h e r magnet ic t a p e o r punched paper t a p e in 3 d i g i t binary numbers. T h e p res su re r eco rds w e r e p r o c e s s e d and a n a l y z e d u s i n g a n IBM 360 d ig i t a l computer.
METHOD OF ANALYSIS
T h e va lues of the p r e s s u r e d i f f e rences a c r o s s the ex- terior w a l l s of a bui ld ing a r e the n e t r e s u l t of t he combined ac t ion of va r ious forces . I t w a s a s s u m e d in t h i s a n a l y s i s t ha t t h e s e p r e s s u r e d i f f e r e n c e s a t any locat ion cou ld b e adequa te ly r ep resen ted by the sum of the p r e s s u r e d i f f e r e n c e s d u e to the ind iv idua l fo rces a t tha t l oca t ion .
At any he igh t , t h e a c t u a l p r e s s u r e d i f f e rence a c r o s s a n ex te r io r w a l l c a u s e d by chimney e f f e c t 3 a lone , e x p r e s s e d as a function of the i n s i d e a n d o u t s i d e a i r tempera ture , i s
where
hp , = p r e s s u r e d i f ference a c r o s s ex te r io r w a l l c a u s e d by chimney ac t ion

T = absolute temperature outside t = absolute temperature inside
/3 = constant (either positive or negative)
The pressure difference across one face of the exterior wall caused by wind velocity alone can be expressed a s a function of the velocity head.
The equation for the velocity head i s I
where
P, = velocity head V = wind velocity p = air densi ty .
The actual pressure difference across one face of the exterior wall caused by wind can be expressed a s
where 1 I
l p , = pressure difference across an exterior wall caused by wind
y = wind pressure coefficient a positive value indicates a higher pressure
outside than inside a negative value indicates a lower pressure
outside than inside
The net effect of chimney and wind action and the ventilation system operation on the exterior wall pressure difference i s then expressed by the following:
where i \P che resultant pressure difference across one
race of iin exterior wall h = pressure difference caused by the ventila-
[ Ion s l s t t r n .
I t ~ h c r c is lirrle change i n the outside tempera- r u r c during t h e period under consideration, variations i n \P are due mainly to che variations in wind speed. The f i r s c two terms on the right hand s ide of Eq 3 are then co~:iSined co give the folloaring simple linear relationship:
P - - u +- ),P,. (4)
covered an extended period during which there was a constant outside air temperature (within 10 degs and constant wind direction. The mode of operatio of the ventilation system a lso remained constant. The range of wind velocity in each of the selected pressure records was usually not greater than 10 to
15 mph. In order to compute wind pressure coef- ficients that would be applicable over a wider range two sect ions of record with the same wind direction but with different absolute wind speeds were com- bined for purposes of analysis . The a values were usually not the same, s ince the outside temperature for the two sec t ions of records were in most in- s tances different. A dummy variable 4 . Z, was there fore added to E q 5 to account for the two values of a a s follows: I where
Z = 0 when the pressure reading i s from the first se lec ted record
Z 1 = 1 when the pressure reading i s from the second se lec ted record
a = constant for the first selected record a + a 1 = constant for the second selected record
The use of Eq 5 for the determination of the y
values for the four walls at any spec i f ic level would also yield 4 values of both a and a + a 1 which should be the same for each level. By extending the use of dummy variables , the method of analysis can be further modified s o a s to yield s ingle values of a and a + a for each level for the two sect ions of record in combination. This technique leads to a better determination of the values of a and a + a1
and should therefore provide better values of wind pressure coefficients, y .
The equation incorporating the dummy variables i s as follows:
where z i = 0 i f pressure reading i s not associated with
the i-th wall
Z i = 1 if pressure reading i s associated with t h e
i-th wall
and i = 2 , 3 , 4 Each section of the record selected for analysis ~
pressure coefficient for each wall for a given d direction is then
The wind pressure coefficients were obtained by llyzing each s e t of selected records to obtain the ; t fit with Eq 6. In this analysis the values of P, re based on the velocity head of on-site wind :ained from the anemometer on the radio mast Jve Building A. In order to relate the wind pressure coefficients the wind velocity at the meteorological station, .
on-site wind records were correlated with the :ceorological wind records. The latter were usually ailable a s hourly average wind speeds. The ratio on-site hourly average wind velocity and the :ceorological wind velocity was determined for ch wind direction. The wind pressure coefficient related to the
:ceorological wind velocity is then given by
R v = ratio of on-site wind velocity to meteor- ological wind velocity
y , = pressure coefficient based on meteorolog- ical wind velocity
y' = pressure coefficient based on on-site wind
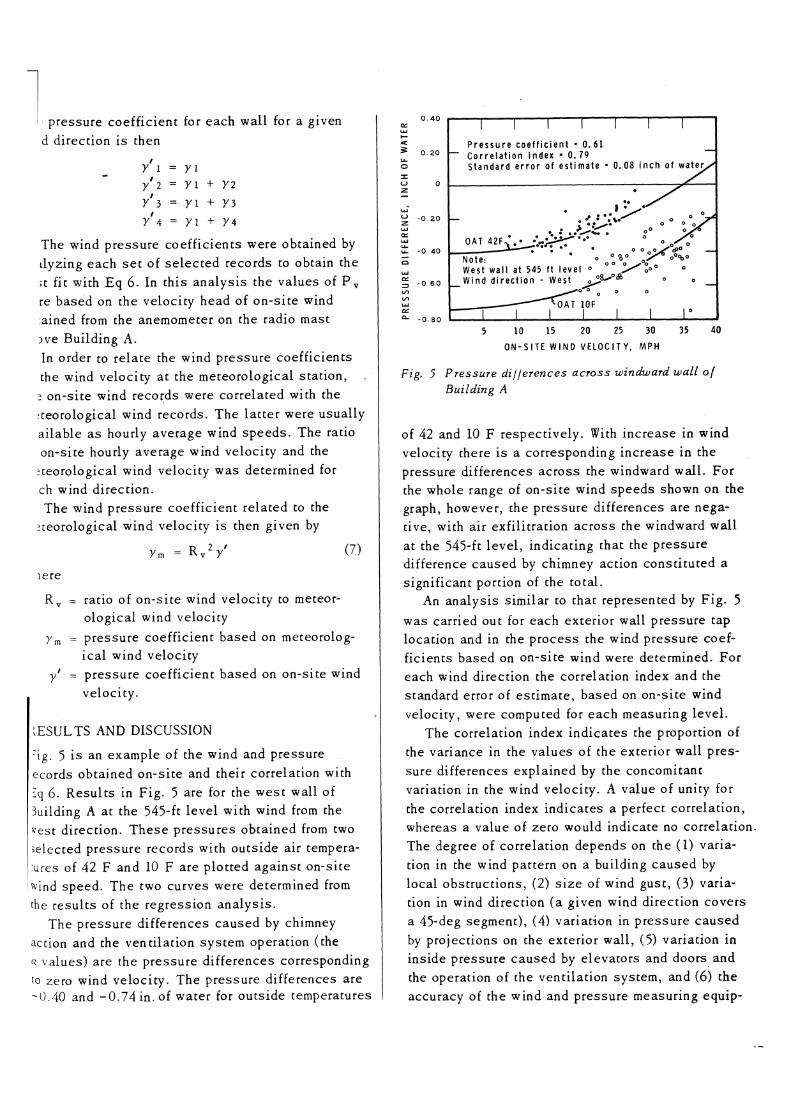
:ig. 5 i s an example of the wind and pressure ecords obtained on-site and their correlation with < q 6. Results in Fig. 5 are for the west wall of 3uilding A at the 545-ft level with wind from the vest direction. These pressures obtained from two ;elected pressure records with outside air tempera- :ures of 42 F and 10 F are plotted against on-site ivind speed. The two curves were determined from the results of the regression analysis.
The pressure differences caused by chimney action and the ventilation system operation (the
values) are the pressure differences corresponding to zero wind velocity. The pressure differences are -0.40 and -0.74 in. of water for outside temperatures
5 10 15 20 25 30 35 4 0
O N - S I T E W I N D V E L O C I T Y . MPH
Fig. 5 Pressure d i f f e rences across windward wall of Building A
of 42 and 10 F respectively. With increase in wind velocity there i s a corresponding increase in the pressure differences across the windward wall. For the whole range of on-site wind speeds shown on the graph, however, the pressure differences are nega- tive, with air exfilitration across the windward wall at the 545-ft level, indicating that the pressure difference caused by chimney action constituted a significant portion of the total.
An analysis similar to that represented by Fig. 5 was carried out for each exterior wall pressure tap location and in the process the wind pressure coef- ficients based on on-site wind were determined. For each wind direction the correlation index and the standard error of estimate, based on on-site wind velocity, were computed for each measuring level.
The correlation index indicates the proportion of the variance in the values of the exterior wall pres- sure differences explained by the concomitant variation in the wind velocity. A value of unity for the correlation index indicates a perfect correlation, whereas a value of zero would indicate no correlation. The degree of correlation depends on the (1) varia- tion in the wind pattern on a building caused by local obstructions, (2) s ize of wind gust, (3) varia- tion in wind direction ( a given wind direceion covers a 45-deg segment), (4) variation in pressure caused by projections on the exterior wall, (5) variation in inside pressure caused by elevators and doors and the operation of the ventilation system, and (6) the accuracy of the wind and pressure measuring equip-

ment. For Building A the correlation index varied from 0.65 to 0.90 a t the upper level and 0.33 to 0.87 at the intermediate level; for Building B i t varied from 0.43 to 0.82 a t the upper level, from 0.11 to 0.61 at the intermediate level and from 0.03 to 0.65 at the ground level. The degree of correlation between concomitant values of on-site wind and wall pressure differences was thus better for higher levels than for lower ones; and was better for Building A than Building B. As would be expected, the better correlations were obtained for pressure tap locations c loses t to the point of wind velocity measurement and where there was the leas t shielding.
The standard error of estimate indicates the degree of agreement between the observed pressure differences and those estimated from Eq 6 . With reference to Fig. 5, i t i s a measure of the scat ter of the data points around the regression curves. For Building A, values varied from 0.038 to 0.077 in. of water at the upper level , and from 0.013 to 0.079 in. o f water at the intermediate level. For Building B, values varied from 0.023 to 0.097 in. of water at the upper level, from 0.017 to 0.064 in. of water at the intermediate level, and from 0.013 to 0.048 in. of water at the lower level.
The method of analysis , utilizing Eq 6 , separates the pressure difference due to wind action from that due to chimney action and the ventilation system operation. These pressure difference effects can also be isolated by examining the records obtained during calm periods. This has been done for Building B in Fig. 6 , which shows the pressure differences at the 410 and 135-ft levels plotted against outside air temperature. At the 410-ft level the negative pressure difference across the exterior wall increases with decreasing outside air tempera- ture. Because the 135-ft level i s close to the neutral zone level of the building the change in the pressure difference with outside air temperature i s small.
Fig. 6 also shows the effect of the office-hour and after-hour operation of the ventilation system. After office hours, several ventilation fans were shut down, altering the balance of outside supply and exhaust air. Comparison of the measured wall pressure differences with the line showing pressure differences caused by chimney action alone * in-
b ) 135 f t l e v e l
O U T S 1 D E T E M P E R A T U R E , F
Fig. 6 Exterior waii pressure di / /erences /or Building B during cairn periods
dicates that supply and exhaust air were essentially balanced under the after-hour conditions. When the ventilation system was operating fully there was an imbalance of supply over exhaust, causing a pressur- ization of approximately 0 .2 to 0.3 in. of water at both levels.
The pressure differences due to the combined effects of chimney action and the ventilation system obtained from Eq 6 are also plotted in Fig. 6. The calculated values agree reasonably well with the values measured directly, indicating the validity of Eq 6 . I t would appear, therefore, that the pressure difference across the exterior wall due to the com- bined forces can be adequately approximated by summing the pressure differences due to the indi- vidual forces.
Wind pressure coefficients computed from Eq 6 , referenced to on-site wind measurements, are given in Tables I and I1 for both buildings. For a given wind direction each pressure coefficient i s based ofl
an average of 130 readings for Building A and 180 readings for Building B. The coefficients apply to conditions at the mid-point of the walls where the
1 pressure taps were located.

TABLE I
WIND PRESSURE COEFFICIENTS FOR BUILDING A BASED ON ON-SITE WIND VELOCITY
TABLE I1
WIND PRESSURE COEFFICIENTS FOR BUILDING B BASED ON ON-SITE WIND VELOCITY
WIND DIRECTION
HEIGHT FT
EXTERIOR WALL
WIND DIRECTION
W N
HEIGHT FT
E S
EXTERIOR WALL
W S N E
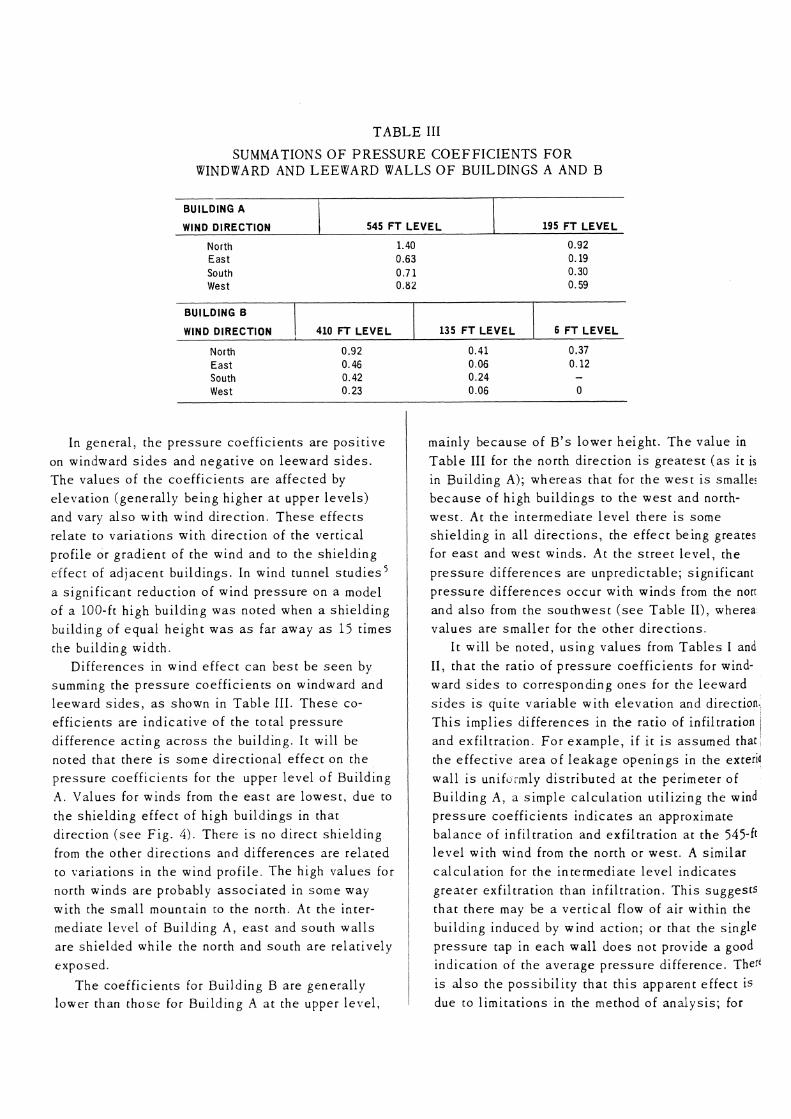
T A B L E 111
SUMMATIONS O F P R E S S U R E C O E F F I C I E N T S F O R WINDWARD AND L E E W A R D WALLS O F B U I L D I N G S A A N D B
In g e n e r a l , t h e p r e s s u r e c o e f f i c i e n t s a r e p o s i t i v e on windward s i d e s a n d n e g a t i v e o n l e e w a r d s i d e s . T h e v a l u e s of t h e c o e f f i c i e n t s a r e a f f e c t e d by e l e v a t i o n ( g e n e r a l l y b e i n g h i g h e r a t u p p e r l e v e l s ) a n d vary a l s o w i t h w i n d d i r e c t i o n . T h e s e e f f e c t s r e l a t e to v a r i a t i o n s w i t h d i r e c t i o n of t h e v e r t i c a l p rof i l e o r g r a d i e n t of t h e w i n d a n d to t h e s h i e l d i n g e f f e c t of a d j a c e n t b u i l d i n g s . In wind t u n n e l s t u d i e s 5 a s i g n i f i c a n t r e d u c t i o n of w i n d p r e s s u r e o n a m o d e l of a 100- f t h i g h b u i l d i n g w a s n o t e d w h e n a s h i e l d i n g bu i ld ing of e q u a l h e i g h t w a s a s f a r a w a y a s 15 t i m e s t h e b u i l d i n g w i d t h .
D i f f e r e n c e s in w i n d e f f e c t c a n b e s t b e s e e n by s u m m i n g t h e p r e s s u r e c o e f f i c i e n t s o n w i n d w a r d a n d l e e w a r d s i d e s , a s s h o w n i n T a b l e 111. T h e s e co- e f f i c i e n t s a r e i n d i c a t i v e of t h e t o t a l p r e s s u r e d i f f e r e n c e a c t i n g a c r o s s t h e b u i l d i n g . I t wi l l b e n o t e d t h a t t h e r e i s s o m e d i r e c t i o n a l e f f e c t o n t h e p r e s s u r e c o e f f i c i e n t s for t h e u p p e r l e v e l o f B u i l d i n g A . V a l u e s fo r w i n d s from t h e e a s t a r e l o w e s t , d u e to t h e s h i e l d i n g e f f e c t of h i g h b u i l d i n g s in t h a t d i r e c t i o n ( s e e F i g . 4) . T h e r e i s n o d i r e c t s h i e l d i n g from t h e o t h e r d i r e c t i o n s a n d d i f f e r e n c e s a r e r e l a t e d t o v a r i a t i o n s in t h e w i n d p r o f i l e . T h e h i g h v a l u e s for north w i n d s a r e p r o b a b l y a s s o c i a t e d in s o m e w a y w i t h t h e s m a l l m o u n t a i n to t h e nor th . At t h e i n t e r - m e d i a t e l e v e l of B u i l d i n g A , e a s t a n d s o u t h w a l l s a r e s h i e l d e d w h i l e t h e nor th a n d s o u t h a r e r e l a t i v e l y e x p o s e d .
T h e c o e f f i c i e n t s for B u i l d i n g B a r e g e n e r a l l y !ower t h a n t h o s e For B u i l d i n g A a t t h e u p p e r l e v e l ,
m a i n l y b e c a u s e of B ' s l o w e r h e i g h t . T h e v a l u e in T a b l e 111 for t h e n o r t h d i r e c t i o n i s g r e a t e s t ( a s it is in B u i l d i n g A); w h e r e a s t h a t for t h e w e s t i s smalle: b e c a u s e of h i g h b u i l d i n g s to t h e w e s t a n d north- w e s t . At t h e i n t e r m e d i a t e l e v e l t h e r e i s s o m e s h i e l d i n g in a l l d i r e c t i o n s , t h e e f f e c t b e i n g greates for e a s t a n d w e s t w i n d s . A t t h e s t r e e t l e v e l , t h e p r e s s u r e d i f f e r e n c e s a r e u n p r e d i c t a b l e ; s i g n i f i c a n t p r e s s u r e d i f f e r e n c e s o c c u r w i t h w i n d s from t h e nort a n d a l s o from t h e s o u t h w e s t ( s e e T a b l e II), wherea v a l u e s a r e s m a l l e r for t h e o t h e r d i r e c t i o n s .
I t w i l l b e n o t e d , u s i n g v a l u e s from T a b l e s I and 11, t h a t t h e r a t i o of p r e s s u r e c o e f f i c i e n t s for wind- w a r d s i d e s to c o r r e s p o n d i n g o n e s f o r t h e l e e w a r d s i d e s i s q u i t e v a r i a b l e w i t h e l e v a t i o n a n d direction. T h i s i m p l i e s d i f f e r e n c e s in t h e r a t i o of in f i l t ra t ion , a n d e x f i l t r a t i o n . F o r e x a m p l e , if i t i s a s s u m e d that t h e e f f e c t i v e a r e a o f l e a k a g e o p e n i n g s in t h e exreria w a l l i s unifi. -mly d i s t r i b u t e d a t t h e p e r i m e t e r of B u i l d i n g A , a s i m p l e c a l c u l a t i o n u t i l i z i n g t h e wind p r e s s u r e c o e f f i c i e n t s i n d i c a t e s a n a p p r o x i m a t e b a l a n c e of i n f i l t r a t i o n a n d e x f i l t r a t i o n a t t h e 545-ft l e v e l w i t h wind from t h e nor th o r w e s t . A s i m i l a r c a l c u l a t i o n for t h e i n t e r m e d i a t e l e v e l i n d i c a t e s g r e a t e r e x f i l t r a t i o n t h a n i n f i l t r a t i o n . T h i s s u g g e s t s t h a t t h e r e may b e a v e r t i c a l flow of a i r w i t h i n the b u i l d i n g i n d u c e d by w i n d a c t i o n ; o r t h a t t h e s i n g l e p r e s s u r e t a p i n e a c h w a l l d o e s n o t p r o v i d e a good i n d i c a t i o n of t h e a v e r a g e p r e s s u r e d i f f e r e n c e . There i s a l s o t h e p o s s i b i l i t y t h a t t h i s a p p a r e n t e f f e c t i s d u e t o l i m i t a t i o n s in t h e m e t h o d of a n a l y s i s ; For
195 F T L E V E L
BUILDING A
WIND DIRECTION 545 FT L E V E L
North 1.40 0.92 East 0.63 0.19 South 0 .71 0.30 West 0.82 0.59
6 F T L E V E L
BUILDING B
WIND DIRECTION
North 0.92 0.41 0.37 East 0.46 0.06 0.12 South 0.42 0.24 - West 0.23 0.06 0
410 FT L E V E L 135 F T L E V E L

I the assumption that the pressure I :es due to the ventilation system are con-
) a particular mode of operation tilay not be
~d pressure coefficients in Tables I and I1 renced to the wind velocity measured on site. ~d data generally available, however, i s that d at the local meteorological station. ratios of the wind velocity at the s i t e (800 ft
;tree[ level on top of Building A) and at the 2logical station (33 f t above ground) were cal- 1 for each wind direction from the hourly aver- lues. A s an example, a plot of the records for -om the west direction i s shown in Fig. 7. rlculated ratio for this direction i s 1.60. . 8 shows the variation of the ratio of on-site ~orological wind speed (R ") with wind direc- 'ind velocities varied from 0 to 30 mph at the ological station in the records selected for is . The on-site anemom'eter was located well
~ * 1 E T E O R O L O C I C A L W I N D V E L O C I T Y . 41PH
. Cu~npur i son o / o n - s r t e und meteoro[ogica/ u'ind re loc i t y
above adjacent buildings; the variation in the ratio with direction i s therefore caused by differences in the general characteristics of the surroundings at the two locations. Relatively high values of R , were obtained for the west, southwest and northeast direction. The lower values of R , for the north and
directions are caused by the low mountain
to the north of Building A (see Fig. 1). The lower values of R. for the eas t and southeast directions can possibly be attributed to the effect of the cluster of tall buildings located eas t of Building A. 'The low value of R , for the south direction may be due to some shielding of the anemometer by the 10-in. diameter radio mast. The anemometer was located on a 5-ft arm attached to the north side of the mast.
The wind velocity profile in the vertical direction can be approximated by the following equation 5 :
- - - - (hh;)* (8) v ,
where
V = mean wind speed at height h above ground V r = mean wind speed at the reference height h,
above ground k = exponent.
The value of the exponent can be taken a s 1/7 for flat open country1. The ratio of mean wind velocity at 800 f t and that at 33 ft, for an exponent of 1/7 i s also shown in Fig. 8. If the exponent of 1/7 applies to the terrain at the meteorological station, the mean wind velocities 800 f t above ground at the two locations are approximately the same with wind from the northeast, west and south- west directions.
Wind pressure coefficients in Tables I and I1 can be computed in terms of meteorological wind records using Eq 7 and the information in Fig. 8. This will obviously alter the relative value of the coefficients because of variations in the ratio of on-site to meteorological wind speed.
SUMMARY
Coefficients describing the pressure differences due to wind action have been obtained for selected points across the walls of two tall buildings in the
1 center of a large city. The coefficients were quite

R a t i o o f o n - s i t o m e t . w i n d
/ - \ 1 i ~ a l c u l a t e d r a t i o o f w i n d
v e l o c i t y 800 f t a b o v e f l a t o p e n t e r r a i n t o m e t . w i n d v e l o c i t y (1.601
N o t e : O n - s i t e w i n d - 800 f t a b o v e s t r e e t l e v e l M e t e o r o l o g i c a l w i n d - 3 3 f t a b o v e g r o u n d
l e v e l a t a i r D o r t
Fig. 8 Ratio of on-si te wind velocity to meteorolog- ical velocity
variable with location, because of variations with direction of the vertical wind velocity gradient and the shielding effect of adjacent buildings.
The pressure coefficients were based on wind speeds measured at the s i te . These velocities in turn were related to the wind velocities measured at the meteorological station 8 miles away. This re- lationship i s variable with direction and depends upon the general characteristics of the terrain, including buildings, at the two locations.
The results emphasize the difficulty of pre- dicting the specific values of pressure differences due to wind to be expected with a particular building; and the difficulty, therefore, of making accurate pre- dictions of corresponding air infiltration and exfiltra- tion.
In the analysis of the pressure records, pressure differences due to wind action were isolated from those caused by the combined effect of chimney
action and the ef fect of the mechanical ventilation system operation. These latter values agreed reas ably well with the values of pressuie differences measured during calm periods. This suggests that the resultant pressure difference across the eiteri wall can be approximated by the summing of the pressure differences caused by the various forces.
During periods of moderate wind velocity and lo outside temperature, the pressure differences taus
by chimney action constitute a significant part of the resultant pressure differences across the upper and lower levels of a tall building.
ACKNOWLEDGEMENT
The authors are very much indebted to the building owners, Dorchester Commerce Realty Ltd., and Dorchester University Holdings Ltd. , for the per- mission to use their buildings for this study. The cooperation received from their building managers, superintendents and operating personnel during the instrumentation of the buildings i s greatly appre- ciated. The authors acknowledge the contributions made by R. G . Evans, who assisted in the field measurements, and by J . G . Arseneault, who pre- pared the computer programs for the analysis of the pressure records.
R E F E R E N C E S
1. A. G. Davenport, Wind L o a d s on Structures , Technica Paper No. 88 of the Division of Building Research (NRC 5576), Ottawa, Canada.
2. G. T. Tamura and A. G. Wilson, P r e s s u r e Difference Caused by Chimney Effect in Three High Buildings, ASHRAE TRANS., V. 73 , P a r t 11, 1967, pp. 11. 1.1 - 11. 1.10.
3. ASHRAE HANDBOOK O F FUNDAMENTALS, 1967, Chapter 25, Infiltration and Venti la t ion, p . 406.
4. J . Johns ton , Econometric Methods, McGraw-Hill Boo] Company I n c . , 1963, pp. 221.228.
5. A. Bailey and N. F . G. Vincent , Wind-Pressure on Buildings including Ef fec t s o f Adjacent Buildings Journal of the Inst i tut ion of Civi l Engineers , VO. 19-20, 1942-43, pp. 243-275.

DISCUSSION
.HARD E. B A R R E T T (Columbus , Ohio): I t would
. n t e re s t ing if the au tho r s cou ld bui ld a s c a l e lel of t h i s and surrounding bu i ld ings and conduct tudy of wind p r e s s u r e s a s measu red i n a wind nel. Although wind tunnel s t u d i e s a r e becoming .e common for l a r g e bui ld ings , there h a s been l e ef for t to co r re l a t e wind tunnel d a t a to a c t u a l asurements on l a r g e bu i ld ings b e c a u s e measure- n t s a r e no t gene ra l ly made a f t e r the bui ld ing i s ~ s t r u c t e d . Measurements on bu i ld ings a r e diffi- I t enough to ob ta in and further p rob lems a re en- untered in ident i fy ing the p r e s s u r e componen t s lely a s s o c i a t e d wi th wind. T h e authors of t h i s pape r h a v e a l r eady accom-
i shed the d i f f icul t t a s k of making p r e s s u r e meas- ements o n the bui ld ings and fac tor ing o u t the .nd p r e s s u r e s . I t s e e m s tha t , if t h e s e r e s u l t s a r e be of maximum u s e f u l n e s s in the eng inee r ing of
cure bui ld ings , a corresponding wind tunnel s tudy des i r ab le .
1 . T. TAMURA: Wind p r e s s u r e p a t t e r n s for the two ?s t bui ld ings reported in t h i s p a p e r a re in genera l greement with t h o s e reported in many pub l i ca t ions ealing with model s t u d i e s in wind tunnels . A com- arison of the v a l u e s of wind p r e s s u r e coe f f i c i en t s , lowever, i s d i f f icul t b e c a u s e of t he var ia t ion in he wind ve loc i ty prof i le , l oca t ion of reference Iressure, bui ld ing he igh t and s h a p e a n d the type of
wind tunnel u s e d in the va r ious s t u d i e s . A p a p e r e n t i t l e d "Wind P r e s s u r e Measurements
on a Fu l l -Sca le High-Rise Of f i ce Building" by W. A. Da lg le i sh e t a1 ( In ternat ional R e s e a r c h Seminar on Wind E f f e c t s on Bui ld ings and Struc- tures he ld a t the Na t iona l R e s e a r c h Counci l , O t t awa , September , 1967) d e s c r i b e s the r e s u l t s of p r e s s u r e measu remen t s on Bui ld ing B of t h i s paper. B e c a u s e of the i r i n t e r e s t in wind p r e s s u r e from the s t ruc tu ra l l oad a s p e c t of a building, the number and loca t ion of p r e s s u r e t a p s , method of recording and a n a l y s i s of wind p r e s s u r e records were d i f ferent from the o n e s d e s c r i b e d in t h i s pa- per. Where the p r e s s u r e t a p s were l o c a t e d in t h e s a m e region of t he ex te r io r wa l l , t he compar ison of the two v a l u e s of wind p r e s s u r e c o e f f i c i e n t s in- d i ca t ed r e a s o n a b l e agreement .
T h e pape r by A. D a l g l e i s h e t a1 a l s o d e s c r i b e s the r e s u l t s of model s t u d i e s of the s a m e bui ld ing in a boundary l a y e r t ype wind tunnel in which the surrounding terrain inc lud ing bui ld ings a s we l l as the t e s t bui ld ing were modeled. T h e r e s u l t s of t h e wind tunnel measu remen t s i nd ica t ed good correla- tion with t h o s e of t he f ield measurements . F o r fur- ther s t u d i e s on wind e f f ec t r e l a t ed to a i r l e a k a g e of bui ld ings , w e a r e a l s o explor ing the poss ib i l i - t i e s of model t e s t s in a boundary l aye r t y p e wind tunnel.