president securities corporation and subsidiaries...
TRANSCRIPT

PRESIDENT SECURITIES CORPORATION AND
SUBSIDIARIES
CONSOLIDATED FINANCIAL STATEMENTS AND
REPORT OF INDEPENDENT ACCOUNTANTS
JUNE 30, 2016 AND 2015
------------------------------------------------------------------------------------------------------------------------------------For the convenience of readers and for information purpose only, the auditors’ report and the accompanyingfinancial statements have been translated into English from the original Chinese version prepared and used inthe Republic of China. In the event of any discrepancy between the English version and the original Chineseversion or any differences in the interpretation of the two versions, the Chinese-language auditors’ report andfinancial statements shall prevail.

~1~
REPORT OF INDEPENDENT ACCOUNTANTS TRANSLATED FROM CHINESE
PWCR16000961
To the Board of Directors and Shareholders of President Securities Corporation
We have audited the accompanying consolidated balance sheets of President SecuritiesCorporation and its subsidiaries as of June 30, 2016, December 31, 2015, and June 30, 2015, andthe related consolidated statements of comprehensive income for the three months and six monthsended June 30, 2016 and 2015, as well as the consolidated statements of changes in equity and ofcash flows for the six months ended June 30, 2016 and 2015. These consolidated financialstatements are the responsibility of the Group’s management. Our responsibility is to express anopinion on these consolidated financial statements based on our audits.
We conducted our audits in accordance with the "Regulations Governing Auditing and Attestationof Financial Statements by Certified Public Accountants" and generally accepted auditingstandards in the Republic of China. Those standards require that we plan and perform the audit toobtain reasonable assurance about whether the financial statements are free of materialmisstatement. An audit includes examining, on a test basis, evidence supporting the amounts anddisclosures in the financial statements. An audit also includes assessing the accounting principlesused and significant estimates made by management, as well as evaluating the overall financialstatement presentation. We believe that our audits provide a reasonable basis for our opinion.
In our opinion, the consolidated financial statements referred to above present fairly, in all materialrespects, the financial position of President Securities Corporation and its subsidiaries as of June30, 2016, December 31, 2015, and June 30, 2015, the results of their operations for the threemonths and six months ended June 30, 2016 and 2015 and their cash flows for the six monthsended June 30, 2016 and 2015 in conformity with the “Rules Governing the Preparation ofFinancial Reports by Securities Firms”, “Rules Governing the Preparation of Financial Reports byFutures Commission Merchants”, and International Accounting Standard 34, ‘Interim FinancialReporting’ as endorsed by the Financial Supervisory Commission.

~2~
We have audited the parent company only financial statements of President Securities Corporation(not presented herein) as of and for the six months ended June 30, 2016 and 2015 on which wehave issued an unqualified opinion thereon.
PricewaterhouseCoopers, TaiwanAugust 8, 2016
-------------------------------------------------------------------------------------------------------------------------------------------------The accompanying consolidated financial statements are not intended to present the financial position and results ofoperations and cash flows in accordance with accounting principles generally accepted in countries and jurisdictions otherthan the Republic of China. The standards, procedures and practices in the Republic of China governing the audit of suchfinancial statements may differ from those generally accepted in countries and jurisdictions other than the Republic of China.Accordingly, the accompanying consolidated financial statements and report of independent accountants are not intended foruse by those who are not informed about the accounting principles or auditing standards generally accepted in the Republicof China, and their applications in practice.As the financial statements are the responsibility of the management, PricewaterhouseCoopers cannot accept any liability forthe use of, or reliance on, the English translation or for any errors or misunderstandings that may derive from the translation.
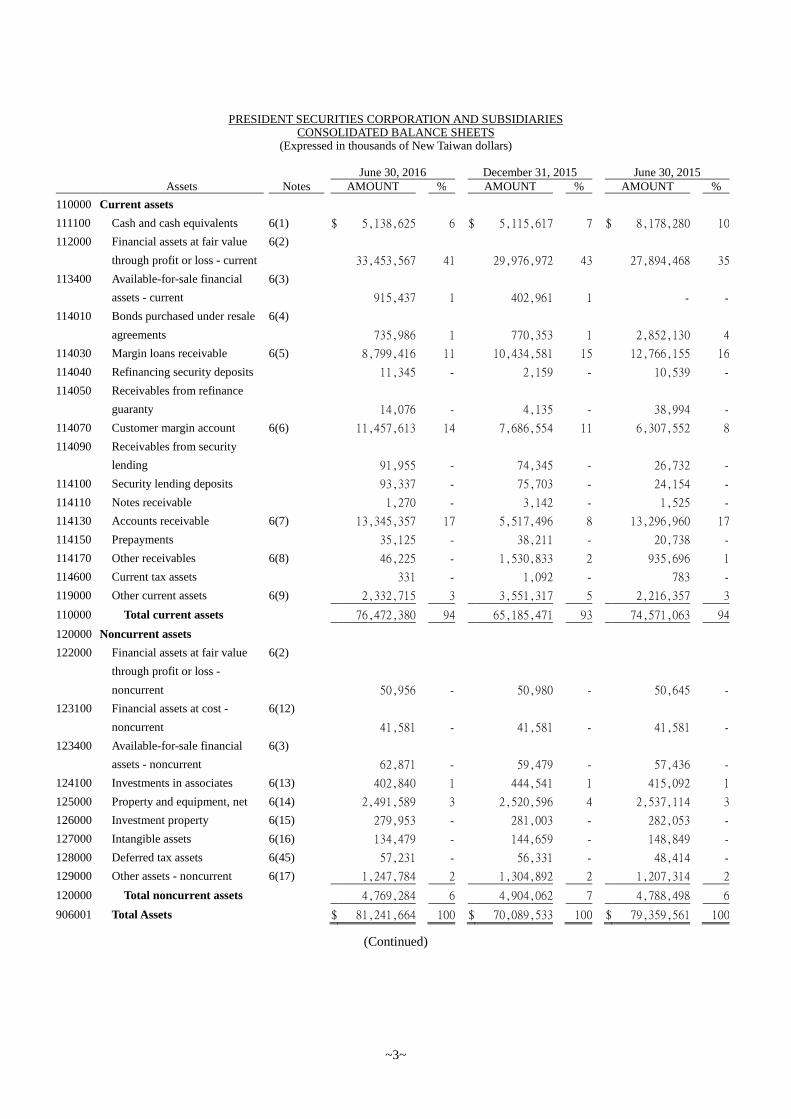
PRESIDENT SECURITIES CORPORATION AND SUBSIDIARIESCONSOLIDATED BALANCE SHEETS
(Expressed in thousands of New Taiwan dollars)
~3~
June 30, 2016 December 31, 2015 June 30, 2015Assets Notes AMOUNT % AMOUNT % AMOUNT %
110000 Current assets
111100 Cash and cash equivalents 6(1) $ 5,138,625 6 $ 5,115,617 7 $ 8,178,280 10
112000 Financial assets at fair value
through profit or loss - current
6(2)
33,453,567 41 29,976,972 43 27,894,468 35
113400 Available-for-sale financial
assets - current
6(3)
915,437 1 402,961 1 - -
114010 Bonds purchased under resale
agreements
6(4)
735,986 1 770,353 1 2,852,130 4
114030 Margin loans receivable 6(5) 8,799,416 11 10,434,581 15 12,766,155 16
114040 Refinancing security deposits 11,345 - 2,159 - 10,539 -
114050 Receivables from refinance
guaranty 14,076 - 4,135 - 38,994 -
114070 Customer margin account 6(6) 11,457,613 14 7,686,554 11 6,307,552 8
114090 Receivables from security
lending 91,955 - 74,345 - 26,732 -
114100 Security lending deposits 93,337 - 75,703 - 24,154 -
114110 Notes receivable 1,270 - 3,142 - 1,525 -
114130 Accounts receivable 6(7) 13,345,357 17 5,517,496 8 13,296,960 17
114150 Prepayments 35,125 - 38,211 - 20,738 -
114170 Other receivables 6(8) 46,225 - 1,530,833 2 935,696 1
114600 Current tax assets 331 - 1,092 - 783 -
119000 Other current assets 6(9) 2,332,715 3 3,551,317 5 2,216,357 3
110000 Total current assets 76,472,380 94 65,185,471 93 74,571,063 94
120000 Noncurrent assets
122000 Financial assets at fair value
through profit or loss -
noncurrent
6(2)
50,956 - 50,980 - 50,645 -
123100 Financial assets at cost -
noncurrent
6(12)
41,581 - 41,581 - 41,581 -
123400 Available-for-sale financial
assets - noncurrent
6(3)
62,871 - 59,479 - 57,436 -
124100 Investments in associates 6(13) 402,840 1 444,541 1 415,092 1
125000 Property and equipment, net 6(14) 2,491,589 3 2,520,596 4 2,537,114 3
126000 Investment property 6(15) 279,953 - 281,003 - 282,053 -
127000 Intangible assets 6(16) 134,479 - 144,659 - 148,849 -
128000 Deferred tax assets 6(45) 57,231 - 56,331 - 48,414 -
129000 Other assets - noncurrent 6(17) 1,247,784 2 1,304,892 2 1,207,314 2
120000 Total noncurrent assets 4,769,284 6 4,904,062 7 4,788,498 6
906001 Total Assets $ 81,241,664 100 $ 70,089,533 100 $ 79,359,561 100
(Continued)
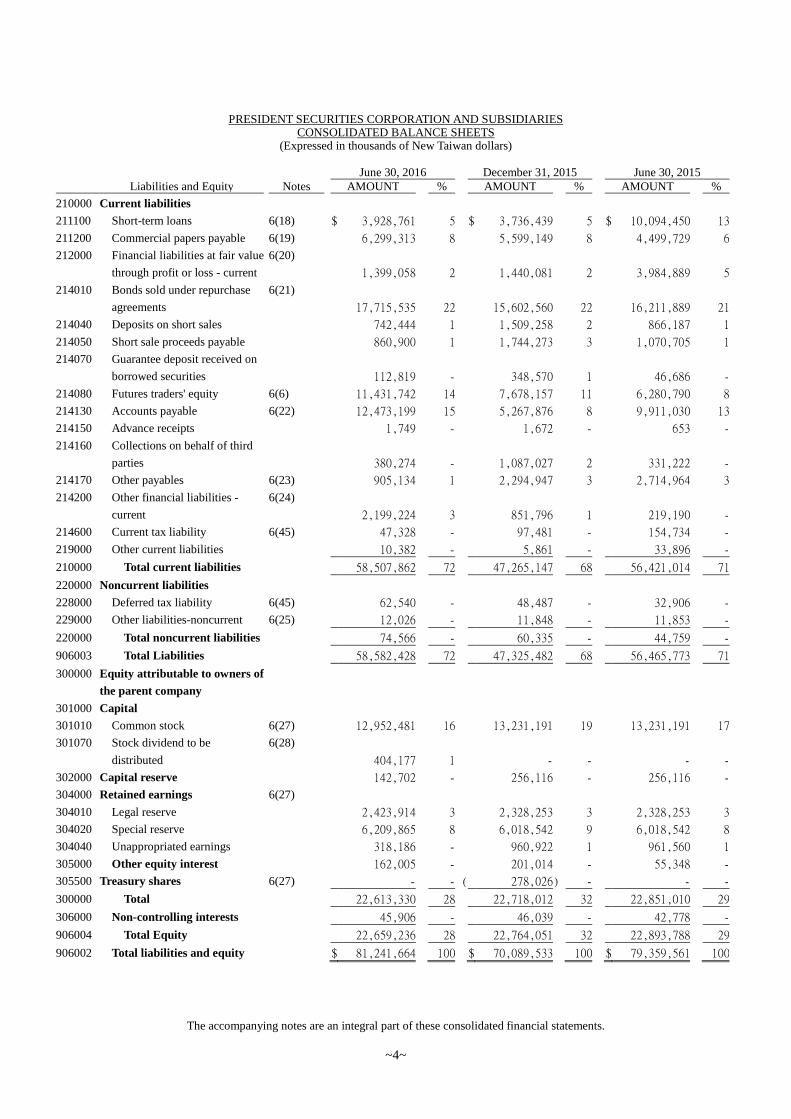
PRESIDENT SECURITIES CORPORATION AND SUBSIDIARIESCONSOLIDATED BALANCE SHEETS
(Expressed in thousands of New Taiwan dollars)
The accompanying notes are an integral part of these consolidated financial statements.
~4~
June 30, 2016 December 31, 2015 June 30, 2015Liabilities and Equity Notes AMOUNT % AMOUNT % AMOUNT %
210000 Current liabilities
211100 Short-term loans 6(18) $ 3,928,761 5 $ 3,736,439 5 $ 10,094,450 13
211200 Commercial papers payable 6(19) 6,299,313 8 5,599,149 8 4,499,729 6
212000 Financial liabilities at fair value
through profit or loss - current
6(20)
1,399,058 2 1,440,081 2 3,984,889 5
214010 Bonds sold under repurchase
agreements
6(21)
17,715,535 22 15,602,560 22 16,211,889 21
214040 Deposits on short sales 742,444 1 1,509,258 2 866,187 1
214050 Short sale proceeds payable 860,900 1 1,744,273 3 1,070,705 1
214070 Guarantee deposit received on
borrowed securities 112,819 - 348,570 1 46,686 -
214080 Futures traders' equity 6(6) 11,431,742 14 7,678,157 11 6,280,790 8
214130 Accounts payable 6(22) 12,473,199 15 5,267,876 8 9,911,030 13
214150 Advance receipts 1,749 - 1,672 - 653 -
214160 Collections on behalf of third
parties 380,274 - 1,087,027 2 331,222 -
214170 Other payables 6(23) 905,134 1 2,294,947 3 2,714,964 3
214200 Other financial liabilities -
current
6(24)
2,199,224 3 851,796 1 219,190 -
214600 Current tax liability 6(45) 47,328 - 97,481 - 154,734 -
219000 Other current liabilities 10,382 - 5,861 - 33,896 -
210000 Total current liabilities 58,507,862 72 47,265,147 68 56,421,014 71
220000 Noncurrent liabilities
228000 Deferred tax liability 6(45) 62,540 - 48,487 - 32,906 -
229000 Other liabilities-noncurrent 6(25) 12,026 - 11,848 - 11,853 -
220000 Total noncurrent liabilities 74,566 - 60,335 - 44,759 -
906003 Total Liabilities 58,582,428 72 47,325,482 68 56,465,773 71
300000 Equity attributable to owners of
the parent company
301000 Capital
301010 Common stock 6(27) 12,952,481 16 13,231,191 19 13,231,191 17
301070 Stock dividend to be
distributed
6(28)
404,177 1 - - - -
302000 Capital reserve 142,702 - 256,116 - 256,116 -
304000 Retained earnings 6(27)
304010 Legal reserve 2,423,914 3 2,328,253 3 2,328,253 3
304020 Special reserve 6,209,865 8 6,018,542 9 6,018,542 8
304040 Unappropriated earnings 318,186 - 960,922 1 961,560 1
305000 Other equity interest 162,005 - 201,014 - 55,348 -
305500 Treasury shares 6(27) - - ( 278,026) - - -
300000 Total 22,613,330 28 22,718,012 32 22,851,010 29
306000 Non-controlling interests 45,906 - 46,039 - 42,778 -
906004 Total Equity 22,659,236 28 22,764,051 32 22,893,788 29
906002 Total liabilities and equity $ 81,241,664 100 $ 70,089,533 100 $ 79,359,561 100

PRESIDENT SECURITIES CORPORATION AND SUBSIDIARIESCONSOLIDATED STATEMENTS OF COMPREHENSIVE INCOME
(Expressed in thousands of New Taiwan dollars, except earnings per share amounts)
~5~
Three months ended June 30 Six months ended June 302016 2015 2016 2015
Items Notes AMOUNT % AMOUNT % AMOUNT % AMOUNT %
400000 Revenues
401000 Securities brokerage fees 6(29) $ 429,242 46 $ 583,653 35 $ 902,661 42 $ 1,061,629 38
404000 Underwriting fees 6(30) 6,968 1 16,361 1 20,580 1 38,525 1
406000 Net income of wealth
management 5,792 1 1,909 - 7,912 - 2,711 -
410000 (Loss) gains on trading of
securities
6(31)
( 96,035) ( 10) 619,816 37 ( 173,318) ( 8) 921,757 33
421100 Stock custodian income 20,003 2 19,219 1 36,357 2 35,053 1
421200 Interest income 6(32) 299,329 32 372,604 22 618,388 29 688,220 25
421300 Dividend income 72,989 8 42,578 3 74,404 4 45,445 2
421500 (Loss) gain on valuation of
trading securities
6(33)
( 64,330) ( 7) ( 259,708) ( 16) 253,748 12 ( 330,855) ( 12)
421600 (Loss) gain on short covering
and trading securities - RS
financing covering
6(34)
( 30,252) ( 3) 30,745 2 ( 19,938) ( 1) 12,186 -
421610 (Loss) gain on valuation of
borrowed securities and bonds
with resale agreements
6(35)
( 10,096) ( 1) 24,776 2 ( 57,536) ( 3) 26,148 1
422200 Gain (loss) on warrants
issuance
6(36)
114,358 12 13,443 1 245,233 11 ( 42,037) ( 1)
424400 Gain on derivative financial
instruments
6(37)
128,580 14 167,850 10 144,612 7 248,749 9
428000 Other operating income 6(38) 46,911 5 39,106 2 91,313 4 96,095 3
Total revenues 923,459 100 1,672,352 100 2,144,416 100 2,803,626 100
500000 Expenses
501000 Handling charges 6(39) ( 76,822) ( 8) ( 87,106) ( 5) ( 155,241) ( 7) ( 158,262) ( 6)
521200 Interest expenses 6(40) ( 41,765) ( 5) ( 100,036) ( 6) ( 107,538) ( 5) ( 176,923) ( 6)
524100 Futures commission expense ( 29,218) ( 3) ( 21,049) ( 1) ( 59,511) ( 3) ( 44,829) ( 2)
524300 Clearing charges ( 28,882) ( 3) ( 27,794) ( 2) ( 56,706) ( 2) ( 49,467) ( 2)
528000 Other operating costs ( 51) - ( 50) - ( 51) - ( 50) -
531000 Employee benefits 6(41) ( 435,787) ( 47) ( 491,207) ( 30) ( 916,027) ( 43) ( 1,052,451) ( 37)
532000 Depreciation and amortization 6(42) ( 31,102) ( 3) ( 30,644) ( 2) ( 62,520) ( 3) ( 61,186) ( 2)
533000 Other operating expenses 6(43) ( 303,580) ( 33) ( 487,270) ( 29) ( 625,680) ( 29) ( 787,416) ( 28)
Total expenditures and
expenses ( 947,207) ( 102) ( 1,245,156) ( 75) ( 1,983,274) ( 92) ( 2,330,584) ( 83)
(Continued)
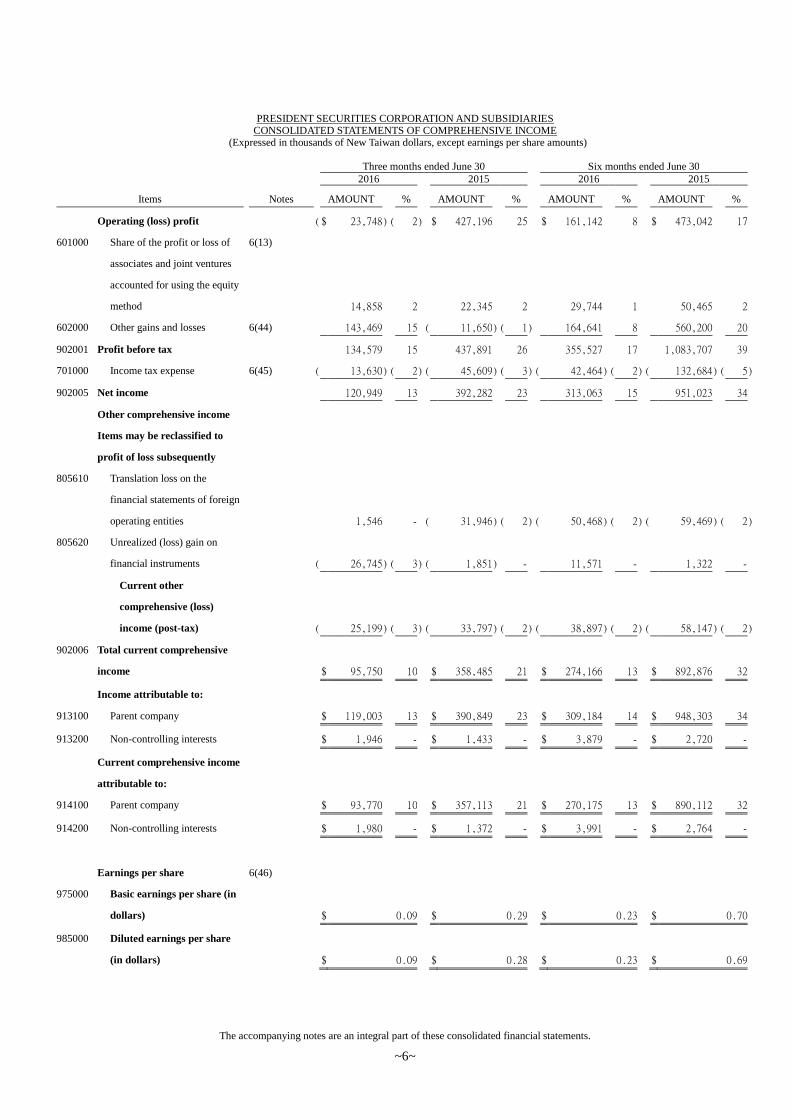
PRESIDENT SECURITIES CORPORATION AND SUBSIDIARIESCONSOLIDATED STATEMENTS OF COMPREHENSIVE INCOME
(Expressed in thousands of New Taiwan dollars, except earnings per share amounts)
The accompanying notes are an integral part of these consolidated financial statements.
~6~
Three months ended June 30 Six months ended June 302016 2015 2016 2015
Items Notes AMOUNT % AMOUNT % AMOUNT % AMOUNT %
Operating (loss) profit ($ 23,748) ( 2) $ 427,196 25 $ 161,142 8 $ 473,042 17
601000 Share of the profit or loss of
associates and joint ventures
accounted for using the equity
method
6(13)
14,858 2 22,345 2 29,744 1 50,465 2
602000 Other gains and losses 6(44) 143,469 15 ( 11,650) ( 1) 164,641 8 560,200 20
902001 Profit before tax 134,579 15 437,891 26 355,527 17 1,083,707 39
701000 Income tax expense 6(45) ( 13,630) ( 2) ( 45,609) ( 3) ( 42,464) ( 2) ( 132,684) ( 5)
902005 Net income 120,949 13 392,282 23 313,063 15 951,023 34
Other comprehensive income
Items may be reclassified to
profit of loss subsequently
805610 Translation loss on the
financial statements of foreign
operating entities 1,546 - ( 31,946) ( 2) ( 50,468) ( 2) ( 59,469) ( 2)
805620 Unrealized (loss) gain on
financial instruments ( 26,745) ( 3) ( 1,851) - 11,571 - 1,322 -
Current other
comprehensive (loss)
income (post-tax) ( 25,199) ( 3) ( 33,797) ( 2) ( 38,897) ( 2) ( 58,147) ( 2)
902006 Total current comprehensive
income $ 95,750 10 $ 358,485 21 $ 274,166 13 $ 892,876 32
Income attributable to:
913100 Parent company $ 119,003 13 $ 390,849 23 $ 309,184 14 $ 948,303 34
913200 Non-controlling interests $ 1,946 - $ 1,433 - $ 3,879 - $ 2,720 -
Current comprehensive income
attributable to:
914100 Parent company $ 93,770 10 $ 357,113 21 $ 270,175 13 $ 890,112 32
914200 Non-controlling interests $ 1,980 - $ 1,372 - $ 3,991 - $ 2,764 -
Earnings per share 6(46)
975000 Basic earnings per share (in
dollars) $ 0.09 $ 0.29 $ 0.23 $ 0.70
985000 Diluted earnings per share
(in dollars) $ 0.09 $ 0.28 $ 0.23 $ 0.69
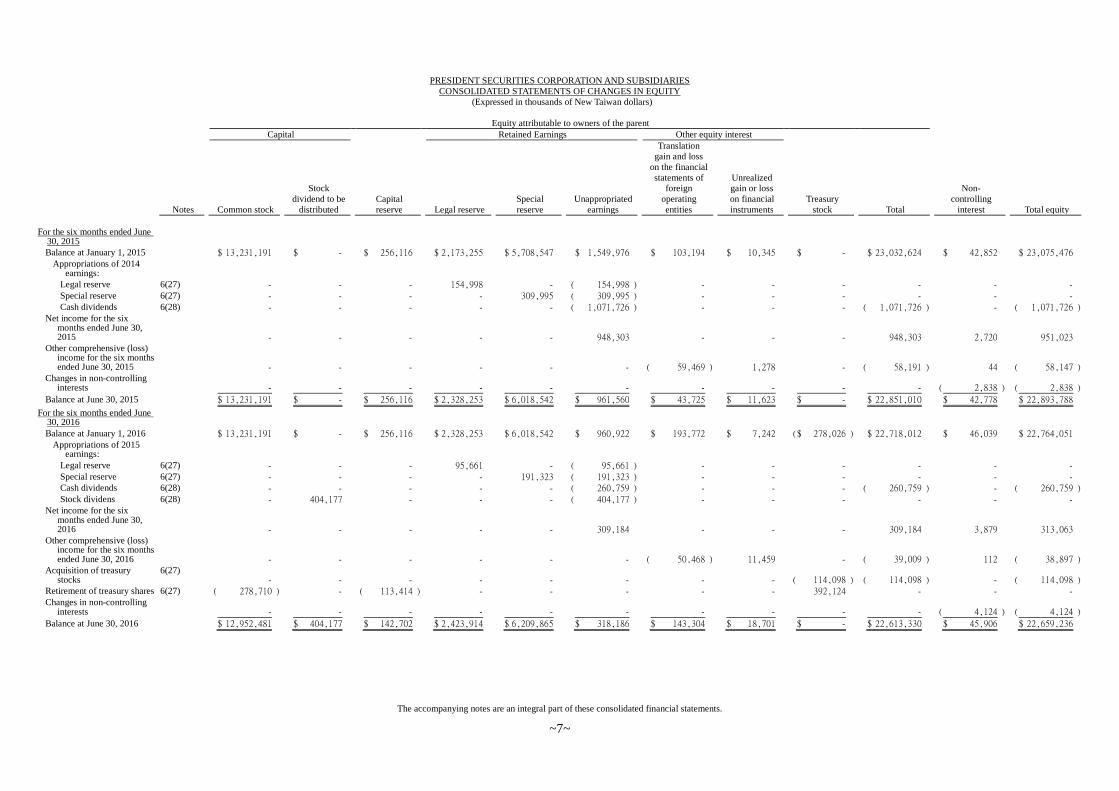
PRESIDENT SECURITIES CORPORATION AND SUBSIDIARIESCONSOLIDATED STATEMENTS OF CHANGES IN EQUITY
(Expressed in thousands of New Taiwan dollars)
Equity attributable to owners of the parentCapital Retained Earnings Other equity interest
Notes Common stock
Stockdividend to be
distributedCapitalreserve Legal reserve
Specialreserve
Unappropriatedearnings
Translationgain and loss
on the financialstatements of
foreignoperatingentities
Unrealizedgain or losson financialinstruments
Treasurystock Total
Non-controlling
interest Total equity
The accompanying notes are an integral part of these consolidated financial statements.
~7~
For the six months ended June30, 2015Balance at January 1, 2015 $ 13,231,191 $ - $ 256,116 $ 2,173,255 $ 5,708,547 $ 1,549,976 $ 103,194 $ 10,345 $ - $ 23,032,624 $ 42,852 $ 23,075,476
Appropriations of 2014earnings:
Legal reserve 6(27) - - - 154,998 - ( 154,998 ) - - - - - -Special reserve 6(27) - - - - 309,995 ( 309,995 ) - - - - - -Cash dividends 6(28) - - - - - ( 1,071,726 ) - - - ( 1,071,726 ) - ( 1,071,726 )
Net income for the sixmonths ended June 30,2015 - - - - - 948,303 - - - 948,303 2,720 951,023
Other comprehensive (loss)income for the six monthsended June 30, 2015 - - - - - - ( 59,469 ) 1,278 - ( 58,191 ) 44 ( 58,147 )
Changes in non-controllinginterests - - - - - - - - - - ( 2,838 ) ( 2,838 )
Balance at June 30, 2015 $ 13,231,191 $ - $ 256,116 $ 2,328,253 $ 6,018,542 $ 961,560 $ 43,725 $ 11,623 $ - $ 22,851,010 $ 42,778 $ 22,893,788
For the six months ended June30, 2016Balance at January 1, 2016 $ 13,231,191 $ - $ 256,116 $ 2,328,253 $ 6,018,542 $ 960,922 $ 193,772 $ 7,242 ($ 278,026 ) $ 22,718,012 $ 46,039 $ 22,764,051
Appropriations of 2015earnings:
Legal reserve 6(27) - - - 95,661 - ( 95,661 ) - - - - - -Special reserve 6(27) - - - - 191,323 ( 191,323 ) - - - - - -Cash dividends 6(28) - - - - - ( 260,759 ) - - - ( 260,759 ) - ( 260,759 )Stock dividens 6(28) - 404,177 - - - ( 404,177 ) - - - - - -
Net income for the sixmonths ended June 30,2016 - - - - - 309,184 - - - 309,184 3,879 313,063
Other comprehensive (loss)income for the six monthsended June 30, 2016 - - - - - - ( 50,468 ) 11,459 - ( 39,009 ) 112 ( 38,897 )
Acquisition of treasurystocks
6(27)- - - - - - - - ( 114,098 ) ( 114,098 ) - ( 114,098 )
Retirement of treasury shares 6(27) ( 278,710 ) - ( 113,414 ) - - - - - 392,124 - - -Changes in non-controlling
interests - - - - - - - - - - ( 4,124 ) ( 4,124 )
Balance at June 30, 2016 $ 12,952,481 $ 404,177 $ 142,702 $ 2,423,914 $ 6,209,865 $ 318,186 $ 143,304 $ 18,701 $ - $ 22,613,330 $ 45,906 $ 22,659,236

PRESIDENT SECURITIES CORPORATION AND SUBSIDIARIESCONSOLIDATED STATEMENTS OF CASH FLOWS
(Expressed in thousands of New Taiwan dollars)
Six months ended June 30,
Notes 2016 2015
~8~
CASH FLOWS FROM OPERATING ACTIVITIESProfit before tax $ 355,527 $ 1,083,707
AdjustmentsIncome and expenses having no effect on cash flows
Depreciation 6(42) 46,856 47,056Amortization 6(42) 15,664 14,130Write-off of bad debts classified as income 6(17) ( 5,955 ) ( 154 )Provision for bad debts 6(7)(17) 22,149 145,571(Gain) loss on valuation of trading securities 6(33) ( 253,748 ) 330,855Loss (gain) on valuation of borrowed securities and bonds
with resale agreements6(35)
57,536 ( 26,148 )Financial expense 6(40) 107,538 176,923Interest income 6(32)(44) ( 697,007 ) ( 759,111 )Dividend income ( 89,820 ) ( 58,765 )Share of the profit of associates and joint ventures accounted
for using the equity method6(13)
( 29,744 ) ( 50,465 )Loss on disposal of property and equipment 6(14) 9 1,212Gain on valuation of non-operating financial instrument 6(44) ( 8,369 ) ( 3,510 )
Changes in assets/liabilities relating to operating activitiesChanges in operating assets
Financial assets at fair value through profit or loss ( 3,214,742 ) ( 5,507,263 )Available-for-sale financial assets - current ( 504,298 ) -Bonds purchased under resale agreements 34,367 ( 1,349,766 )Margin loans receivable 1,613,256 504,422Refinancing security deposits ( 9,186 ) ( 10,320 )Receivables from refinance guaranty ( 9,941 ) ( 37,324 )Customer margin account ( 3,771,059 ) ( 738,324 )Receivables from security lending ( 17,610 ) ( 14,508 )Security lending deposits ( 17,634 ) ( 13,112 )Notes receivable 1,872 ( 531 )Accounts receivable ( 6,815,887 ) ( 6,308,064 )Prepayments 3,086 7,056Other receivables 12,500 ( 563,922 )Other current assets 1,218,602 890,201
Net changes in liabilities relating to operating activitiesFinancial liabilities at fair value through profit or loss -
current ( 98,559 ) 1,942,787Bonds sold under repurchase agreements 2,112,975 7,127,419Deposits on short sales ( 766,814 ) ( 652,865 )Short sale proceeds payable ( 883,373 ) ( 771,686 )Guarantee deposit received on borrowed securities ( 235,751 ) ( 888,885 )Futures traders’ equity 3,753,585 727,641Accounts payable 6,210,152 3,476,309Advance receipts 77 169Collections on behalf of third parties ( 706,753 ) 61,267Other receivables ( 177,208 ) 477,532Other financial liabilities - current 1,347,428 ( 75,395 )Other current liabilities 4,521 28,764
(Continued)

PRESIDENT SECURITIES CORPORATION AND SUBSIDIARIESCONSOLIDATED STATEMENTS OF CASH FLOWS
(Expressed in thousands of New Taiwan dollars)
Six months ended June 30,
Notes 2016 2015
The accompanying notes are an integral part of these consolidated financial statements.
~9~
Cash outflow generated from operations ($ 1,395,758 ) ($ 787,097 )
Dividends received 98,851 72,010
Interest received 745,711 707,057
Income tax paid ( 78,703 ) ( 128,460 )
Net cash flows used in operating activities ( 629,899 ) ( 136,490 )
CASH FLOWS FROM INVESTING ACTIVITIES
Acquisition of property and equipment 6(14) ( 7,793 ) ( 10,463 )
Proceeds from disposal of property and equipment - 183
Acquisition of intangible assets ( 2,896 ) ( 625 )
Decrease in other non-current assets 58,850 137,534
Increase in prepayment for equipment ( 13,345 ) ( 18,536 )
Net cash flows from investing activities 34,816 108,093
CASH FLOWS FROM FINANCING ACTIVITIES
Increase in short-term loans 192,322 1,333,473
Increase in commercial papers payable 700,000 750,000
Increase in other non-current liabilities 178 869
Acquisition of treasury stocks 6(27) ( 114,098 ) -
Interest paid ( 109,843 ) ( 173,415 )
Net cash flows from financing activities 668,559 1,910,927
Effect of exchange rate changes ( 50,468 ) ( 59,469 )
Net increase in cash and cash equivalents 23,008 1,823,061
Cash and cash equivalents at beginning of period 5,115,617 6,355,219
Cash and cash equivalents at end of period $ 5,138,625 $ 8,178,280

~10~
PRESIDENT SECURITIES CORPORATION AND SUBSIDIARIES
NOTES TO THE CONSOLIDATED FINANCIAL STATEMENTS
JUNE 30, 2016 AND 2015
(Expressed in thousands of New Taiwan dollars)
1. HISTORY AND ORGANIZATION
1) President Securities Corporation (the “Company”) was incorporated as a company limitedby shares under the provisions of the Company Law of the Republic of China (R.O.C.) onDecember 17, 1988, and was renamed as President Securities Corporation on March 4,1989. The Company started commercial operations on April 3, 1989. As of June 30, 2016,the Company had 40 operating branches (including the Head Office), and establishedOffshore Securities Unit in July 2014.
2) The Company and its subsidiaries (collectively referred herein as the “Group”) areprimarily engaged in underwriting of securities, dealing or brokerage business of securitiesat the securities exchange markets and business premises, registration and transfer agencyservice for securities, margin loans and short sales business of securities, securities lendingand borrowing business, futures introducing brokerage services, futures dealing, issuanceof call (put) warrants, new financial instrument transactions, wealth management business,and trust business.
3) The Company’s shares are listed on the Taiwan Stock Exchange.4) The number of employees of the Group was 1,777 and 1,824 as of June 30, 2016 and 2015,
respectively.
2. THE DATE OF AUTHORIZATION FOR ISSUANCE OF THE CONSOLIDATED
FINANCIAL STATEMENTS AND PROCEDURES FOR AUTHORIZATION
These consolidated financial statements were authorized for issuance by the Board ofDirectors on August 8, 2016.
3. APPLICATION OF NEW STANDARDS, AMENDMENTS AND INTERPRETATIONS
1) Effect of the adoption of new issuances of or amendments to International FinancialReporting Standards (“IFRS”) as endorsed by the Financial Supervisory Commission(“FSC”)
None.
2) Effect of new issuances of or amendments to IFRSs as endorsed by the FSC but not yetadopted by the GroupNew standards, interpretations and amendments included in the IFRSs endorsed by theFSC effective from 2017:

~11~
The above standards and interpretations have no significant impact to the Group’s financialcondition and operating result based on the Group’s assessment. The quantitative impactwill be disclosed when the assessment is complete.
3) IFRSs issued by IASB but not yet endorsed by the FSCNew standards, interpretations and amendments issued by IASB but not yet included in theIFRSs endorsed by the FSC effective from 2017:
Except for the following, the above standards and interpretations have no significantimpact to the Group’s financial condition and operating result based on the Group’sassessment. The quantitative impact will be disclosed when the assessment is complete.
New Standards, Interpretations and Amendments
Effective Date by
International Accounting
Standards Board
Investment entities: applying the consolidation exception
(amendments to IFRS 10, IFRS 12 and IAS 28)January 1, 2016
Disclosure initiative (amendments to IAS 1) January 1, 2016
Clarification of acceptable methods of depreciation and amortisation
(amendments to IAS 16 and IAS 38)January 1, 2016
Services related contributions from employees or third parties
(amendments to IAS 19)July 1, 2014
Equity method in separate financial statements (amendments to IAS
27)
January 1, 2016
Recoverable amount disclosures for non-financial assets
(amendments to IAS 36)January 1, 2014
Novation of derivatives and continuation of hedge accounting
(amendments to IAS 39)January 1, 2014
Improvements to IFRSs 2010-2012 July 1, 2014
Improvements to IFRSs 2011-2013 July 1, 2014
Improvements to IFRSs 2012-2014 January 1, 2016
New Standards, Interpretations and Amendments
Effective Date by
International Accounting
Standards Board
IFRS 9,‘Financial instruments’ January 1, 2018
Sale or contribution of assets between an investor and its associate
or joint venture (amendments to IFRS 10 and IAS 28)
To be determined by
International Accounting
Standards BoardIFRS 15, ‘Revenue from contracts with customers’ January 1, 2018
Clarifications to IFRS 15, ‘Revenue from contracts with customers'
(amendments to IFRS 15)January 1, 2018
IFRS 16, ‘Leases’ January 1, 2019
Disclosure initiative (amendments to IAS 7) January 1, 2017
Recognition of deferred tax assets for unrealized losses (amendments
to IAS 12)January 1, 2017

~12~
A. IFRS 9, “Financial instruments”(a) Classification of debt instruments is driven by the entity’s business model and the
contractual cash flow characteristics of the financial assets, which would beclassified as financial asset at fair value through profit or loss, financial assetmeasured at fair value through other comprehensive income or financial assetmeasured at amortised cost. Equity instruments would be classified as financialasset at fair value through profit or loss, unless an entity makes an irrevocableelection at inception to present in other comprehensive income subsequent changesin the fair value of an investment in an equity instrument that is not held for trading.
(b) The impairment losses of debt instruments are assessed using an ‘expected creditloss’ approach. An entity assesses at each balance sheet date whether there has beena significant increase in credit risk on that instrument since initial recognition torecognise 12-month expected credit losses (‘ECL’) or lifetime ECL (interestrevenue would be calculated on the gross carrying amount of the asset beforeimpairment losses occurred); or if the instrument that has objective evidence ofimpairment, interest revenue after the impairment would be calculated on the bookvalue of net carrying amount (i.e. net of credit allowance).
(c) The amended general hedge accounting requirements align hedge accounting moreclosely with an entity’s risk management strategy. Risk components of non-financial items and a group of items can be designated as hedged items. Thestandard relaxes the requirements for hedge effectiveness, removing the 80-125%bright line, and introduces the concept of ‘rebalancing’; while its risk managementobjective remains unchanged, an entity shall rebalance the hedged item or thehedging instrument for the purpose of maintaining the hedge ratio.
B. IFRS 16, “Leases”IFRS 16, 'Leases', replaces IAS 17, 'Leases' and related interpretations and SICs. Thestandard requires lessees to recognise a 'right-of-use asset' and a lease liability (exceptfor those leases with terms of 12 months or less and leases of low-value assets). Theaccounting stays the same for lessors, which is to classify their leases as either financeleases or operating leases and account for those two types of leases differently. IFRS16 only requires enhanced disclosures to be provided by lessors.
4. SUMMARY OF SIGNIFICANT ACCOUNTING POLICIES
The Group’s significant accounting policies are described below:1) Compliance statement
The consolidated financial statements of the Group have been prepared in accordance withthe “Regulations Governing the Preparation of Financial Reports by Securities Firms”,“Regulations Governing the Preparation of Financial Reports by Futures CommissionMerchants”, and the International Financial Reporting Standards, International AccountingStandards, IFRIC Interpretations, and SIC Interpretations as endorsed by the FSC(collectively referred herein as the “IFRSs”).
2) Basis of preparationA. Except for the following items, these consolidated financial statements have been
prepared under the historical cost convention:(A) Financial assets and financial liabilities (including derivative instruments) at fair
value through profit or loss.(B) Available-for-sale financial assets measured at fair value.(C) Defined benefit liabilities recognised based on the net amount of pension fund
assets less present value of defined benefit obligations.

~13~
B. The preparation of financial statements in conformity with IFRSs requires the use ofcertain critical accounting estimates. It also requires management to exercise itsjudgement in the process of applying the Group’s accounting policies. The areasinvolving a higher degree of judgement or complexity, or areas where assumptions andestimates are significant to the consolidated financial statements are disclosed in Note5.
3) Basis of consolidationA. Basis for preparation of consolidated financial statements:
(A) All subsidiaries are included in the Group’s consolidated financial statements.Subsidiaries are all entities (including structured entities) control by the Group.The Group controls an entity when the Group is exposed, or has rights, to variablereturns from its involvement with the entity and has the ability to affect thosereturns through its power over the entity. Consolidated of subsidiaries begins fromthe date the Group obtains control of the subsidiaries and ceases when the Grouploses control of the subsidiaries.
(B) Intercompany transactions, balances and unrealized gains or losses on transactionsbetween companies within the Group are eliminated. Accounting policies ofsubsidiaries have been adjusted where necessary to ensure consistency with thepolicies adopted by the Group.
(C) Profit or loss and each component of other comprehensive income are attributedto the owners of the parent and to the non-controlling interests. Totalcomprehensive income is attributed to the owners of the parent and to the non-controlling interests even if this results in the non-controlling interests having adeficit balance.
(D) Changes in a parent’s ownership interest in a subsidiary that do not result in theparent losing control of the subsidiary (transactions with non-controlling interests)are accounted for as equity transactions, i.e. transactions with owners in theircapacity as owners. Any difference between the amount by which the non-controlling interests are adjusted and the fair value of the consideration paid orreceived is recognised directly in equity.
(E) When the Group loses control of a subsidiary, the Group remeasures anyinvestment retained in the former subsidiary at its fair value. That fair value isregarded as the fair value on initial recognition of a financial asset or the cost oninitial recognition of the associate or joint venture. Any difference between fairvalue and carrying amount is recognised in profit or loss. All amounts previouslyrecognised in other comprehensive income in relation to the subsidiary arereclassified to profit or loss, on the same basis as would be required if the relatedassets or liabilities were disposed of. That is, when the Group loses control of asubsidiary, all gains or losses previously recognised in other comprehensiveincome in relation to the subsidiary should be reclassified from equity to profit orloss, if such gains or losses would be reclassified to profit or loss when the relatedassets or liabilities are disposed of.
B. Subsidiaries included in the consolidated financial statements:

~14~
Name of Main Business
Investor Name of Subsidiary Activities June 30, 2016 December 31, 2015
The
Company
President Futures Corp.
(President Futures)
Futures brokerage 96.69% 96.69%
〃 President Capital Management
Corp. (President Capital
Management)
Securities
investment
consulting
100% 100%
〃 President Securities (HK)
Ltd.(President Securities (HK))
(Note 1)
Securities dealer,
brokerage,
underwriting and
consulting
5.19% 5.19%
〃 President Securities (BVI)
Ltd.(President Securities
(BVI))
Securities
investment and
holding company
100% 100%
〃 President Personal Insurance
Agency Co., Ltd. (President
Personal Insurance Agency)
(Note 2)
Insurance Agent 100% 100%
〃 President Insurance Agency
Corp. (President Insurance
Agency) (Note 2)
Insurance Agent 100% 100%
〃 PSC Venture Capital
Investment Company Limited
(President Venture Capital)
Venture Capital 100% 100%
President
Securities
(BVI)
President Securities (HK) Ltd.
(Note 1)
Securities dealer,
brokerage,
underwriting and
consulting
94.81% 94.81%
〃 President Wealth Management
(HK) Ltd.(President Wealth
Management (HK))
Wealth
management
100% 100%
〃 President Securities (Nominee)
Ltd. (President Securities
(Nominee))
Nominee Service 100% 100%
Ownership (%)

~15~
Note 1: The Company holds all the shares of President Securities (HK) with PresidentSecurities (BVI).
Note 2: On April 27, 2016, the Board of Directors of President Insurance Agency Corp.and President Personal Insurance Agency Co., Ltd. resolved to merge the twocompanies. President Insurance Agency Corp. was the surviving companywhile President Personal Insurance Agency Co., Ltd. was the dissolvedcompany. The effective date was set on July 1, 2016.
4) Classification of current and non-current itemsA. Assets that meet one of the following criteria are classified as current assets; otherwise
they are classified as non-current assets:(A) Assets arising from operating activities that are expected to be realized, or are
intended to be sold or consumed within the normal operating cycle;(B) Assets held mainly for trading purposes;(C) Assets that are expected to be realized within twelve months from the balance
sheet date;(D) Cash and cash equivalents, excluding restricted cash and cash equivalents and
those that are to be exchanged or used to pay off liabilities more than twelvemonths after the balance sheet date.
B. Liabilities that meet one of the following criteria are classified as current liabilities;otherwise they are classified as non-current liabilities:(A) Liabilities that are expected to be paid off within the normal operating cycle;(B) Liabilities arising mainly from trading activities;(C) Liabilities that are to be paid off within twelve months from the balance sheet date;(D) Liabilities for which the repayment date cannot be extended unconditionally to
more than twelve months after the balance sheet date. Terms of a liability that
Name of Main Business
Investor Name of Subsidiary Activities June 30, 2015
The
Company
President Futures Corp. Futures brokerage 96.69%
〃 President Capital Management
Corp.
Securities
investment
100%
〃 President Securities (HK) Ltd.
(Note 1)
Securities dealer,
brokerage,
underwriting and
consulting
5.19%
〃 President Securities (BVI) Ltd. Securities
investment and
100%
〃 President Personal Insurance
Agency Co., Ltd.
Insurance Agent 100%
〃 President Insurance Agency
Corp.
Insurance Agent 100%
〃 PSC Venture Capital
Investment Company Limited
Venture Capital 100%
President
Securities
(BVI)
President Securities (HK) Ltd.
(Note 1)
Securities dealer,
brokerage,
underwriting and
consulting
94.81%
〃 President Wealth Management
(HK) Ltd.
Wealth
management
100%
〃 President Securities (Nominee)
Ltd.
Nominee Service 100%
Ownership (%)

~16~
could, at the option of the counterparty, result in its settlement by the issue ofequity instruments do not affect its classification.
5) Translation of foreign currency transactionsA. Foreign currency translation and presentation
Items included in the consolidated financial statements of the Group are measured usingthe currency of the primary economic environment in which the Group operates (the“functional currency”). Functional currency and bookkeeping currency of the Companyand its domestic subsidiaries are all New Taiwan Dollars; functional currency andbookkeeping currency of overseas subsidiaries-President Securities (HK), PresidentWealth Management (HK), and President Securities (Nominee) are Hong Kong Dollars;and functional currency and bookkeeping currency of President Securities (BVI) are USDollars. The consolidated financial statements are presented in New Taiwan Dollars.
B. Foreign currency transactions and balancesForeign currency transactions denominated in a foreign currency or required to settle ina foreign currency are translated into the functional currency using the exchange ratesprevailing at the dates of the transactions.Assets and liabilities denominated in foreign currency are translated by the closingexchange rate at balance sheet date. The closing exchange rate is determined by themarket exchange rate. Non-monetary assets and liabilities denominated in foreigncurrencies which are carried at historical cost are re-translated at the exchange ratesprevailing at the original transaction date. Non-monetary assets and liabilitiesdenominated in foreign currencies held at fair value through profit or loss are re-translated at the exchange rates prevailing at the balance sheet date; their translationdifferences are recognised in profit or loss. Non-monetary assets and liabilitiesdenominated in foreign currencies held at fair value through other comprehensiveincome are re-translated at the exchange rates prevailing at the balance sheet date; theirtranslation differences are recognised in other comprehensive income.
C. Translation of foreign operationsThe operating results and financial position of all the group entities, associates and jointarrangements that have a functional currency different from the presentation currencyare translated into the presentation currency as follows:(A) Assets and liabilities for each balance sheet presented are translated at the closing
exchange rate at the date of that balance sheet;(B) Income and expenses for each statement of comprehensive income are translated
at average exchange rates of that period; and(C) All resulting exchange differences are recognised in other comprehensive income.
6) Cash and cash equivalentsA. In the consolidated statement of cash flows, cash and cash equivalents includes cash on
hand, deposits held at call with banks, and other short-term highly liquid investments.B. Cash equivalents refer to short-term, highly liquid investments that are readily
convertible to known amounts of cash and which are subject to an insignificant risk ofchanges in value. Time deposits that meet the definition above and are held for thepurpose of meeting short-term cash commitments in operations are classified as cashequivalents.

~17~
7) Financial assets and financial liabilities at fair value through profit or lossA. Financial assets and financial liabilities at fair value through profit or loss are financial
assets and financial liabilities held for trading or financial assets and financial liabilitiesdesignated as at fair value through profit or loss on initial recognition. Financial assetsand financial liabilities are classified in this category of held for trading if acquiredprincipally for the purpose of selling or repurchasing in the short-term. Derivatives arealso categorized as financial instruments held for trading unless they are designated ashedges.
B. On a regular way purchase or sale basis, financial assets held for trading are recognisedand derecognised using trade date accounting.
C. Financial assets at fair value through profit or loss are initially recognised at fair value.Related transaction costs are expensed in profit or loss. These financial assets aresubsequently remeasured and stated at fair value, and any changes in the fair value ofthese financial assets are recognised in profit or loss. Derivative assets, that are linkedto equity instruments which do not have a quoted market price in an active market andcannot be measured reliably at fair value, and that must be settled by delivery, of suchunquoted equity instruments are presented in ‘financial assets measured at cost’, if theirfair value cannot be reliably measured. Derivative liabilities that are linked to equityinstruments which do not have a quoted market price in an active market and cannot bemeasured reliably at fair value, and that must be settled by delivery of such unquotedequity instruments are presented in ‘financial liabilities measured at cost’, if their fairvalue cannot be reliably measured.
8) Available-for-sale financial assetsA. Available-for-sale financial assets are non-derivatives that are either designated in this
category or not classified in any of the other categories.B. On a regular way purchase or sale basis, available-for-sale financial assets are
recognised and derecognised using trade date accounting.C. Available-for-sale financial assets are initially recognised at fair value plus transaction
costs. These financial assets are subsequently remeasured and stated at fair value, andany changes in the fair value of these financial assets are recognised in othercomprehensive income. Investments in equity instruments that do not have a quotedmarket price in an active market and whose fair value cannot be reliably measured orderivatives that are linked to and must be settled by delivery of such unquoted equityinstruments are presented in ‘financial assets measured at cost’.
D. If there has been objective evidence of impairment, the Group will account forimpairment. If, in a subsequent period, the fair value of an investment in a debtinstrument increases, and the increase can be related objectively to an event occurringafter the impairment loss was recognised, then such impairment loss is reversed throughprofit or loss. Impairment loss of an investment in an equity instrument recognised inprofit or loss shall not be reversed through profit or loss. Impairment loss is recognisedand reversed by adjusting the carrying amount of the asset through the use of animpairment allowance account.
9) Notes and accounts receivable, other receivables and margin loans receivableA. Notes and accounts receivable and margin loans receivable are claims resulting from the
sales of goods or services; other receivables are receivables other than the above. Notesand accounts receivable and margin loans receivable are recognised initially at fair valueand subsequently measured at amortised cost using the effective interest method lessprovision for impairment loss.
~18~
B. The Group assesses at each balance sheet date whether there is objective evidence thata financial asset or a group of financial assets is impaired. A provision for impairmentof financial asset is established when there is objective evidence that it is impaired. Theamount of the provision is the difference between the asset’s carrying amount and thepresent value of estimated future cash flows, discounted at the original effective interestrate. When the fair value of the asset subsequently increases and the increase can beobjectively related to an event occurring after the impairment loss being recognised inprofit or loss, the impairment loss shall be reversed to the extent of the loss previouslyrecognised in profit or loss. Such recovery of impairment loss shall not make the asset’scarrying amount greater than its amortised cost without impairment loss beingrecognised. The recoveries of amounts are recognised in profit or loss.
10) Bonds sold under repurchase agreements and bonds purchased under resale agreementsBond transactions under repurchase or resale agreements are stated at the amount of actualpayment or receipt. When transactions of bonds with a condition of resale agreements occur,the actual payment or receipt shall be recognised in ‘bonds purchased under resaleagreements’ under current assets. When transactions of bonds with a condition ofrepurchase agreements occur, the actual payment or receipt shall be recognised in ‘bondssold under repurchase agreements’ under current liabilities. Any difference between theactual payment/receipt and predetermined redemption (repurchase) price is recognised ininterest income or interest expense.
11) Financial assets at cost – non-currentA. Financial assets measured at cost are initially recognised at fair value plus transaction
costs of acquisition. On a regular way purchase or sale basis, financial assets measuredat cost are recognised and derecognised using trade date accounting.
B. If the variability in the range of reasonable fair value estimate vary significantly, and theprobabilities of the various estimates cannot be reasonably measured, the financialassets should be measured at cost.
C. With respect to impairment assessment of the said financial asset, the amount of theimpairment loss is measured as the difference between the asset’s carrying amount andthe present value of estimated future cash flows discounted at current market return rateof similar financial asset, and is recognised in profit or loss. Impairment loss recognisedfor this category shall not be reversed subsequently. Impairment loss is recognised byadjusting the carrying amount of the asset directly.
12) Impairment of financial assetsA. The Group assesses at each balance sheet date whether there is objective evidence that
a financial asset or a group of financial assets is impaired as a result of one or moreevents that occurred after the initial recognition of the asset (a ‘loss event’) and that lossevent (or events) has an impact on the estimated future cash flows of the financial assetor group of financial assets that can be reliably estimated.
B. The criteria that the Group uses to determine whether there is an objective evidence ofan impairment loss is as follows:(A) Significant financial difficulty of the issuer or debtor;(B) A breach of contract, such as a default or delinquency in interest or principal
payments;(C) The Group, for economic or legal reasons relating to the borrower’s financial
difficulty, granted the borrower a concession that a lender would not otherwiseconsider;

~19~
(D) It becomes probable that the borrower will enter bankruptcy or other financialreorganisation;
(E) The disappearance of an active market for that financial asset because of financialdifficulties;
(F) Observable data indicating that there is a measurable decrease in the estimatedfuture cash flows from a group of financial assets since the initial recognition ofthose assets, although the decrease cannot yet be identified with the individualfinancial asset in the group, including adverse changes in the payment status ofborrowers in the group or national or local economic conditions that correlate withdefaults on the assets in the group;
(G) Information about significant changes with an adverse effect that have taken placein the technology, market, economic or legal environment in which the issueroperates, and indicates that the cost of the investment in the equity instrument maynot be recovered; or
(H) A significant or prolonged decline in the fair value of an investment in an equityinstrument below its cost.
C. When the Group assesses that there has been objective evidence of impairment and animpairment loss has occurred, accounting for impairment is made in accordance withaforesaid accounting policies of various financial assets.
13) Derecognition of financial instrumentsA. Derecognition of financial assets
The Group derecognises a financial asset when one of the following conditions is met:(A) The contractual rights to receive cash flows from the financial asset expire.(B) The contractual rights to receive cash flows from the financial asset have been
transferred and the Group has transferred substantially all risks and rewards ofownership of the financial asset.
(C) The contractual rights to receive cash flows of the financial asset have beentransferred; however, the Group has not retained control of the financial asset.
B. Derecognition of financial liabilitiesA financial liability is derecognised when the obligation under the liability specified inthe contract is discharged or cancelled or expires.
14) Offsetting financial instrumentsFinancial assets and liabilities are offset and reported in the net amount in the balance sheetwhen there is a legally enforceable right to offset the recognised amounts and there is anintention to settle on a net basis or realize the asset and settle the liability simultaneously.
15) Investments accounted for under the equity methodA. Associates are all entities over which the Group has significant influence but not control.
In general, it is presumed that the investor has significant influence, if an investor holds,directly or indirectly 20 percent or more of the voting power of the investee. Investmentsin associates are accounted for using the equity method and are initially recognised atcost.
B. The Group’s share of its associates’ post-acquisition profits or losses is recognised inprofit or loss, and its share of post-acquisition movements in other comprehensiveincome is recognised in other comprehensive income. When the Group’s share oflosses in an associate equals or exceeds its interest in the associate, including any otherunsecured receivables, the Group does not recognise further losses, unless it hasincurred statutory/constructive obligations or made payments on behalf of the associate.
~20~
C. When changes in an associate’s equity that are not recognised in profit or loss or othercomprehensive income of the associate and such changes not affecting the Group’sownership percentage of the associate, the Group recognises its share of change inequity of the associate in ‘capital surplus’ in proportion to its ownership.
D. Unrealized gains on transactions between the Group and its associates are eliminated tothe extent of the Group’s interest in the associates. Unrealized losses are also eliminatedunless the transaction provides evidence of an impairment of the asset transferred.Accounting policies of associates have been adjusted where necessary to ensureconsistency with the policies adopted by the Group.
16) Property and equipmentA. Property and equipment are initially recorded at cost. Borrowing costs incurred during
the construction period are capitalized.B. Subsequent costs are included in the asset’s carrying amount or recognised as a separate
asset, as appropriate, only when it is probable that future economic benefits associatedwith the item will flow to the Group and the cost of the item can be measured reliably.The carrying amount of the replaced part is derecognised. All other repairs andmaintenance are charged to profit or loss during the financial period in which they areincurred.
C. Land is not depreciated. Other property and equipment are subsequently measured usingthe cost model and depreciated using the straight-line method to allocate their cost overtheir estimated useful lives.
D. The assets’ residual values, useful lives and depreciation methods are reviewed, andadjusted if appropriate, at each balance sheet date. If expectations for the assets’ residualvalues and useful lives differ from previous estimates or the patterns of consumption ofthe assets’ future economic benefits embodied in the assets have changed significantly,any change is accounted for as a change in estimate under IAS 8, ‘Accounting Policies,Changes in Accounting Estimates and Errors’, from the date of the change. Theestimated useful lives of property and equipment are as follows:
Useful lives
Buildings 5~50 years
Furniture and fixtures 4~10 years
Computer equipment 3~5 years
Electrical equipment 3~10 years
Leasehold improvements 5 years
E. When an asset is sold or retired, the cost and accumulated depreciation are removedfrom the respective accounts and the resulting gain or loss is included in currentoperations.
17) Investment propertyA. Investment property of the Group is the property held either to earn long-term rental
income or for capital appreciation or for both.B. Part of the property may be held by the Group for self-use purpose and the remaining
are used to generate rental income or capital appreciation. If the property held by theGroup can be sold individually, then the accounting treatment should be maderespectively. If each part of the property cannot be sold individually and the self-useproportion is not material, then the property is deemed as investment property in itsentirety.

~21~
C. When the future economic benefit related to the investment property is highly likely toflow into the Group and the costs can be reliably measured, the investment propertyshall be recognised as assets. When the future economic benefit generated fromsubsequent costs is highly likely to flow into the entity and the costs can be reliablymeasured, the subsequent expenses of the assets shall be capitalized. All maintenancecost are recognised in profit or loss as incurred.
D. Investment property is subsequently measured using the cost model. Depreciated cost isused to calculate amortization expense after initial measurement. The depreciationmethod, remaining useful life and residual value should apply the same rules asapplicable for property and equipment.
18) Intangible assetsA. The cost of computer software is amortised using the straight-line method over the
useful lives based on acquisition cost, with an amortization period of 4 years.B. Customer relationships is amortised evenly over its estimated useful life of 3.6 years.C. Membership in a foreign futures exchange is stated at acquisition cost and has an
indefinite useful life as it was assessed to generate continuous net cash inflow in theforeseeable future. It is not amortised, but is tested annually for impairment.
D. In accordance with IFRS 3 ‘Business combinations’as endorsed by FSC, goodwill ariseswhen the acquisition cost exceeds the fair value of identifiable assets and liabilities ofthe consolidated subsidiary on the consolidation date. The goodwill arising from theconsolidated subsidiary is included in the intangible asset. Goodwill is tested annuallyfor impairment and any impairment loss will be recognised when impairment occurs.Impairment losses on goodwill are not reversed.
19) Impairment of non-financial assetsA. The Group assesses at each balance sheet date the recoverable amounts of those assets
where there is an indication that they are impaired. An impairment loss is recognised forthe amount by which the asset’s carrying amount exceeds its recoverable amount. Therecoverable amount is the higher of an asset’s fair value less costs to sell or value in use.Except for goodwill, when the circumstances or reasons for recognizing impairment lossfor an asset in prior years no longer exist or diminish, the impairment loss is reversed.The increased carrying amount due to reversal should not be more than what thedepreciated or amortised historical cost would have been if the impairment had not beenrecognized.
B. The recoverable amounts of goodwill, intangible assets with an indefinite useful life andintangible assets that have not yet been available for use are evaluated periodically. Animpairment loss is recognised for the amount by which the asset’s carrying amountexceeds its recoverable amount. Impairment loss of goodwill previously recognised inprofit or loss shall not be reversed in the following years.
C. For the purpose of impairment testing, goodwill acquired in a business combination isallocated to each of the cash-generating units, or groups of cash-generating units, that isexpected to benefit from the synergies of the business combination. Each unit or groupof units to which the goodwill is allocated represents the lowest level within the entityat which the goodwill is monitored for internal management purposes. Goodwill ismonitored at the operating segment level.
20) Contingent liabilitiesContingent liability is a possible obligation that arises from past event, whose existencewill be confirmed only by the occurrence or non-occurrence of one or more uncertainfuture events not wholly within the control of the Group. Or it could be a present obligation
~22~
as a result of past event but the payment is not probable or the amount cannot be measuredreliably. The Group did not recognise any contingent liabilities but made appropriatedisclosure in compliance with relevant regulations.
21) Employee benefitsA. Short-term employee benefits
Short-term employee benefits are measured at the undiscounted amount of the benefitsexpected to be paid in respect of service rendered by employees in a period and shouldbe recognised as expenses in that period when the employees render service.
B. Termination benefitsTermination benefits are employee benefits provided in exchange for the termination ofemployment as a result from either the Group’s decision to terminate an employee’semployment before the normal retirement date, or an employee’s decision to accept anoffer of redundancy benefits in exchange for the termination of employee. The Grouprecognised expense as it can no longer withdraw an offer of termination benefit or itrecognises relating restructuring costs, whichever is earlier. Benefits that are expected tobe due more than 12 months after balance sheet date shall be discounted to their presentvalue.
C. Pensions(A) Defined contribution plans
Effective July 1, 2005, the Group established the defined contribution plan foremployees of R.O.C. nationality. The employees have the option to participate in theNew Plan. Under the New Plan, the Company contributes monthly an amountequivalent to 6% of employees’ salaries to the employees’ personal pension accountswith the “Bureau of Labor Insurance”. Benefits accrued under the New Plan areportable upon termination of employment. Net defined benefit asset can only berecognised when there is a cash refund or elimination in the future accrued pensionliabilities.
(B) Defined benefit plansa. In a defined benefit plan, the pension paid is determined based on the amount
that an employee shall receive upon retirement, which could vary with age, workseniority and salary compensations. The Group recognises the accrued pensionobligations in the consolidated balance sheet based on the net amount ofactuarial present value of defined benefit obligation less the fair value of fund,which is adjusted with the net of past service cost recognised as liabilities.Defined benefit obligation is assessed annually using projected unit creditmethod by the actuary. The present value of the defined benefit obligation isdetermined using the market yield of government bonds of a currency and termconsistent with the currency and term of the employment benefit obligations.
b. Remeasurement arising on defined benefit plans are recognised in othercomprehensive income in the period in which they arise and are recorded asretained earnings.
c. Pension cost for the interim period is calculated on a year-to-date basis by usingthe pension cost rate derived from the actuarial valuation at the end of the priorfinancial year, adjusted for significant market fluctuations since that time andfor significant curtailments, settlements, or other significant one-off events. And,the related information is disclosed accordingly.

~23~
D. Employees’ remuneration and directors’ remunerationEmployees’ and directors’ remuneration are recognised as expenses and liabilities,provided that such recognition is required under legal or constructive obligation andthose amounts can be reliably estimated. Any difference between the resolved amountsand the subsequently actual distributed amounts is accounted for as changes in estimates.
22) Revenues and expensesThe Group’s revenues and expenses are recognised as incurred, which mainly include:A. Gains (losses) on sale of securities, securities brokerage fees, and commissions on
brokerage and trading are recognised on the transaction date.B. Underwriting fees and related service charges: application fees are recognised upon
collection; underwriting fees and service charges are recognised when the contract iscompleted.
C. Gains (losses) on futures contracts: The margin of futures transaction is recognised ascost. Costs and expenses are recognised as incurred.
D. Operating expenses: operating expenses refer to required expenses invested in theGroup’s operations, which primarily include employee benefit expense, depreciation andamortization, and other business and administrative expenses.
23) Income taxA. Current income tax
Income tax payable (refundable) is calculated on the basis of the tax laws enacted in thecountries where a company operates and generates taxable income. Except for thetransactions or other matters directly recognised in other comprehensive income orequity, in which cases the related income taxes in the period are recognised in othercomprehensive income or directly derecognised from equity, all the others should berecognised as income or expense for the period.
B. Deferred income taxDeferred income tax assets and liabilities are measured based on the tax rate of theanticipated period that the future assets realization or the liabilities settlement requires,which is based on the effective or existing tax rate at the consolidated balance sheet date.The carrying amounts and temporary differences of assets and liabilities included in theconsolidated balance sheet are calculated using the liability method and recognised asdeferred income tax. However, the deferred income tax is not accounted for if it arisesfrom initial recognition of an asset or liability in a transaction other than a businesscombination that at the time of the transaction affects neither accounting nor taxableprofit (loss). Deferred income tax assets are recognised only to the extent that it isprobable that taxable profit will be available against which the deductible temporarydifferences can be utilized. If the future taxable income is probable to provide unusedloss carryforwards or deferred income tax credit which can be realized in the future, theproportion of realization is deemed as deferred income tax asset.
C. The current income tax expense is calculated on the basis of the tax laws enacted orsubstantively enacted at the balance sheet date in the countries where the Group operatesand generates taxable income. Management periodically evaluates positions taken in taxreturns with respect to situations in accordance with applicable tax regulations. Itestablishes provisions for income tax liabilities where appropriate based on the amountsexpected to be paid to the tax authorities. An additional 10% tax is levied on theunappropriated retained earnings and is recorded as income tax expense in the year thestockholders resolve to retain the earnings.
D. Current income tax assets and liabilities are offset and the net amount reported in thebalance sheet when there is a legally enforceable right to offset the recognised amounts
~24~
and there is an intention to settle on a net basis or realize the asset and settle the liabilitysimultaneously. Deferred income tax assets and liabilities are offset on the balance sheetwhen the entity has the legally enforceable right to offset current tax assets againstcurrent tax liabilities and they are levied by the same taxation authority on either thesame entity or different entities that intend to settle on a net basis or realize the asset andsettle the liability simultaneously.
E. The interim period income tax expense is recognised based on the estimated averageannual effective income tax rate expected for the full financial year applied to the pretaxincome of the interim period, and the related information is disclosed accordingly.
24) Share capitalA. Incremental costs directly attributable to the issuance of new shares are shown as a
deduction, net of tax, from equity. Dividends from common stocks are recognised asequity in the financial period in which they are approved by the Company’s shareholders.If the date of dividends declared is later than the consolidated balance sheet date,common stocks are disclosed in the subsequent events.
B. Where the Company repurchases the Company’s equity share capital that has beenissued, the consideration paid, including any directly attributable incremental costs (netof income taxes) is deducted from equity attributable to the Company’s equity holders.Where such shares are subsequently reissued, the difference between their book valueand any consideration received, net of any directly attributable incremental transactioncosts and the related income tax effects, is included in equity attributable to theCompany’s equity holders.
25) Earnings per shareA. Earnings per share is calculated by dividing net income by the weighted average number
of shares outstanding during the year after taking into consideration the retroactiveeffect of stock dividends and capital reserve capitalized.
B. When the Group calculates earnings per share, basic earnings per share and dilutedearnings per share for all potential ordinary shares shall all be disclosed in accordancewith IAS 33 “Earnings per share”.
26) Operating segmentsThe Group’s operating segments are reported in a manner consistent with the internal reportsprovided to the chief operating decision-maker. The chief operating decision-maker isresponsible for allocating resources and assessing performance of the operating segments.

~25~
5. CRITICAL ACCOUNTING JUDGEMENTS, ESTIMATES AND KEY SOURCES OFASSUMPTION UNCERTAINTY
1) As the consolidated financial statements of the Group may be affected by the adoptionof accounting policy, accounting estimate and assumption, the Group’s management shallproperly exercise its professional judgement, estimates, and assumptions on theinformation of the key risks that is obtained from other resources and could affect thecarrying amounts of financial assets and liabilities in the next fiscal year while adoptingcritical accounting policies as stated in Note 4. Estimates and assumptions of the Groupare the best estimates made in compliance with IFRSs as endorsed by the FSC. Estimatesand assumptions are made based on past experience and other factors deemed relevant;however, the actual results may differ from the estimates. The Group evaluates theestimates and assumptions on an ongoing basis and recognises the adjustment of theestimates only in the period which is affected by the adjustment. If the adjustmentsimultaneously affects both the current and future periods, it should be recognised in bothperiods.
2) Relevant information on key assumptions to be made in the future, key sources ofassumption uncertainty made at balance sheet date, and assumptions and estimates thatmay cause key risks that could affect the carrying amounts of financial assets andliabilities are as follows:A. Fair value of financial instruments
Financial instruments with no active market or quoted price use valuation techniqueto determine the fair value. Under such condition, fair value is assessed through theobservable information or models of similar financial instruments. If there is noobservable input available in a market, the fair value of financial instrument is assessedthrough appropriate assumptions. When valuation models are adopted to determinethe fair value, all the models should be calibrated to ensure that the output can actuallyreflect actual information and market price. Models should try to take only observableinformation as much as possible.
B. Calculation of net defined benefit liabilitiesWhen calculating the present value of defined pension obligations, the Group mustapply judgements and estimates to determine the actuarial assumptions on balancesheet date, including discount rates and expected rate of return on plan assets. Anychanges in these assumptions could significantly impact the carrying amount ofdefined pension obligations.
C. Impairment assessment of goodwillThe impairment assessment of goodwill relies on the Group’s subjective judgement,including identifying cash-generating units, allocating assets and liabilities as well asgoodwill to related cash-generating units, and determining the recoverable amounts ofrelated cash-generating units.
~26~
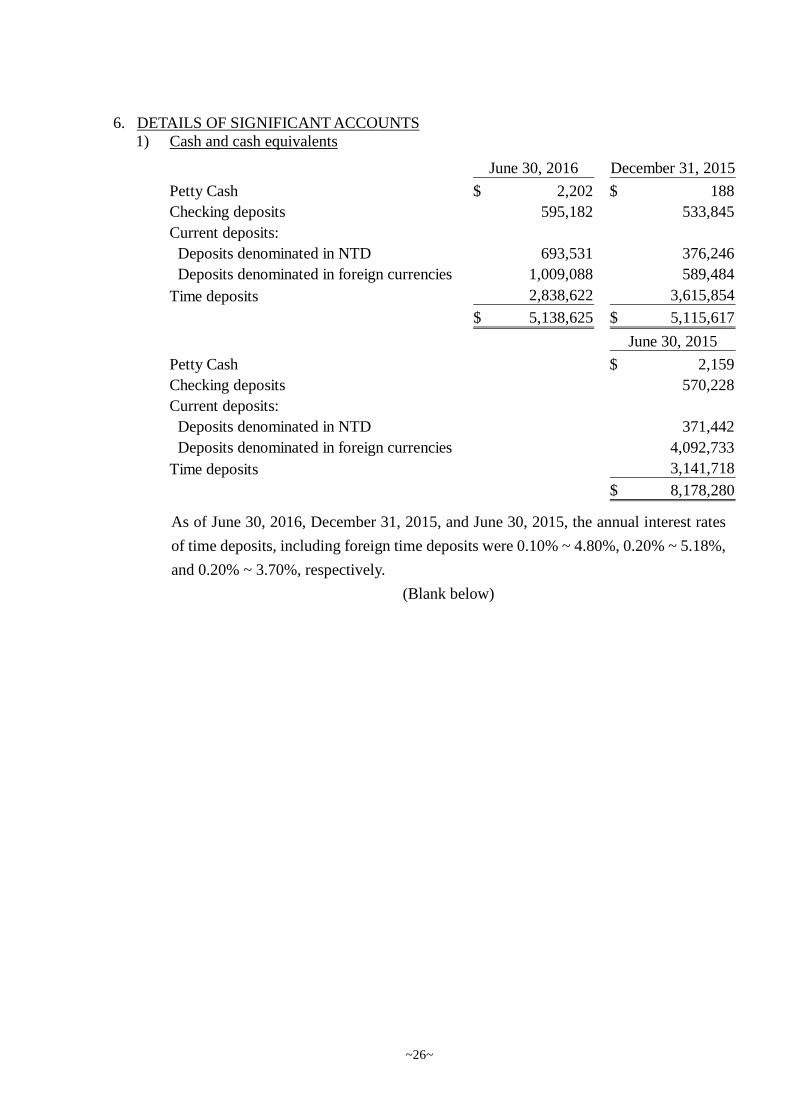
6. DETAILS OF SIGNIFICANT ACCOUNTS1) Cash and cash equivalents
As of June 30, 2016, December 31, 2015, and June 30, 2015, the annual interest rates
of time deposits, including foreign time deposits were 0.10% ~ 4.80%, 0.20% ~ 5.18%,
and 0.20% ~ 3.70%, respectively.
(Blank below)
June 30, 2016 December 31, 2015
Petty Cash 2,202$ 188$
Checking deposits 595,182 533,845
Current deposits:
Deposits denominated in NTD 693,531 376,246
Deposits denominated in foreign currencies 1,009,088 589,484
Time deposits 2,838,622 3,615,854
5,138,625$ 5,115,617$
June 30, 2015
Petty Cash 2,159$
Checking deposits 570,228
Current deposits:
Deposits denominated in NTD 371,442
Deposits denominated in foreign currencies 4,092,733
Time deposits 3,141,718
8,178,280$
~27~
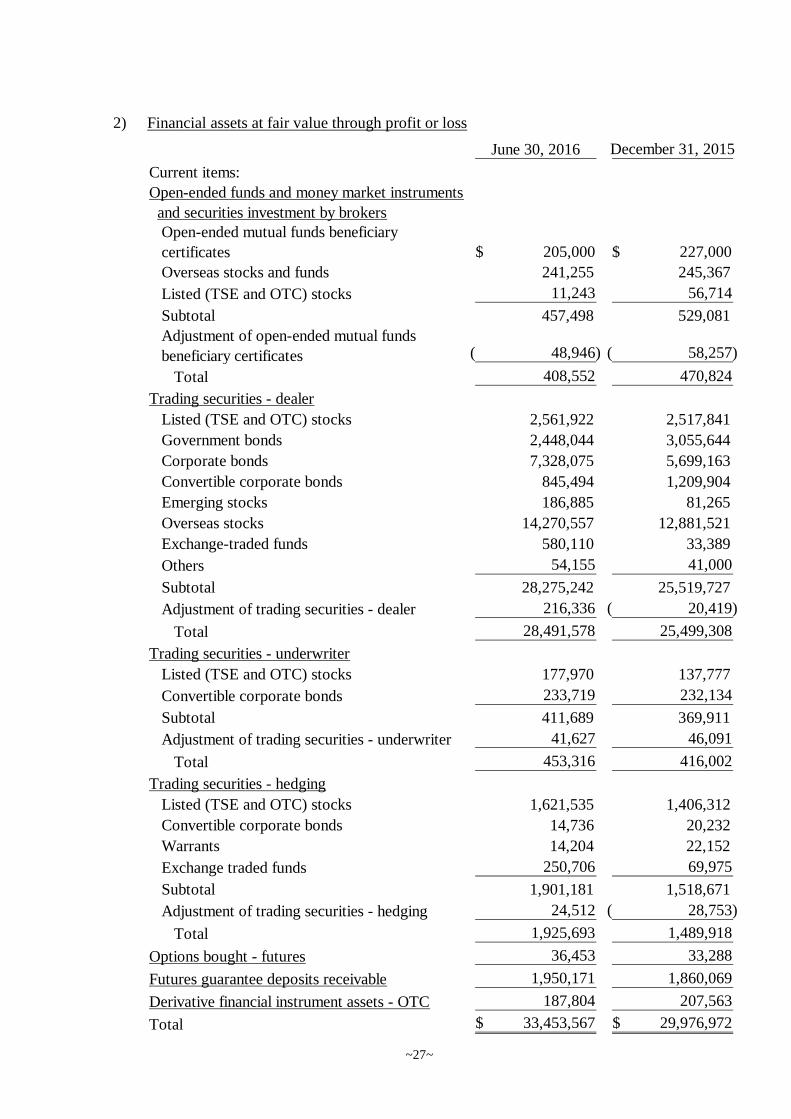
2) Financial assets at fair value through profit or loss
June 30, 2016 December 31, 2015
Current items:
Open-ended funds and money market instruments
and securities investment by brokersOpen-ended mutual funds beneficiary
certificates 205,000$ 227,000$
Overseas stocks and funds 241,255 245,367
Listed (TSE and OTC) stocks 11,243 56,714
Subtotal 457,498 529,081
Adjustment of open-ended mutual funds
beneficiary certificates 48,946)( 58,257)(
Total 408,552 470,824
Trading securities - dealer
Listed (TSE and OTC) stocks 2,561,922 2,517,841
Government bonds 2,448,044 3,055,644
Corporate bonds 7,328,075 5,699,163
Convertible corporate bonds 845,494 1,209,904
Emerging stocks 186,885 81,265
Overseas stocks 14,270,557 12,881,521
Exchange-traded funds 580,110 33,389
Others 54,155 41,000
Subtotal 28,275,242 25,519,727
Adjustment of trading securities - dealer 216,336 20,419)(
Total 28,491,578 25,499,308
Trading securities - underwriter
Listed (TSE and OTC) stocks 177,970 137,777
Convertible corporate bonds 233,719 232,134
Subtotal 411,689 369,911
Adjustment of trading securities - underwriter 41,627 46,091
Total 453,316 416,002
Trading securities - hedging
Listed (TSE and OTC) stocks 1,621,535 1,406,312
Convertible corporate bonds 14,736 20,232
Warrants 14,204 22,152
Exchange traded funds 250,706 69,975
Subtotal 1,901,181 1,518,671
Adjustment of trading securities - hedging 24,512 28,753)(
Total 1,925,693 1,489,918
Options bought - futures 36,453 33,288
Futures guarantee deposits receivable 1,950,171 1,860,069
Derivative financial instrument assets - OTC 187,804 207,563
Total 33,453,567$ 29,976,972$
~28~
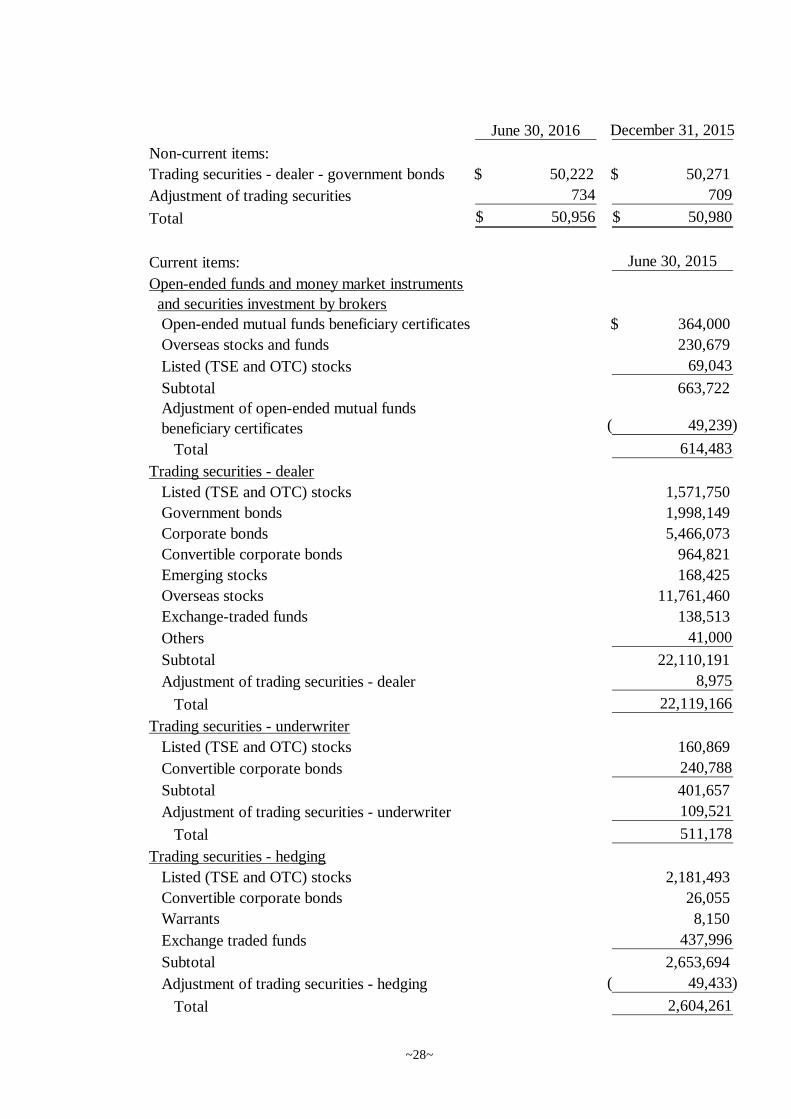
June 30, 2016 December 31, 2015
Non-current items:
Trading securities - dealer - government bonds 50,222$ 50,271$
Adjustment of trading securities 734 709
Total 50,956$ 50,980$
Current items: June 30, 2015
Open-ended funds and money market instruments
and securities investment by brokers
Open-ended mutual funds beneficiary certificates 364,000$
Overseas stocks and funds 230,679
Listed (TSE and OTC) stocks 69,043
Subtotal 663,722
Adjustment of open-ended mutual funds
beneficiary certificates 49,239)(
Total 614,483
Trading securities - dealer
Listed (TSE and OTC) stocks 1,571,750
Government bonds 1,998,149
Corporate bonds 5,466,073
Convertible corporate bonds 964,821
Emerging stocks 168,425
Overseas stocks 11,761,460
Exchange-traded funds 138,513
Others 41,000
Subtotal 22,110,191
Adjustment of trading securities - dealer 8,975
Total 22,119,166
Trading securities - underwriter
Listed (TSE and OTC) stocks 160,869
Convertible corporate bonds 240,788
Subtotal 401,657
Adjustment of trading securities - underwriter 109,521
Total 511,178
Trading securities - hedging
Listed (TSE and OTC) stocks 2,181,493
Convertible corporate bonds 26,055
Warrants 8,150
Exchange traded funds 437,996
Subtotal 2,653,694
Adjustment of trading securities - hedging 49,433)(
Total 2,604,261

~29~
3) Available-for-sale financial assets
4) Bonds purchased under resale agreements
The above bonds purchased under resale agreements as of June 30, 2016, December 31,2015, and June 30, 2015 were due within one year and were contracted to be resold at theagreed-upon price plus interest charge on the specific date after transaction. The total resaleamounts were $736,447, $771,380 and $2,873,309, respectively. The annual interest ratesof every currency were as follows:
June 30, 2015
Options bought - futures 7,628$
Futures guarantee deposits receivable 2,009,632
Derivative financial instrument assets - OTC 28,120
Total 27,894,468$
Non-current items:
Trading securities - dealer - government bonds 50,320$
Adjustment of trading securities 325
Total 50,645$
June 30, 2016 December 31, 2015
Current items:
Trading securities - dealer
Listed (TSE and OTC) stocks 801,217$ 306,677$
Overseas bonds 100,526 102,654
Exchange-traded funds 11,930 -
Adjustment of trading securities - dealer 1,764 6,370)(
Total 915,437$ 402,961$
Non-current items:
Listed (TSE and OTC) stocks 45,416$ 45,416$
Adjustment of trading securities 17,455 14,063
Total 62,871$ 59,479$
June 30, 2015
Non-current items:
Listed (TSE and OTC) stocks 45,416$
Adjustment of trading securities 12,020
Total 57,436$
June 30, 2016 December 31, 2015
Overseas bonds 735,986$ 770,353$
June 30, 2015
Overseas bonds 2,852,130$

~30~
(Note):Foreign currencies include USD, AUD, and EUR.
5) Margin loans receivableMargin loans receivable were secured by the securities purchased by customers undermargin loans. The annual interest rate was 6.4%.
6) Customer margin account
The difference between the customer margin deposits accounts and futures traders’ equity
as of June 30, 2016, December 31, 2015, and June 30, 2015 were outlined below:
June 30, 2016 December 31, 2015 June 30, 2015
Foreign currencies (Note) 0.25% -0.3125%~2.14% -0.9375%~2.14%
June 30, 2016 December 31, 2015
Bank deposit 7,969,938$ 5,412,834$
Futures clearing house 1,300,298 902,890
Other futures commission merchant 2,182,969 1,366,153
Securities 4,408 4,677
Total 11,457,613$ 7,686,554$
June 30, 2015
Bank deposit 4,855,465$
Futures clearing house 980,831
Other futures commission merchant 451,617Securities 19,639
Total 6,307,552$
June 30, 2016 December 31, 2015
Customer margin deposits accounts 11,457,613$ 7,686,554$
Add: Early customer margin deposits 4,856 645
Less: Service fee income pending for transfer 24,587)( 6,681)(
Futures exchange tax pending for transfer 485)( 438)(
Net interest income pending for transfer 1,085)( 505)(
Temporary receipts 4,570)( 1,418)(
Futures traders' equity 11,431,742$ 7,678,157$
June 30, 2015
Customer margin deposits accounts 6,307,552$
Add: Early customer margin deposits 8,364
Less: Service fee income pending for transfer 6,025)(
Futures exchange tax pending for transfer 334)(
Net interest income pending for transfer 886)(
Temporary receipts 27,881)(
Futures traders' equity 6,280,790$

~31~
7) Accounts receivable
8) Other receivables
June 30, 2016 December 31, 2015
Accounts receivable - non related parties
Settlement price receivable-brokers 5,016,189$ 4,128,216$
Settlement price receivable-dealer 242,332 37,181
Accounts receivable-international bonds 471,480 -
Accounts receivable-foreign bonds 5,516,877 -
Spot exchange receivable, foreign currencies 995,229 -
Interest receivable 365,391 414,394
Settlement price 624,085 893,860
Others 113,774 43,845
13,345,357$ 5,517,496$
June 30, 2015
Accounts receivable - non related parties
Settlement price receivable-brokers 7,107,709$
Settlement price receivable-dealer 723,499
Accounts receivable-foreign bonds 4,652,084
Interest receivable 374,037
Settlement price 361,763
Others 80,950
13,300,042
Less: Allowance for uncollectible accounts 3,082)(
13,296,960$
June 30, 2016 December 31, 2015
Other receivables-FX Swap -$ 1,475,078$
Dividends receivable 3,944 1,562
Interest receivable 21,793 21,205
Others 20,488 32,988
46,225$ 1,530,833$
June 30, 2015
Other receivables-FX Swap 855,922$
Dividends receivable 12,995
Interest receivable 21,223
Others 45,556
935,696$
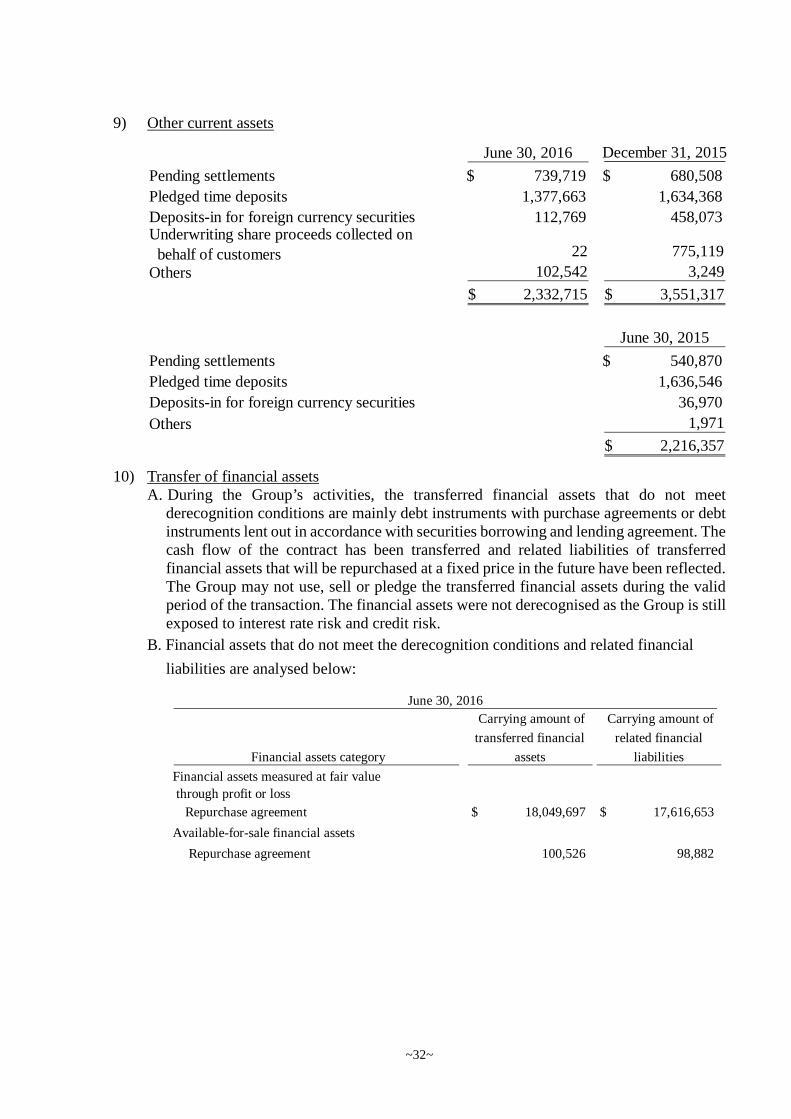
~32~
9) Other current assets
10) Transfer of financial assetsA. During the Group’s activities, the transferred financial assets that do not meet
derecognition conditions are mainly debt instruments with purchase agreements or debtinstruments lent out in accordance with securities borrowing and lending agreement. Thecash flow of the contract has been transferred and related liabilities of transferredfinancial assets that will be repurchased at a fixed price in the future have been reflected.The Group may not use, sell or pledge the transferred financial assets during the validperiod of the transaction. The financial assets were not derecognised as the Group is stillexposed to interest rate risk and credit risk.
B. Financial assets that do not meet the derecognition conditions and related financial
liabilities are analysed below:
June 30, 2016 December 31, 2015
Pending settlements 739,719$ 680,508$
Pledged time deposits 1,377,663 1,634,368
Deposits-in for foreign currency securities 112,769 458,073Underwriting share proceeds collected on
behalf of customers 22 775,119
Others 102,542 3,249
2,332,715$ 3,551,317$
June 30, 2015
Pending settlements 540,870$
Pledged time deposits 1,636,546
Deposits-in for foreign currency securities 36,970
Others 1,971
2,216,357$
Financial assets category
Carrying amount of
transferred financial
assets
Carrying amount of
related financial
liabilities
Financial assets measured at fair value
through profit or loss
Repurchase agreement 18,049,697$ 17,616,653$
Available-for-sale financial assets
Repurchase agreement 100,526 98,882
June 30, 2016

~33~
11) Offsetting financial assets and financial liabilitiesA.The Group has transactions that are or are similar to net settled master netting
arrangements but do not meet the offsetting criteria, i.e. derivative financial instruments,resale and repurchase agreements. If one party breaches the contract, the counterpartycan choose to use net settlement for the above transactions.
B.The offsetting of financial assets and financial liabilities are set as follows:
(Blank below)
Financial assets category
Carrying amount of
transferred financial
assets
Carrying amount of
related financial
liabilities
Financial assets measured at fair value
through profit or loss
Repurchase agreement 16,361,768$ 15,501,953$
Available-for-sale financial assets
Repurchase agreement 102,654 100,607
Financial assets category
Carrying amount of
transferred financial
assets
Carrying amount of
related financial
liabilities
Financial assets measured at fair value
through profit or loss
Repurchase agreement 16,713,860$ 16,211,889$
December 31, 2015
June 30, 2015

~34~
1. The offsetting of financial assets and financial liabilities are set as follows:
(1) Financial assets
Financial
instruments
Cash collateral
received
Derivative financial instruments 187,781$ -$ 187,781$ 50,693$ -$ 137,088$
Bonds purchased under resale
agreements 735,986 - 735,986 709,849 - 26,137
Total 923,767$ -$ 923,767$ 760,542$ -$ 163,225$
Financial
instruments
Cash collateral
received
Derivative financial instruments 207,544$ -$ 207,544$ 51,566$ -$ 155,978$
Bonds purchased under resale
agreements 770,353 - 770,353 734,662 - 35,691
Total 977,897$ -$ 977,897$ 786,228$ -$ 191,669$
Financial
instruments
Cash collateral
received
Derivative financial instruments 27,786$ -$ 27,786$ 22,418$ -$ 5,368$Bonds purchased under resale
agreements 2,852,130 - 2,852,130 2,742,875 - 109,255
Total 2,879,916$ -$ 2,879,916$ 2,765,293$ -$ 114,623$
June 30, 2015
Financial assets that are offset, or can be settled under agreements of net settled master netting arrangements or similar arrangements
Description
Gross amounts of
recognised financial
assets
Gross amounts of recognised
financial liabilities set off in
the balance sheet
Net amounts of financial
assets presented in the
balance sheet
Not set off in the balance sheet
Net amount
December 31, 2015
Financial assets that are offset, or can be settled under agreements of net settled master netting arrangements or similar arrangements
Description
Gross amounts
of recognised
financial assets
Gross amounts of recognised
financial liabilities set off in
the balance sheet
Net amounts of financial
assets presented in the
balance sheet
Not set off in the balance sheet
Net amount
June 30, 2016
Financial assets that are offset, or can be settled under agreements of net settled master netting arrangements or similar arrangements
Description
Gross amounts
of recognised
financial assets
Gross amounts of recognised
financial liabilities set off in
the balance sheet
Net amounts of financial
assets presented in the
balance sheet
Not set off in the balance sheet
Net amount

~35~
(2) Financial liabilities
Financial
instruments
Cash collateral
received
Derivative financial instruments 55,713$ -$ 55,713$ 50,693$ -$ 5,020$Bonds purchased under resale
agreements11,666,809 - 11,666,809 11,666,809 - -
Total 11,722,522$ -$ 11,722,522$ 11,717,502$ -$ 5,020$
Financial
instruments
Cash collateral
received
Derivative financial instruments 66,221$ -$ 66,221$ 51,566$ -$ 14,655$Bonds purchased under resale
agreements10,014,973 - 10,014,973 10,014,973 - -
Total 10,081,194$ -$ 10,081,194$ 10,066,539$ -$ 14,655$
Financial
instruments
Cash collateral
received
Derivative financial instruments 70,430$ -$ 70,430$ 22,418$ -$ 48,012$Bonds purchased under resale
agreements9,516,114 - 9,516,114 9,516,114 - -
Total 9,586,544$ -$ 9,586,544$ 9,538,532$ -$ 48,012$
June 30, 2015
Financial liabilities that are offset, or can be settled under agreements of net settled master netting arrangements or similar arrangements
Description
Gross amounts of
recognised financial
liabilities
Gross amounts of recognised
financial assets set off in the
balance sheet
Net amounts of financial
liabilities presented in the
balance sheet
Not set off in the balance sheet
Net amount
December 31, 2015
Financial liabilities that are offset, or can be settled under agreements of net settled master netting arrangements or similar arrangements
Description
Gross amounts of
recognised financial
liabilities
Gross amounts of recognised
financial assets set off in the
balance sheet
Net amounts of financial
liabilities presented in the
balance sheet
Not set off in the balance sheet
Net amount
June 30, 2016
Financial liabilities that are offset, or can be settled under agreements of net settled master netting arrangements or similar arrangements
Description
Gross amounts of
recognised financial
liabilities
Gross amounts of recognised
financial assets set off in the
balance sheet
Net amounts of financial
liabilities presented in the
balance sheet
Not set off in the balance sheet
Net amount

~36~
12) Financial assets at cost – non-current
A. Assets above are measured at cost as the variability in the range of reasonable fairvalue estimate could vary significantly and the probabilities of the various estimatescannot be reasonably measured.
B. In June, 2015, Hua Liu Venture Capital Corporation resolved for a capital reductionof $90,000 through its Board of Directors, cancelling 9,000 thousand shares. TheCompany received a refund of $7,827 in accordance with its held share percentageand reduced the carrying amount by $7,827.
13) Investments accounted for under the equity method
A. The Group’s share of its associates’ profits or losses recognised in long-term equityinvestment accounted for under the equity method for the three months and six monthsended June 30, 2016 and 2015 were $14,858, $22,345, $29,744 and $50,465,respectively.
B. The financial information of the Group’s principal associates is summarized as follows:(a)The basic information of the joint ventures that are material to the Group is as follows:
June 30, 2016 December 31, 2015
Taiwan Depository & Clearing Corp. 2,450$ 2,450$
Taiwan Futures Exchange 35,115 35,115
Hua Liu Venture Capital Corporation 2,608 2,608
Cathay Venture Capital I 1,408 1,408
Total 41,581$ 41,581$
June 30, 2015
Taiwan Depository & Clearing Corp. 2,450$
Taiwan Futures Exchange 35,115
Hua Liu Venture Capital Corporation 2,608
Cathay Venture Capital I 1,408
Total 41,581$
June 30, 2016 December 31, 2015
Uni-President Asset Management Corp. 402,840$ 444,541$
June 30, 2015
Uni-President Asset Management Corp. 415,092$

~37~
(b) The summarized financial information of the joint ventures that are material to the Groupis as follows:
Princial place Nature of Methods of
Company name of businesss relationship measurement
June 30, 2016 December 31, 2015
Uni-President Asset
Management Corp.Taipei city 38.69% 38.69% Associate Equity method
June 30, 2015
Uni-President Asset
Management Corp.Taipei city 38.69% Associate Equity method
Shareholding ratio
Balance sheet
June 30, 2016 December 31, 2015 June 30, 2015
Current assets 269,131$ 376,603$ 262,856$
Non-current assets 491,003 525,013 535,734
Current liabilities 102,538)( 135,692)( 116,198)(
Non-current liabilities 43,803)( 43,840)( 36,938)(
Total net assets 613,793$ 722,084$ 645,454$
Share in joint venture's
net assets 237,523$ 279,429$ 249,775$
Goodwill and others 165,317 165,112 165,317
Carrying amount of the
joint venture 402,840$ 444,541$ 415,092$
Uni-President Asset Management Corp.
Statement of comprehensive income
Six months ended June 30,
2016
Six months ended June 30,
2015
Revenue 325,579$ 380,093$
Profit for the period from
continuing operations 76,334$ 128,615$Other comprehensive loss- net
of tax - -
Total comprehensive income 76,334$ 128,615$
Uni-President Asset Management Corp.

~38~
14) Property and equipment
A. No interest was capitalized for property and equipment for the six months ended June30, 2016 and 2015.
B. The information on property and equipment pledged or restricted as of June 30, 2016,
December 31, 2015 and June 30, 2015 is described in Note 8.
January 1, 2016 Land Buildings Equipment
Leasehold
improvements Total
Cost 1,680,129$ 1,081,785$ 249,195$ 118,360$ 3,129,469$
Accumulated
depreciation and
impairment - 374,370)( 158,861)( 75,642)( 608,873)(
Total 1,680,129$ 707,415$ 90,334$ 42,718$ 2,520,596$
For the six months
ended June 30, 2016
January 1, 2016 1,680,129$ 707,415$ 90,334$ 42,718$ 2,520,596$
Additions - 210 6,392 1,191 7,793
Disposal - - 9)( - 9)(
Reclassifications - 1,420 4,705 2,890 9,015
Depreciation - 14,684)( 20,921)( 10,201)( 45,806)(
June 30, 2016 1,680,129$ 694,361$ 80,501$ 36,598$ 2,491,589$
June 30, 2016 Land Buildings Equipment
Leasehold
improvements Total
Cost 1,680,129$ 1,082,789$ 245,468$ 113,295$ 3,121,681$
Accumulated
depreciation and
impairment - 388,428)( 164,967)( 76,697)( 630,092)(
Total 1,680,129$ 694,361$ 80,501$ 36,598$ 2,491,589$
January 1, 2015 Land Buildings Equipment
Leasehold
improvements Total
Cost 1,680,129$ 1,093,542$ 248,456$ 108,684$ 3,130,811$
Accumulated
depreciation and
impairment - 358,220)( 146,134)( 63,752)( 568,106)(
Total 1,680,129$ 735,322$ 102,322$ 44,932$ 2,562,705$
For the six months
ended June 30, 2015
January 1, 2015 1,680,129$ 735,322$ 102,322$ 44,932$ 2,562,705$
Additions - 2,245 7,533 685 10,463
Disposal - - 1,395)( - 1,395)(
Reclassifications - - 1,966 9,380 11,346
Depreciation - 15,615)( 21,296)( 9,094)( 46,005)(
June 30, 2015 1,680,129$ 721,952$ 89,130$ 45,903$ 2,537,114$
June 30, 2015 Land Buildings Equipment
Leasehold
improvements Total
Cost 1,680,129$ 1,095,787$ 245,539$ 111,918$ 3,133,373$
Accumulated
depreciation and
impairment - 373,835)( 156,409)( 66,015)( 596,259)(
Total 1,680,129$ 721,952$ 89,130$ 45,903$ 2,537,114$
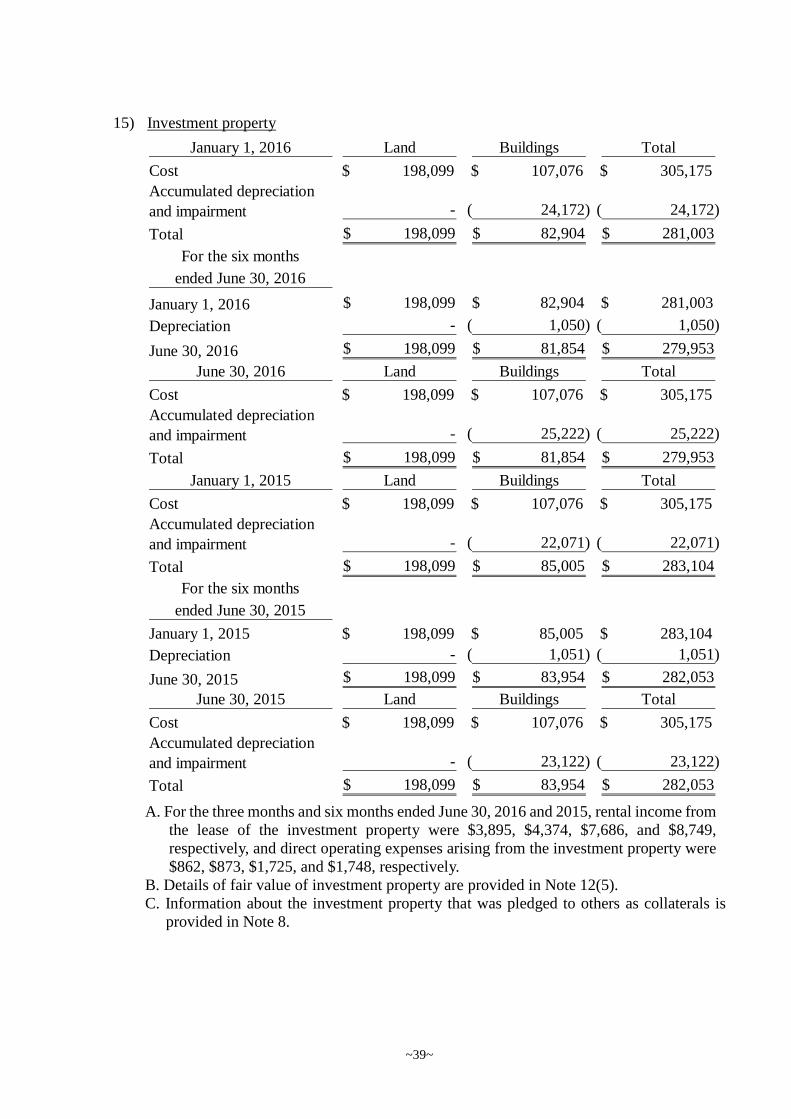
~39~
15) Investment property
A. For the three months and six months ended June 30, 2016 and 2015, rental income fromthe lease of the investment property were $3,895, $4,374, $7,686, and $8,749,respectively, and direct operating expenses arising from the investment property were$862, $873, $1,725, and $1,748, respectively.
B. Details of fair value of investment property are provided in Note 12(5).C. Information about the investment property that was pledged to others as collaterals is
provided in Note 8.
January 1, 2016 Land Buildings Total
Cost 198,099$ 107,076$ 305,175$
Accumulated depreciation
and impairment - 24,172)( 24,172)(
Total 198,099$ 82,904$ 281,003$
For the six months
ended June 30, 2016
January 1, 2016 198,099$ 82,904$ 281,003$
Depreciation - 1,050)( 1,050)(
June 30, 2016 198,099$ 81,854$ 279,953$
June 30, 2016 Land Buildings Total
Cost 198,099$ 107,076$ 305,175$
Accumulated depreciation
and impairment - 25,222)( 25,222)(
Total 198,099$ 81,854$ 279,953$
January 1, 2015 Land Buildings Total
Cost 198,099$ 107,076$ 305,175$
Accumulated depreciation
and impairment - 22,071)( 22,071)(
Total 198,099$ 85,005$ 283,104$
For the six months
ended June 30, 2015
January 1, 2015 198,099$ 85,005$ 283,104$
Depreciation - 1,051)( 1,051)(
June 30, 2015 198,099$ 83,954$ 282,053$
June 30, 2015 Land Buildings Total
Cost 198,099$ 107,076$ 305,175$
Accumulated depreciation
and impairment - 23,122)( 23,122)(
Total 198,099$ 83,954$ 282,053$

~40~
16) Intangible assets
No interest was capitalized for intangible assets for the six months ended June 30, 2016
and 2015.
January 1, 2016 Computer sofware
Goodwill and
customer relationships Others Total
Cost 105,707$ 96,164$ 35,669$ 237,540$
Accumulated depreciation
and impairment 73,988)( 18,893)( - 92,881)(
Total 31,719$ 77,271$ 35,669$ 144,659$
For the six months
ended June 30, 2016
January 1, 2016 31,719$ 77,271$ 35,669$ 144,659$
Additions 2,896 - - 2,896
Reclassifications 2,470 - - 2,470
Depreciation 7,989)( 7,557)( - 15,546)(
June 30, 2016 29,096$ 69,714$ 35,669$ 134,479$
June 30, 2016 Computer sofware
Goodwill and
customer relationships Others Total
Cost 111,073$ 96,164$ 35,669$ 242,906$
Accumulated depreciation
and impairment 81,977)( 26,450)( - 108,427)(
Total 29,096$ 69,714$ 35,669$ 134,479$
January 1, 2015 Computer sofware
Goodwill and
customer relationships Others Total
Cost 92,338$ 96,164$ 35,669$ 224,171$
Accumulated depreciation
and impairment 59,906)( 3,989)( - 63,895)(
Total 32,432$ 92,175$ 35,669$ 160,276$
For the six months
ended June 30, 2015
January 1, 2015 32,432$ 92,175$ 35,669$ 160,276$
Additions 625 - - 625
Reclassifications 1,964 - - 1,964
Depreciation 6,669)( 7,347)( - 14,016)(
June 30, 2015 28,352$ 84,828$ 35,669$ 148,849$
June 30, 2015 Computer sofware
Goodwill and
customer relationships Others Total
Cost 94,927$ 96,164$ 35,669$ 226,760$
Accumulated depreciation
and impairment 66,575)( 11,336)( - 77,911)(
Total 28,352$ 84,828$ 35,669$ 148,849$

~41~
17) Other noncurrent assets
18) Short-term loans
June 30, 2016 December 31, 2015
Operation guaranteed deposits 722,000$ 722,000$
Clearing and settlement fund 311,974 325,827
Refundable deposits 112,413 173,948
Deferred expenses 16,964 17,385
Prepaid pension expenses 75,080 58,239
Prepayment for equipment 9,173 7,313
Delinquent accounts 160,857 166,572
Others 180 180
1,408,641 1,471,464
Less: Allowance for uncollectible
accounts-overdue receivables 160,857)( 166,572)(
1,247,784$ 1,304,892$
June 30, 2015
Operation guaranteed deposits 722,000$
Clearing and settlement fund 320,411
Refundable deposits 91,710
Deferred expenses 16,464
Prepaid pension expenses 48,763
Prepayment for equipment 7,786
Others 16,863
1,223,997
Less: Allowance for uncollectible
accounts-overdue receivables 16,683)(
1,207,314$
June 30, 2016 December 31, 2015
Secured loans 1,606,293$ 2,551,248$
Unsecured loans 2,322,468 1,185,191
Total 3,928,761$ 3,736,439$
Interest rates 0.720%~1.681% 0.850%~5.000%
June 30, 2015
Secured loans 5,419,572$
Unsecured loans 4,674,878
Total 10,094,450$
Interest rates 0.846%~4.280%
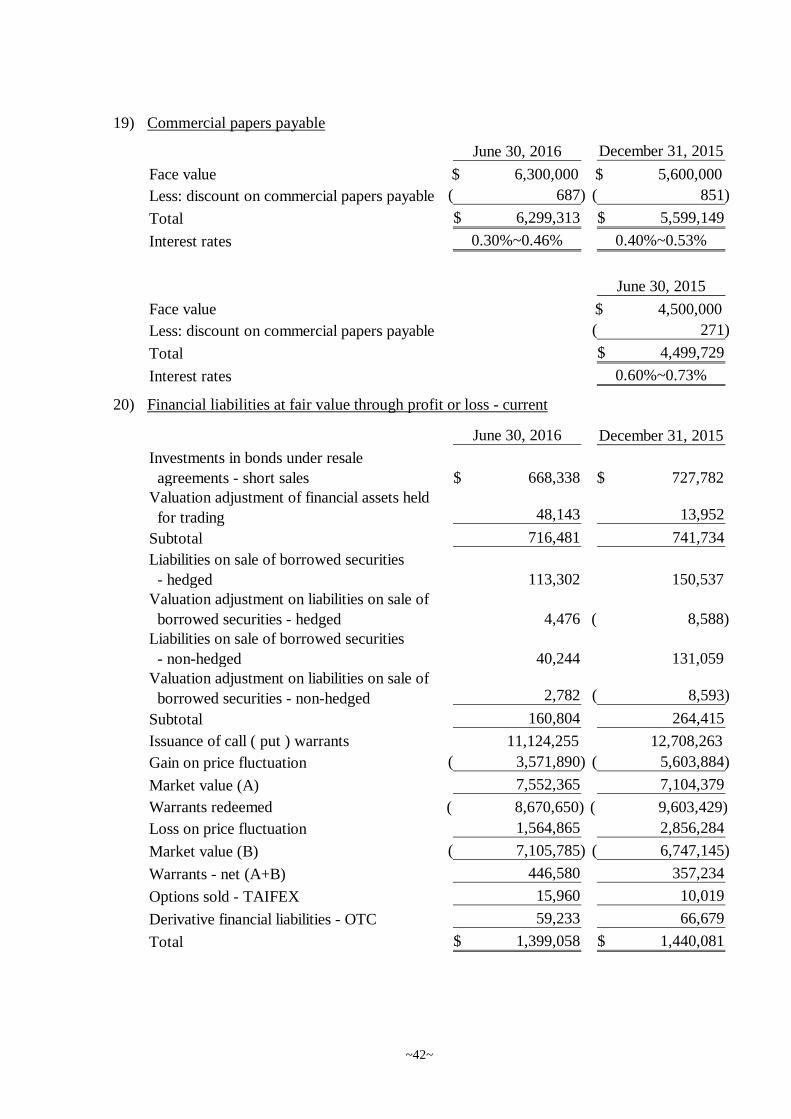
~42~
19) Commercial papers payable
20) Financial liabilities at fair value through profit or loss - current
June 30, 2016 December 31, 2015
Face value 6,300,000$ 5,600,000$
Less: discount on commercial papers payable 687)( 851)(
Total 6,299,313$ 5,599,149$
Interest rates 0.30%~0.46% 0.40%~0.53%
June 30, 2015
Face value 4,500,000$
Less: discount on commercial papers payable 271)(
Total 4,499,729$
Interest rates 0.60%~0.73%
June 30, 2016 December 31, 2015
Investments in bonds under resale
agreements - short sales 668,338$ 727,782$Valuation adjustment of financial assets held
for trading 48,143 13,952
Subtotal 716,481 741,734
Liabilities on sale of borrowed securities
- hedged 113,302 150,537Valuation adjustment on liabilities on sale of
borrowed securities - hedged 4,476 8,588)(Liabilities on sale of borrowed securities
- non-hedged 40,244 131,059Valuation adjustment on liabilities on sale of
borrowed securities - non-hedged 2,782 8,593)(
Subtotal 160,804 264,415
Issuance of call ( put ) warrants 11,124,255 12,708,263
Gain on price fluctuation 3,571,890)( 5,603,884)(
Market value (A) 7,552,365 7,104,379
Warrants redeemed 8,670,650)( 9,603,429)(
Loss on price fluctuation 1,564,865 2,856,284
Market value (B) 7,105,785)( 6,747,145)(
Warrants - net (A+B) 446,580 357,234
Options sold - TAIFEX 15,960 10,019
Derivative financial liabilities - OTC 59,233 66,679
Total 1,399,058$ 1,440,081$

~43~
Among the warrants issued by the Group, except for contract-based warrants which are
European-style warrants, all other warrants are American-style warrants. Warrants are
stated as liabilities for issuance of warrants at issuance price prior to expiration. Upon
repurchase of warrants after issuance, the repurchased amounts are recognised as warrants
repurchase and charged as a deduction to liabilities for issuance of warrants. The warrants
have six to twelve months exercise period from the date of issuance. The issuer has the
option to settle either by cash or stock delivery.
June 30, 2015
Investments in bonds under resale
agreements - short sales 3,024,363$Valuation adjustment of financial assets held
for trading 32,763
Subtotal 3,057,126
Liabilities on sale of borrowed securities
- hedged 50,370Valuation adjustment on liabilities on sale of
borrowed securities - hedged 519)(Liabilities on sale of borrowed securities
- non-hedged 74,238Valuation adjustment on liabilities on sale of
borrowed securities - non-hedged 1,440)(
Subtotal 122,649
Issuance of call ( put ) warrants 8,802,827
Gain on price fluctuation 2,566,749)(
Market value (A) 6,236,078
Warrants redeemed 6,861,994)(
Loss on price fluctuation 1,351,947
Market value (B) 5,510,047)(
Warrants - net (A+B) 726,031
Options sold - TAIFEX 8,562
Derivative financial liabilities - OTC 70,521
Total 3,984,889$

~44~
21) Bonds sold under repurchase agreements
The above bonds sold under repurchase agreements as of June 30, 2016, December 31,2015, and June 30, 2015 were due within one year and were contracted to be repurchasedat the agreed-upon price plus interest charge on the specific date after the transaction. Thetotal repurchase amounts were $17,749,692, $15,641,269, and $16,283,000, respectively,and the annual interest rates in every currency were shown as follows:
June 30, 2016 December 31, 2015
Government bonds 2,549,013$ 3,182,003$
Corporate bonds 900,000 300,000
Bank debentures 1,101,635 1,100,693
International bonds 1,498,078 1,004,891
Foreign bonds 11,666,809 10,014,973
Total 17,715,535$ 15,602,560$
June 30, 2015
Government bonds 2,197,263$
Corporate bonds 850,485
Bank debentures 1,100,144
International bonds 2,547,883
Foreign bonds 9,516,114
Total 16,211,889$
Currency June 30, 2016 December 31, 2015 June 30, 2015
NTD 0.1%~0.41% 0.20%~0.47% 0.53%~0.70%
Foreign currencies (Note) -0.3%~2.5882% 0.00%~7.00% 0.10%~7.7591%
(Note):Foreign currencies include AUD, Euro, USD and RMB.
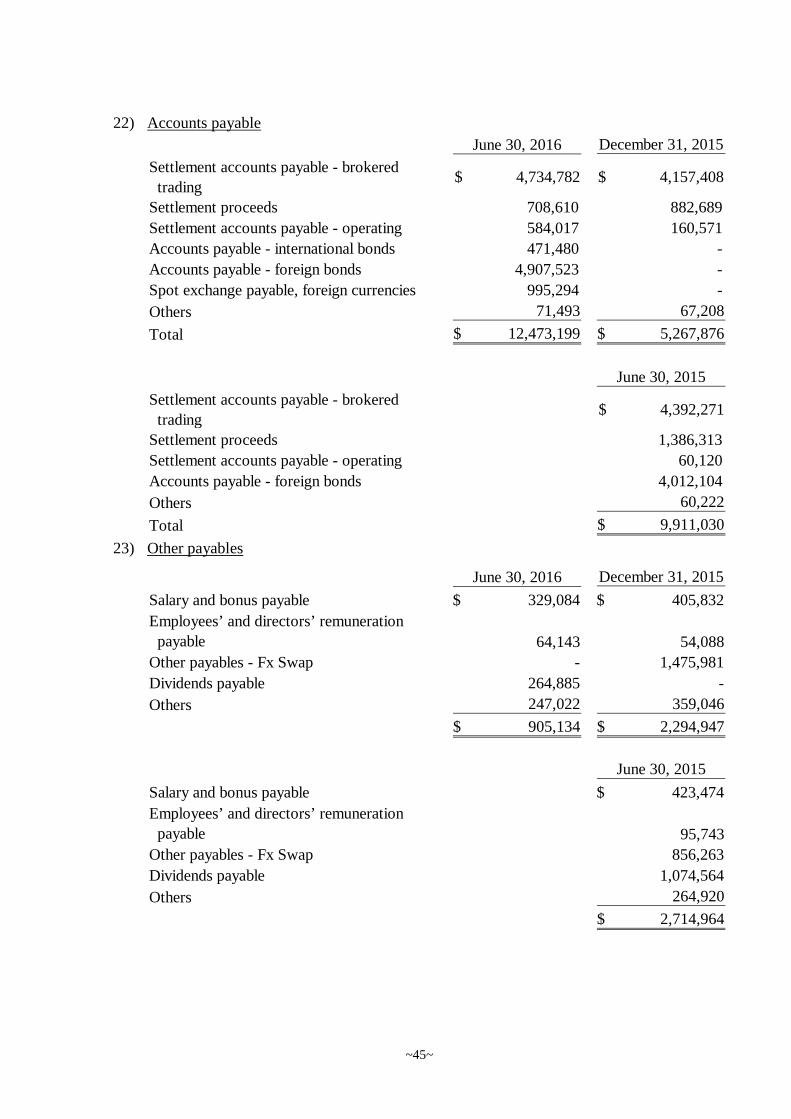
~45~
22) Accounts payable
23) Other payables
June 30, 2016 December 31, 2015
Settlement accounts payable - brokered
trading4,734,782$ 4,157,408$
Settlement proceeds 708,610 882,689
Settlement accounts payable - operating 584,017 160,571
Accounts payable - international bonds 471,480 -
Accounts payable - foreign bonds 4,907,523 -
Spot exchange payable, foreign currencies 995,294 -
Others 71,493 67,208
Total 12,473,199$ 5,267,876$
June 30, 2015
Settlement accounts payable - brokered
trading4,392,271$
Settlement proceeds 1,386,313
Settlement accounts payable - operating 60,120
Accounts payable - foreign bonds 4,012,104
Others 60,222
Total 9,911,030$
June 30, 2016 December 31, 2015
Salary and bonus payable 329,084$ 405,832$
Employees’ and directors’ remuneration
payable 64,143 54,088
Other payables - Fx Swap - 1,475,981
Dividends payable 264,885 -
Others 247,022 359,046
905,134$ 2,294,947$
June 30, 2015
Salary and bonus payable 423,474$
Employees’ and directors’ remuneration
payable 95,743
Other payables - Fx Swap 856,263
Dividends payable 1,074,564
Others 264,920
2,714,964$

~46~
24) Other financial liabilities - current
The Group deals in equity-linked products and combines fixed income instruments withcall or put options. These products are categorized into ELN (Equity-Linked Notes) andPGN (Principal Guaranteed Notes). On trade date, the contracted amounts are collected infull from the counterparties. The payout amount on maturity will depend on the pricefluctuation of the instruments linked to these contracts and be calculated as trading priceless option strike price on maturity. All the linked products are financial instruments underthe supervision of the SFB (Securities and Futures Bureau).
25) Other liabilities-non-current
26) Pension planA. Defined benefit plans
(A) The Group has a defined benefit pension plan in accordance with the LaborStandards Law, covering all regular employees’ service years prior to theenforcement of the Labor Pension Act on July 1, 2005 and service years thereafterof employees who chose to continue to be subject to the pension mechanism underthe Law. Pension benefits are based on the number of units accrued and the averagemonthly salaries and wages of the last 6 months prior to retirement. Under thedefined benefit pension plan, two units are accrued for each year of service for thefirst 15 years and one unit for each additional year thereafter, subject to a maximumof 45 units. The Group contributes monthly an amount which ranges between 2.0%and 7.2% of the employees’ monthly salaries and wages to the retirement funddeposited with Bank of Taiwan, the trustee, under the name of the supervisorycommittee of workers' retirement reserve fund, and with Cathay United Bank,under the name of the management committee of employees’ retirement fund. Also,the Group would assess the balance in the aforementioned labor pension reserve
June 30, 2016 December 31, 2015
Equity-linked notes (ELN) - Options 3,000$ 5,200$
Principal guaranteed notes (PGN) - fixed
income 2,196,224 846,596
Total 2,199,224$ 851,796$
June 30, 2015
Equity-linked notes (ELN) - Options 17,100$
Principal guaranteed notes (PGN) - fixed
income 202,090
Total 219,190$
June 30, 2016 December 31, 2015
Net defined benefit obligation 6,878$ 7,271$
Guarantee deposits received 5,148 4,577
Total 12,026$ 11,848$
June 30, 2015
Net defined benefit obligation 7,392$
Guarantee deposits received 4,461
Total 11,853$

~47~
account by the end of December 31, every year. If the account balance isinsufficient to pay the pension calculated by the aforementioned method, to theemployees expected to be qualified for retirement next year, the Group will makecontributions to cover the deficit by next March.
(B) Under the defined benefit pension plan, the Group recognised the pension costs forthe three months and six months ended June 30, 2016 and 2015 in the statement ofcomprehensive income in the amount of $1,086, $1,213, $2,171, and $2,426,respectively.
(C) Expected contributions to the defined benefit pension plans of the Group for theyear ending December 31, 2017 amounts to $40,063.
B. Defined contribution plans:Effective from July 1, 2005, the Group established a defined contribution plan pursuantto the “Labor Pension Act”, which covers employees with R.O.C. nationality and thosewho chose or are required to apply the “Labor Pension Act”. The contributions are mademonthly based on not less than 6% of the employees’ monthly salaries and wages to theemployees’ individual pension accounts at the Bureau of Labor Insurance. The paymentof pension benefits is based on the employees’ individual pension fund accounts and thecumulative profit in such accounts. The employees can choose to receive such pensionbenefits monthly or in lump sum. The pension costs under defined contribution pensionplans of the Group for the three months and six months ended June 30, 2016 and 2015were $15,013, $14,875, $30,383, and $30,094, respectively.
C. President Securities (HK), President Wealth Management (HK), and President Securities(Nominee) have defined benefit pension plans in accordance with local laws, andrecognised the current pension expenses by contributing to the accrued pension assets.President Securities (HK) recognised pension expenses of $568, $650, $1,279, and$1,319, respectively, for the three months and six months ended June 30, 2016 and 2015.
27) EquityA. Common stock
(A) As of June 30, 2016, the Company’s authorized capital was $15,000,000 with apar value of $10 (in dollars) per share. As of June 30, 2016, December 31, 2015,and June 30, 2015, the common stocks issued were 1,295,248, 1,323,119, and1,323,119 thousand shares, respectively, and the outstanding common stocks were1,295,248, 1,303,796 and 1,323,119 thousand shares, respectively.Movements in the number of the Company’s ordinary shares outstanding are asfollows:
(Expressed in thousands)
Six months ended June
30, 2016
Six months ended June
30, 2015
January 1 1,303,796 1,323,119
Acquisition of treasury
stocks 8,548)( -
June 30 1,295,248 1,323,119

~48~
The Company increased capital through capitalisation of unappropriated retainedearnings of $404,177 by issuing 40,418 thousand shares at par value of $10 pershare as approved by the Board of Director on March 22, 2016 and resolved bystockholders’ meeting on June 14, 2016. The effective date was set on August 1,2016. After the capital increase, the total issued share capital was expected to be$13,356,658, consisting of 1,335,666 thousand shares of ordinary stock at par valueof $10 per share.
(B) Treasury sharesIn order to maintain the Company’s integrity and stockholders’ equity, theCompany’s Board of Directors resolved to buy back outstanding shares with a totallimit of $9,280,221 and $9,564,472 on January 27, 2016 and September 17, 2015,respectively. The expected periods of the buyback are from January 28, 2016 toMarch 25, 2016 and from September 18, 2015 to November 17, 2015, respectively.The expected numbers of shares expected to be bought back are 30,000 shares and40,000 shares, respectively. The buyback prices are set between $8.30 and $19.21per share and between $9.03 and $18.77 per share, respectively. The buybackshares are expected to be 2.27% and 3.02% of total shares issued by the Company,respectively.The movement of the number of treasury shares from the Group’s buyback and itsperiod end amount is as follows:
a. Pursuant to the R.O.C. Securities and Exchange Law, the number of sharesbought back as treasury share should not exceed 10% of the number of theCompany’s issued and outstanding shares and the amount bought back shouldnot exceed the sum of retained earnings, paid-in capital in excess of par valueand realised capital surplus.
b. Pursuant to the R.O.C. Securities and Exchange Law, treasury shares shouldnot be pledged as collateral and is not entitled to dividends before it is reissued.
c. Pursuant to the R.O.C. Securities and Exchange Law, treasury shares shouldbe reissued to the employees within three years from the reacquisition date andshares not reissued within the three-year period are to be retired. Treasuryshares to enhance the Company’s credit rating and the stockholders’ equityshould be retired within six months of acquisition.
(Expressed in thousands)
Reason for
buy back
Shares at the
beginning of
the period
Period
increase
Period
decrease
Shares at
the end of
the period
Period-end
amount
To maintain the
Company’s
integrity
and stockholders’
equity 19,323 8,548 27,871)( - -$
Six months ended June 30, 2016

~49~
d. On January 27 and May 5, 2016, the Board of Directors resolved to retire thetreasury shares. On March 7 and May 20, 2016, the Company completed theregistration of changes in capital. On March 8 and May 23, 2016, the Companyobtained the Jing-Shou-Shang Zi. No. 10501036780 and No. 10501102910issued by the Ministry of Economic Affairs as an approval for retirement of thetreasury shares. The Company’s paid-in capital was $13,231,191 before capitalreduction and was $12,952,481 after capital reduction.
B. Capital reserve
Pursuant to the R.O.C. Company Law, capital reserve arising from paid-in capital inexcess of par value on issuance of common stocks and donations can be used to coveraccumulated deficit or to issue new stocks or cash to shareholders in proportion to theirshare ownership, provided it should not exceed 10% of the paid-in capital each year.Capital reserve should not be used to cover accumulated deficit unless the legal reserveis insufficient.
C. Legal reserveUnder the Company’s Articles of Incorporation, the current year’s earnings, if any, shallfirst be used to pay all taxes and offset prior years’ operating losses and then 10% of theremaining amount shall be set aside as legal reserve. Except for covering accumulateddeficit or issuing new stocks or cash to shareholders in proportion to their shareownership, the legal reserve shall not be used for any other purpose. The use of legalreserve for the issuance of stocks or cash to shareholders in proportion to their shareownership is permitted, provided that the balance of the reserve exceeds 25% of theCompany’s paid-in capital.
D. Special reserveAccording to the “Article 14 of Rules Governing the Administration of SecuritiesFirms”, 20% of the current year's earnings, after paying all taxes and offsetting prioryears' operating losses, if any, shall be set aside as special reserve until the cumulativebalance equals the total amount of paid-in capital. The special reserve shall be usedexclusively to cover accumulated deficit or to increase capital and shall not be used forany other purpose. Such capitalization shall not be permitted unless the Company hadalready accumulated a special reserve of at least 50% of its paid-in capital stock andonly half of such special reserve may be capitalized.In accordance with the regulations, the Company shall set aside an equivalent amountof special reserve from accumulated unappropriated retained earnings of the current yearbased on the decreased amount of equity. If there is any subsequent reversal of thedecrease in equity, the earnings may be distributed based on the reversal proportion.
Share premium
Treasury share
transactions
Expired stock
options
Difference between
consideration and
carrying amount of
subsidiaries acquired
or disposed Total
January 1, 2016 25,524$ 229,669$ 483$ 440$ 256,116$Retirement of
treasury shares 538)( 112,876)( - - 113,414)(
June 30, 2016 24,986$ 116,793$ 483$ 440$ 142,702$
June 30, 2015 25,524$ 229,669$ 483$ 440$ 256,116$

~50~
28) Unappropriated earnings and dividends policyA. Under the Company’s Articles of Incorporation, the current year’s earnings, if any, shall
be used to pay all taxes and offset prior years’ operating losses first, and then set asideas legal reserve, accounted for as 10% of the remaining amount, and special reserve,accounted for as 20% of the remaining amount. Upon provision or reversal of specialreserve in accordance with the law, any remaining amount together with unappropriatedearnings at beginning of the period shall be distributed according to the followingresolution adopted at the stockholders’ meeting: Distribution shall not be made if thebalance of distributable earnings is less than 5% of paid-in capital.
B. In addition, the total amount of dividends declared every year shall be at least 70% ofdistributable earnings, of which stock dividends shall be at least 50% and cashdividends shall be lower than 50%.
C. The Company may determine a better proportion of cash and stock dividendsdistribution based on its actual operating conditions and capital utilization plan for thefollowing year.
D. The appropriation of 2015 and 2014 earnings was resolved by the shareholders on June14, 2016 and June 18, 2015, respectively. Detail is as follows:
E. For details on employees’ remuneration and directors’ remuneration, please refer toNote 6(41).
29) Brokerage handling fee revenue
Amount
Dividends per
share (in dollars) Amount
Dividends per
share (in dollars)
Legal reserve 95,661$ 154,998$
Special reserve 191,323 309,995
Cash dividends 260,759 0.20$ 1,071,726 0.81$
Stock dividends 404,177 0.31 -
951,920$ 1,536,719$
For the year ended December
31, 2015
For the year ended December
31, 2014
Three months ended
June 30, 2016
Three months ended
June 30, 2015
Revenues from brokered trading - TWSE 166,096$ 253,577$
Revenues from brokered trading - OTC 75,572 99,209
Revenues from brokered trading - Futures 171,113 174,525
Others 16,461 56,342
Total 429,242$ 583,653$
Six months ended
June 30, 2016
Six months ended
June 30, 2015
Revenues from brokered trading - TWSE 363,099$ 478,475$
Revenues from brokered trading - OTC 163,187 181,958
Revenues from brokered trading - Futures 342,858 320,320
Others 33,517 80,876
Total 902,661$ 1,061,629$
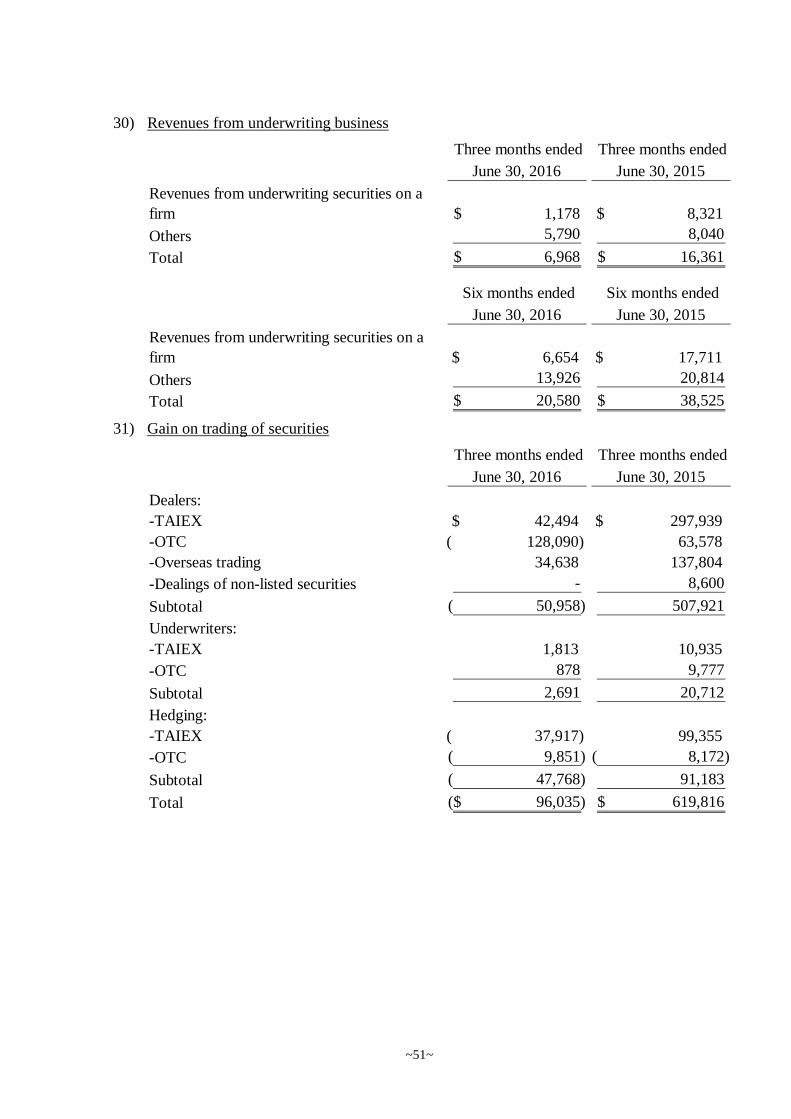
~51~
30) Revenues from underwriting business
31) Gain on trading of securities
Three months ended
June 30, 2016
Three months ended
June 30, 2015
Revenues from underwriting securities on a
firm 1,178$ 8,321$
Others 5,790 8,040
Total 6,968$ 16,361$
Six months ended
June 30, 2016
Six months ended
June 30, 2015
Revenues from underwriting securities on a
firm 6,654$ 17,711$
Others 13,926 20,814
Total 20,580$ 38,525$
Three months ended
June 30, 2016
Three months ended
June 30, 2015
Dealers:
-TAIEX 42,494$ 297,939$
-OTC 128,090)( 63,578
-Overseas trading 34,638 137,804
-Dealings of non-listed securities - 8,600
Subtotal 50,958)( 507,921
Underwriters:
-TAIEX 1,813 10,935
-OTC 878 9,777
Subtotal 2,691 20,712
Hedging:
-TAIEX 37,917)( 99,355
-OTC 9,851)( 8,172)(
Subtotal 47,768)( 91,183
Total 96,035)($ 619,816$

~52~
With respect to information shown above, amounts recognised for trading of securities
generated from available-for-sale financial assets for the three months and six months ended
June 30, 2016 and 2015 were $40,952, $0, $44,523, and $0, respectively.
32) Interest income
Six months ended
June 30, 2016
Six months ended
June 30, 2015
Dealers:
-TAIEX 20,570$ 466,750$
-OTC 159,583)( 92,008
-Overseas trading 49,575)( 123,141
-Dealings of non-listed securities - 8,600
Subtotal 188,588)( 690,499
Underwriters:
-TAIEX 32,758 13,308
-OTC 14,625 18,121
Subtotal 47,383 31,429
Hedging:
-TAIEX 32,387)( 178,284
-OTC 274 21,545
Subtotal 32,113)( 199,829
Total 173,318)($ 921,757$
Three months ended
June 30, 2016
Three months ended
June 30, 2015
Interest income from margin loans 143,799$ 226,663$
Interest income from bonds 154,939 144,979
Others 591 962
Total 299,329$ 372,604$
Six months ended
June 30, 2016
Six months ended
June 30, 2015
Interest income from margin loans 294,160$ 442,863$
Interest income from bonds 323,186 244,109
Others 1,042 1,248
Total 618,388$ 688,220$
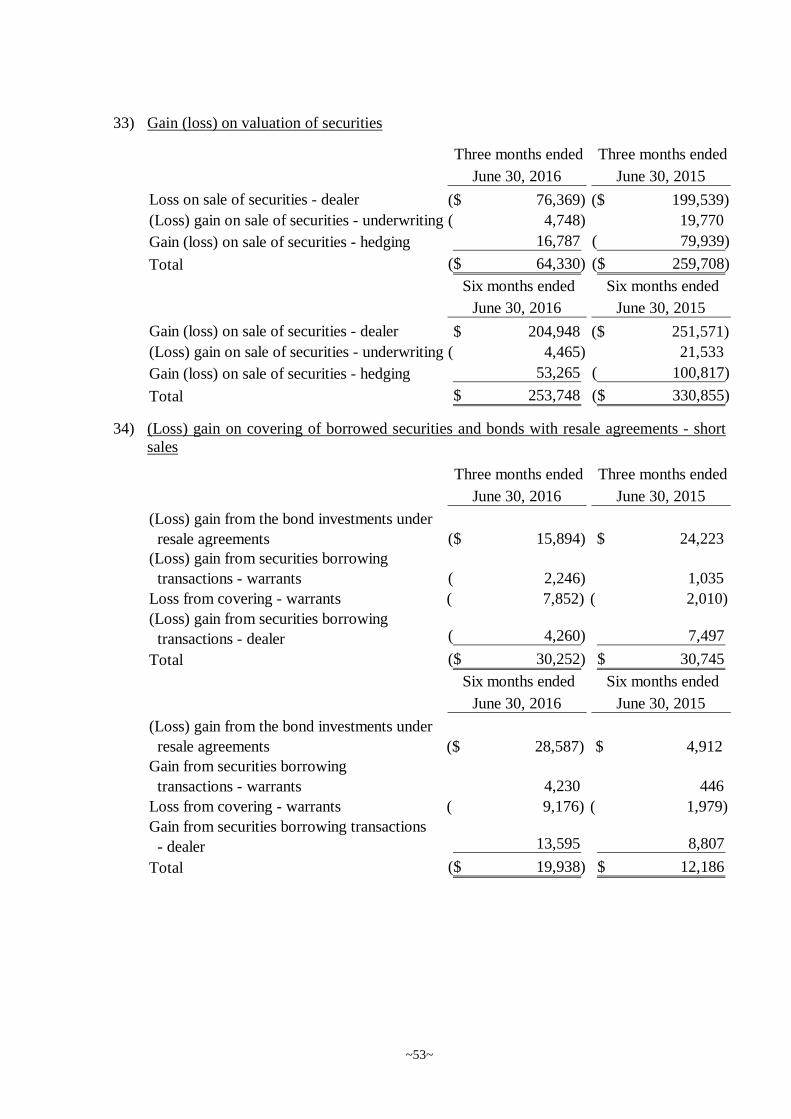
~53~
33) Gain (loss) on valuation of securities
34) (Loss) gain on covering of borrowed securities and bonds with resale agreements - shortsales
Three months ended
June 30, 2016
Three months ended
June 30, 2015
Loss on sale of securities - dealer 76,369)($ 199,539)($
(Loss) gain on sale of securities - underwriting 4,748)( 19,770
Gain (loss) on sale of securities - hedging 16,787 79,939)(
Total 64,330)($ 259,708)($
Six months ended
June 30, 2016
Six months ended
June 30, 2015
Gain (loss) on sale of securities - dealer 204,948$ 251,571)($
(Loss) gain on sale of securities - underwriting 4,465)( 21,533
Gain (loss) on sale of securities - hedging 53,265 100,817)(
Total 253,748$ 330,855)($
Three months ended
June 30, 2016
Three months ended
June 30, 2015
(Loss) gain from the bond investments under
resale agreements 15,894)($ 24,223$(Loss) gain from securities borrowing
transactions - warrants 2,246)( 1,035
Loss from covering - warrants 7,852)( 2,010)(
(Loss) gain from securities borrowing
transactions - dealer 4,260)( 7,497
Total 30,252)($ 30,745$
Six months ended
June 30, 2016
Six months ended
June 30, 2015
(Loss) gain from the bond investments under
resale agreements 28,587)($ 4,912$Gain from securities borrowing
transactions - warrants 4,230 446
Loss from covering - warrants 9,176)( 1,979)(
Gain from securities borrowing transactions
- dealer 13,595 8,807
Total 19,938)($ 12,186$

~54~
35) Valuation (loss) gain on borrowed securities and bonds with resale agreements - short sales
36) Gain (loss) on warrants issuance
Three months ended
June 30, 2016
Three months ended
June 30, 2015
Valuation (loss) gain from the bond
investments 14,933)($ 22,077$Valuation (loss) gain from securities
borrowing 1,933)( 604Valuation gain from securities borrowing
transactions - warrants 114 2,151
Valuation gain (loss) from covering - warrants 6,656 56)(
Total 10,096)($ 24,776$
Six months ended
June 30, 2016
Six months ended
June 30, 2015
Valuation (loss) gain from the bond
investments 34,939)($ 24,943$Valuation loss from securities borrowing
transactions - dealer 9,533)( 719)(Valuation (loss) gain from securities
borrowing 5,154)( 1,870
Valuation (loss) gain from covering - warrants 7,910)( 54
Total 57,536)($ 26,148$
Three months ended
June 30, 2016
Three months ended
June 30, 2015
Gain on changes in fair value of call ( put )
warrant liabilities and redemption 134,139$ 36,794$Losses on exercise of call ( put ) warrants
before maturity 3,289)( 7,610)(Expenses arising out of issuance of call
( put ) warrants 16,492)( 15,741)(
Total 114,358$ 13,443$
Six months ended
June 30, 2016
Six months ended
June 30, 2015
Gain on changes in fair value of call ( put )
warrant liabilities and redemption 283,504$ 29,405$Losses on exercise of call ( put ) warrants
before maturity 9,650)( 42,318)(Expenses arising out of issuance of call
( put ) warrants 28,621)( 29,124)(
Total 245,233$ 42,037)($

~55~
37) Gain on derivative financial instruments
38) Other operating income
Three months ended
June 30, 2016
Three months ended
June 30, 2015
Futures contract (loss) gains 3,699)($ 149,206$
Option trading gain 71,721 15,660
Gain (loss) from asset swap options 563 1,503)(
Gain on foreign exchange derivatives 65,315 -
Others 5,320)( 4,487
Total 128,580$ 167,850$
Six months ended
June 30, 2016
Six months ended
June 30, 2015
Futures contract (loss) gains 6,132)($ 191,418$
Option trading gain 127,327 51,913
Gain (loss) from asset swap options 72 91)(
Gain on foreign exchange derivatives 32,481 -
Others 9,136)( 5,509
Total 144,612$ 248,749$
Three months ended
June 30, 2016
Three months ended
June 30, 2015
Income from securities lending 2,472$ 470$
Handling fee revenues from funds 9,540 9,910
Others 34,899 28,726
Total 46,911$ 39,106$
Six months ended
June 30, 2016
Six months ended
June 30, 2015
Income from securities lending 4,635$ 3,359$
Handling fee revenues from funds 18,818 18,854
Others 67,860 73,882
Total 91,313$ 96,095$

~56~
39) Handling charges
40) Financial expenses
Three months ended
June 30, 2016
Three months ended
June 30, 2015
Brokerage handling fee expense 49,800$ 60,464$
Dealer handling fee expense 26,804 26,394
Refinancing processing fee expense 218 248
Total 76,822$ 87,106$
Six months ended
June 30, 2016
Six months ended
June 30, 2015
Brokerage handling fee expense 103,703$ 108,836$
Dealer handling fee expense 50,929 48,953
Refinancing processing fee expense 609 473
Total 155,241$ 158,262$
Three months ended
June 30, 2016
Three months ended
June 30, 2015
Interest expense from repurchase agreements 22,896$ 52,636$
Loans interest expense 14,613 44,892Other interest expense 4,256 2,508
Total 41,765$ 100,036$
Six months ended
June 30, 2016
Six months ended
June 30, 2015
Interest expense from repurchase agreements 63,635$ 85,147$
Loans interest expense 36,963 86,402Other interest expense 6,940 5,374
Total 107,538$ 176,923$
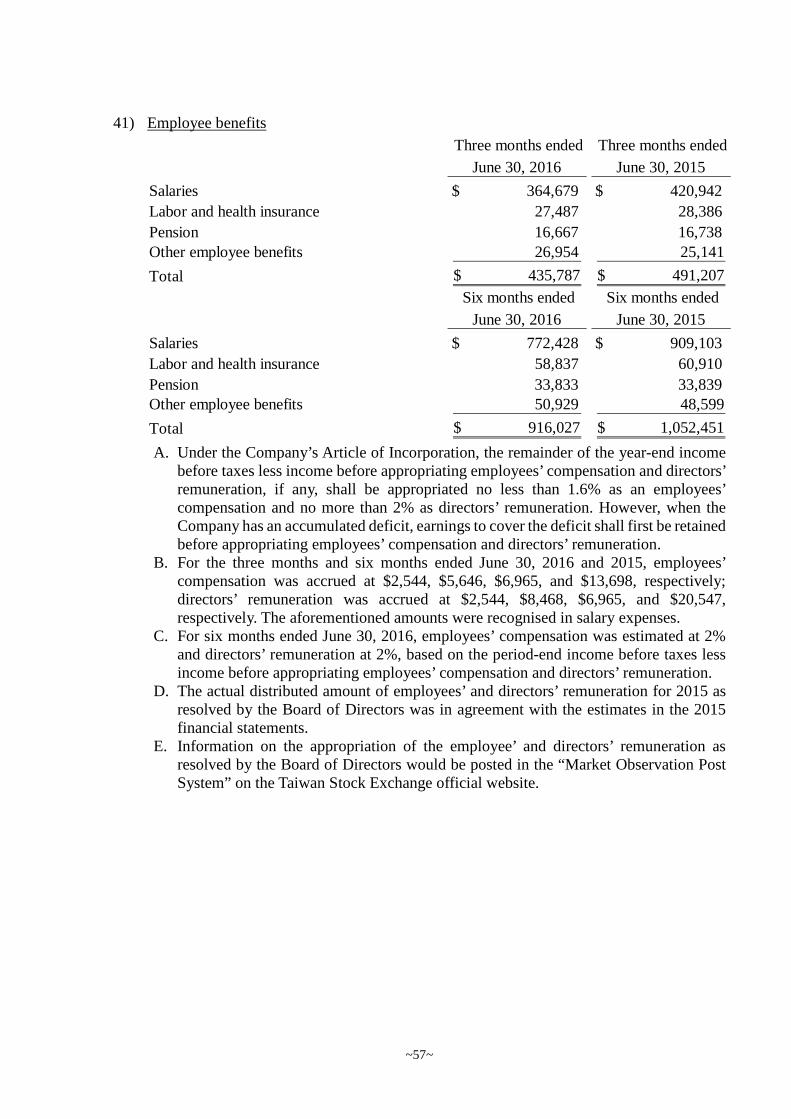
~57~
41) Employee benefits
A. Under the Company’s Article of Incorporation, the remainder of the year-end incomebefore taxes less income before appropriating employees’ compensation and directors’remuneration, if any, shall be appropriated no less than 1.6% as an employees’compensation and no more than 2% as directors’ remuneration. However, when theCompany has an accumulated deficit, earnings to cover the deficit shall first be retainedbefore appropriating employees’ compensation and directors’ remuneration.
B. For the three months and six months ended June 30, 2016 and 2015, employees’compensation was accrued at $2,544, $5,646, $6,965, and $13,698, respectively;directors’ remuneration was accrued at $2,544, $8,468, $6,965, and $20,547,respectively. The aforementioned amounts were recognised in salary expenses.
C. For six months ended June 30, 2016, employees’ compensation was estimated at 2%and directors’ remuneration at 2%, based on the period-end income before taxes lessincome before appropriating employees’ compensation and directors’ remuneration.
D. The actual distributed amount of employees’ and directors’ remuneration for 2015 asresolved by the Board of Directors was in agreement with the estimates in the 2015financial statements.
E. Information on the appropriation of the employee’ and directors’ remuneration asresolved by the Board of Directors would be posted in the “Market Observation PostSystem” on the Taiwan Stock Exchange official website.
Three months ended
June 30, 2016
Three months ended
June 30, 2015
Salaries 364,679$ 420,942$
Labor and health insurance 27,487 28,386
Pension 16,667 16,738Other employee benefits 26,954 25,141
Total 435,787$ 491,207$
Six months ended
June 30, 2016
Six months ended
June 30, 2015
Salaries 772,428$ 909,103$
Labor and health insurance 58,837 60,910
Pension 33,833 33,839Other employee benefits 50,929 48,599
Total 916,027$ 1,052,451$
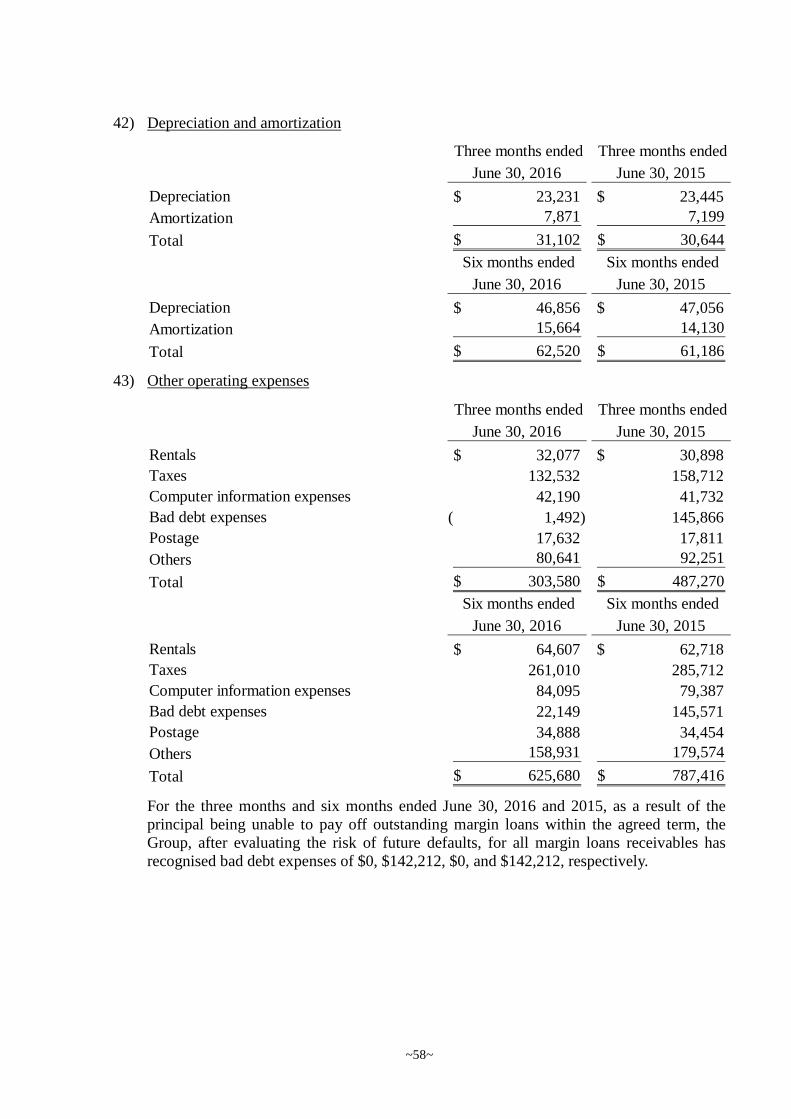
~58~
42) Depreciation and amortization
43) Other operating expenses
For the three months and six months ended June 30, 2016 and 2015, as a result of theprincipal being unable to pay off outstanding margin loans within the agreed term, theGroup, after evaluating the risk of future defaults, for all margin loans receivables hasrecognised bad debt expenses of $0, $142,212, $0, and $142,212, respectively.
Three months ended
June 30, 2016
Three months ended
June 30, 2015
Depreciation 23,231$ 23,445$
Amortization 7,871 7,199
Total 31,102$ 30,644$
Six months ended
June 30, 2016
Six months ended
June 30, 2015
Depreciation 46,856$ 47,056$
Amortization 15,664 14,130
Total 62,520$ 61,186$
Three months ended
June 30, 2016
Three months ended
June 30, 2015
Rentals 32,077$ 30,898$
Taxes 132,532 158,712
Computer information expenses 42,190 41,732
Bad debt expenses 1,492)( 145,866
Postage 17,632 17,811
Others 80,641 92,251
Total 303,580$ 487,270$
Six months ended
June 30, 2016
Six months ended
June 30, 2015
Rentals 64,607$ 62,718$
Taxes 261,010 285,712
Computer information expenses 84,095 79,387
Bad debt expenses 22,149 145,571
Postage 34,888 34,454
Others 158,931 179,574
Total 625,680$ 787,416$

~59~
44) Other gains and losses
45) Income taxA. Income tax expense
a) Components of income tax expense:
Three months ended
June 30, 2016
Three months ended
June 30, 2015
Financial income 36,868$ 34,810$
Gain on disposal of investments 713 37,675Gain (loss) on valuation of open-ended funds
and money-market instruments 3,150 21,720)(
Net currency exchange gain (loss) 53,971 62,685)(
Other non-operating revenues and gains 48,767 270
Total 143,469$ 11,650)($
Six months ended
June 30, 2016
Six months ended
June 30, 2015
Financial income 72,823$ 69,735$
Gain on disposal of investments 729 42,261Gain on valuation of open-ended funds and
money-market instruments 8,369 3,510
Net currency exchange (loss) gain 172)( 411,108
Other non-operating revenues and gains 82,892 33,586
Total 164,641$ 560,200$
Three months ended
June 30, 2016
Three months ended
June 30, 2015
Current tax:
Current tax on profits for the periods 17,692$ 79,218$
Over provision of prior year’s
income tax 3,556)( 2,295)(
Total current tax 14,136 76,923
Deferred taxes:
Temporary differences 506)( 31,314)(
Total deferred taxes 506)( 31,314)(
Income tax expense 13,630$ 45,609$

~60~
B. As of June 30, 2016, the Company’s income tax returns through 2013 have beenassessed by the National Tax Authority. The income tax returns through 2014 ofPresident Futures, President Capital Management, President Venture Capital, PresidentPersonal Insurance Agency and President Insurance Agency have also been assessed.
C. Unappropriated earnings
D. Imputation tax systema) As of June 30, 2016, December 31, 2015, and June 30, 2015, the balance of the
imputation tax credit account and the creditable tax rate are $614,220, $540,180,and $753,666, respectively.
b) The imputation tax credit rate based on the appropriation of 2014 earnings is20.63% in 2015; the imputation tax credit rate is 20.66% for 2015.
E. With respect to the income tax returns of the Company for 2008, 2010 and 2011, theTax Authority assessed to increase income tax payable by $18,779. However, theCompany disagreed with the assessments and had filed for administrative litigation.Moreover, the Company had recognised the income tax expense relating to theadditional income tax payable.
Six months ended
June 30, 2016
Six months ended
June 30, 2015
Current tax:
Current tax on profits for the periods 32,866$ 153,316$
Over provision of prior year’s
income tax 3,556)( 3,474)(
Total current tax 29,310 149,842
Deferred taxes:
Temporary differences 13,154 17,158)(
Total deferred taxes 13,154 17,158)(
Income tax expense 42,464$ 132,684$
June 30, 2016 December 31, 2015
1998 and onwards 318,186$ 960,922$
June 30, 2015
1998 and onwards 961,560$

~61~
46) Earnings per share
Amount
after tax
Weighted-average
outstanding
common shares
(In thousands)
Earnings per
share
(In dollars)
Basic earnings per shareNet income attributable to
common shareholders 119,003$ 1,338,751 0.09$
Dilutive effect of common
stock equivalents
Employee bonus - 265
119,003$ 1,339,016 0.09$
Amount
after tax
Weighted-average
outstanding
common shares
(In thousands)
Earnings per
share
(In dollars)
Basic earnings per shareNet income attributable to
common shareholders 390,849$ 1,364,406 0.29$
Dilutive effect of common
stock equivalents
Employee bonus - 381
390,849$ 1,364,787 0.28$
Amount
after tax
Weighted-average
outstanding
common shares
(In thousands)
Earnings per
share
(In dollars)
Basic earnings per shareNet income attributable to
common shareholders 309,184$ 1,338,751 0.23$
Dilutive effect of common
stock equivalentsEmployee bonus - 588
309,184$ 1,339,339 0.23$
Three months ended June 30, 2016
Three months ended June 30, 2015
Six months ended June 30, 2016

~62~
The abovementioned weighted average number of outstanding shares was retrospectively
adjusted proportionately to the capitalised amount of unappropriated earnings for the year
ended December 31, 2015.
(Blank below)
Amount
after tax
Weighted-average
outstanding
common shares
(In thousands)
Earnings per
share
(In dollars)
Basic earnings per shareNet income attributable to
common shareholders 948,303$ 1,364,406 0.70$
Dilutive effect of common
stock equivalents
Employee bonus - 875
948,303$ 1,365,281 0.69$
Six months ended June 30, 2015
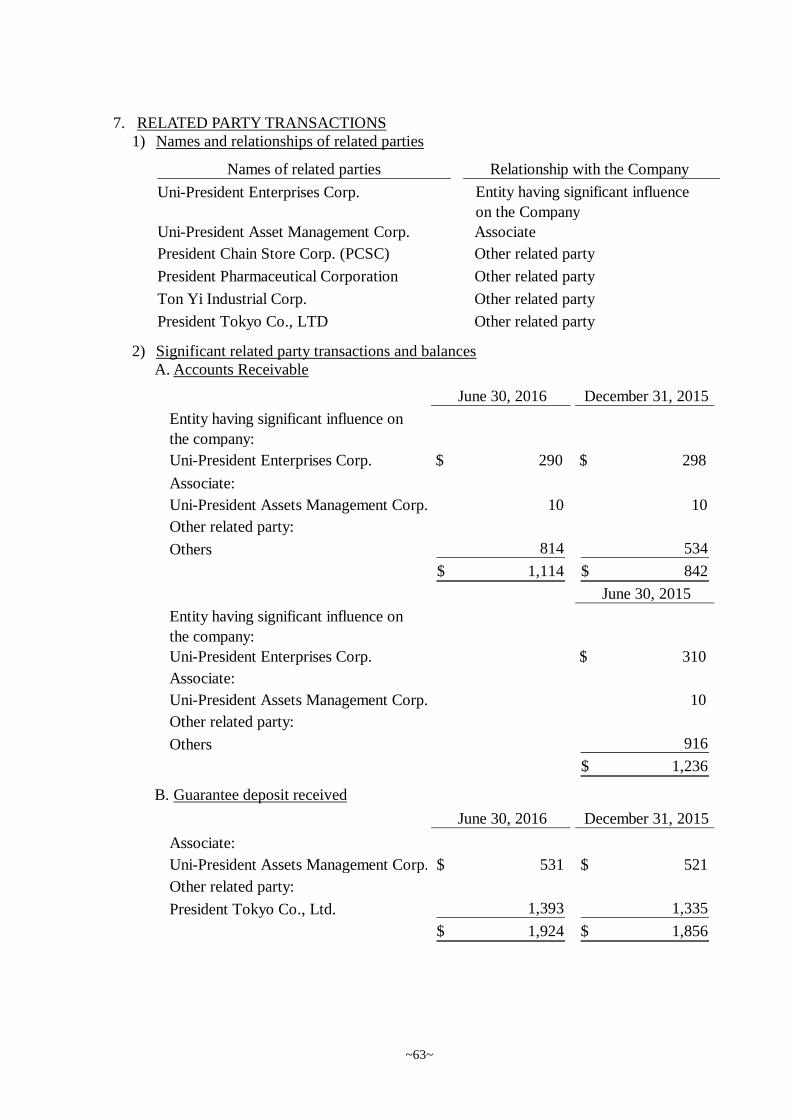
~63~
7. RELATED PARTY TRANSACTIONS1) Names and relationships of related parties
2) Significant related party transactions and balancesA. Accounts Receivable
B. Guarantee deposit received
Names of related parties Relationship with the Company
Uni-President Enterprises Corp. Entity having significant influence
on the Company
Uni-President Asset Management Corp. Associate
President Chain Store Corp. (PCSC) Other related party
President Pharmaceutical Corporation Other related party
Ton Yi Industrial Corp. Other related party
President Tokyo Co., LTD Other related party
June 30, 2016 December 31, 2015
Entity having significant influence on
the company:
Uni-President Enterprises Corp. 290$ 298$
Associate:
Uni-President Assets Management Corp. 10 10
Other related party:
Others 814 534
1,114$ 842$
June 30, 2015
Entity having significant influence on
the company:
Uni-President Enterprises Corp. 310$
Associate:
Uni-President Assets Management Corp. 10
Other related party:
Others 916
1,236$
June 30, 2016 December 31, 2015
Associate:
Uni-President Assets Management Corp. 531$ 521$
Other related party:
President Tokyo Co., Ltd. 1,393 1,335
1,924$ 1,856$

~64~
C. Handling charge revenue and trust income from sales of funds on behalf of others
The revenues were collected on a monthly basis in accordance with contract terms.D. Rent income
June 30, 2015
Associate:
Uni-President Assets Management Corp. 521$
Other related party:
President Tokyo Co., Ltd. 987
Others 110
1,618$
Three months ended
June 30, 2016
Three months ended
June 30, 2015
Associates:
Uni-President Assets Management Corp. 9,848$ 10,269$
Six months ended
June 30, 2016
Six months ended
June 30, 2015
Associates:
Uni-President Assets Management Corp. 19,558$ 19,168$
Period Deposit
Three months
ended June 30,
2016
Three months
ended June 30,
2015
Associates:
Uni-President Assets
Management Corp. 2016.05.01~2019.04.30 531$ 1,769$ 1,746$
Other related party:
President Pharmaceutical
Corp. 2015.10.01~2018.09.30 - 9 1,470
President Tokyo Co., Ltd. 2015.04.01~2018.03.31 1,393 2,293 1,663
Others - 81 103
4,152$ 4,982$
Period Deposit
Six months ended
June 30, 2016
Six months ended
June 30, 2015
Associates:
Uni-President Assets
Management Corp. 2016.05.01~2019.04.30 531$ 3,519$ 3,492$
Other related party:
President Pharmaceutical
Corp. 2015.10.01~2018.09.30 - 18 2,940
President Tokyo Co., Ltd. 2015.04.01~2018.03.31 1,393 4,531 3,325
Others - 168 202
8,236$ 9,959$
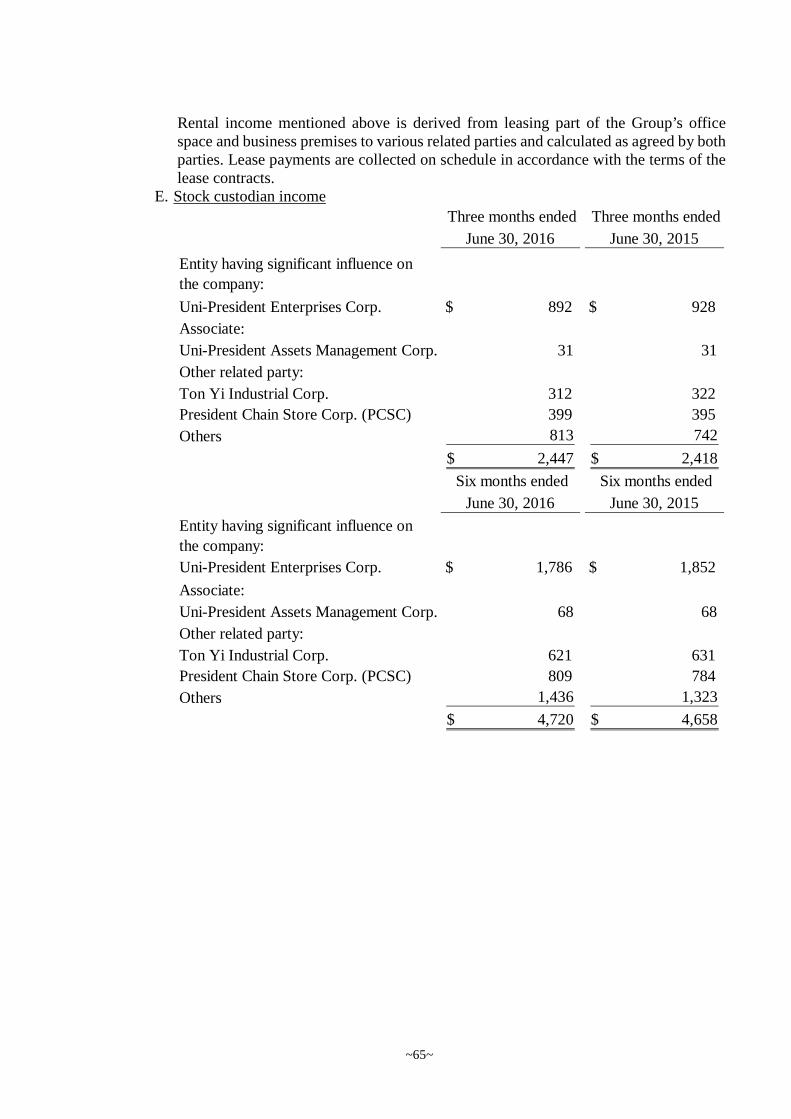
~65~
Rental income mentioned above is derived from leasing part of the Group’s officespace and business premises to various related parties and calculated as agreed by bothparties. Lease payments are collected on schedule in accordance with the terms of thelease contracts.
E. Stock custodian income
Three months ended
June 30, 2016
Three months ended
June 30, 2015
Entity having significant influence on
the company:
Uni-President Enterprises Corp. 892$ 928$
Associate:
Uni-President Assets Management Corp. 31 31
Other related party:
Ton Yi Industrial Corp. 312 322
President Chain Store Corp. (PCSC) 399 395
Others 813 742
2,447$ 2,418$
Six months ended
June 30, 2016
Six months ended
June 30, 2015
Entity having significant influence on
the company:
Uni-President Enterprises Corp. 1,786$ 1,852$
Associate:
Uni-President Assets Management Corp. 68 68
Other related party:
Ton Yi Industrial Corp. 621 631
President Chain Store Corp. (PCSC) 809 784
Others 1,436 1,323
4,720$ 4,658$
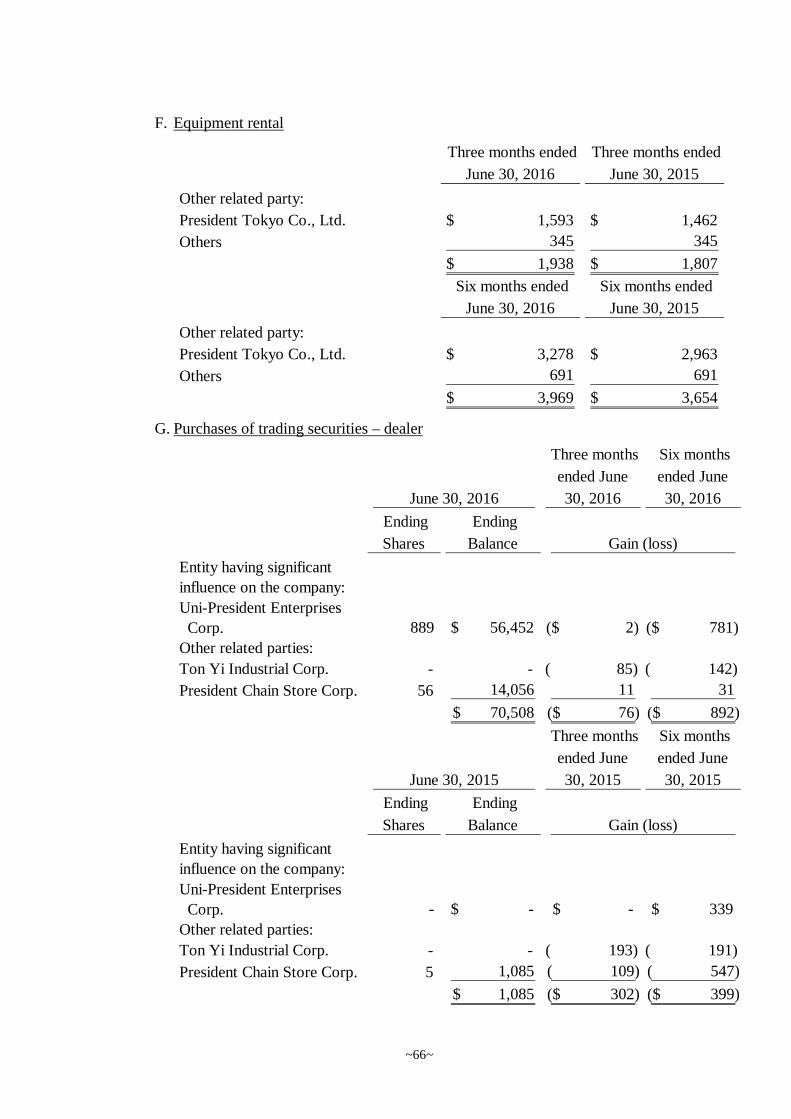
~66~
F. Equipment rental
G. Purchases of trading securities – dealer
Three months ended
June 30, 2016
Three months ended
June 30, 2015
Other related party:
President Tokyo Co., Ltd. 1,593$ 1,462$
Others 345 345
1,938$ 1,807$
Six months ended
June 30, 2016
Six months ended
June 30, 2015
Other related party:
President Tokyo Co., Ltd. 3,278$ 2,963$
Others 691 691
3,969$ 3,654$
Three months
ended June
30, 2016
Six months
ended June
30, 2016
Ending
Shares
Ending
Balance
Entity having significant
influence on the company:
Uni-President Enterprises
Corp. 889 56,452$ 2)($ 781)($
Other related parties:
Ton Yi Industrial Corp. - - 85)( 142)(
President Chain Store Corp. 56 14,056 11 31
70,508$ 76)($ 892)($
Three months
ended June
30, 2015
Six months
ended June
30, 2015
Ending
Shares
Ending
Balance
Entity having significant
influence on the company:
Uni-President Enterprises
Corp. - -$ -$ 339$
Other related parties:
Ton Yi Industrial Corp. - - 193)( 191)(
President Chain Store Corp. 5 1,085 109)( 547)(
1,085$ 302)($ 399)($
June 30, 2016
Gain (loss)
June 30, 2015
Gain (loss)
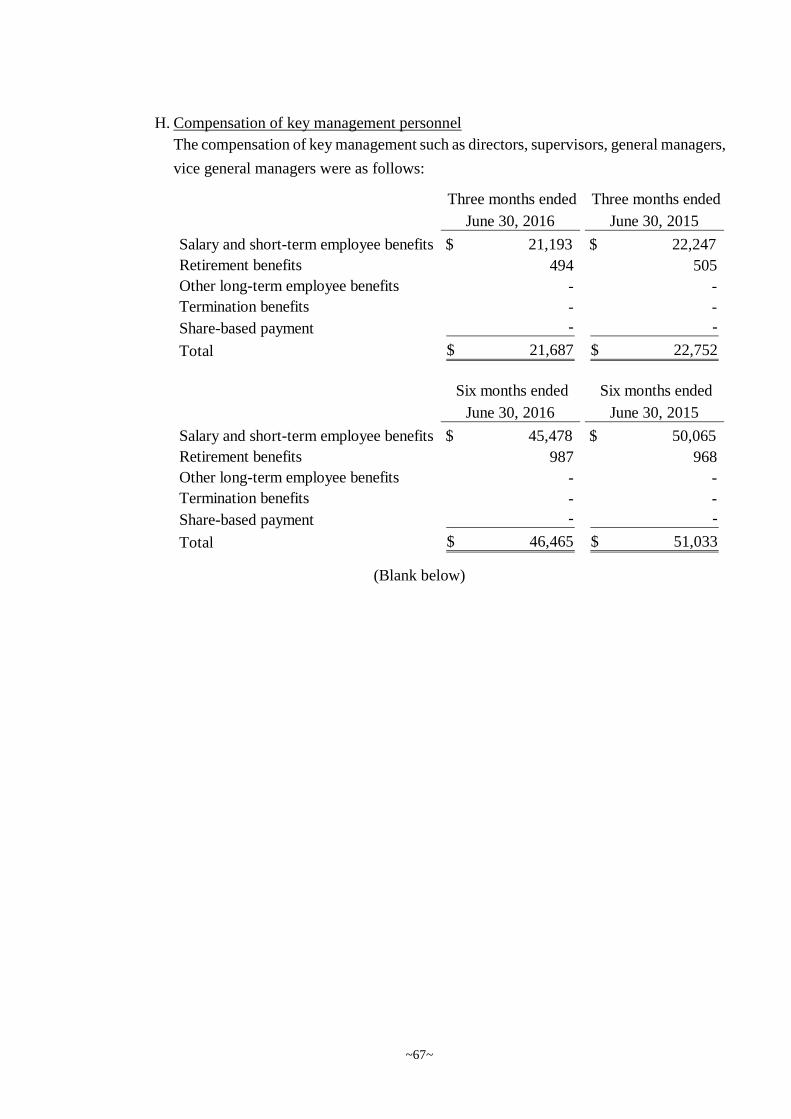
~67~
H. Compensation of key management personnel
The compensation of key management such as directors, supervisors, general managers,
vice general managers were as follows:
(Blank below)
Three months ended
June 30, 2016
Three months ended
June 30, 2015
Salary and short-term employee benefits 21,193$ 22,247$
Retirement benefits 494 505
Other long-term employee benefits - -
Termination benefits - -
Share-based payment - -
Total 21,687$ 22,752$
Six months ended
June 30, 2016
Six months ended
June 30, 2015
Salary and short-term employee benefits 45,478$ 50,065$
Retirement benefits 987 968
Other long-term employee benefits - -
Termination benefits - -
Share-based payment - -
Total 46,465$ 51,033$
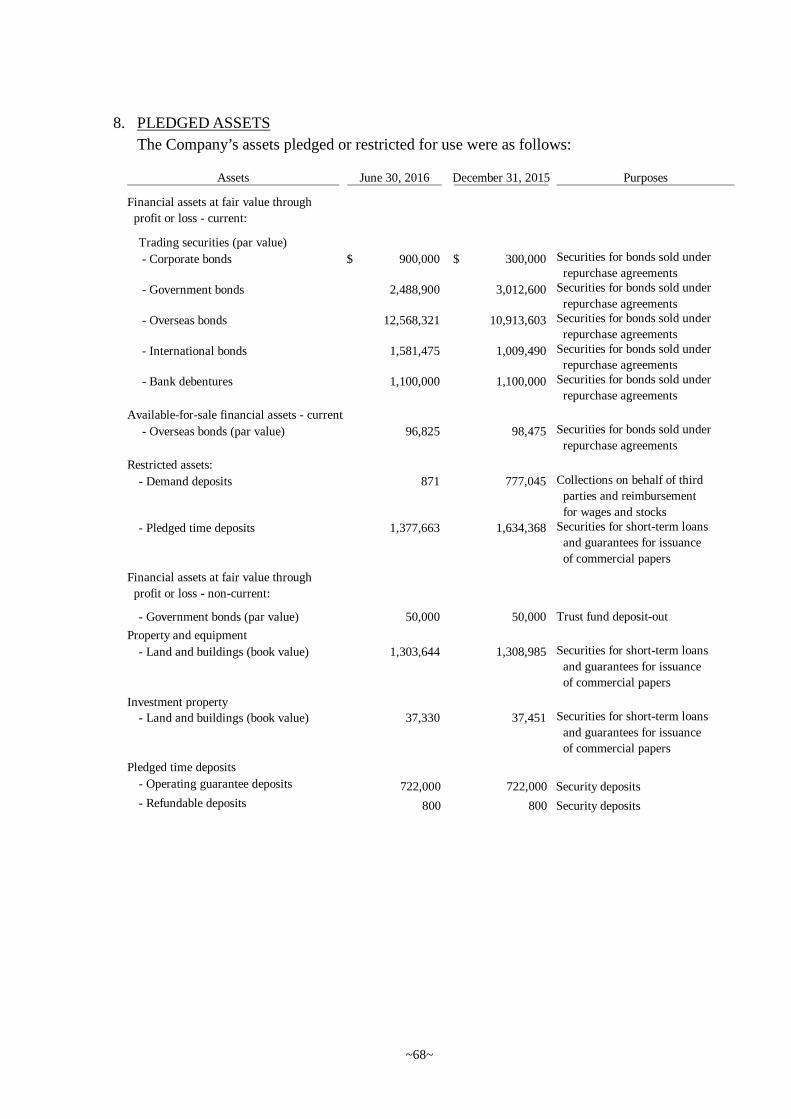
~68~
8. PLEDGED ASSETS
The Company’s assets pledged or restricted for use were as follows:
Assets June 30, 2016 December 31, 2015 Purposes
Trading securities (par value)
- Corporate bonds 900,000$ 300,000$ Securities for bonds sold under
repurchase agreements
- Government bonds 2,488,900 3,012,600 Securities for bonds sold under
repurchase agreements
- Overseas bonds 12,568,321 10,913,603 Securities for bonds sold under
repurchase agreements
- International bonds 1,581,475 1,009,490 Securities for bonds sold under
repurchase agreements
- Bank debentures 1,100,000 1,100,000 Securities for bonds sold under
repurchase agreements
Available-for-sale financial assets - current
- Overseas bonds (par value) 96,825 98,475 Securities for bonds sold under
repurchase agreements
Restricted assets:
- Demand deposits 871 777,045 Collections on behalf of third
parties and reimbursement
for wages and stocks
- Pledged time deposits 1,377,663 1,634,368 Securities for short-term loans
and guarantees for issuance
of commercial papers
- Government bonds (par value) 50,000 50,000 Trust fund deposit-out
Property and equipment
- Land and buildings (book value) 1,303,644 1,308,985 Securities for short-term loans
and guarantees for issuance
of commercial papers
Investment property
- Land and buildings (book value) 37,330 37,451 Securities for short-term loans
and guarantees for issuance
of commercial papers
Pledged time deposits
- Operating guarantee deposits 722,000 722,000 Security deposits
- Refundable deposits 800 800 Security deposits
Financial assets at fair value through
profit or loss - current:
Financial assets at fair value through
profit or loss - non-current:
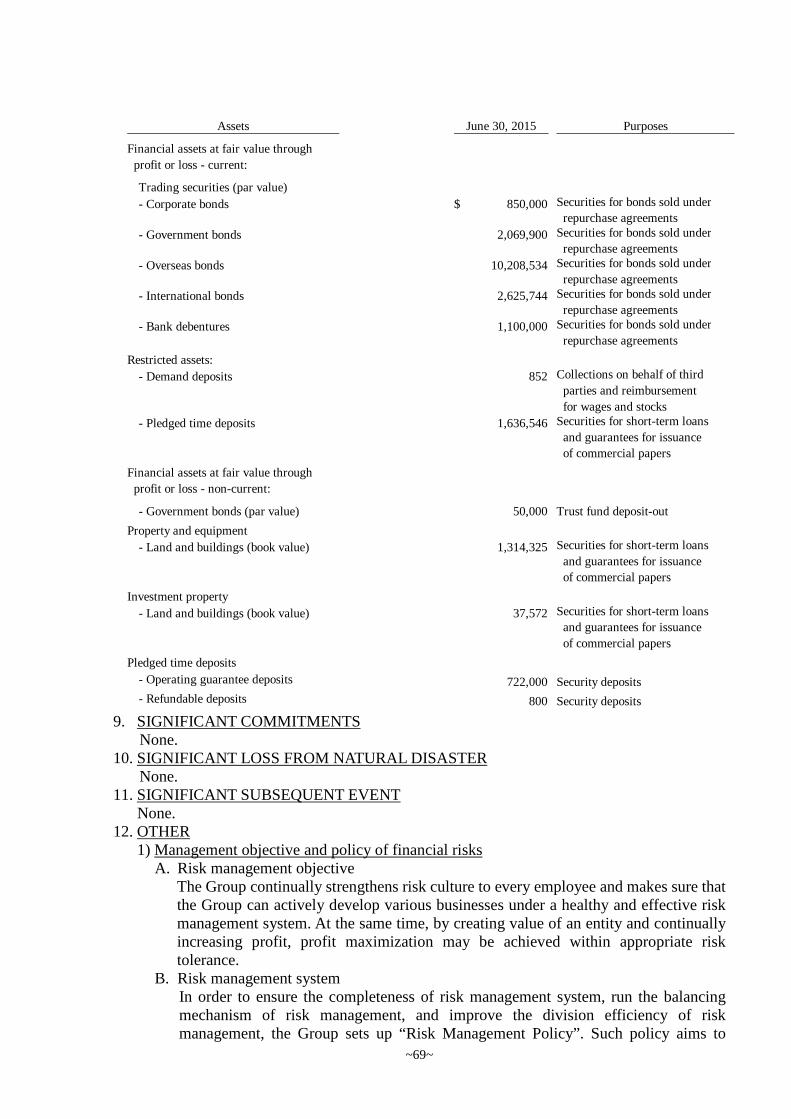
~69~
9. SIGNIFICANT COMMITMENTSNone.
10. SIGNIFICANT LOSS FROM NATURAL DISASTERNone.
11. SIGNIFICANT SUBSEQUENT EVENTNone.
12. OTHER1) Management objective and policy of financial risks
A. Risk management objectiveThe Group continually strengthens risk culture to every employee and makes sure thatthe Group can actively develop various businesses under a healthy and effective riskmanagement system. At the same time, by creating value of an entity and continuallyincreasing profit, profit maximization may be achieved within appropriate risktolerance.
B. Risk management systemIn order to ensure the completeness of risk management system, run the balancingmechanism of risk management, and improve the division efficiency of riskmanagement, the Group sets up “Risk Management Policy”. Such policy aims to
Assets June 30, 2015 Purposes
Trading securities (par value)
- Corporate bonds 850,000$ Securities for bonds sold under
repurchase agreements
- Government bonds 2,069,900 Securities for bonds sold under
repurchase agreements
- Overseas bonds 10,208,534 Securities for bonds sold under
repurchase agreements
- International bonds 2,625,744 Securities for bonds sold under
repurchase agreements
- Bank debentures 1,100,000 Securities for bonds sold under
repurchase agreements
Restricted assets:
- Demand deposits 852 Collections on behalf of third
parties and reimbursement
for wages and stocks
- Pledged time deposits 1,636,546 Securities for short-term loans
and guarantees for issuance
of commercial papers
- Government bonds (par value) 50,000 Trust fund deposit-out
Property and equipment
- Land and buildings (book value) 1,314,325 Securities for short-term loans
and guarantees for issuance
of commercial papers
Investment property
- Land and buildings (book value) 37,572 Securities for short-term loans
and guarantees for issuance
of commercial papers
Pledged time deposits
- Operating guarantee deposits 722,000 Security deposits
- Refundable deposits 800 Security deposits
Financial assets at fair value through
profit or loss - current:
Financial assets at fair value through
profit or loss - non-current:

~70~
establish internal system compliance and the guiding tools for policies communicationwithin the Group and enable every layer of the Group engaged in different tasks toidentify, evaluate, monitor, and control various risks with establishment of consistentcompliance rules for risks of each business so that the risks can be controlled withinthe limits set in advance.The Group’s risk management system covers risks incurred from businesses in and offthe balance sheet, such as market risk, credit risk, liquidity risk, operating risk, legalrisk, model risk which are all included in the risk management.
C. Risk management organizationRisk management organization: Board of Directors, Risk Management Committee,Risk Control Office, Business units and other related segments (such as Office ofAuditing, Office of General Manager, Compliance segment, Legal segment andFinance segment) are in charge of planning, supervising and execution.(A) The Board of Directors should ensure the effectiveness of risk management and
be responsible for the ultimate result and the following duties:a. To establish proper risk management system, operating process, and risk
management culture in the Group with allocation of necessary resource forbetter execution and operation.
b. Policy of risk management reviewc. Review and approval of business application, transaction authorization and risk
limit.(B) The Risk Management Committee reports to the Board of Directors and is
responsible for the following:a. Review risk management policyb. Review the highest risk tolerancec. Submit regular reports to the Board of Directors in relation to the risk
management status of the whole Group(C) The General Manager supervises daily risk management of the entire Group and
is responsible for the following:a. Supervise and monitor daily risk management of the entire Groupb. Approval of management exceptions
(D) Assets and Liabilities Committee reports to the General Manager and isresponsible for the following:a. Set up the ultimate guidelines for assets and liabilities management of the entire
Groupb. Analyze and control the entire Group’s assets and liabilities portfolioc. Approval of various businesses’ quotasd. Gather and analyze information on domestic and offshore interest rate,
exchange rate, prosperity fluctuation, political and economic environmentalchanges, and predict the financial trend in the future
(E) Risk Control Office implements risk management policy and related regulationsand reports to the Risk Management Committee. Risk Control Office also reportsdaily risk management to the General Manager and is responsible for thefollowing:a. Establish Risk Management Policy of the entire Groupb. Develop effective method for measurement and risk management in an entityc. Review risk management system of business unitsd. Generate risk report through information gathering and consolidatione. Analyze various business risks and report to the General Manager

~71~
f. Report the risk management situation to the Risk Management Committeeaccording to a meeting’s nature and needs
g. Carry out duties as designated by the Risk Management Committee and controlrisks of business units
(F) Auditing Office is responsible for the following:a. Execute operating risk controlb. Include the risk management system into internal audit program and carry out
the daily audit schedule.c. Assess the effectiveness of internal control and verify the executed result.
(G) Compliance segment and legal segment under the Office of General Manager areresponsible for the following:a. Compliance segment should make sure that the business operation and risk
management system are in compliance with relevant regulations.b. Legal segment is responsible for legal risk control
(H) Finance segment is responsible for the following:a. Verify the correctness of position information and reasonability of profit and
loss calculation.b. Control and analyze self-owned capital adequacy ratio.c. Analyze the appropriateness of structures of the assets and liabilities.
(I) Business units are responsible for the following:a. Set up risk management details of various businesses according to the risk
management policy and other related regulations.b. Provide sufficient position information and risk control information to the Risk
Control Office.
D. Risk management policy
In order to ensure the completeness of risk management system, run the balancingmechanism of risk management, and improve the division efficiency of riskmanagement, the Group sets up “Risk Management Policy”. Such policy aims toestablish internal system compliance and the guiding tools for policiescommunication within the Group and enable every layer of the Group engaged indifferent tasks to identify, evaluate, monitor, and control various risks withestablishment of consistent compliance rules for risks of each business so that therisks can be controlled within the limits set in advance.Risk management processes include risk identification, risk evaluation, risksupervision and various risk control. Each kind of risk evaluations and respondingstrategies are described as follows:(A)Market risk management
The Group has implemented risk management information system (Risk Manager)in relation to market risk control. All trading positions of the Group have beenincluded in the daily risk control system for the calculation of Value at Risk (VaR).Limit exceeding indicators are mainly the nominal principal, stop-loss, sensitivity(Greeks) and VaR. The risk management report is presented on a daily basis forimplementation of regular control and limit exceeding handling procedures.
(B)Credit risk managementIn relation to risk control, the quantitative model of default rate adopts KMVmodel to calculate the default rate of issuers with credit exposure of the issuingcompany and the trading counterparties, and credit risk of securities disclosed inthe report. The credit exposure is mitigated through regular review of creditstatus.

~72~
(C)Fund liquidity riskUnit in charge of fund procurement regularly predicts future fund demand andsupply, and consolidates company guarantee or endorsement and capital lendingbusinesses to monitor the condition of fund procurement on a daily basis.
E. Hedging and risk-offsetting strategy
(A) Policies of hedging and risk mitigating are parts of the Group’s risk managementpolicies, and the hedging position and hedged trading position are supposed to beone portfolio, of which the gain and loss and risk information are measured on aconsolidated basis.
(B) The overall position (hedging position and trading position) is included in thedaily risk management system to calculate Value at Risk and other relevantinformation. Limit exceeding indicators mainly include nominal principal, stop-loss point, price sensitivity and VaR. With the presentation of daily riskmanagement report, routine control and limit exceeding treatment can beexecuted.
(C) The continued effectiveness of hedging and risk-offsetting strategy is measuredby the gain and loss of overall position (hedging position and trading position),in order to track reasonableness of the profit or loss of hedging position and theoffsetting relationship with the profit or loss of trading position, and to controlthem within a reasonable range.
2) Credit riskA. Source and definition of credit risk
The credit risk exposure of the Group as a result of engagement in financialtransactions include issuer’s credit risk, credit risk of counterparty and credit risk ofunderlying assets:(A) Credit risk of the issuer refers to the issuers of financial debt instruments held by
the Group failing to repay its obligation due to the fact that the issuer breaches thecontract resulting in the risk of financial loss to the Group.
(B) Credit risk of counterparty refers to risk of financial loss to the Group arising fromdefault by the counterparty of financial instruments on the settlement or paymentobligation.
(C) Credit risk of the underlying assets happens when the credit rating of theunderlying assets linked to the financial instrument is downgraded by the ratingagency or when the losses occur as a result of contract default.
The financial assets held by the Group which could result in credit risk include bankdeposit, debt securities, derivatives transactions in OTC, bonds purchased/sold underresale/repurchase agreements, refundable deposit of securities lending, futures trademargins, other refundable deposits and receivables.
B. Maximum credit risk exposure and credit risk concentrationThe maximum exposure to credit risk of financial assets in the consolidated balancesheet, without consideration of the collateral or other credit enhancements, isequivalent to the carrying amount. In Taiwan, the sources of credit risk of the Groupare primarily resulting from cash deposited with banks or other financial institutions,debt securities issued or guaranteed by a bank, derivative instruments transactionunderwritten by the Group, and all counterparties of customer margin depositsaccounts being financial institutions. Credit risks of various financial assets are asfollows:(A)Cash and cash equivalents
Cash and cash equivalents include time deposit, demand deposits and checkingdeposits. Correspondent institutions are mainly domestic financial institutions.

~73~
(B)Financial assets at fair value through profit and loss -currenta. Fund
The funds held by the Group are bond funds. As the positions held are notsignificant, credit risk is deemed low.
b. Debt securitiesDebt securities are mainly positions like government bonds, convertiblecorporate bonds and foreign bonds and the issuers are primarily R.O.C.government, domestic and foreign legal entities. 55% of convertible corporatebond is guaranteed by banks. Details are as follows:(a)Bonds
The bonds held by the Group are mostly government bonds (inclusive ofcentral and local government). As a whole, the credit risk of the bonds heldby the Group is low.
(b)Convertible corporate bondThe convertible corporate bonds held by the Group are mostly issued by thedomestic legal entities. The Group mitigates highly risky credit exposure ofthe issuers by control through Taiwan Corporate Credit Risk Index (TCRI).
(c)Foreign bondsThe foreign bonds held by the Group are mainly underlying investment withgood credit rating and those with rating above (S&P BB).
(C)Available-for-sale financial assets-currentThe foreign bonds held by the Group are mainly underlying investment with goodcredit rating and those with rating above (S&P BB).
(D)Derivatives- futures trade marginWhen engaging in futures trades in stock exchange market, the Group needs todeposit margin into a margin deposit account of a financial institution designatedby the futures merchants as a guarantee to fulfil contractual obligation in the future.As a result, the credit risk is low.
(E)Derivatives-OTCThe Group signs International Swaps and Derivatives Association (ISDA)agreements with each counterparty when engaging in OTC derivatives as anagreement regarding such transactions for both parties. In the agreement, itprovides a fundamental contractual model for OTC derivative transactions. If anyparty breaches the contract or terminates the transactions early, then all the openinterest covered in the agreement should be settled by net amount as bound in thecontract. When the ISDA agreement is signed, the Credit Support Annex (CSA) isalso signed. According to the CSA, collateral will be transferred from a party to theother during transaction process to mitigate the risk of counterparty in open interest.Please refer to Note 6(11).Types of OTC derivative transactions in which the Group is engaged includeinterest rate swap and swap transaction. The counterparties are all from financialservice industry and mainly located in Taiwan.
(F)Bonds investment under a resale agreementBonds sold under a resale agreement are the bonds that the client sold to the Groupat a price, interest rate, length of period as agreed by two parties and the client shallrepurchase the bonds at the specified price upon maturity. The Group needs toassume credit risk from counterparties when underwriting such business, as thepayment being delivered to the other party. With consideration of good collateralobtained, the net of credit risk exposure from counterparties can be effectivelyreduced. As all the counterparties are financial institutions with good credit rating,
~74~
the credit risks from counterparties are extremely low. Please refer to Note 6(11).(G)Margin loans receivable
Margin loans receivable are the loans provided to the client in order to processbusinesses of margin trading and short sale using the securities purchased throughfinancing as collateral. The Group monitors the clients’ margin ratio throughinformation system on a daily basis. As the margin ratio of margin trading is set at130% according to Regulations Governing the Conduct of Securities TradingMargin Purchase and Short Sale Operations by Securities Firms, the credit risk isextremely low.
(H)Guaranteed price for securities lendingGuaranteed price for securities lending is the sale price of the Group’s securitiessold by other securities firms through margin trading after deduction of securitiestransactions tax and service fee, which is deposited in other securities firms ascollateral. As all the counterparties are financial institutions with good credit rating,the credit risk from counterparties is extremely low.
(I)Refundable deposits for securities lendingRefundable deposits for securities lending are the margins deposited in othersecurities firm as collateral when the Group’s securities are sold. As all thecounterparties are financial institutions with good credit, the credit risk fromcounterparties is extremely low.
(J)ReceivablesReceivables are the credit rights arising from the securities business includingsettlement receivables of consignment trading, settlement receivables of operatingsecurities sold, financing interest receivables of self-operating credit transaction,receivables of consignment trading for securities, and receivables from banks’underwriting on foreign exchange transactions and foreign fund demand. As themajority of the Group’s receivables from the consignment businesses and self-operating businesses are settlement of securities from OCT or TWSE, the credit riskis extremely low. As the foreign exchange transactions are simply the receipt orpayment of different currencies and the correspondent banks are of good creditrating, the credit risk is extremely low.
(K)Other current assetsOther current assets are mainly the collateral deposited in the bank for applicationfor short-term debt limit and guarantee for application for issuance of commercialpapers. As the correspondent banks are all financial institutions with good creditrating, the credit risk is extremely low.
(L)Financial assets at fair value through profit and loss – non-currentIn order to underwrite trust business, the Group deposits central government bondsin the Central Bank as collateral. Regardless of the bonds themselves or thefinancial institutions where the bonds deposited, the credit risk is extremely low.
(M)Other non-current assetsOther non-current assets mainly comprise operating guarantee deposits, settlementfunds, and refundable deposits. Operating guarantee deposits are mainly depositedin domestic banks with good credit rating. Settlement funds are deposited insecurities exchange. Settlement funds are used as compensation when a party to amarketable securities transaction fails to fulfil the settlement obligation. The creditrisks from the institutions where these two assets are deposited are extremely low.The refundable deposits refer to cash or other assets which are deposited externallyby the Group and can be used as refundable deposits. Because deposits are placedin various financial institutions and each deposit amount is small, the credit risk is

~75~
dispersed and the credit exposure of overall refundable deposit is extremely low.C. Credit quality rating
The Group’s internal credit rating can be categorized into low risk, medium risk andhigh risk. Definition of each rating is as follows:(A) Low risk: a company or the underlying position is capable of fulfilling the
financial commitment to a stable extent even when facing with a significantuncertain factor or being exposed to adverse condition.
(B) Medium risk: a company or the underlying position’s capability to fulfil thefinancial commitment is weak. Any adverse operation, financial or economicmovement shall further weaken its ability to fulfil the financial commitment.
(C) High risk: a company or the underlying position’s capability to fulfil the financialcommitment is uncertain. The capability to fulfil the financial commitment shallbe determined by whether the operating environment and financial position arefavorable.
(D) Impairment: a company or the underlying position fails to fulfil its obligation andthe potential impairment assessed has reached the standard for recognition.
The Group uses internal and external credit rating as specified in below table. In thetable below, above-mentioned two credit ratings are not directly correlated. They aremainly used to represent the similarity of credit quality. The internal credit rating isbased on credit rating of Taiwan Ratings and TCRI. Default rate of certain foreignbonds is calculated using bond pricing method. The credit risk classification andmanagement are based on historical default rate (1 year).
The Group has classified financial assets into three categories based on the creditquality including normal asset, assets overdue but not impaired and impaired assets:
Internal credit Credit rating of Credit rating of Historical default
rating Taiwan Ratings TCRI rate (1 year)
Low risk twAAA ~twBBB- 1~4 0.03%~1.21%
Medium risk twBB+ ~ twBB 5~6 1.21%~5.10%
High risk twBB- ~ twC 7~9 5.10%~26.85%
Impairment D D -
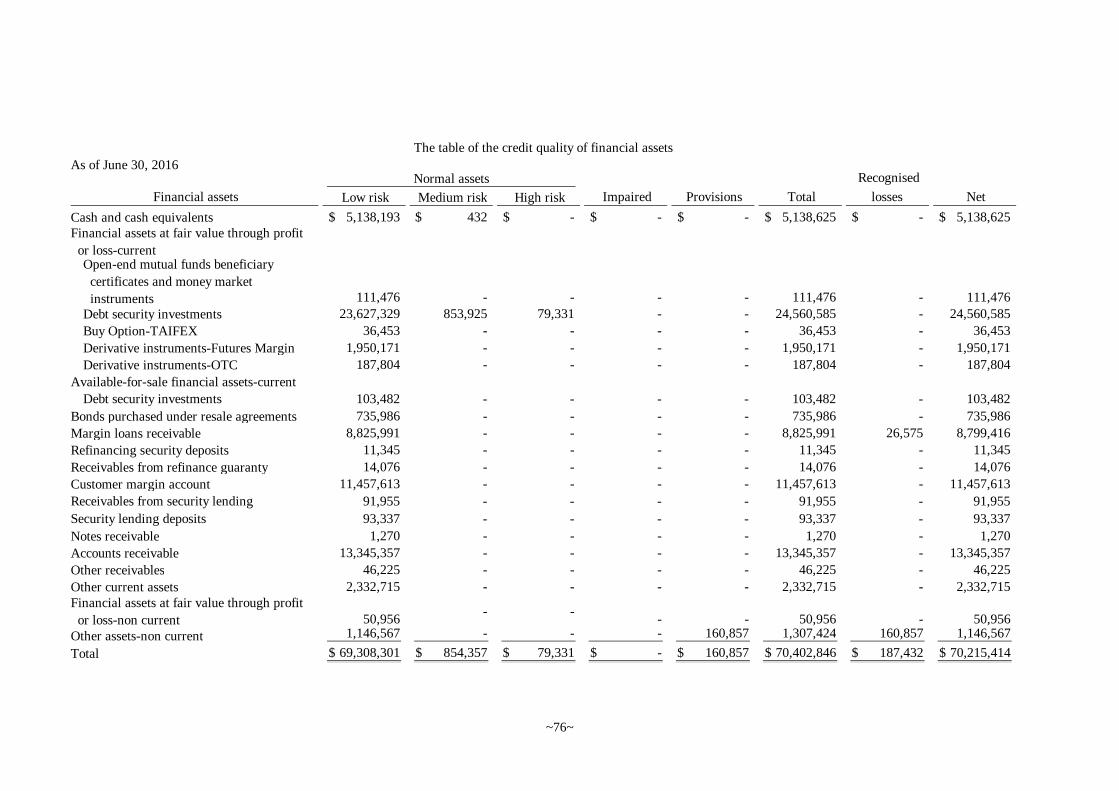
~76~
As of June 30, 2016
Low risk Medium risk High risk
Cash and cash equivalents 5,138,193$ 432$ -$ -$ -$ 5,138,625$ -$ 5,138,625$Financial assets at fair value through profit
or loss-currentOpen-end mutual funds beneficiary
certificates and money market
instruments 111,476 - - - - 111,476 - 111,476
Debt security investments 23,627,329 853,925 79,331 - - 24,560,585 - 24,560,585
Buy Option-TAIFEX 36,453 - - - - 36,453 - 36,453
Derivative instruments-Futures Margin 1,950,171 - - - - 1,950,171 - 1,950,171
Derivative instruments-OTC 187,804 - - - - 187,804 - 187,804
Available-for-sale financial assets-current
Debt security investments 103,482 - - - - 103,482 - 103,482
Bonds purchased under resale agreements 735,986 - - - - 735,986 - 735,986
Margin loans receivable 8,825,991 - - - - 8,825,991 26,575 8,799,416
Refinancing security deposits 11,345 - - - - 11,345 - 11,345
Receivables from refinance guaranty 14,076 - - - - 14,076 - 14,076
Customer margin account 11,457,613 - - - - 11,457,613 - 11,457,613
Receivables from security lending 91,955 - - - - 91,955 - 91,955
Security lending deposits 93,337 - - - - 93,337 - 93,337
Notes receivable 1,270 - - - - 1,270 - 1,270
Accounts receivable 13,345,357 - - - - 13,345,357 - 13,345,357
Other receivables 46,225 - - - - 46,225 - 46,225
Other current assets 2,332,715 - - - - 2,332,715 - 2,332,715Financial assets at fair value through profit
or loss-non current 50,956- -
- - 50,956 - 50,956
Other assets-non current 1,146,567 - - - 160,857 1,307,424 160,857 1,146,567
Total 69,308,301$ 854,357$ 79,331$ -$ 160,857$ 70,402,846$ 187,432$ 70,215,414$
The table of the credit quality of financial assets
Financial assets
Normal assets
Impaired Provisions Total
Recognised
losses Net

~77~
As of December 31, 2015
Low risk Medium risk High risk
Cash and cash equivalents 5,115,225$ 392$ -$ -$ -$ 5,115,617$ -$ 5,115,617$
Financial assets at fair value through profit
or loss-currentOpen-end mutual funds beneficiary
certificates and money market
instruments 210,502 - - - - 210,502 - 210,502
Debt security investments 21,537,341 676,374 62,395 - - 22,276,110 - 22,276,110
Buy Option-TAIFEX 33,288 - - - - 33,288 - 33,288
Derivative instruments-Futures Margin 1,860,069 - - - - 1,860,069 - 1,860,069
Derivative instruments-OTC 207,563 - - - - 207,563 - 207,563
Available-for-sale financial assets-current
Debt security investments 102,191 - - - - 102,191 - 102,191
Bonds purchased under resale agreements 770,353 - - - - 770,353 - 770,353
Margin loans receivable 10,439,247 - - - - 10,439,247 4,666 10,434,581
Refinancing security deposits 2,159 - - - - 2,159 - 2,159
Receivables from refinance guaranty 4,135 - - - - 4,135 - 4,135
Customer margin account 7,686,554 - - - - 7,686,554 - 7,686,554
Receivables from security lending 74,345 - - - - 74,345 - 74,345
Security lending deposits 75,703 - - - - 75,703 - 75,703
Notes receivable 3,142 - - - - 3,142 - 3,142
Accounts receivable 5,517,496 - - - - 5,517,496 - 5,517,496
Other receivables 1,530,833 - - - - 1,530,833 - 1,530,833
Other current assets 3,551,317 - - - - 3,551,317 - 3,551,317Financial assets at fair value through profit
or loss-non current 50,980 - - - - 50,980 - 50,980
Other assets-non current 1,221,955 - - - 166,572 1,388,527 166,572 1,221,955
Total 59,994,398$ 676,766$ 62,395$ -$ 166,572$ 60,900,131$ 171,238$ 60,728,893$
The table of the credit quality of financial assets
Financial assets
Normal assets
Impaired Provisions Total
Recognised
losses Net
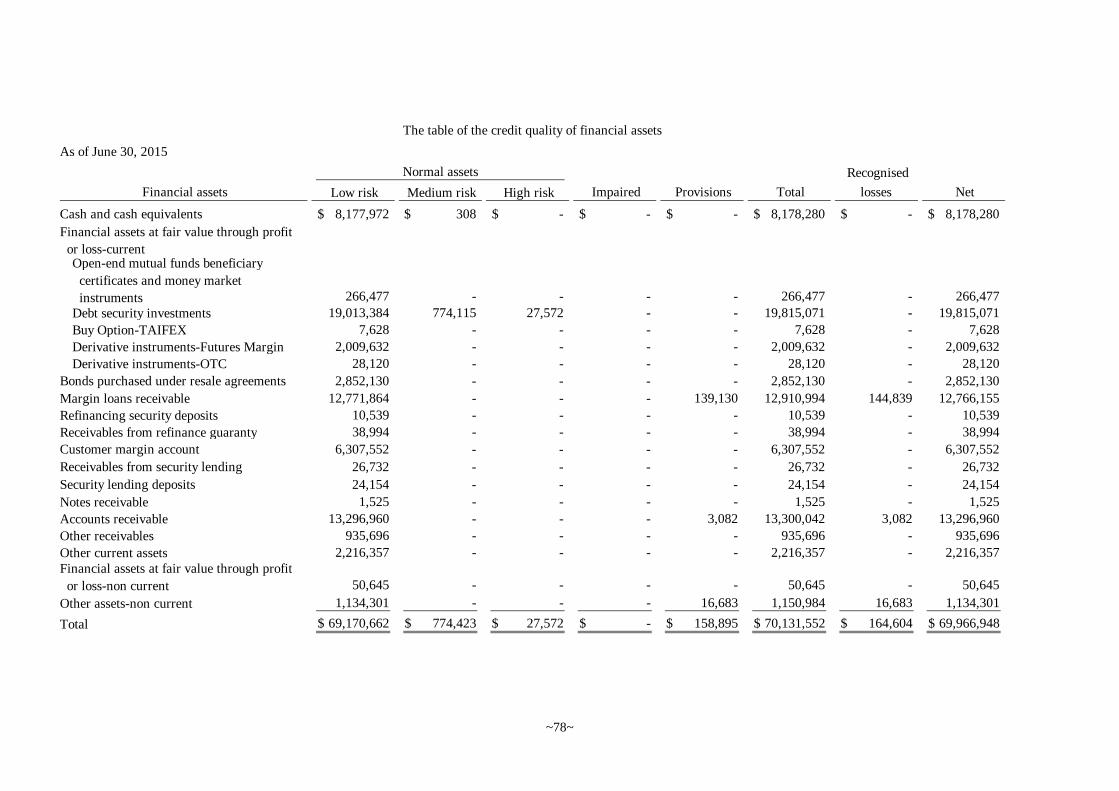
~78~
As of June 30, 2015
Low risk Medium risk High risk
Cash and cash equivalents 8,177,972$ 308$ -$ -$ -$ 8,178,280$ -$ 8,178,280$
Financial assets at fair value through profit
or loss-currentOpen-end mutual funds beneficiary
certificates and money market
instruments 266,477 - - - - 266,477 - 266,477
Debt security investments 19,013,384 774,115 27,572 - - 19,815,071 - 19,815,071
Buy Option-TAIFEX 7,628 - - - - 7,628 - 7,628
Derivative instruments-Futures Margin 2,009,632 - - - - 2,009,632 - 2,009,632
Derivative instruments-OTC 28,120 - - - - 28,120 - 28,120
Bonds purchased under resale agreements 2,852,130 - - - - 2,852,130 - 2,852,130
Margin loans receivable 12,771,864 - - - 139,130 12,910,994 144,839 12,766,155
Refinancing security deposits 10,539 - - - - 10,539 - 10,539
Receivables from refinance guaranty 38,994 - - - - 38,994 - 38,994
Customer margin account 6,307,552 - - - - 6,307,552 - 6,307,552
Receivables from security lending 26,732 - - - - 26,732 - 26,732
Security lending deposits 24,154 - - - - 24,154 - 24,154
Notes receivable 1,525 - - - - 1,525 - 1,525
Accounts receivable 13,296,960 - - - 3,082 13,300,042 3,082 13,296,960
Other receivables 935,696 - - - - 935,696 - 935,696
Other current assets 2,216,357 - - - - 2,216,357 - 2,216,357Financial assets at fair value through profit
or loss-non current 50,645 - - - - 50,645 - 50,645
Other assets-non current 1,134,301 - - - 16,683 1,150,984 16,683 1,134,301
Total 69,170,662$ 774,423$ 27,572$ -$ 158,895$ 70,131,552$ 164,604$ 69,966,948$
The table of the credit quality of financial assets
Financial assets
Normal assets
Impaired Provisions Total
Recognised
losses Net

~79~
3) Liquidity riskA. Definition and source of liquidity risk
Liquidity risk refers to possible financial losses arising from the inability to realizethe asset or to obtain sufficient fund to fulfil the financial liabilities soon to be matured.Above situations may weaken the sources of cash from the Group’s trading andinvestment activities.
B. Liquidity risk management procedure and stimulation testIn order to prevent operational crisis as a result of liquidity risk, the Group hasestablished responding crisis process with regular monitoring over liquidity gap offund.(A) Procedure
In addition to the operating capital for various business and long-term investment,the Group needs to maintain revolving funds at a certain level for daily operation.The use of remaining fund shall avoid high concentration and should be basedon the principle of holding sound earning assets with high liquidity and treatedin compliance with policies of the Group.The responsive unit for fund procurement adjusts the liquidity gap to ensureproper liquidity according to the daily volume and movement in the market.
(B) Stimulation testa. The Group reviews fund liquidity risk from a perspective of supply and
demand of fund every month with simulation analysis of available fund foremergency including scenario analysis of cash, funding limit of financialinstitutions, margin loans and short sale, and value of disposal of position inorder to compute maximum available fund and fund demand. Finally, safetystock of fund is reviewed to monitor liquidity risk.
b. Above liquidity risk is generally reviewed monthly. However, if the availablelimit of increment banking credit risk in financing limit of a financialinstitution is lower than a certain amount (that is, the amount may be timelyadjusted according to the fund liquidity in the market and the actual funddemand and supply in an entity), the safety stock will be reviewed weekly.After the early warning report for fund is submitted, the head of financesegment will call for a fund control meeting.
c. Other than individual funding liquidity risk of an entity, stress test ofminimization funding supply and maximization funding demand in the eventof significant crisis is simulated, including:(a)When there is a significant crisis in the market, the financing limit of the
financial institutions and the value of disposal of position can be deemedthe minimized ratio of fund supply which is then adjusted according toactual condition to compute the total fund supply under maximum stress.
(b)Except for the operating expense, the stock concept is adopted for thecalculation of total fund demand under maximum stress.
(c)The Group should conduct a review to see whether the total minimizedfund supply is more than maximized total fund demand. The Group shouldfurther review how long (by month) the difference may cover the operatingexpenses so that the safety stock of fund (by month) under stress test canbe computed.
(d)The minimum safety stock of fund under stress test (by month) may beadjusted according to the crisis itself and only operating expense for at least6 months under a normal stimulation can be deemed safe.

~80~
C. Maturity analysis for the financial assets and financial liabilities held for liquidity riskmanagement(A)The Group holds cash and sound earning assets with high liquidity in order to
fulfil the payment obligation and potential emergency fund demand in the market.Financial assets held for liquidity risk management are mainly cash and cashequivalents, among which, all time deposits mature within a year. Financial assetsat fair value through profit and loss are mainly listed stocks, convertible bondsand debt securities. As all of them have positions in active market, the liquidityrisk is deemed low.
(B) Maturity analysis for the financial liabilities is as follows:(Blank below)
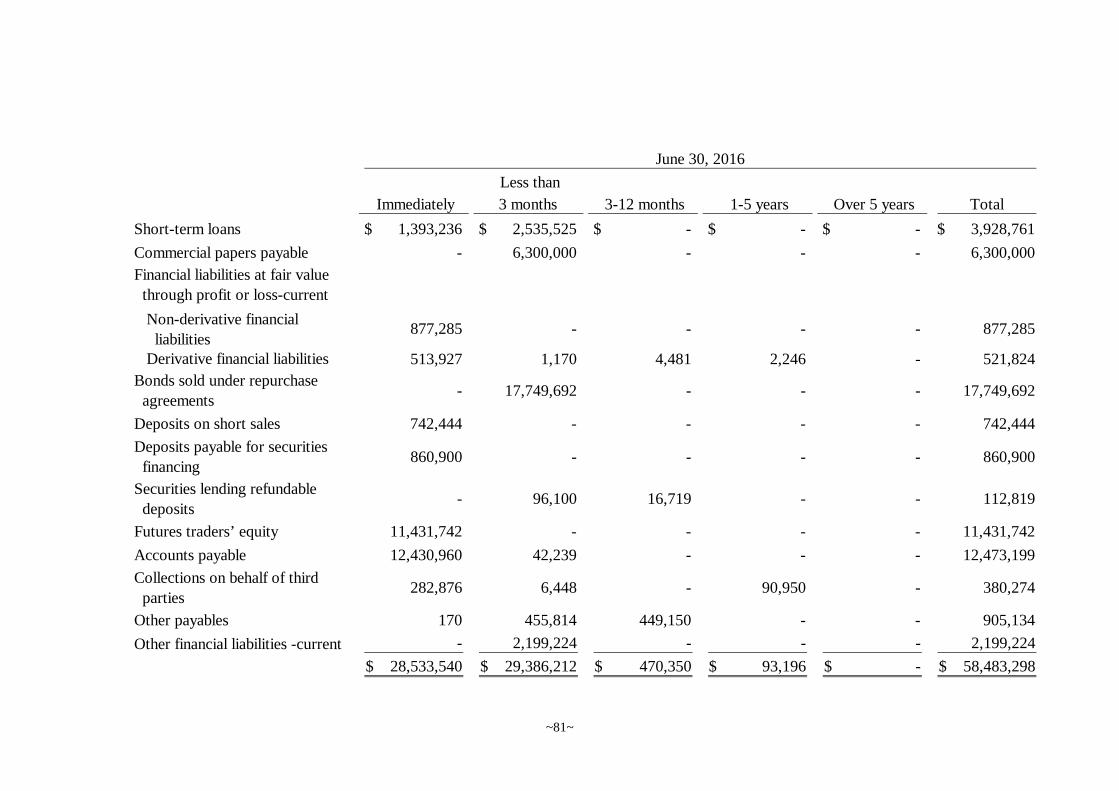
~81~
Immediately
Less than
3 months 3-12 months 1-5 years Over 5 years Total
Short-term loans 1,393,236$ 2,535,525$ -$ -$ -$ 3,928,761$
Commercial papers payable - 6,300,000 - - - 6,300,000
Non-derivative financial
liabilities877,285 - - - - 877,285
Derivative financial liabilities 513,927 1,170 4,481 2,246 - 521,824
Bonds sold under repurchase
agreements- 17,749,692 - - - 17,749,692
Deposits on short sales 742,444 - - - - 742,444
Deposits payable for securities
financing860,900 - - - - 860,900
Securities lending refundable
deposits- 96,100 16,719 - - 112,819
Futures traders’ equity 11,431,742 - - - - 11,431,742
Accounts payable 12,430,960 42,239 - - - 12,473,199
Collections on behalf of third
parties282,876 6,448 - 90,950 - 380,274
Other payables 170 455,814 449,150 - - 905,134
Other financial liabilities -current - 2,199,224 - - - 2,199,224
28,533,540$ 29,386,212$ 470,350$ 93,196$ -$ 58,483,298$
June 30, 2016
Financial liabilities at fair value
through profit or loss-current
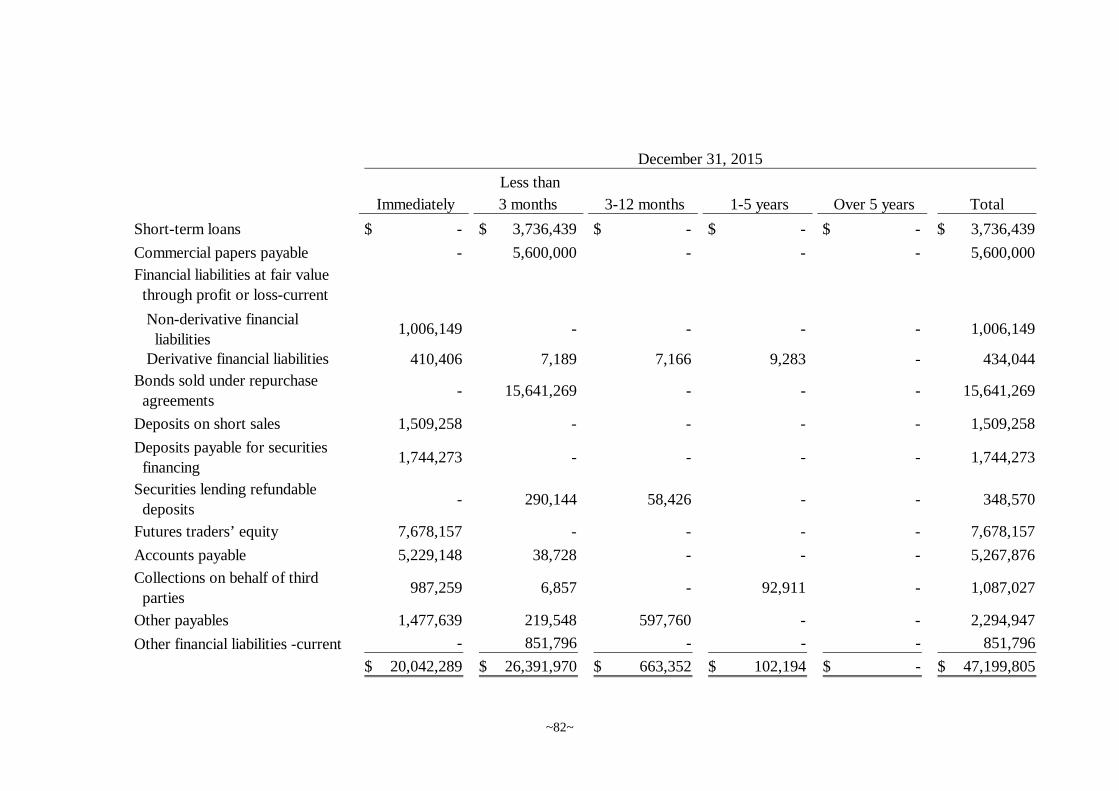
~82~
Immediately
Less than
3 months 3-12 months 1-5 years Over 5 years Total
Short-term loans -$ 3,736,439$ -$ -$ -$ 3,736,439$
Commercial papers payable - 5,600,000 - - - 5,600,000
Non-derivative financial
liabilities1,006,149 - - - - 1,006,149
Derivative financial liabilities 410,406 7,189 7,166 9,283 - 434,044
Bonds sold under repurchase
agreements- 15,641,269 - - - 15,641,269
Deposits on short sales 1,509,258 - - - - 1,509,258
Deposits payable for securities
financing1,744,273 - - - - 1,744,273
Securities lending refundable
deposits- 290,144 58,426 - - 348,570
Futures traders’ equity 7,678,157 - - - - 7,678,157
Accounts payable 5,229,148 38,728 - - - 5,267,876
Collections on behalf of third
parties987,259 6,857 - 92,911 - 1,087,027
Other payables 1,477,639 219,548 597,760 - - 2,294,947
Other financial liabilities -current - 851,796 - - - 851,796
20,042,289$ 26,391,970$ 663,352$ 102,194$ -$ 47,199,805$
December 31, 2015
Financial liabilities at fair value
through profit or loss-current

~83~
Immediately
Less than
3 months 3-12 months 1-5 years Over 5 years Total
Short-term loans 2,190,302$ 7,904,148$ -$ -$ -$ 10,094,450$
Commercial papers payable 2,400,000 2,100,000 - - - 4,500,000
Non-derivative financial
liabilities3,179,775 - - - - 3,179,775
Derivative financial liabilities 766,763 1,473 26,360 10,793 - 805,389
Bonds sold under repurchase
agreements- 16,283,300 - - - 16,283,300
Deposits on short sales 866,187 - - - - 866,187
Deposits payable for securities
financing1,070,705 - - - - 1,070,705
Securities lending refundable
deposits- 46,686 - - - 46,686
Futures traders’ equity 6,280,790 - - - - 6,280,790
Accounts payable 9,864,941 46,089 - - - 9,911,030
Collections on behalf of third
parties229,797 7,442 - 93,983 - 331,222
Other payables 856,360 1,281,540 577,064 - - 2,714,964
Other financial liabilities -current - 219,190 - - - 219,190
27,705,620$ 27,889,868$ 603,424$ 104,776$ -$ 56,303,688$
June 30, 2015
Financial liabilities at fair value
through profit or loss-current

~84~
(C) Maturity analysis for lease contracts and capital expendituresOperating lease commitment is the total minimum lease payments that the Groupshould make as a lessee or minimum lease income as lessor under an operating leaseterm which is not cancelable. The capital expenditure commitment is the contractcommitment signed for acquisition of capital expenditure of construction andequipment.The following table illustrates maturity analysis for lease contract and capitalexpenditure commitment of the Group:
4) Market riskA. Definition of market risk
Market risk refers to the risk of decrease in the Group’s revenue or value of investmentportfolio as a result of the changes in exchange rate, commodity price, interest rate,and stock price or other market risk factors.The Group continually exercises risk management tools such as sensitivity analysis,Value at Risk, stress test and so on to completely and effectively measure, monitorand manage market risk.
B. Value at Risk (VaR)Value at Risk is used to measure the possible maximum potential losses in investmentportfolio as a result of movement in market risk factor in a specified period andconfidence level. The Group currently uses confidence level of 95% to calculate Valueat Risk of one day.A VaR model must reasonably, completely and accurately measure the maximumpotential risks of financial instruments or investment portfolio before being adoptedas a risk management model by the Group. The VaR model used in risk management
June 30, 2016
Operating leases
expenditures (Lessee)
Operating leases
income (Lessor)
Not later than one year 101,535$ 14,385$Later than one year but not
later than five years 174,867 15,426
Over five years 7,174 -
Total 283,576$ 29,811$
December 31, 2015
Operating leases
expenditures (Lessee)
Operating leases
income (Lessor)
Not later than one year 89,497$ 7,025$Later than one year but not
later than five years 125,106 3,541
Over five years 6,720 -
Total 221,323$ 10,566$
June 30, 2015
Operating leases
expenditures (Lessee)
Operating leases
income (Lessor)
Not later than one year 100,914$ 14,031$Later than one year but not
later than five years 163,586 916
Over five years 8,436 -
Total 272,936$ 14,947$

~85~
is continually certified and retrospectively tested to demonstrate that the model canreasonably and effectively measure the maximum potential risks of financialinstruments or investment portfolios.
C. Information on gap of foreign exchange riskThe following table summarizes financial instruments of foreign assets or liabilities bycurrency and the foreign exchange exposure presented by book value as of June 30, 2016,December 31, 2015, and June 30, 2015:
Six months ended
June 30, 2016 Amount
Six months ended
June 30, 2015 Amount
June 30, 2016 74,121$ June 30, 2015 73,461$
VaR Maximum 129,399 VaR Maximum 161,498
VaR Average 83,999 VaR Average 88,020
VaR Minimum 37,793 VaR Minimum 46,803
Statistical table
for one-day VaR of transactions
Statistical table
for one-day VaR of transactions
Six months ended
June 30, 2016 Foreign exchange Interest Share ownership
June 30, 2016 12,359$ 68,406$ 84,382$
VaR Maximum 58,276 75,637 128,256
VaR Average 20,438 36,140 75,646
VaR Minimum 8,504 22,130 24,266
Statistical table for VaR of various risk indicators of transactions
Six months ended
June 30, 2015 Foreign exchange Interest Share ownership
June 30, 2015 16,920$ 22,671$ 81,507$
VaR Maximum 31,630 58,129 166,019
VaR Average 13,171 34,491 81,423
VaR Minimum 3,691 17,989 41,131
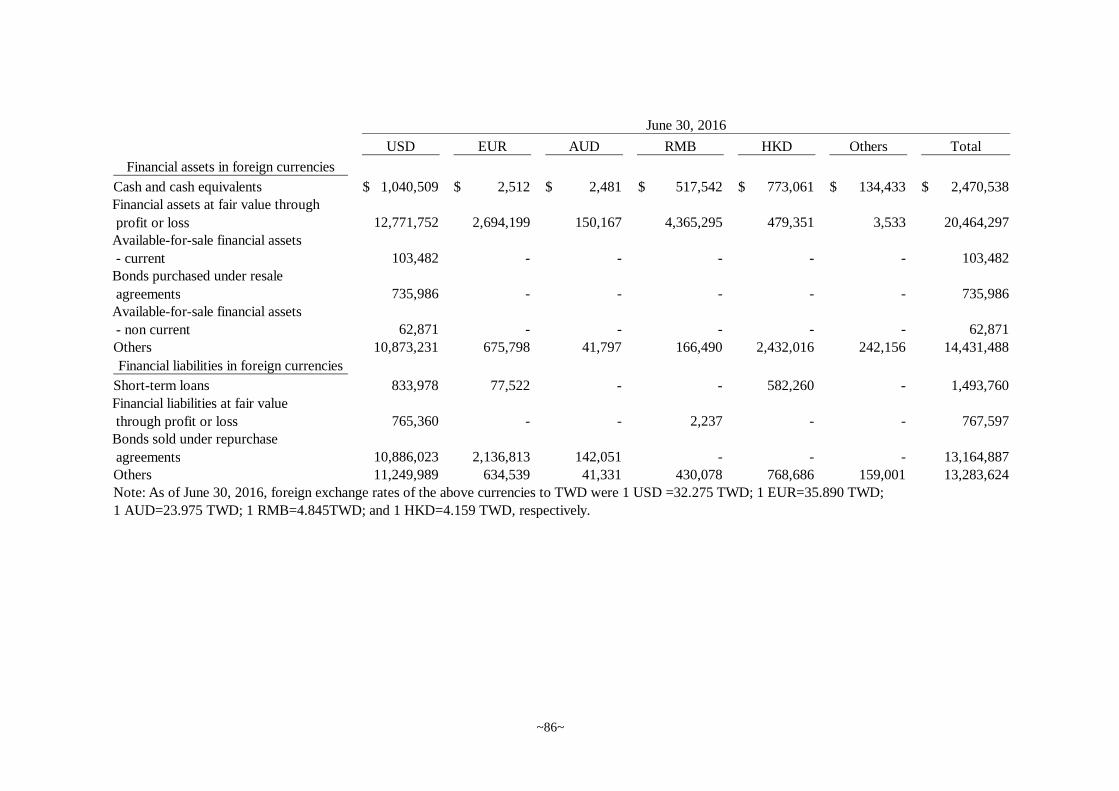
~86~
USD EUR AUD RMB HKD Others Total
Financial assets in foreign currencies
Cash and cash equivalents 1,040,509$ 2,512$ 2,481$ 517,542$ 773,061$ 134,433$ 2,470,538$Financial assets at fair value through
profit or loss 12,771,752 2,694,199 150,167 4,365,295 479,351 3,533 20,464,297Available-for-sale financial assets
- current 103,482 - - - - - 103,482Bonds purchased under resale
agreements 735,986 - - - - - 735,986Available-for-sale financial assets
- non current 62,871 - - - - - 62,871Others 10,873,231 675,798 41,797 166,490 2,432,016 242,156 14,431,488
Financial liabilities in foreign currencies
Short-term loans 833,978 77,522 - - 582,260 - 1,493,760Financial liabilities at fair value
through profit or loss 765,360 - - 2,237 - - 767,597Bonds sold under repurchase
agreements 10,886,023 2,136,813 142,051 - - - 13,164,887Others 11,249,989 634,539 41,331 430,078 768,686 159,001 13,283,624Note: As of June 30, 2016, foreign exchange rates of the above currencies to TWD were 1 USD =32.275 TWD; 1 EUR=35.890 TWD;1 AUD=23.975 TWD; 1 RMB=4.845TWD; and 1 HKD=4.159 TWD, respectively.
June 30, 2016
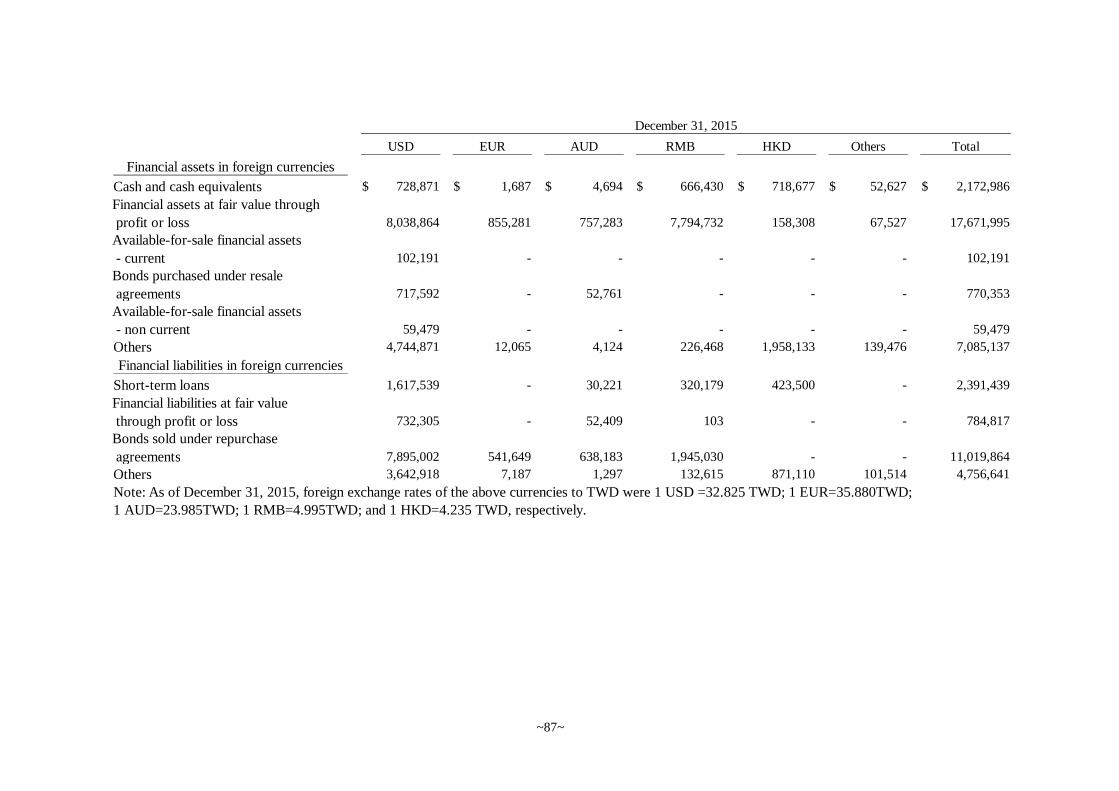
~87~
USD EUR AUD RMB HKD Others Total
Financial assets in foreign currencies
Cash and cash equivalents 728,871$ 1,687$ 4,694$ 666,430$ 718,677$ 52,627$ 2,172,986$
Financial assets at fair value through
profit or loss 8,038,864 855,281 757,283 7,794,732 158,308 67,527 17,671,995
Available-for-sale financial assets
- current 102,191 - - - - - 102,191
Bonds purchased under resale
agreements 717,592 - 52,761 - - - 770,353
Available-for-sale financial assets
- non current 59,479 - - - - - 59,479
Others 4,744,871 12,065 4,124 226,468 1,958,133 139,476 7,085,137
Financial liabilities in foreign currencies
Short-term loans 1,617,539 - 30,221 320,179 423,500 - 2,391,439
Financial liabilities at fair value
through profit or loss 732,305 - 52,409 103 - - 784,817
Bonds sold under repurchase
agreements 7,895,002 541,649 638,183 1,945,030 - - 11,019,864
Others 3,642,918 7,187 1,297 132,615 871,110 101,514 4,756,641
Note: As of December 31, 2015, foreign exchange rates of the above currencies to TWD were 1 USD =32.825 TWD; 1 EUR=35.880TWD;1 AUD=23.985TWD; 1 RMB=4.995TWD; and 1 HKD=4.235 TWD, respectively.
December 31, 2015
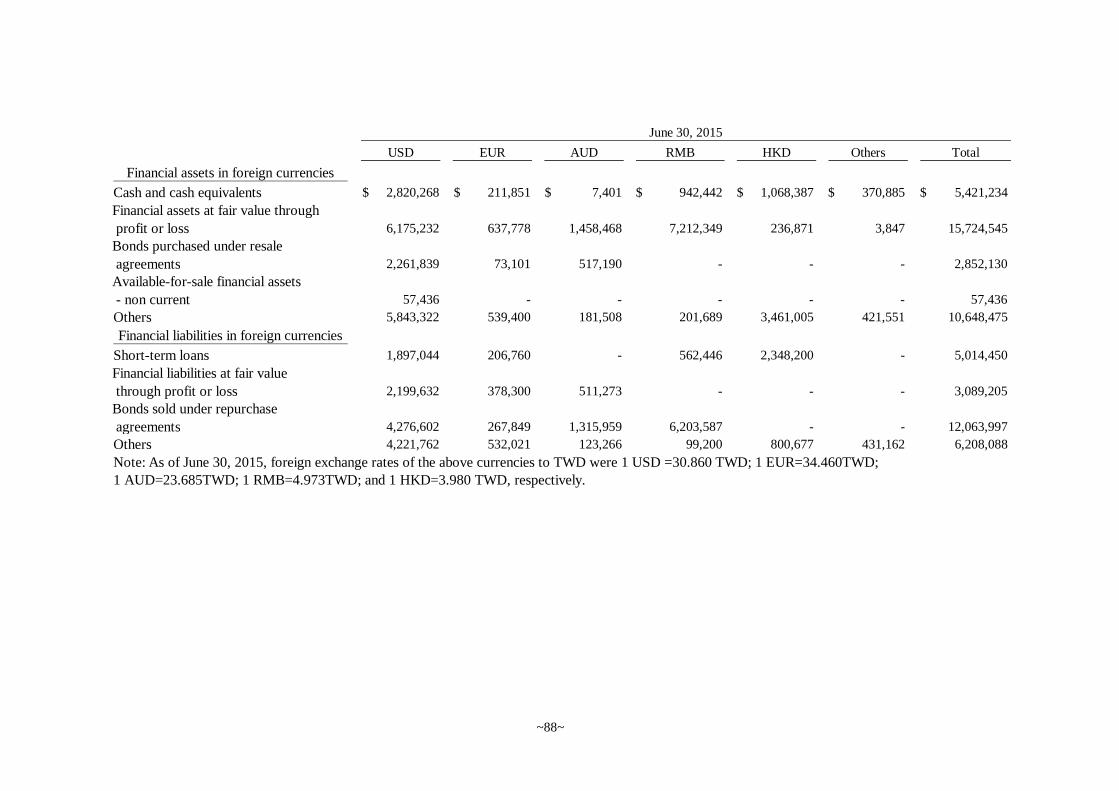
~88~
USD EUR AUD RMB HKD Others Total
Financial assets in foreign currencies
Cash and cash equivalents 2,820,268$ 211,851$ 7,401$ 942,442$ 1,068,387$ 370,885$ 5,421,234$
Financial assets at fair value through
profit or loss 6,175,232 637,778 1,458,468 7,212,349 236,871 3,847 15,724,545
Bonds purchased under resale
agreements 2,261,839 73,101 517,190 - - - 2,852,130
Available-for-sale financial assets
- non current 57,436 - - - - - 57,436
Others 5,843,322 539,400 181,508 201,689 3,461,005 421,551 10,648,475
Financial liabilities in foreign currencies
Short-term loans 1,897,044 206,760 - 562,446 2,348,200 - 5,014,450
Financial liabilities at fair value
through profit or loss 2,199,632 378,300 511,273 - - - 3,089,205
Bonds sold under repurchase
agreements 4,276,602 267,849 1,315,959 6,203,587 - - 12,063,997
Others 4,221,762 532,021 123,266 99,200 800,677 431,162 6,208,088
Note: As of June 30, 2015, foreign exchange rates of the above currencies to TWD were 1 USD =30.860 TWD; 1 EUR=34.460TWD;1 AUD=23.685TWD; 1 RMB=4.973TWD; and 1 HKD=3.980 TWD, respectively.
June 30, 2015

~89~
D. The total exchange gain (both realised and unrealized) arising from significant foreignexchange variation on the monetary items held by the Group for the three months andsix months ended June 30, 2016 and 2015, amounted to $53,971, ($62,685), ($172),and $411,108, respectively. Exchange gain of $24,696 on financial liabilities held bythe Group was caused by the appreciation of NTD during the period. Furthermore, asthe Offshore Securities Unit uses USD as its functional currency, exchange loss of$14,127 on financial liabilities denominated in foreign currency was caused by a widefluctuation in exchange rate of EUR and the depreciation of RMB.
E. In addition, due to wide fluctuation in exchange rate of EUR and the depreciation ofRMB as well as variations in interests and prices, foreign securities of the Group’strading securities incurred gains (losses) on trading of securities and net gains (losses)of trading securities measured at fair value through profit or loss. For the six monthsended June 30, 2016, gains (losses) on trading of securities denominated in EUR, USDand RMB was $94,397, $147,698 and ($225,775), respectively, and net gains oftrading securities measured at fair value through profit or loss from foreign bondsdenominated in EUR, USD and RMB was ($6,583), $118, $493, and $74,088,respectively.
5) Information on the fair values and hierarchy of the financial instrumentsA. Financial instruments and non-financial instruments not measured at fair value.
Except for those listed in the table below, the carrying amounts of the Group’s financialinstruments not measured at fair value (including cash and cash equivalents, bondspurchased under resale agreements, margin loans receivable, refinancing guarantydeposits, guaranteed proceeds receivable from refinancing, guaranteed price depositsfor security borrowing, security borrowing deposits, customer margin deposit account,notes and accounts receivable, other receivables, short-term loans, commercial paperpayable, bonds sold under repurchase agreements, guarantee deposit received fromshort sales, guaranteed price deposits received from securities borrowers, securityborrowing deposits, equity of futures traders, accounts payable, collection for others,and other payables) approximate their fair values. The fair value information offinancial instruments measured at fair value is provided in Note 12(5)3.
Total
Quoted prices of
the same assets in
active markets
(level 1)
Other significant
observable inputs
(level 2)
Significant
non-
observable
inputs (level 3)
Non-financial assets
Investment property 612,481$ -$ 612,481$ -$
Total
Quoted prices of
the same assets in
active markets
(level 1)
Other significant
observable inputs
(level 2)
Significant
non-
observable
inputs (level 3)
Non-financial assets
Investment property 666,669$ -$ 666,669$ -$
Asset items
June 30, 2016
Asset items
December 31, 2015
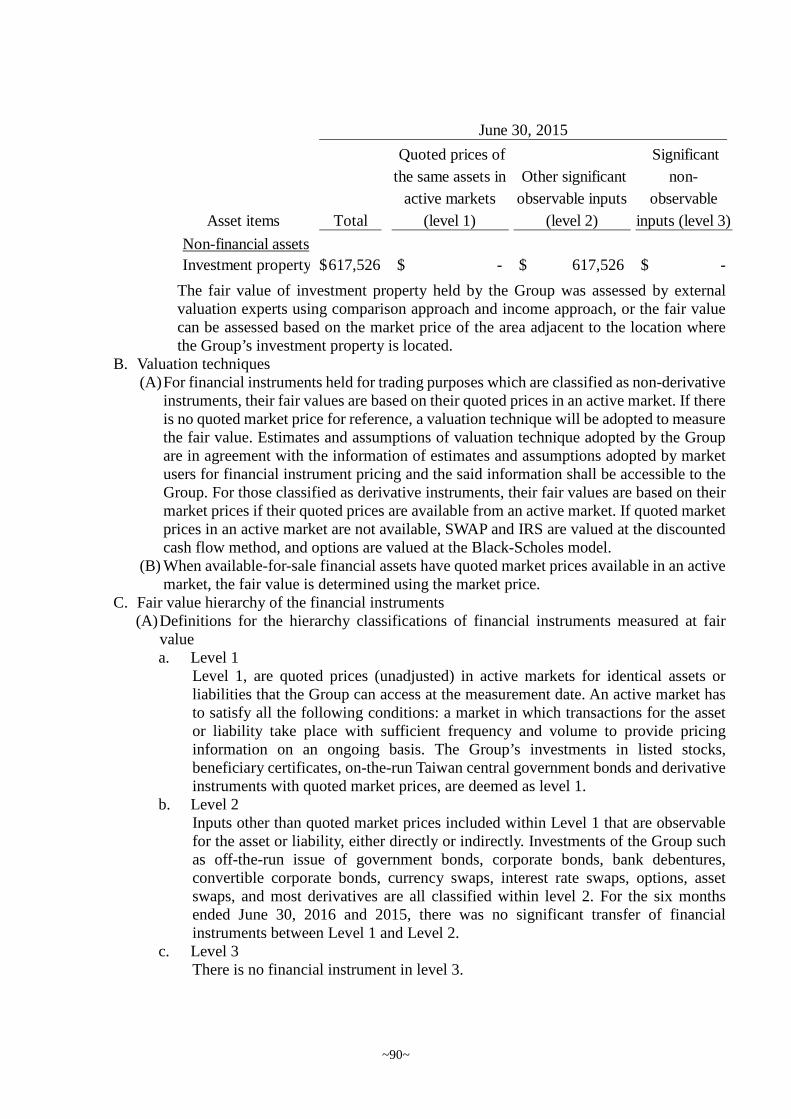
~90~
The fair value of investment property held by the Group was assessed by externalvaluation experts using comparison approach and income approach, or the fair valuecan be assessed based on the market price of the area adjacent to the location wherethe Group’s investment property is located.
B. Valuation techniques(A)For financial instruments held for trading purposes which are classified as non-derivative
instruments, their fair values are based on their quoted prices in an active market. If thereis no quoted market price for reference, a valuation technique will be adopted to measurethe fair value. Estimates and assumptions of valuation technique adopted by the Groupare in agreement with the information of estimates and assumptions adopted by marketusers for financial instrument pricing and the said information shall be accessible to theGroup. For those classified as derivative instruments, their fair values are based on theirmarket prices if their quoted prices are available from an active market. If quoted marketprices in an active market are not available, SWAP and IRS are valued at the discountedcash flow method, and options are valued at the Black-Scholes model.
(B) When available-for-sale financial assets have quoted market prices available in an activemarket, the fair value is determined using the market price.
C. Fair value hierarchy of the financial instruments(A)Definitions for the hierarchy classifications of financial instruments measured at fair
valuea. Level 1
Level 1, are quoted prices (unadjusted) in active markets for identical assets orliabilities that the Group can access at the measurement date. An active market hasto satisfy all the following conditions: a market in which transactions for the assetor liability take place with sufficient frequency and volume to provide pricinginformation on an ongoing basis. The Group’s investments in listed stocks,beneficiary certificates, on-the-run Taiwan central government bonds and derivativeinstruments with quoted market prices, are deemed as level 1.
b. Level 2Inputs other than quoted market prices included within Level 1 that are observablefor the asset or liability, either directly or indirectly. Investments of the Group suchas off-the-run issue of government bonds, corporate bonds, bank debentures,convertible corporate bonds, currency swaps, interest rate swaps, options, assetswaps, and most derivatives are all classified within level 2. For the six monthsended June 30, 2016 and 2015, there was no significant transfer of financialinstruments between Level 1 and Level 2.
c. Level 3There is no financial instrument in level 3.
Total
Quoted prices of
the same assets in
active markets
(level 1)
Other significant
observable inputs
(level 2)
Significant
non-
observable
inputs (level 3)
Non-financial assets
Investment property 617,526$ -$ 617,526$ -$
Asset items
June 30, 2015

~91~
(B) Hierarchy of fair value estimation of financial instruments
Financial instrument items
measured at fair value
Total Level 1 Level 2 Level 3
Recurring fair value
Non-derivative financial
instruments
Assets
Financial assets at fair value
through profit or loss-current
Stock investments 5,572,345$ 5,366,552$ 205,793$ -$
Bond investments 24,560,585 1,159,099 23,401,486 -
Others 1,146,209 1,146,209 - -
Available-for-sale financial
assets-current
Stock investments 811,955 811,955 - -
Bond investments 103,482 103,482 - -
Financial assets at fair value
through profit or loss
- noncurrent
50,956 - 50,956 -
Available-for-sale financial
assets-noncurrent
Stock investments 62,871 62,871 - -
Liabilities
Financial liabilities at fair
value through profit or loss
-current
877,285 877,285 - -
Derivative financial
instruments
Assets
Financial assets at fair value
through profit or loss-current2,174,428 1,986,624 187,804 -
Liabilities
Financial liabilities at fair
value through profit or loss
- current
521,773 462,540 59,233 -
June 30, 2016

~92~
Financial instrument items
measured at fair value
Total Level 1 Level 2 Level 3
Recurring fair value
Non-derivative financial
instruments
Assets
Financial assets at fair value
through profit or loss-current
Stock investments 5,044,988$ 4,952,140$ 92,848$ -$
Bond investments 22,276,110 1,783,082 20,493,028 -
Others 554,954 554,954 - -
Available-for-sale financial
assets-current
Stock investments 300,770 300,770 - -
Bond investments 102,191 102,191 - -
Financial assets at fair value
through profit or loss
- noncurrent
50,980 - 50,980 -
Available-for-sale financial
assets-noncurrent
Stock investments 59,479 59,479 - -
Liabilities
Financial liabilities at fair
value through profit or loss
-current
1,006,149 1,006,149 - -
Derivative financial
instruments
Assets
Financial assets at fair value
through profit or loss-current2,100,920 1,893,357 207,563 -
Liabilities
Financial liabilities at fair
value through profit or loss
- current
433,932 367,253 66,679 -
December 31, 2015
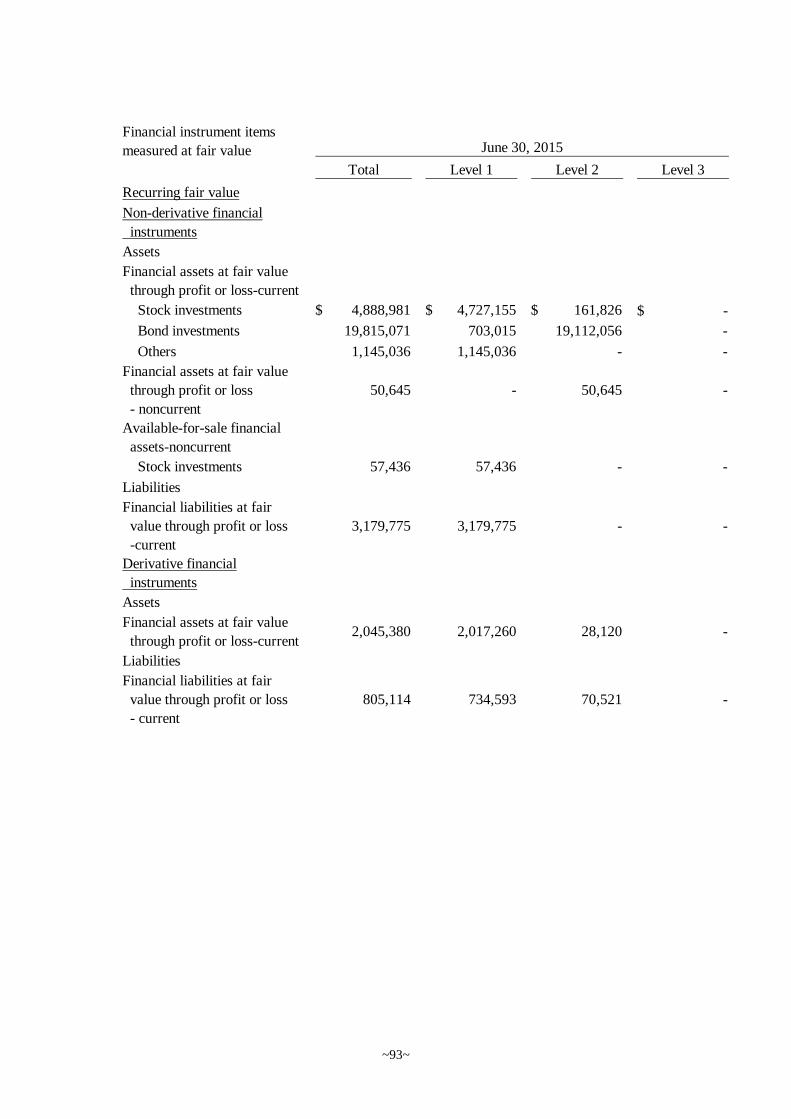
~93~
Financial instrument items
measured at fair value
Total Level 1 Level 2 Level 3
Recurring fair value
Non-derivative financial
instruments
Assets
Financial assets at fair value
through profit or loss-current
Stock investments 4,888,981$ 4,727,155$ 161,826$ -$
Bond investments 19,815,071 703,015 19,112,056 -
Others 1,145,036 1,145,036 - -
Financial assets at fair value
through profit or loss
- noncurrent
50,645 - 50,645 -
Available-for-sale financial
assets-noncurrent
Stock investments 57,436 57,436 - -
Liabilities
Financial liabilities at fair
value through profit or loss
-current
3,179,775 3,179,775 - -
Derivative financial
instruments
Assets
Financial assets at fair value
through profit or loss-current2,045,380 2,017,260 28,120 -
Liabilities
Financial liabilities at fair
value through profit or loss
- current
805,114 734,593 70,521 -
June 30, 2015

~94~
6) Capital managementA. Objective of capital management
(A) The represented capital adequacy ratio basically shall not be lower than 200% incompliance with the warning standard addressed in the “Rules GoverningSecurities Firms”.
(B) The Group includes all risks involved in the investment position as a part of riskmanagement, such as market risk, credit risk, liquidity risk, operating risk, legalrisk, and model risk and so on. Each risk management responsive unit shouldidentify, evaluate, monitor and control various risks in order to enable the Group todefend impact from financial market, reflect the current operating strategies andmake the investment portfolio applied to business planning and development.
B. Capital management policy and procedureIn order to secure the long-term and stable development of various businesses andeffectively assume risks, the Group manages capital based on the businessdevelopment, related regulations and financial market environment. Major capitalevaluation processes include:(A) Each segment should provide accurate and valid source of information to maintain
calculation accuracy of capital adequacy ratio.(B) After the reporting at the 10th of each month, capital adequacy ratio should be
computed by the end of every month. If the result is close to the legal standard,every unit will be called to attend a meeting for discussion and strategic planningto ensure that the basic objective of capital adequacy ratio is not less than 200%.
(C) Both the risk limits and economic capital of the Group should be agreed by theBoard of Directors. The Group should quarterly report details of risk control withdisclosure of investment condition in order to assess whether the risk positionexceeds the limit and whether the investment direction is in line with the markettrend. Within the authorized risk limits, the Group is actively engaged indevelopment of various businesses and continually increases profit, createscompany value, and complies with the capital management objective.
The Group calculates and reports the capital adequacy ratio according to “RulesGoverning Securities Firms”. According to Jin-Guan-Zeng-Chuan Letter No.1010016685, from July 2012, advanced calculation method applied to capital adequacyratio for securities firms is applicable to non-financial-holdings securities firms who filethe report about information on capital adequacy ratio for June 2012. As of June 30,2016, December 31, 2015, and June 30, 2015, the capital adequacy ratios were 436%,500% and 520%, respectively as required by the regulations.
7) Assets and liabilities of trust accountsThe Group commenced its trust business in December 2011. Pursuant to Article 17 ofEnforcement Rules of the Trust Enterprise Act, balance sheet, income statement, andproperty list of trust accounts shall be disclosed in the consolidated financial statements ona semiannual basis. Details are as follows:

~95~
A. Balance sheet of trust accounts
B. Income statement of trust accounts
Trust assets June 30, 2016 June 30, 2015
Bank savings 173,384$ 173,313$
Structured notes 200,425 86,873
Stock 467,359 236,158
Fund 2,742,916 1,336,791
Securities lending 674,732 613,236
Accounts receivable 19,476 44,110
Total of trust assets 4,278,292$ 2,490,481$
Trust liabilities June 30, 2016 June 30, 2015
Account payable 6,289$ 5,062$
Trust capital 4,343,192 2,436,865
Retained earnings 71,189)( 48,554
Total of trust liabilities 4,278,292$ 2,490,481$
Items
Six months ended June
30, 2016
Six months ended June
30, 2015
Trust income
Interest income 46$ 112$
Cash dividends received 3,268 2,427
Income from stock lending 13,698 11,713
Investment (loss) gain
- realized 3,094)( 44,795
Investment (loss) gain
- unrealized 107,288)( 851
Subtotal 93,370)( 59,898
Trust expenses
Management fee 21)( 38)(
Service fee 1)( 4)(
Borrowing costs 2,559)( 1,812)(
Remittance fee - 1)(
(Loss) income before income tax 95,951)( 58,043
Income tax expense 5)( 11)(
Net (loss) income 95,956)($ 58,032$

~96~
C. Property list of trust accounts
(Blank below)
Items June 30, 2016 June 30, 2015
Bank savings 173,384$ 173,313$
Structured notes 200,425 86,873
Fund 2,742,916 1,336,791
Stock 467,359 236,158
Securities lending 674,732 613,236
Others 19,476 44,110
Total 4,278,292$ 2,490,481$

~97~
8) Status of the company in the limitations on financial ratios imposed by futures trading act, and the related implementationThe table below is prepared according to “Regulations Governing Futures Commission Merchants”.
Calculation Ratio Calculation Ratio
Stockholders’ equity 3,112,199 3,065,274
(Total liability-futures trader’s equity) 234,899 376,910
Current assets 3,327,320 3,425,760
Current liabilities 42,094 19,189
Stockholders’ equity 3,112,199 3,065,274 ≧60%
Minimum paid-in capital 400,000 400,000 ≧40%
Adjusted net capital 2,876,469 2,798,464 ≧20%
Total amount of customer margins required
for the open positions of futures traders188,235 252,880 ≧15%
22 778.05% 766.32%Met the
requirement
22 1528.13% 1106.64%Met the
requirement
17 13.25 8.13 ≧1Met the
requirement
17 79.04 178.53 ≧1Met the
requirement
EnforcementArticle Calculation formulaJune 30, 2016 June 30, 2015
Standard
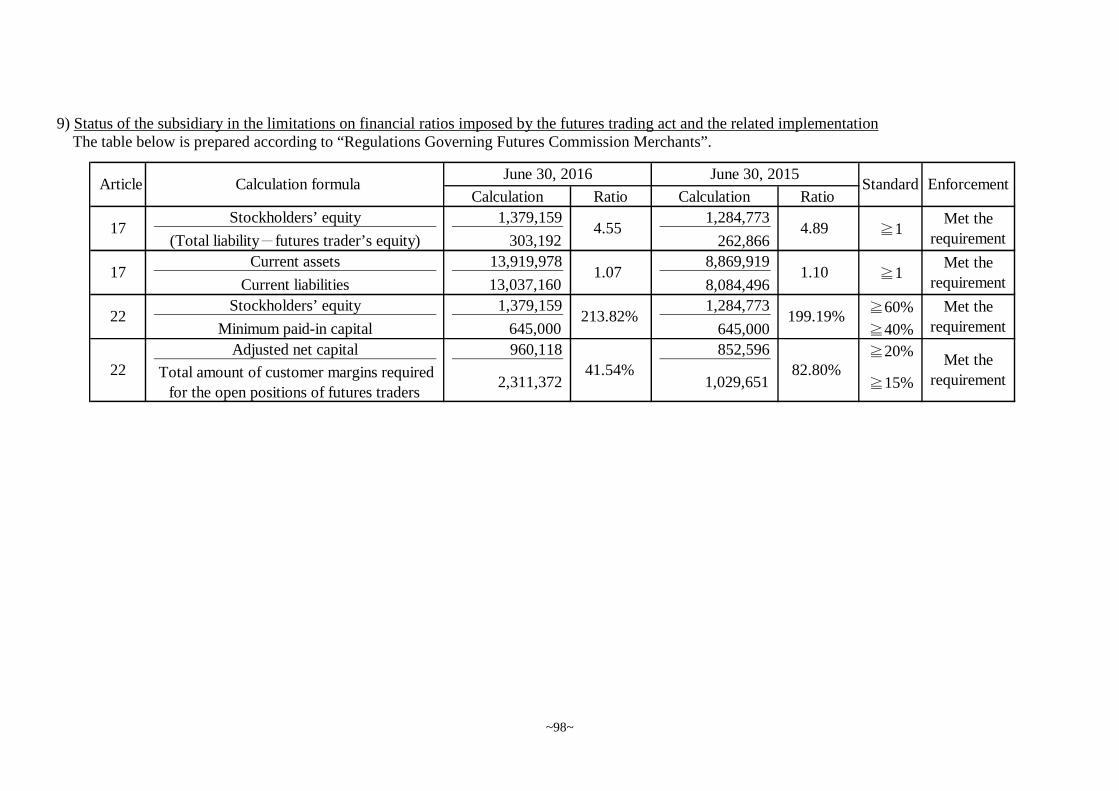
~98~
9) Status of the subsidiary in the limitations on financial ratios imposed by the futures trading act and the related implementationThe table below is prepared according to “Regulations Governing Futures Commission Merchants”.
Calculation Ratio Calculation Ratio
Stockholders’ equity 1,379,159 1,284,773
(Total liability-futures trader’s equity) 303,192 262,866
Current assets 13,919,978 8,869,919
Current liabilities 13,037,160 8,084,496
Stockholders’ equity 1,379,159 1,284,773 ≧60%
Minimum paid-in capital 645,000 645,000 ≧40%
Adjusted net capital 960,118 852,596 ≧20%
Total amount of customer margins required
for the open positions of futures traders2,311,372 1,029,651 ≧15%
22 213.82% 199.19%Met the
requirement
22 41.54% 82.80%Met the
requirement
17 4.55 4.89 ≧1Met the
requirement
17 1.07 1.10 ≧1Met the
requirement
EnforcementArticle Calculation formulaJune 30, 2016 June 30, 2015
Standard
~99~
10) Prospective risk for futures tradingThe main risk for futures merchants engaging in futures trading is credit risk, which couldhappen if the margin call cannot be made when it should have been made. While beingconsigned to conduct the futures trading, the Group pays attention to the individualmargin account on a daily basis and request additional margin call or reduction in tradingvolume when necessary according to the condition of individual customer transactions inorder to control the credit risk accordingly. The main risk faced by the Group whileengaging in self-operating businesses is market price risk- that is risk of changes in marketprices of futures or options contracts as a result of fluctuation in underlying investmentindex. Losses may occur if the market index price and underlying investment moveadversely. However, the Group has set up stop-loss point to control such risk for reasonsof risk management.
13. OTHER DISCLOSURE ITEMS1) Information about significant transactions
A. Lending to others: Excluding security margin trading and conditional bond tradingbusiness, there is no lending of funds to either the shareholders or other parties.
B. Endorsements and guarantees for others:None.
C. Acquisitions of real estate exceeding $300,000 or 20 percent of contributed capital:None.
D. Disposals of real estate exceeding $300,000 or 20 percent of contributed capital:None.E. Purchases or sales transactions discount on brokers’ charges with related parties in
excess of $5,000:None.F. Receivables from related parties exceeding $100,000 or 20 percent of contributed
capital:None.

~100~
G. Significant transactions between parent company and subsidiaries
Account Amount Conditions
Percentage (%) of
total consolidated
net revenues or
assets (Note 3)
0 President Securities Corp. President Futures Corp. 1 Futures Margin - Own Funds $ 1,352,106 Note 4 1.66%
0 President Securities Corp. President Futures Corp. 1 Deposit-out 43,000 Note 4 0.05%
0 President Securities Corp. President Futures Corp. 1 Accounts receivable 4,693 Note 4 0.01%
0 President Securities Corp. President Futures Corp. 1 Other receivables 120,615 Note 4 0.15%
0 President Securities Corp. President Futures Corp. 1 Future commission revenue 28,914 Note 4 1.35%
0 President Securities Corp. President Futures Corp. 1 Clearing charges 11,361 Note 4 0.53%
0 President Securities Corp. President Futures Corp. 1 Deposit-in 16,000 Note 4 0.02%
0 President Securities Corp. President Futures Corp. 1 Other payables 3,333 Note 4 0.00%
0 President Securities Corp. President Futures Corp. 1 Settlement accounts payable 2,079 Note 4 0.00%
0 President Securities Corp. President Futures Corp. 1 Settlement accounts receivable 2,047 Note 4 0.00%
0 President Securities Corp.President Capital Management
Corp.1 Expense from investment advisory 18,000 Note 4 0.84%
0 President Securities Corp.President Capital Management
Corp.1 Other non-operating revenues 1,681 Note 4 0.08%
No.(Note1) Company Counterparty
Relationship
(Note 2)
Details of transactions
~101~
Note 1:The numbers in the No. column are represented as follows:1. The number zero is for parent company.2. According to the sequential order, subsidiaries are numbered from 1.
Note 2:There are three kinds of transactions between related parties and numbered from 1 to 3 were shown as follows (If transactions between parentcompany and subsidiaries or between subsidiaries refer to the same transaction, it is not required to disclose twice. For example, if the parentcompany has already disclosed its transaction with a subsidiary, then the subsidiary is not required to disclose the transaction; for transactionsbetween two subsidiaries, if one of the subsidiaries has disclosed the transaction, then the other is not required to disclose the transaction.)1. Parent company to subsidiaries.2. Subsidiaries to parent company.3. Subsidiaries to subsidiaries.
Note 3:The calculation basis of the trading amount accounting for the total consolidated net revenues or assets is that the account ending balance isdivided by the total consolidated assets if it is attributed to the balance sheet accounts, and the accumulated trading amount of the interim periodis divided by the total consolidated net revenues if it is attributed to the profit or loss accounts.
Note 4:All the prices of the service revenues and consulting service provided between related parties were traded by contracts.
Note 5:Based on materiality, only the amounts of the transactions that were above $1 million would be shown in the table.

~102~
2) Related information of investee companiesA. Related information of investee companies
B. Lending to others: Excluding security margin trading and conditional bond trading business, there is no lending of funds to either the shareholdersor other parties.
C. Endorsements and guarantees for others:None.
Name of the investor
Name of the
investee company Location Major operating activities
Balance on
June 30, 2016
Balance on
January 1,2016 Shares Percentage Book vlaue
Net income (loss)
of investee
company
Investment income
(loss) recognised by
the Company Notes
President Securities
Corp.
President Futures Corp. Taipei Futures brokerage 644,650$ 644,650$ 63,817,303 96.69% 1,333,527$ 117,212$ 113,332$ Subsidiary of
the Company
President Capital
Management Corp.
Taipei Securities investment
consulting
150,000 150,000 12,400,000 100.00% 145,989 120)( 120)( Subsidiary of
the Company
President Securities (HK) Ltd. Hong Kong Securities dealer ,
brokerage, underwriting
and consulting
34,030 34,030 10,000,000 5.19% 71,362 16,506)( 857)( Subsidiary of
the Company
President Securities (BVI) Ltd. British Virgin
Islands
Securities investment and
holding company
2,264,573 2,264,573 67,746,000 100.00% 2,266,660 2,728)( 2,728)( Subsidiary of
the Company
Uni-President Asset
Management Corp.
Taipei Investment Trust 624,940 624,940 13,570,830 38.66% 402,515 76,334 29,721 Note
President Personal Insurance
Agency Co., Ltd.
Taipei Insurance Agent 5,000 5,000 500,000 100.00% 29,203 19,121 19,121 Subsidiary of
the Company
President Insurance Agency
Corp.
Taipei Insurance Agent 5,000 5,000 500,000 100.00% 13,250 4,042 4,042 Subsidiary of
the Company
PSC Venture Capital
Investment Limited
Company
Taipei Venture capital 300,000 300,000 30,000,000 100.00% 332,879 29,745 29,745 Subsidiary of
the Company
President Securities
(BVI) Ltd.
President Securities (HK) Ltd. Hong Kong Securities dealer ,
brokerage, underwriting
and consulting
814,705 814,705 182,600,000 94.81% 1,303,621 16,506)( 15,649)( Subsidiary of
the Company
President Wealth Management
(HK) Ltd.
Hong Kong Wealth management 92,091 92,091 23,400,000 100.00% 61,463 90 90 Indirect subsidiary
of the Company
President Securities (Nominee)
Ltd.
Hong Kong Nominee Service 3,403 3,403 1,000,000 100.00% 2,287 17)( 17)( Indirect subsidiary
of the Company
President Insurance
Agency Corp.
Uni-President Asset Management
Corp.
Taipei Investment Trust 478 478 12,000 0.03% 325 76,334 23 Note
Note:Associates
Original investment Ending Balance
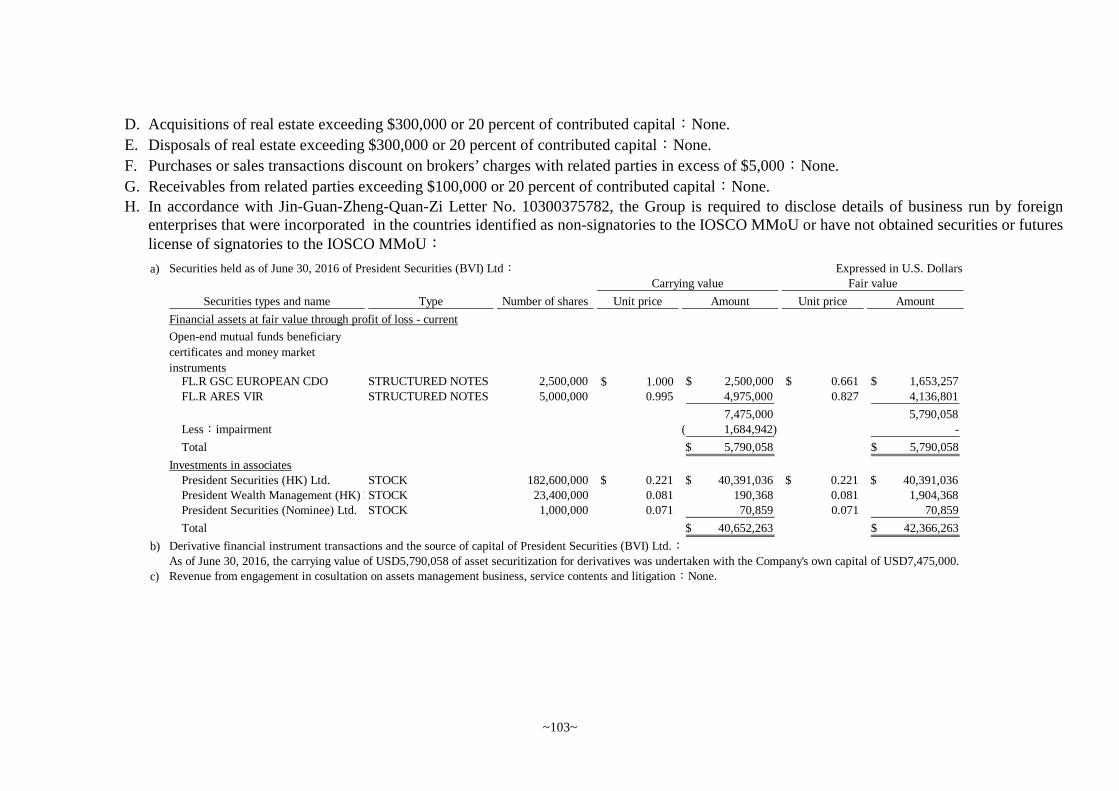
~103~
D. Acquisitions of real estate exceeding $300,000 or 20 percent of contributed capital:None.
E. Disposals of real estate exceeding $300,000 or 20 percent of contributed capital:None.
F. Purchases or sales transactions discount on brokers’ charges with related parties in excess of $5,000:None.
G. Receivables from related parties exceeding $100,000 or 20 percent of contributed capital:None.H. In accordance with Jin-Guan-Zheng-Quan-Zi Letter No. 10300375782, the Group is required to disclose details of business run by foreign
enterprises that were incorporated in the countries identified as non-signatories to the IOSCO MMoU or have not obtained securities or futureslicense of signatories to the IOSCO MMoU:
a) Securities held as of June 30, 2016 of President Securities (BVI) Ltd:
Securities types and name Type Number of shares Unit price Amount Unit price Amount
Financial assets at fair value through profit of loss - current
Open-end mutual funds beneficiary
certificates and money market
instrumentsFL.R GSC EUROPEAN CDO STRUCTURED NOTES 2,500,000 1.000$ 2,500,000$ 0.661$ 1,653,257$FL.R ARES VIR STRUCTURED NOTES 5,000,000 0.995 4,975,000 0.827 4,136,801
7,475,000 5,790,058Less:impairment 1,684,942)( -
Total 5,790,058$ 5,790,058$
Investments in associatesPresident Securities (HK) Ltd. STOCK 182,600,000 0.221$ 40,391,036$ 0.221$ 40,391,036$President Wealth Management (HK) Ltd.STOCK 23,400,000 0.081 190,368 0.081 1,904,368President Securities (Nominee) Ltd. STOCK 1,000,000 0.071 70,859 0.071 70,859
Total 40,652,263$ 42,366,263$
b) Derivative financial instrument transactions and the source of capital of President Securities (BVI) Ltd.:As of June 30, 2016, the carrying value of USD5,790,058 of asset securitization for derivatives was undertaken with the Company's own capital of USD7,475,000.
c) Revenue from engagement in cosultation on assets management business, service contents and litigation:None.
Expressed in U.S. DollarsCarrying value Fair value
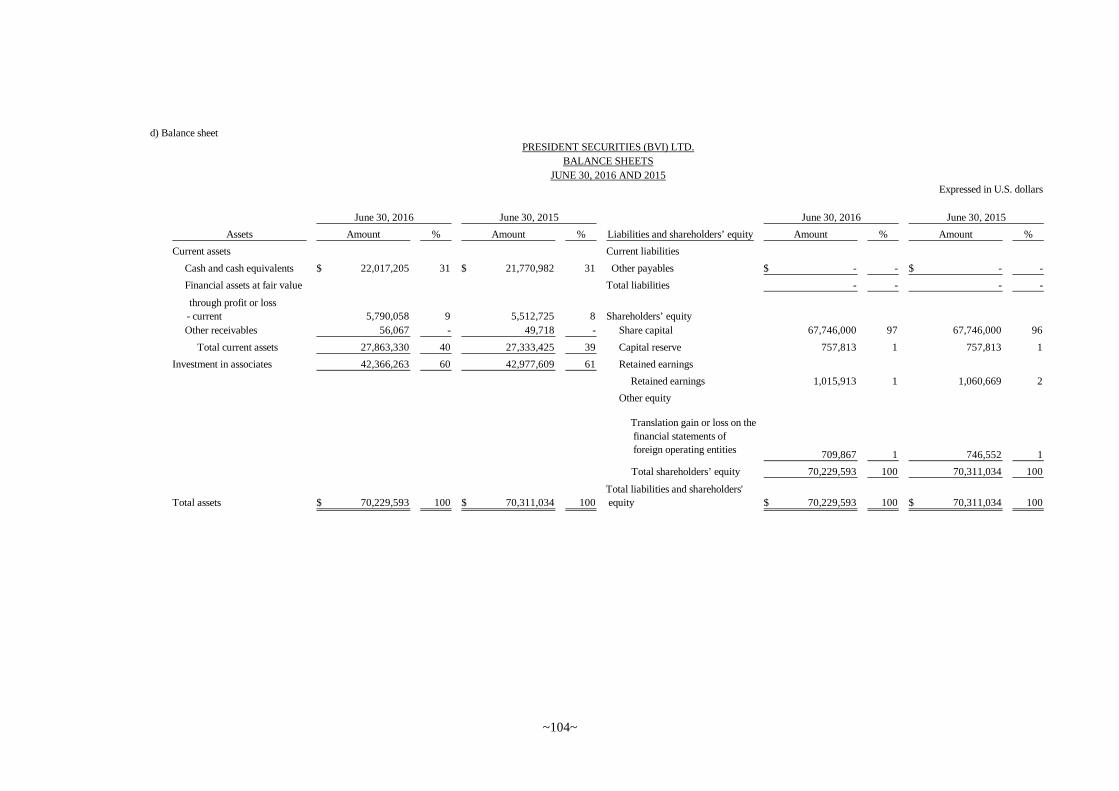
~104~
d) Balance sheet
Assets Amount % Amount % Liabilities and shareholders’ equity Amount % Amount %
Current assets Current liabilities
Cash and cash equivalents 22,017,205$ 31 21,770,982$ 31 Other payables -$ - -$ -
Financial assets at fair value Total liabilities - - - -
through profit or loss
- current 5,790,058 9 5,512,725 8 Shareholders’ equity
Other receivables 56,067 - 49,718 - Share capital 67,746,000 97 67,746,000 96
Total current assets 27,863,330 40 27,333,425 39 Capital reserve 757,813 1 757,813 1
Investment in associates 42,366,263 60 42,977,609 61 Retained earnings
Retained earnings 1,015,913 1 1,060,669 2
Other equity
Translation gain or loss on the
financial statements of
foreign operating entities 709,867 1 746,552 1
Total shareholders’ equity 70,229,593 100 70,311,034 100
Total assets 70,229,593$ 100 70,311,034$ 100
Total liabilities and shareholders'
equity 70,229,593$ 100 70,311,034$ 100
June 30, 2016 June 30, 2015 June 30, 2016 June 30, 2015
PRESIDENT SECURITIES (BVI) LTD.
BALANCE SHEETS
JUNE 30, 2016 AND 2015
Expressed in U.S. dollars

~105~
Assets Amount % Amount % Liabilities and shareholders’ equity Amount % Amount %
Current assets Current liabilities
Cash and cash equivalents 14,752,455$ 100 14,722,749$ 100 Other payables -$ - -$ -
Other receivables 18,974 - 15,921 - Total liabilities - - - -
Prepayments 6,996 - 6,996 -
Total current assets 14,778,425 100 14,745,666 100 Shareholders’ equity
Share capital 23,400,000 158 23,400,000 159
Retained earnings
(accumulated deficit) 8,621,575)( 58)( 8,654,334)( 59)(
Total shareholders’ equity 14,778,425 100 14,745,666 100
Total assets 14,778,425$ 100 14,745,666$ 100
Total liabilities and shareholders'
equity 14,778,425$ 100 14,745,666$ 100
June 30, 2016 June 30, 2015 June 30, 2016 June 30, 2015
PRESIDENT WEALTH MANAGEMENT (HK) LTD.
BALANCE SHEETS
JUNE 30, 2016 AND 2015
Expressed in HK dollars

~106~
Assets Amount % Amount % Liabilities and shareholders’ equity Amount % Amount %
Current assets Current liabilities
Cash and cash equivalents 549,383$ 100 574,018$ 100 Other payables -$ - -$ -
Other receivables 499 - 455 - Total liabilities - - - -
Total current assets 549,882 100 574,473 100 Shareholders’ equity
Share capital 1,000,000 182 1,000,000 174
Retained earnings
(accumulated deficit) 450,118)( 82)( 425,527)( 74)(
Total shareholders’ equity 549,882 100 574,473 100
Total assets 549,882$ 100 574,473$ 100
Total liabilities and shareholders'
equity 549,882$ 100 574,473$ 100
Expressed in HK dollars
June 30, 2016 June 30, 2015 June 30, 2016 June 30, 2015
BALANCE SHEETS
JUNE 30, 2016 AND 2015
PRESIDENT SECURITIES (NOMINEE) LTD.

~107~
e) Statements of comprehensive income
Expressed in U.S. dollars
Accounts Amount % Amount %
Expenditures
Employee benefits 23,266)($ - 23,306)($ -
Other operating expenses 7,509)( - 7,248)( -
Total expenditures and expenses 30,775)( - 30,554)( -
Non-operating gains and losses
Share of the profit or loss of associates and joint
ventures accounted for using the equity method 475,411)( - 1,383,311 -Other gains and losses 422,922 - 270,855 -
Total non-operating gains and losses 52,489)( - 1,654,166 -
(Loss) profit before tax 83,264)( - 1,623,612 -
Income tax expense - - - -
Net (loss) income 83,264)($ - 1,623,612$ -
PRESIDENT SECURITIES (BVI) LTD.
STATEMENTS OF COMPREHENSIVE INCOME
FOR THE SIX MONTHS ENDED JUNE 30, 2016 AND 2015
Six months ended June 30, 2016 Six months ended June 30, 2015

~108~
Expressed in HK dollars
Accounts Amount % Amount %
Expenditures
Other operating expenses 14,784)($ - 38,754)($ -
Total expenditures and expenses 14,784)( - 38,754)( -
Non-operating gains and losses
Other gains and losses 36,025 - 39,970 -
Profit before tax 21,241 - 1,216 -
Income tax expense - - - -
Net income 21,241$ - 1,216$ -
STATEMENTS OF COMPREHENSIVE INCOME
FOR THE SIX MONTHS ENDED JUNE 30, 2016 AND 2015
Six months ended June 30, 2016 Six months ended June 30, 2015
PRESIDENT WEALTH MANAGEMENT (HK) LTD.
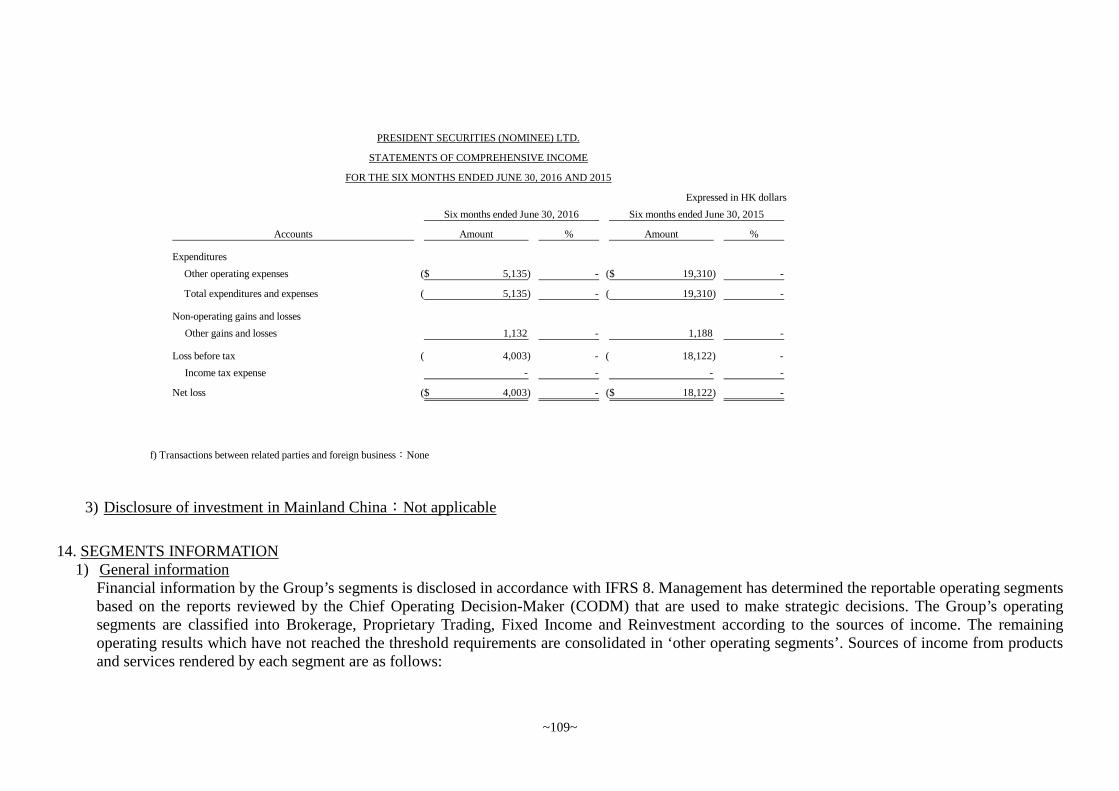
~109~
3) Disclosure of investment in Mainland China:Not applicable
14. SEGMENTS INFORMATION1) General information
Financial information by the Group’s segments is disclosed in accordance with IFRS 8. Management has determined the reportable operating segmentsbased on the reports reviewed by the Chief Operating Decision-Maker (CODM) that are used to make strategic decisions. The Group’s operatingsegments are classified into Brokerage, Proprietary Trading, Fixed Income and Reinvestment according to the sources of income. The remainingoperating results which have not reached the threshold requirements are consolidated in ‘other operating segments’. Sources of income from productsand services rendered by each segment are as follows:
Expressed in HK dollars
Accounts Amount % Amount %
Expenditures
Other operating expenses 5,135)($ - 19,310)($ -
Total expenditures and expenses 5,135)( - 19,310)( -
Non-operating gains and losses
Other gains and losses 1,132 - 1,188 -
Loss before tax 4,003)( - 18,122)( -
Income tax expense - - - -
Net loss 4,003)($ - 18,122)($ -
f) Transactions between related parties and foreign business:None
FOR THE SIX MONTHS ENDED JUNE 30, 2016 AND 2015
Six months ended June 30, 2016 Six months ended June 30, 2015
PRESIDENT SECURITIES (NOMINEE) LTD.
STATEMENTS OF COMPREHENSIVE INCOME
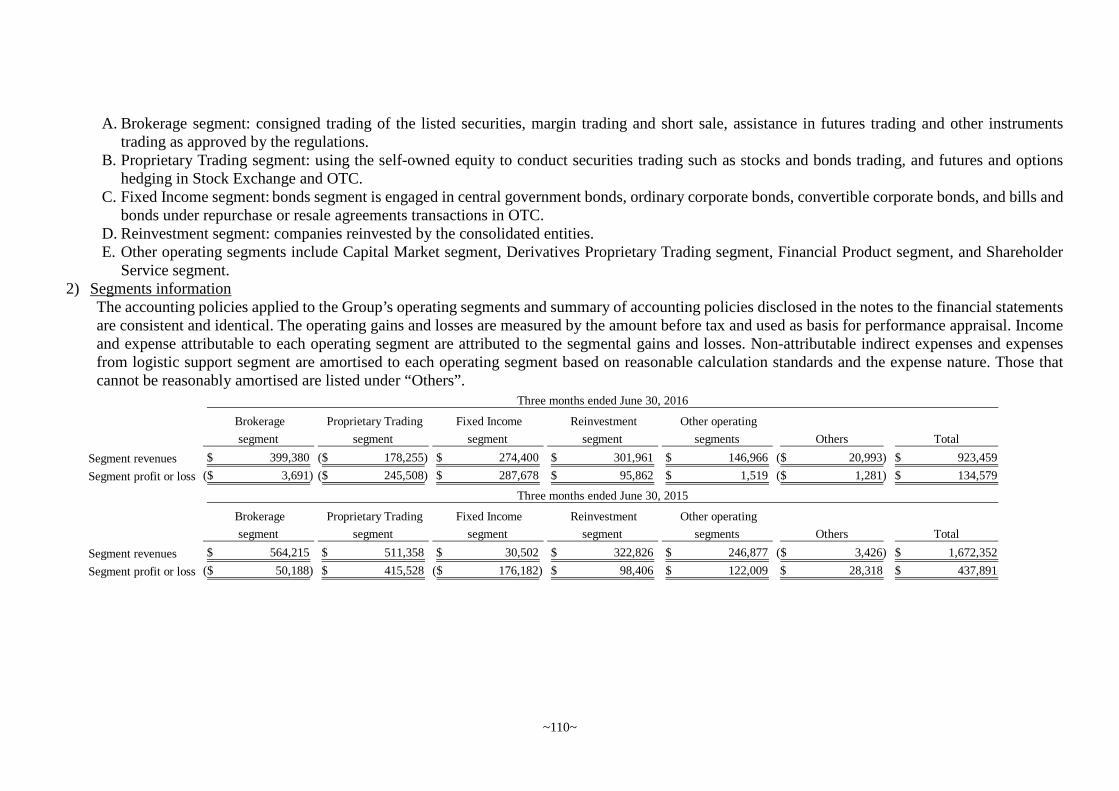
~110~
A. Brokerage segment: consigned trading of the listed securities, margin trading and short sale, assistance in futures trading and other instrumentstrading as approved by the regulations.
B. Proprietary Trading segment: using the self-owned equity to conduct securities trading such as stocks and bonds trading, and futures and optionshedging in Stock Exchange and OTC.
C. Fixed Income segment: bonds segment is engaged in central government bonds, ordinary corporate bonds, convertible corporate bonds, and bills andbonds under repurchase or resale agreements transactions in OTC.
D. Reinvestment segment: companies reinvested by the consolidated entities.E. Other operating segments include Capital Market segment, Derivatives Proprietary Trading segment, Financial Product segment, and Shareholder
Service segment.2) Segments information
The accounting policies applied to the Group’s operating segments and summary of accounting policies disclosed in the notes to the financial statementsare consistent and identical. The operating gains and losses are measured by the amount before tax and used as basis for performance appraisal. Incomeand expense attributable to each operating segment are attributed to the segmental gains and losses. Non-attributable indirect expenses and expensesfrom logistic support segment are amortised to each operating segment based on reasonable calculation standards and the expense nature. Those thatcannot be reasonably amortised are listed under “Others”.
Brokerage
segment
Proprietary Trading
segment
Fixed Income
segment
Reinvestment
segment
Other operating
segments Others Total
Segment revenues 399,380$ 178,255)($ 274,400$ 301,961$ 146,966$ 20,993)($ 923,459$
Segment profit or loss 3,691)($ 245,508)($ 287,678$ 95,862$ 1,519$ 1,281)($ 134,579$
Brokerage
segment
Proprietary Trading
segment
Fixed Income
segment
Reinvestment
segment
Other operating
segments Others Total
Segment revenues 564,215$ 511,358$ 30,502$ 322,826$ 246,877$ 3,426)($ 1,672,352$
Segment profit or loss 50,188)($ 415,528$ 176,182)($ 98,406$ 122,009$ 28,318$ 437,891$
Three months ended June 30, 2016
Three months ended June 30, 2015

~111~
Note 1: As operating income (loss) in total is consistent with consolidated statement of comprehensive income, there is no need for adjustment.Note 2: The Company measures the performance of reportable operating segment based on specific performance indicators instead of assets and liabilities. The performance of
reportable operating segment is regularly reviewed and assessed by the CODM as a reference for making resources allocation decision.
Brokerage
segment
Proprietary Trading
segment
Fixed Income
segment
Reinvestment
segment
Other operating
segments Others Total
Segment revenues 845,784$ 210,748)($ 550,697$ 610,885$ 387,688$ 39,890)($ 2,144,416$
Segment profit or loss 16,409$ 374,200)($ 440,781$ 183,761$ 145,270$ 56,494)($ 355,527$
Brokerage
segment
Proprietary Trading
segment
Fixed Income
segment
Reinvestment
segment
Other operating
segments Others Total
Segment revenues 1,073,474$ 818,564$ 59,056)($ 588,970$ 383,937$ 2,263)($ 2,803,626$
Segment profit or loss 27,700$ 645,405$ 159,497$ 162,805$ 125,295$ 36,995)($ 1,083,707$
Six months ended June 30, 2016
Six months ended June 30, 2015