preserving history or hindering growth? the...
TRANSCRIPT
WORKING PAPER
Preserving History or Hindering Growth? The Heterogeneous Effects of Historic Districts on Local Housing Markets in New York City Vicki Been, Ingrid Gould Ellen, Michael Gedal, Edward Glaeser, Brian J. McCabe
furmancenter.org This research does not represent the institutional views (if any) of NYU, NYU School of Law, or the Wagner Graduate School of Public Service.
September 2014
Title: Preserving History or Hindering Growth? The Heterogeneous Effects of Historic Districts on Local Housing Markets in New York City1
Authors:
Vicki Been New York University School of Law Furman Center for Real Estate and Urban Policy
Ingrid Gould Ellen New York University Wagner Graduate School for Public Policy Furman Center for Real Estate and Urban Policy
Michael Gedal Federal Reserve Bank of New York
Edward Glaeser
Harvard University Department of Economics
Brian J. McCabe Georgetown University Department of Sociology
1 We would like to thank Gerard Torrats-Espinosa for his exceptional research assistance. We also wish to thank Sara Lense and Paul Salama for their assistance in preparing and analyzing the data, and Rohan Jolly and Clint Wallace for their research on the law of historic designation and the policy controversies that accompany designation. We are grateful for suggestions and questions we received from participants in the 2011 and 2013 fall APPAM meetings, the 2013 AREUEA meetings, and Furman Center for Real Estate and Urban Policy brown bag lunch series. We would especially like to thank our conference discussants, Matthew Freedman and Claudia Sharygin. We are indebted to the Furman Center for Real Estate and Urban Policy at NYU for supporting this research, and to the Filomen D’Agostino and Max E. Greenberg Faculty Research Fund for support of Professor Been. Note that Professor Been worked on this project before she became Commissioner of Housing Preservation and Development in New York City. The views represented here are those of the authors and do not necessarily reflect those of the Federal Reserve Bank of New York or the Federal Reserve System.
Abstract Since Brooklyn Heights was designated as New York City’s first landmarked
neighborhood in 1965, the Landmarks Preservation Commission has designated 120 historic neighborhoods in the city. This paper develops a theory of heterogeneous impacts across neighborhoods and exploits variation in the timing of historic district designations in New York City to identify the effects of preservation policies on residential property markets. We combine an extensive dataset of residential transactions during the 35-year period between 1974 and 2009 with data from the Landmarks Preservation Commission on the location of the city’s historic districts and the timing of the designations. Designation raises property values within historic districts, but only outside of Manhattan. In areas where the value of the option to build unrestricted is higher, designation has a less positive effect on property values within the district. Consistent with theory, properties just outside the boundaries of districts increase in value after designation. There is also a modest reduction in new construction in districts after designation.
Key Words: Historic Districts
1
1. Introduction
In 1965, the New York City Landmarks Preservation Commission was created to
formalize the channels through which historic properties were protected and preserved in New
York City (Wood 2008). That same year, the Commission designated Brooklyn Heights as the
city’s first landmarked neighborhood, and has since designated 120 historic neighborhoods in the
city. These districts range from the Upper East Side Historic District, encompassing more than
50 blocks (or parts thereof) on the east side of Central Park, to the recently-designated Perry
Avenue Historic District, an agglomeration of just nine single-family homes in the Bronx.
The preservation of historic neighborhoods has been controversial in New York City and
elsewhere. Preservation advocates argue that the market-driven process of urban development
will not adequately protect a city’s architectural heritage, as individual owners will not
internalize the full benefit to society of historic preservation (Mourato & Mazzanti 2002).
Proponents argue that historic districts generate economic externalities, for the city as whole,
both by increasing tourism and nurturing the city’s art and culture (Rypkema 2005). To the
extent that they create a common identity for neighborhood residents, the creation of unified
historic neighborhoods could encourage the growth of community organizations and heighten
social cohesion (Rose 1981). Preservation proponents worry that the political process may be
stacked against historic, aesthetic, or cultural considerations, especially in cities increasingly
subject to the pressure from the demands of property developers (Verrey & Henley 1991).
Preservation critics, conversely, argue that preservationists are just another well-
organized lobby of incumbents opposing change. While many critics recognize the value of
preserving historic structures and neighborhoods, they often contend that preservation policies
unfairly restrict the rights of property owners. Property owners in historic districts are often
subject to extensive regulatory hurdles that may discourage property owners from making
improvements that would maximize the value of their property. In limiting development within
historic districts, critics contend that these policies limit the supply of housing, driving the cost
of housing beyond the reach of many residents and contributing to a larger crisis of affordability.
Taken to the extreme, historic preservation could limit a city’s ability to grow and adapt to the
needs of an increasingly competitive global system of cities (Glaeser 2010).
As our theoretical model stresses, the impact of historic preservation is unlikely to be
uniform across neighborhoods. Preservation has at least two offsetting effects on local property
values. On the one hand, the designation of a historic district restricts the changes property
2

owners can make to their buildings and prohibits demolition and redevelopment. This loss of
flexibility – the forgone option to redevelop potentially at higher density levels – should lower
land and property values, especially in high demand areas that are initially low density. On the
other hand, designation can preserve the historic beauty – or amenity level—of a neighborhood
and minimize the risks that new investment will undermine the distinctive character of the area.
This effect should be larger in areas with architectural attributes that buyers and renters value,
and in areas that have high density levels before preservation. The designation of a district also
may increase demand by conferring a special status on properties in the district, or by restricting
supply is demand is sufficiently inelastic.
The model predicts that preservation will not uniformly affect all neighborhoods. If
demand for the location is high and heights are far below the allowable zoning cap, then the lost
option value is large and land values should fall. If buildings are initially high or demand for
the location is low, then the impact of preservation on prices is likely to be positive. Thus, we
would expect that designation would have a more negative effect on property values in higher
value neighborhoods with a greater share of buildings built at heights well below the allowable
limits. By contrast, we would expect historic designation to have more positive impacts on
property values in neighborhoods where buildings are generally already built to the heights
allowed by zoning, and values are lower. Preservation should also provide more benefit to
owners if the neighboring historic homes that are preserved by the district rules are more
attractive and historically meaningful. The model also predicts that properties immediately
outside districts are likely to receive many of the same benefits as properties within the district
without the imposed restrictions, we expect to see surrounding properties increase in value after
designation.
While expanding on current research on the price impact of historic designations, our
study also explores the impact of historic designation on housing supply. In general, theory
predicts that the rules accompanying designation will limit the amount of new construction
activity that occurs in historic districts. We expect these effects to be felt more strongly when
market demand is high and the underlying zoning is more lenient.
This paper evaluates how historic district designation affects both the prices of residential
properties in New York City and reinvestment. In brief, we find that designation raises property
values within historic districts, but only for the boroughs outside Manhattan. More generally, we
find that designation decreases the value of properties in districts where the foregone option to
3
redevelop is higher. Consistent with theory, we also find that properties just outside the
boundaries of districts increase in value after designation. Finally, we find modest evidence of
reduced construction activity in districts after designation.
2. Theoretical Model: Historic Districts, Building and Land Prices
What impact will a historic district designation have on welfare, construction, land prices
and unit prices within a designated area? We now explore these questions with an economic
model, which will guide our subsequent empirical work. We consider a city with a continuum of
neighborhoods, each containing exactly one unit of land that is subdivided into a continuum of
parcels. Within a neighborhood, parcels are assumed to be homogeneous, at least before any
redevelopment occurs, so that all building are of height ℎ�𝑛 and aesthetic value 𝛼�𝑛. Ex post
building heights are denoted ℎ𝑛 and the ex post aesthetic value in the neighborhood is 𝛼𝑛, the
average aesthetic value in the neighborhood weighted by land area.
The total welfare associated with living in one of these neighborhoods, relative to a
reservation locale elsewhere, equals non-aesthetic welfare, equal to 𝐵𝑛𝑗 which is specific to
person and neighborhood, plus the local aesthetic value 𝛼𝑛 plus the city-wide aesthetic value of
𝛿 ∫ 𝛼𝑖𝑁𝑖=1 𝑑𝑖 or 𝛿𝐴, the weighted average of the aesthetic amenity value for the entire city.
Hence for person j the willingness to pay live in neighborhood n equals 𝐵𝑛𝑗 + 𝛼𝑛 + 𝛿 ∫ 𝛼𝑖
𝑁𝑖=1 𝑑𝑖.
As aesthetics are at the heart of historic preservation, we focus more on the ephemeral
notion of aesthetics than usual in housing economics, which more typically stresses the tangible
sources of structural value. Moreover, since preservationists often care passionately about
neighborhoods other than their own, we allow a citywide aesthetic effect. The aesthetic quality
of the neighborhood, and the city, will change with redevelopment and since neighborhoods may
be incompletely redeveloped, they may also end up being heterogeneous.
The non-aesthetic value is meant to include the economic returns from living in the city
and the commuting costs in each neighborhood. We initially assume this value is constant across
individuals and denoted 𝐵𝑛, but later allow for individual heterogeneity. In the case of
homogeneous preferences (but not heterogeneous preferences), a Henry George theorem applies
(Arnott and Stiglitz, 1979) and property values across the city as a whole are the most sensible
measure of welfare.
4
If the price of housing in neighborhood n is denoted 𝑝𝑛, then the spatial equilibrium
requires that this must equal 𝐵𝑛 + 𝛼𝑛 + 𝛿𝐴. Neighborhoods are assumed to small relative to the
city and buildings are assumed to be arbitrarily small relative to a neighborhood. As such,
when making construction decisions, builders will not automatically internalize the impact of
lowering aesthetics on others.
Since willingness to pay does not rise with building aesthetics, only with neighborhood
aesthetics, firms will provide the minimum possible aesthetic level given current regulations and
technology, which equals 𝛼0. The model could be easily changed so the homebuyers did care
about the aesthetics of their building, as long as these were homogeneous across individuals, and
in that case 𝛼0 could be interpreted as the optimal aesthetic value of new building given buyers’
preferences.
If a share, 𝑠𝑛 of the neighborhood’s land area is re-developed then 𝛼𝑛 = 𝑠𝑛𝛼0 +
(1 − 𝑠𝑛) 𝛼�𝑛, where 𝛼�𝑛 represents the historic amenity value of the area. The cost of
redeveloping a parcel is captured by a convex function c(h), where h is the height of the new
building. We also assume that ℎ𝑛 is the legal maximum of new building heights in the
neighborhood. We can now define a redevelopment equilibrium:
Definition: A redevelopment equilibrium exists if for all parcels that can be legally re-developed,
redevelopment occurs if and only if �𝐵𝑛 + 𝛼𝑛 + 𝛿 ∫ 𝛼𝑖𝑁𝑖=1 𝑑𝑖� �𝑀𝑖𝑛(ℎ𝑛∗ ,ℎ𝑛) − ℎ�𝑛� ≥ 𝑐(ℎ𝑛∗ ),
where 𝐵𝑛 + 𝛼𝑛 + 𝛿 ∫ 𝛼𝑖𝑁𝑖=1 𝑑𝑖 = 𝑐′(ℎ𝑛∗ ), where 𝛼𝑛 = 𝑠𝑛𝛼0 + (1 − 𝑠𝑛)𝛼�𝑛 and 𝑠𝑛 equals the
share of each neighborhood that is redeveloped. Redevelopers earn zero profits.
The definition stresses that redevelopment must be optimal on both the intensive and
extensive margin. Builders will erect towers up to the height where the marginal benefit of extra
space, captured by the price, equals the marginal cost of building up, or up to the legal maximum.
They will redevelop parcels to the point where the gain in value from more height on that parcels
offsets the cost of redevelopment including land.
Treating city-wide redevelopment behavior as given, we now focus on a particularly
neighborhood and let ℎ0∗ refer to the optimal height if the entire neighborhood is redeveloped and
𝛼𝑛 = 𝛼0. We define let ℎ𝑚𝑎𝑥(𝛼�𝑛) define the maximum value of height at which marginal
5
development covers costs.2 This cutoff value ℎ𝑚𝑎𝑥(𝛼�𝑛) is increasing with 𝛼�𝑛 because the
benefits of adding more density are higher when the neighborhood is nicer. The following
Lemma characterizes the possible equilibrium outcomes in a neighborhood, assuming that the
height restriction does not bind:
Lemma 1: If 𝛼�𝑛 > 𝛼0, then there will be partial redevelopment if and only if ℎ�𝑛 < ℎ𝑚𝑎𝑥(𝛼�𝑛)
and there will be total redevelopment if and only if ℎ𝑚𝑎𝑥(𝛼�𝑛) > ℎ0∗ −𝑐(ℎ0∗)
𝐵+𝑎0+𝛿𝐴> ℎ�𝑛.
If 𝛼�𝑛 < 𝛼0, then ℎ𝑚𝑎𝑥(𝛼�𝑛) < ℎ0∗ −𝑐(ℎ0∗)
𝐵+𝑎0+𝛿𝐴, and if ℎ�𝑛 < ℎ𝑚𝑎𝑥(𝛼�𝑛) then there will be
total redevelopment, if ℎ�𝑛 > ℎ0∗ −𝑐(ℎ0∗)
𝐵+𝑎0+𝛿𝐴 there will be no redevelopment, and if ℎ𝑚𝑎𝑥(𝛼�𝑛) <
ℎ�𝑛 < ℎ0∗ −𝑐(ℎ0∗)
𝐵+𝑎0+𝛿𝐴 then total redevelopment and no redevelopment are both possible outcomes.
There is also a mixed redevelopment equilibrium, which is unstable according to standard
arguments.
This lemma’s implications for redevelopment behavior are illustrated in Figure 1.
Redevelopment is shaped by the combination of initial height levels and initial amenity levels.
If ℎ0∗ −𝑐(ℎ0∗)
𝐵+𝑎0+𝛿𝐴< ℎ�𝑛, so an area has taller buildings, then there is less benefit from adding more
density. Partial redevelopment will be optimal, in this case, only if the initial neighborhood
quality is high enough so that initial prices are high enough to pay for redevelopment. In this
case, more redevelopment will lower neighborhood quality and eventually cause redevelopment
to stop.
If ℎ0∗ −𝑐(ℎ0∗)
𝐵+𝑎0+𝛿𝐴> ℎ�𝑛, then initial heights are low, and total redevelopment is always one
possible equilibrium. If initial neighborhood quality is low, then there is a second equilibrium
with no redevelopment. This multiple equilibrium situation captures the possibility that some
neighborhoods may remain blighted for years and then quickly “tip” with rapid redevelopment.
If initial neighborhood quality is higher, then redevelopment will always occur and it will always
be complete, possibly even destroying value. Somewhat paradoxically, as we will discuss later,
2 Technically, ℎ𝑚𝑎𝑥(𝛼�𝑛) is defined by (𝐵𝑛 + 𝛼�𝑛 + 𝛿𝐴) �ℎ�𝑛∗ (𝛼�𝑛) − ℎ𝑚𝑎𝑥(𝛼�𝑛)� = 𝑐�ℎ�𝑛∗ (𝛼�𝑛)� and (𝐵𝑛 + 𝛼�𝑛 + 𝛿𝐴) =
𝑐′�ℎ�𝑛∗ (𝛼�𝑛)� and ℎ0∗ satisfies 𝐵𝑛 + 𝛼0 + 𝛿𝐴 = 𝑐′(ℎ0∗).
6

it can be optimal for the same government to force redevelopment in some neighborhoods while
preventing it in others. Changes in these parameter spaces are illustrated in Figure 1, which
shows the core areas predicted by the model.
Changes in the overall level of demand for the city will shift the parameter spaces. As
the city as a whole becomes more attractive, total redevelopment becomes an equilibrium
outcome for initially taller neighborhoods. Holding height constant, redevelopment becomes
more common as demand for the city as whole rises.
What would height regulations do to redevelopment behavior? A binding height limit
reduces the profits from redevelopment, which means the maximum height threshold for total
redevelopment of an area falls. The minimum amenity level for marginal redevelopment efforts
rises as height limitations become more stringent. If absolute bans present a sure way to reduce
redevelopment, height limits present an only slightly less effective means of accomplishing that
aim.
If 𝛼0 < 𝛼�𝑛, then parcel owners will always benefits if their neighbors are subject to
restrictions, as long as they are not. The restriction keeps aesthetic quality high, while still
allowing them to build. This logic lies behind our empirical analysis of buffer zones, which we
assume are essentially part of the same neighborhood even though they are not bound by the
same rule.
Proposition 1 solves the social planner’s problem for redevelopment of a neighborhood,
internalizing the social effects on the city as a whole. If city has total power about how much to
redevelop and where, what redevelopment should take place? Notably, in this case, there is no
role for height restrictions on new development, so we will not discuss them. Proposition 2
tackles the more realistic question of asking in which areas should redevelopment be banned if
the city cannot control the amount of redevelopment that occurs if it is allowed.
Proposition 1: If 𝛼�𝑛 > 𝛼0, then total redevelopment is optimal only if heights are below
a threshold that is lower than ℎ0∗ −𝑐(ℎ0∗)
𝐵+𝑎0+𝛿𝐴 and that threshold is falling with 𝛼�𝑛, and partial
redevelopment will be optimal only if heights are below a threshold that is lower than ℎ𝑚𝑎𝑥(𝛼�𝑛)
and that threshold is also falling with 𝛼�𝑛. If 𝛼�𝑛 > 𝛼0, then optimal levels of redevelopment will
always be lower than the competitive level of redevelopment.
7

If 𝛼�𝑛 < 𝛼0, total redevelopment is optimal as long as heights are below a threshold that is
greater than ℎ0∗ −𝑐(ℎ0∗)
𝐵+𝑎0+𝛿𝐴, and that threshold is also falling with 𝛼�𝑛.
This proposition captures the time path of post-war housing policy in many American
cities. In the immediate post-war period, the policy concern was blight: the existence of many
neighborhoods that had low heights and low levels of aesthetic values. Redevelopment was
perceived as being socially optimal but not privately optimal, at least for small scale developers.
In some cases, the problem appears to have been coordination, as evidence by the role for that
very large developers, like Metropolitan Life, played in shifting entire communities. In other
cases, there may have been city-wide externalities that were internalized by the action.
Yet over time, redevelopment claimed areas with higher and higher aesthetic levels,
particularly in areas with high demand for density, like the old Penn Station. This led to a switch
in public policy from working on market failure number one (too little redevelopment of low
amenity areas) to market failure number two (too much redevelopment of high amenity areas).
If the government cannot control heights, but only has the freedom to restrict or not
restrict the overall condition for restricting development is (𝐵𝑛 + 𝛼0 + 𝛿𝐴)�ℎ0∗ − ℎ�� − 𝑐(ℎ0∗) <
(𝛼� − 𝛼0)�ℎ� + 𝛿𝑆� > 0, which can be operationalized as a criterion for allowing redevelopment.
The ex post price times the change in heights minus the cost of new construction must be greater
than the change in local values due to redevelopment times the old height plus the city-level
externality of the change. The total externality is (𝛼� − 𝛼0)�ℎ� + 𝛿𝑆�.
Restrictions on redevelopment only make sense in areas where 𝛼�𝑛 > 𝛼0. If initial height
levels are moderate enough so that redevelopment is partial, then the property owners who don’t
redevelop are worse off (their unit prices have fallen), but since all property owners must be
indifferent between redeveloping or not, then all property owners are worse off. This implies
that if redevelopment is partial in these settings, then a ban is better than the unfettered market,
although it could well be that a more limited redevelopment is better than either of those
outcomes. In settings, where unfettered development is complete, then it is unclear whether
banning development is better than total redevelopment.
Banning redevelopment is also less attractive in areas with higher density levels. The
shorter the initial buildings, the higher the minimum amenity cutoff for preserving a district
8
should be. The optimal strategy also depends on the state of the city. A more attractive city
means that the level of redevelopment should be greater.
Our next proposition guides our empirical work, which focuses on the price and quantity
impacts of preservation district. We now ask what the a ban on redevelopment will do local land
prices, housing unit prices, and quantities of new construction, as a function of initial height
levels and amenity levels:
Proposition 2: If redevelopment would not have happened anyway, because initial
heights are high, than preservation districts have no impact. If initial heights are lower and
𝛼�𝑛 < 𝛼0, then preservation districts will reduce construction, units prices and total real estate
value. Preservation will reduce unit prices and total real estate value by less if if initially
amenity levels are higher; preservation will decrease total real estate values less if initial heights
are higher. If 𝛼�𝑛 > 𝛼0 and ℎ𝑚𝑎𝑥(𝛼�𝑛) > ℎ�𝑛, then preservatio will reduce construction and
raise unit prices, especially if 𝛼�𝑛 is higher. If ℎ𝑚𝑎𝑥(𝛼�𝑛) > ℎ�𝑛 > ℎ0∗ −𝑐(ℎ0∗)
𝐵+𝑎0+𝛿𝐴, then the negative
impact on the district construction will be higher if initial heights are lower or amenities are
lower, and total real estate values will always be increased by the district. If ℎ�𝑛 < ℎ0∗ −𝑐(ℎ0∗)
𝐵+𝑎0+𝛿𝐴,
then the preservation can cause total real estate values to fall.
Preservation districts will raise unit prices if the initial aesthetic level of the area is higher
than the typical level for new construction, but will lower unit prices otherwise. This statement
looks only at the value of units for use, and doesn’t consider that unit prices also capture the
option of rebuilding, which is better captured by our comparative statics on total real estate value.
Still, if initial aesthetics are sufficiently low, preservation also destroy total value. If initial
aesthetic levels are higher, preservation can increase value, both for the unit and total real estate.
Preservation is most likely to destroy value when initial heights are sufficiently low, at least
relative to the maximum build-out that is possible in New York.
It is also true that the districts are more likely to reduce value in areas that have a non-
aesthetic appeal, for those are the areas where added density is most likely to be value. Overall,
there are a range of neighborhoods for which local property values would be higher than those
that would solely maximize local land values. As such, for higher amenity areas preservation
increases property values, but for low amenity areas, preservation reduces property values. The
overall effect becomes an empirical matter.
9

2.1. Heterogeneous Preferences for Neighborhoods
We now introduce individual heterogeneity, but simplify along other dimensions. We
assume that there is a supply of individuals with heterogeneous tastes for living in the
neighborhood. We will not address cross neighborhood tastes and assume that all the inhabitants
of one neighborhood are deciding only between the reservation locale and that particular area.
The term 𝐵𝑛 (S), now refers to the preference of the marginal resident of the city, and it satisfies
𝑆 = ∫ 𝑞(𝐵𝑛𝑗)𝑑𝐵𝑖
∞𝐵𝑛𝑗𝐵𝑛(𝑆) , where 𝑞(𝐵𝑛
𝑗) refers to the number of individuals with preference level 𝐵𝑖.
The overall return from residing in an area still equals 𝐵𝑛(𝑆) + 𝛼𝑛 + 𝛿𝐴. We now assume that
there are only two possible heights ℎ and ℎ. There are 𝑁𝑛𝑒𝑤 new neighborhoods, with amenity
levels 𝛼0 , and height ℎ. There is a distribution of old neighborhoods which all have height ℎ
and are characterized by a density of amenity levels 𝑓(𝛼). The cost of redeveloping is “c” per
land unit which increases the height from ℎ to ℎ. We assume that (𝐵𝑛(𝑆) + 𝛼0 + 𝛿𝐴)�ℎ − ℎ� >
𝑐, so total redevelopment is always an equilibrium outcome for every neighborhood, and partial
redevelopment is never an equilibrium outcome without government interference. If 𝛼 > 𝑐ℎ−ℎ
−
𝐵𝑛(𝑆) − 𝛿𝐴, then redevelopment is the only free market equilibrium outcome.
We consider two alternative welfare functions. The first maximizes solely the property
values in the city; the second maximizes global welfare. The difference is whether the city
internalizes the welfare of marginal residents.
Proposition 3: Whether the government internalizes the welfare of its citizens or just
property values, redevelopment will only be allowed into neighborhoods with amenity levels that
fall below an amenity threshold. In either case, the threshold will be rising with 𝛼0 and ℎ and
falling with c and ℎ. If the government maximizes property values the threshold will also be
falling with 𝑞�𝐵𝑛(𝑆)�, but not if the government maximizes property values plus resident
welfare. If the government maximizes resident welfare the threshold will be higher. If the
government can set the level of development, the desired level will always be lower, if the
government does not internalize the welfare of its residents.
10
This perturbation of the model examines the gap in the interests between property owner
interests and the interests of residents. Property owners benefit more from preservation than
renters because preservation pushes property values up for two reasons. Values rise because of
rising amenities, which is a benefit shared by renters, and value rise because supply is restricted,
which does nothing to help renters. As such, a government that maximizes total property values
will typically be more restrictive than a government that maximizes total welfare, both in
mandating too much preservation and in allowing too little development, when it controls that
amount of redevelopment. Essentially, this proposition emphasizes that preservation districts,
like all building restrictions, can push prices up by restricting supply in a monopolistic fashion
that does not enhance welfare.
3. Preserving Historic Neighborhoods in New York City
Nowhere in the United States have the debates about historic preservation received
greater attention than in New York City. The creation of the city’s Landmarks Preservation
Commission (LPC) in 1965 followed several decades of activism in New York City to preserve
historically valuable landmarks and neighborhoods (Wood 2008). Threats to the neighborhood
of Brooklyn Heights from the construction of the Brooklyn-Queens Expressway, along with the
demolition of the Beaux Arts Penn Station, galvanized the creation of the Commission. In late
1965, the Commission designated Brooklyn Heights as the city’s first historic district. Within
five years, the Commission designated fourteen additional historic neighborhoods across the city,
including Greenwich Village in Manhattan, Cobble Hill in Brooklyn, and Mott Haven in the
Bronx. Between 1965 and 2009 – the final year of data available at the time of this analysis –
the LPC designated exactly one hundred historic neighborhoods in New York City, and approved
thirteen extensions to the original boundaries of historic districts. By 2012, the LPC has
designated another 20 districts.
As Table 1 shows, nearly sixty percent of historic districts are located in Manhattan, but
the LPC has designated districts in each of the five boroughs. Slightly more than 25 percent of
districts are located in Brooklyn, and slightly fewer than 10 percent of historic districts are
located in the Bronx. In total, 4.8 percent of residential units in New York City are located
within historic districts, and 11.8 percent of residential units in Manhattan.3 Since 1965, the
3 Analysis from the Furman Center (see Been et al., 2011)
11
amount of land included in historic districts has grown faster in the outer boroughs than in
Manhattan. Table 1 also shows the designations of historic district by decade. It confirms a
relatively stable pace of designation since the establishment of the Landmarks Preservation
Commission, with an uptick in landmark designations during the 2000s.
The historic districts we study range substantially in size and scope. Some of the smallest
districts encompass only a handful of lots, while many of the larger districts include scores of
blocks encompassing some of the city’s most revered neighborhoods. The Sniffen Court
Historic District, located on the east side of Manhattan, consists of ten Romanesque Revival
stables, making it one of the smallest districts in the city. By contrast, the Upper East Side
Historic District includes portions of more than fifty blocks, encompassing much of what is
colloquially known as the Upper East Side. The recent designation of the Perry Avenue Historic
District as the city’s one-hundredth historic district underscores the City’s interest in designating
a range of neighborhood types. Located in the Bedford Park neighborhood of the Bronx, the
Perry Avenue Historic District includes nine historic homes dating back to the early twentieth
century.
3.1. The Process of Designating a Historic District
Although the designation of historic districts in New York City is clearly not exogenous,
it is not always driven by neighborhood property owners. In many cases, historic preservation
advocates are heavily involved. The process of designating a historic district involves several
steps, which are described in detail in Appendix B.4 In brief, proposals from community leaders
and preservation advocates usually trigger the process, which then involves review of such
“requests for evaluation” by a committee that includes the Chair of the LPC and various staff
members. That committee can then elect to send a particular proposal on to the full LPC, and if
so, the LPC first decides, in a public meeting, whether to “calendar” the proposal. If the
proposal is calendared, the LPC then holds a public hearing, at which the LPC staff present the
proposal, and property owners and other interested parties are given an opportunity to testify or
4 The authority for the following description is provided in Appendix A, and includes the N.Y.C. Charter § 3020; N.Y.C. Admin. Code §§ 25-302, 25-303, and 25-313; Rules of the City of New York, Title 63, Landmarks Preservation Commission Rules 1-02, 1-01 (July 2003); NEW YORK CITY LANDMARKS PRESERVATION COMMISSION, FAQs: The Designation Process, http://www.nyc.gov/html/lpc/html/faqs/faq_designation.shtml (last visited October 13, 2011); and HISTORIC DISTRICTS COUNCIL, Preserving Your Historic Neighborhood: New York City Designation Process, http://www.hdc.org/preservingnyc.htm (last visited October 12, 2011).
12
submit written comments. Should the LPC choose to designate a district, which it almost always
does, the designation becomes effective immediately, but the LPC must file a “designation report”
with the City Council, the City Planning Commission (CPC), and other city agencies for
comment. The CPC is required to hold another public hearing on the proposed district, and to
file a report on the proposal with the City Council. The City Council then may modify or reject
the proposed district by majority vote. The mayor may veto a modification or rejection of the
LPC’s decision, and only a vote of two thirds of the City Council will over-ride the veto.
3.2. The Restrictions Designation Imposes
The designation of a historic district triggers a special review process for requests for
building construction and modification that may affect the level of investment and the value of
properties in historic districts. In brief, if the owner of a building within a historic district wants
to make any repairs or improvements to her building, the owner must first secure the same
alteration permit from the Department of Buildings (DOB) that would be required for any
construction work on a building anywhere in the city that goes beyond “ordinary” repairs and
maintenance.5 In addition to obtaining permits from the Department of Buildings, the owner of
property within a historic district must request and receive one of three determinations from the
Landmarks Preservation Commission: (1) a “permit for minor work,” (2) a “certificate of no
effect,” or (3) a “certificate of appropriateness.” At the extreme, if a certificate of
appropriateness is required, the owner’s request will be the subject of a public hearing, and the
LPC will consider how the proposed work will affect the exterior architectural features of the
building, and “the relationship between the results of such work and the exterior architectural
features of other, neighboring improvements” in the historic district.6 The approval process is
described in detail in Appendix C.
In addition to requiring approval for alteration work that the property owner wants to
perform, the LPC imposes an affirmative obligation that the owners of property within historic
districts maintain and repair “all exterior portions” of the buildings, as well as all interior
5 In New York City, the Department of Buildings issues three types of alteration permits: A1 permits are issued for alterations which require a new certificate of occupancy, including converting a single-family home into a multi-family residence; A2 permits are issued for multiple types of work (e.g., plumbing and construction), but do not require a certificate of occupancy; and A3 permits are issued for a single type of work that does not involve an amendment to the certificate of occupancy. 6 N.Y.C. Admin. Code § 25-307(b)(1).
13
portions which, if not maintained, may “cause the exterior portions” to “deteriorate, decay or…
fall into a state of disrepair.”7 There is little evidence that this requirement is strictly enforced,
however.
4. Empirical Approaches
Identifying the effect historic district designations have on residential property values is
methodologically challenging, as the selection of neighborhoods for historic designation is not
random. It is possible – even likely – that the characteristics of properties located in
neighborhoods designated as historic districts differ from properties in other neighborhoods in
unmeasured ways. For example, properties located in historic districts could include
ornamentation or other architectural features not captured in our hedonic regression analyses. If
so, we should be concerned that location within a historic district is actually picking up
unobserved property characteristics, rather than any effect of designation itself.
Further, trends in market conditions in neighborhoods designated as historic districts may
differ from those in other neighborhoods. For example, residents may put more pressure on
officials to designate their neighborhoods as historic districts when their property values are
rising. If so, then any association between designation and property value appreciation may
simply reflect these underlying trends and not be attributable to the designation itself.
Conversely, preservation officials may believe that designating areas that are in need of
revitalization as historic districts will help promote investment in those neighborhoods (or will
help protect the city’s investment in those areas). In both these situations, any association
between designation and changes in property values may reflect underlying trends in demand
rather than the effects of the designation itself.
Finally, the designation of a historic district may be accompanied by a variety of other
changes that may affect property values. In many jurisdictions, for example, designation entitles
the property owner to tax subsidies or reductions or waivers of fees (Econsult 2010). Those
changes may offset or otherwise confound the effects that the designation itself may have on
property values.
Most efforts to evaluate the impact of historic district designations on property values use
standard hedonic price regression, controlling for basic structural attributes of a property and
7 Id.
14
neighborhood characteristics. These hedonic analyses of historic districts generally suggest that
location within a historic district is associated with a premium on property values (Ford 1989;
Liechenko, Coulson & Listokin 2001; Coulson and Lahr 2005; Mason 2005; Noonan 2007;
Gilderbloom, Hanka and Ambrosius 2009; Carruthers, Clark and Tealdi 2010; Rypkema and
Cheong 2011). One such study focuses on some Brooklyn neighborhoods between 1974 and
2002, reporting higher mean sales prices within historic districts (Treffeisen 2003).
Many hedonic analyses of the price effects of historic districts rely on cross-sectional
data (or do not have access to prices of properties in districts before designation), and as such,
cannot control for unmeasured differences between properties inside and outside of districts.
The few recent studies that use longitudinal data find that designation has a negligible or even
negative effect on property values. For example, a recent longitudinal analysis of historic
districts in Boston indicates that historic districts depress prices (Heintzelman and Altieri 2011),
suggesting that restrictions imposed on property owners outweigh the benefits of historic districts.
Similarly, in a recent study of historic conservation areas in England, Ahlfeldt, Holman and
Wendland (2012) find that prices are generally higher within conservation areas, but that
designation itself fails to lead to any statistically significant boost in values.8 Finally, Noonan
and Krupka (2011), after instrumenting for historic district designations, find that designation
leads to a significant decline in prices.
Our paper extends previous research in several ways. First, following our model, we test
for heterogeneous impacts across markets, which is made possible by New York’s large number
and variety of historic districts. Second, our dataset contains far more property sales transactions
than earlier studies, relying on more than one million residential property sales in New York City.
With access to such a large longitudinal data set, we are able to estimate a difference-in-
difference regression model to weed out pre-existing differences between properties located in
historic districts and those outside. Further, the 35-year time-span of our data enables us to
observe property sales and permitting activity decades after designation, allowing us to make
claims about the long-term implications of historic district designations. Third, we study how the
designation of historic districts affects the sales prices of properties that are located just outside a
8 Of course, the rules governing historic districts in England differ from those governing districts in the United States.
15
district.9 Finally, we study the impact historic district designation has on new construction
activity, thus providing a fuller account of how districts shape local housing markets.
5. Data and Methods
Our analysis includes two components: the impact of historic designation on new housing
construction within districts and the impact of designation on the sales price of residential
properties across different neighborhoods. We outline the data and methods for each below.
5.1. Data
The first part of our analysis examines the construction of new units in historic districts.
For this portion of the analysis, we restrict the sample to lots in census tracts that included at
least one parcel within a historic district as of 2009. (We exclude districts designated earlier than
1990.) For each historic district, we define the area to include all lots located within the census
tract(s) in which the historic district is located. Furthermore, we divide each historic district area
into two zones: properties that are part of the historic district itself (district zone), and those
located just outside the district but still within the same census tract (bordering zone). To
calculate the number of new units created in each of the zones in our sample, we rely on
information reported on building age in 2009 tax assessment data from the Real Property
Assessment Database (RPAD) described below. Specifically, we create a longitudinal dataset,
which records the number of new units constructed annually between 1990 and 2009, separately
for each historic district itself and for the set of properties in its bordering zone.
Next, to estimate the impact of historic district designations on residential sales prices in
New York City, we combine several administrative datasets. First, we use data on all residential
property transactions in the city between 1974 and 2009. We limit the sample to arms-length
sales. Furthermore, the analysis of sales data is restricted to the 32 community districts in New
York that contained at least one lot in a historic district by 2009. Second, we merge the
residential property transactions data with annual cross-sections of the Real Property Assessment
Database (RPAD), an administrative data set gathered for the purpose of assessing property taxes.
RPAD contains such property characteristics as lot size, building age, square footage and
9 Noonan and Krupka (2011) come the closest to studying such border effects. They examine whether property values rise with the proportion of properties in block-group that are in a historic district. We are able to measure such border effects more precisely, using GIS.
16
building classification. We match each transaction to property characteristics from the closest
available year in RPAD.10
Although RPAD includes many characteristics of individual residential properties, it does
not indicate whether a property is located within a historic district. For that information, we rely
on the Primary Land Use Tax Lot Output (PLUTO) data. The PLUTO dataset includes one
record for each tax lot in New York City. It includes an indicator identifying whether the lot is
located within a historic district, allowing us to differentiate residential property transactions that
occur within and outside of historic districts. Because PLUTO includes the name of the historic
district, we are able to match historic districts to their date of designation using administrative
data from the Landmarks Preservation Commission. Thus, we can identify whether residential
property transactions within a district occur before or after the designation of the historic district.
Using GIS methods, we are also able to identify properties that lie within 250 feet of a historic
district boundary (buffer properties). For the properties in our study, Table 2 compares the
characteristics of properties that were located within a historic district by the end of our study
period (2009) with those located outside of historic districts.
To test for heterogeneity in impacts in neighborhoods where redevelopment is more
valuable, we rank all community districts in our sample based on a series of measures that
capture the value of redevelopment. For each of these measures, we create an indicator variable
to identify properties located in community districts that fall above the median district in the
sample. By interacting this dummy variable with the set of historic district variables in our
model, we are able to test whether impacts vary by neighborhood. For these tests, we rank
community districts using five measures. The first is average maximum floor-area ratio (FAR),
calculated as maximum residential square footage permitted by zoning regulations divided by the
total area of land zoned for residential use, both as of 2003. This measure reports, on average,
the amount of residential building space that can be constructed on a square foot of land. The
second measure is average unused FAR, which equals the aggregate maximum residential square
footage permitted by zoning regulations minus the actual square footage of all residential
buildings that existed as of 2003, divided by the total area of land zoned for residential use as of
10 The earliest available year of RPAD is 1990. As a result, property characteristics for residential sales before 1990 are matched to property characteristics in the 1990 version of RPAD. But most of the characteristics are relatively fixed and should not change much over time.
17
2003.11 Third, we measure the ex ante value of newly built housing in the community district:
specifically, the median price per square foot in buildings that were no more than 10 years old at
the time of sale, using information from sales occurring 1974-1990. Our fourth measure is the ex
ante dollar value of maximum FAR, which is simply average maximum FAR in the community
district (measure 1) multiplied by the past value of new housing (measure 3). The fifth and final
measure is the dollar value of unused FAR, which is the product of average unused FAR
(measure 2) and the value of new housing (measure 3).
6. Methods
6.1. New Construction Analysis
To estimate impacts on new construction activity, we estimate a difference-in-difference
model in which the dependent variable captures the number of new units built in zone z in area a
in year t. As discussed above, each historic district area contains two zones: the "district" zone
(properties within a district as of 2009) and the "bordering" zone (properties outside the district
but within a census tract that includes a parcel in the district). Specifically, we estimate the
following equation:
(1) NUzat = α + γa Wa + δt It + θ HDz + ρ Postat + ψ HD_Postzat + εzt,
where NUzat measures the number of new units constructed in zone z in area a in year t; Wa is a
set of historic district area fixed effects; It is a set of year fixed effects; HDz is a dummy variable
indicating whether the zone is a historic district (the comparison group therefore consists of
properties located in the same historic district area, but in the bordering zone); Postat is a
dummy variable that captures whether the particular historic district associated with area a has
been designated; and HD_Postzat is an interaction between the HD dummy and the Post dummy.
The key coefficient is that on the interaction term, which will capture the average difference
between the change in the number of new units constructed in districts after designation and the
change taking place in the bordering zone. We assume that absent designation, construction
11 Ideally, we would like to measure FAR as of the time directly preceding the beginning of our sample period. However, existing data sources do not permit calculation of FAR prior to 2003. We calculate FAR measures using the 2003 PLUTO database, which reports several key pieces of information at a property level: lot area, maximum FAR permitted by zoning, and building square footage.
18

activity would have increased by the same amount as it did in the bordering zones. In an
alternative specification, we also include variables to capture the 250-foot buffer zone
surrounding the district, and thus the comparison area becomes parcels in bordering zones that
are both outside the district and outside the buffer zone.
6.2. Price Analysis
To identify the impact historic district designation has on prices, our basic approach is to
compare prices of properties in historic districts to prices of comparable properties that are
outside the boundaries of a district, but still located in the same neighborhood (census tract).
Then we examine whether the magnitude of this difference changes after the formal designation
of the historic district – and changes in ways that aren’t captured by broader neighborhood trends
in prices. This approach weeds out any systematic, baseline differences between the properties
chosen for designation and other properties around the city. It also allows us to disentangle the
specific effects of the historic designation from the many other changes occurring across
neighborhoods in the city.
We estimate a hedonic regression of the price of residential property using the following
model:
(2) lnPicdt = α + β Xit + γc Wc + δdt Idt + θ HDit + εit,
where lnPicdt is the log of the sales price per unit of property i in census tract c, in community
district d, and in quarter t; Xit is a vector of property-related characteristics, including the
building age, square footage, the number of buildings on the lot, and a series of building
classification dummies (described in Table 2); Wc are a series of census tract fixed effects; Idt are
a series of dummy variables indicating the quarter and community district of the sale, which
allow us to control for trends in prices within the community district;12 and HDit is our vector of
historic district variables. The coefficients to be estimated are α, β, γ, δ and θ, and ε is an error
term. We report standard errors clustered at the parcel level and corrected for both spatial and
temporal autocorrelation.
12 There are 59 community districts in New York City, but our sample is limited to the 32 community districts containing at least one lot in a historic district.
19
Within the vector HD, we include the variable HistoricDistrictEver, which is a dummy
variable that takes a value of “1” if the sale is located within the boundary of an area that is or
will be designated as a historic district. This variable captures baseline, unmeasured differences
between properties located within historic districts and comparable properties outside of them.
We also include the variable HistoricDistrictPost, which takes a value of “1” if the sale took
place inside a historic district after the district was designated by the LPC. This coefficient
captures the impact of designation. Because we have sales in our dataset that predate designation
by up to 40 years, we also include a dummy variable for sales that take place more than 10 years
prior to designation, as we think those sales are too distant to meaningfully capture baseline, pre-
designation conditions. With this variable included, the counterfactual becomes the price level
in the 10 years prior to designation, and the coefficient on the HistoricDistrictPost variable can
be interpreted as the average difference in prices within a district after designation and prices ten
years before.
The vector HD includes two continuous variables to allow the effect of the designation of
historic districts to vary over time. The variable TimePost equals the number of years after the
designation of a historic district that the sale took place, while the variable TimePostSQ is the
square of the number of years after the designation that a sale took place. The TimePost variable
is coded “0” for sales that took place before the designation of a historic district, and for
properties outside the boundaries of a historic district.
District designation is not random. The process of designation is complex, and citywide
advocates play an outsized role in New York City in leading designation efforts. But property
owners clearly play a role too. It is possible, for example, that property owners push for
designation more vigorously when they believe that their neighborhoods are likely to appreciate.
Or they might also push harder for designation when they are fearful of neighborhood decline.
While we recognize that we can never fully address endogeneity concerns, we are able to
examine price trends in districts prior to designation to test and control for any evident trends.
We can also estimate models that use only properties that are in areas that have not yet but will
become historic districts as a comparison group. To do so, we restrict sample to properties that
are in areas that will become historic districts and simply test for significance of
HistoricDistrictPost coefficient.
In some models, the vector HD also includes a series of dummy variables to indicate
whether the property is within 250 feet of the boundary of a historic district. The variable
20
BufferEver takes the value of “1” if the property is within 250 feet of a historic district boundary,
either before or after designation. We use 250 feet as our buffer because it is about the length of
one north/south block on Manhattan’s gridded streets.13 As with the variables for historic
districts, this variable captures baseline differences in the sales prices of properties located within
buffer zones and comparable properties beyond those zones. Likewise, the variable BufferPost
takes the value of “1” if the property sale took place within the buffer zone after the district was
designated by the LPC. In Figure 2, we include maps of two historic districts – the Greenpoint
Historic District in Brooklyn and the Mount Morris Historic District in Manhattan – to illustrate
the construction of buffer zones around each district. In the models that include buffer zone
variables, we also include continuous variables TimePostBuffer and TimePostBufferSQ that
allow the spillover effects into the adjacent buffer zones to vary over time.
To test the predictions of the theory above, we examine heterogeneity across community
districts by separately interacting our historic district variables with each of five indicators
identifying whether a property is located in a community district that falls above the median
district in the sample for development capacity or cost. Again, these indicators are: average
maximum floor-area ratio, or FAR, in the community district; average unused FAR; median
price per square foot for newly built housing; the dollar value of maximum FAR; and the dollar
value of unused FAR.
Finally, we also run additional robustness tests. First, we run models with both a smaller
and larger comparison group. To go smaller, we replace census tract fixed effects with
blockgroup fixed effects. On the one hand, the blockgroup approach is appealing because it
allows us to compare price appreciation of properties just inside district with the appreciation of
those just outside. On the other hand, we expect properties just outside the districts to be
affected by designation, so this very narrow comparison group is arguably tainted. Indeed, one
could argue that even census tracts are too small. Census tracts are relatively small in New York
City, especially in Manhattan, and thus the number of comparison properties that are outside the
historic district but still within the same census tract is relatively small for some historic districts
– and will largely comprise the buffer properties. Thus we also estimate our models with zip
code fixed effects, which expand the number of comparison properties.
13 We also estimated buffer models with 500-foot buffers rather than 250-foot buffer zones. The results were highly similar.
21
Second, we run a series of models using the calendaring date, rather than the date of
designation, as our indicator of historic district status. As noted in a previous section,
calendaring occurs before the historic district is designated, but typically indicates that a
neighborhood is receiving consideration for historic designation.
7. Results
We begin the analysis by asking how historic designation affects new construction
activity in the district. Even if our primary interest lies in prices, it is important to first test
whether historic designation does indeed impact redevelopment and new supply. In Table 3, the
pattern of coefficients suggests that designation has a significant negative impact on the amount
of new housing construction. Historic districts had less new building even before designation,
which suggest the value of controlling for pre-existing levels. After designation the number of
new units per year drops by about 14 in the city as a whole (column 1) and 22 in Manhattan
(column 3). This represents a drop of 21 percent of a standard deviation in the outcome variable
for the citywide result, and a drop of 24 percent of a standard deviation for Manhattan. Effects
appear somewhat larger in the alternative specifications in which the comparison area includes
parcels in bordering zones that are both outside the district and outside the buffer zone. Of
course, this simple model does not answer whether the designation of districts reduced supply
overall in New York City, as we do not know if the impacts we find result from construction
decreasing in the district after designation or from construction actually increasing in the
bordering area. At the very least, the results suggest that district designation affects decisions
about where to build. Less new construction takes place in historic districts after they are
designated.
Our key question is how that reduced construction affects the value of properties within
and just outside of districts. The results of the first hedonic regression model are reported in
Table 4, first for the citywide sample (columns 1-3) and then for Manhattan properties only
(column 4). The models reported in columns 1 and 2 omit any TimePost variables. In these
simple specifications, the coefficient on HistoricDistrictPost can be interpreted as the average
effect of designation over the post-designation period. In model 1, this coefficient captures the
average effect over the 10-year period following designation, while in model 2 this coefficient
provides an estimate of the average effect over the entire post-designation period. Models 3 and
4 include TimePost and TimePostSQ variables, allowing the impact to vary over time. In these
22

models, the coefficient on HistoricDistrictPost can be interpreted as the change in property
values that occurs immediately after designation.
The estimated coefficients on the structural variables have expected signs. Sales price
per unit is significantly higher for single-family, detached homes (omitted category) than for
two-family homes, condominiums, and larger apartment buildings. In addition, sales prices are
higher when building and lot space is larger and when buildings include garages. The one
counter-intuitive result is the coefficient on the pre-war building dummy variable, which is
negative, counter to what many assume is a premium placed on pre-war buildings in New York
City. This result only holds when the historic district variables are included however, suggesting
the historic district variables may be capturing the premium usually associated with pre-war
buildings.
After controlling for other structural characteristics, properties located in areas that are or
will become historic districts sell for approximately 20 percent more than comparable properties
outside those districts. This is consistent with the presence of property and community
characteristics, including historic ornamentation or architectural styles, which make properties in
historic neighborhoods more desirable, even absent designation.
The coefficient on HistoricDistrictPost in columns 1 and 2 suggests that designation
itself also has an added, positive effect on prices of properties within a district. When examining
the average effect over the ten-year period following designation (column 1), the designation of a
historic district generates a 9.5 percent boost in sales prices relative to comparable properties
outside the district but still in the same neighborhood. Over the entire post-designation period,
the impact of designation is somewhat higher, at 14.8 percent (column 2).
When TimePost variables are added, the coefficient on HistoricDistrictPost falls in
magnitude and loses significance, but the coefficient on the TimePost variable in column 3
indicates that designation leads to increases in value over time. To better understand how any
designation effect evolves over time, we also estimate a more flexible model that includes a
categorical indicator for each year since the district was designated. These coefficients are
plotted in Figure 3, together with the trends generated from the regression coefficients in Table 4
(column 3). Panel A of Figure 3 shows that following the designation of a historic district,
property values within the district rise steadily, relative to similar properties. Significantly, the
pre-designation coefficients reveal no apparent trend in values prior to designation, providing no
23

evidence that residents living in areas experiencing rapid appreciation (or depreciation) are more
likely to request and obtain designation.
Column 4 of Table 4 shows the same model for Manhattan, and panel B of Figure 3 plots
the coefficients for this Manhattan-only model. The baseline differences in price between
properties in historic districts and those outside the district but in the same neighborhood are
larger in Manhattan compared to the other boroughs. In Manhattan, properties located in areas
that are or will become historic districts sell for 33 percent more than comparable properties
outside those districts. However, the actual designation of districts appears, if anything, to have a
negative effect on property values, though the coefficient on the HistoricDistrictPost coefficient
is not statistically significant. We further probe this Manhattan effect in models exploring
heterogeneous effects below.
Recognizing potential concerns about the endogeneity of historic district designations, we
estimate a subsequent model limiting our analysis to the sample of properties located in a historic
district by 2009. In this model, we use future historic districts in the borough as our comparison
group. The sample includes only the 32,264 residential property transactions that occur in a
historic district, either before or after the district was designated. Consistent with the previous
analysis, Table 5 reports no immediate impact of historic designations on property values in the
citywide sample, but finds that values quickly start to rise after the designation occurs.
To identify spillover effects into a 250-foot buffer of historic districts, Table 6 shows the
coefficients of a citywide model that includes indicators for BufferEver and BufferPost, as well
as the corresponding TimePost coefficients. The coefficients on the historic district variables
change only slightly compared to those displayed in Table 4, suggesting that results are not
particularly sensitive to the inclusion (or exclusion) of buffer properties in the comparison group.
However, results for these citywide models show that prior to designation, properties bordering
historic districts sell for 3.7 or 5.5 percent less than comparable properties further from the
district. This negative finding could reflect unobserved differences in structural features of
property located just outside of historic districts, or lower levels of investment in those properties.
In the model without TimePost controls (model 1), the actual designation of a historic district
leads to an 11.9 percent increase in the average value of these bordering properties – a
substantial bump for properties located just beyond the districts. When we allow impacts in the
buffer area to vary over time (model 2), we see little in the way of immediate impacts, but we see
rising prices over time.
24
In Appendix D, we report several robustness tests for the models in Tables 4 and 6, as
described in the previous section of the paper. In brief, Tables D1 and D2 show that results are
very similar when we include zip code fixed effects rather than census tract fixed effects. Again,
we find positive results citywide and negative impacts in Manhattan. And once again, we find
that designation increases the value of properties in the buffer zones, though it takes 3-4 years to
see those positive impacts in Manhattan. When we use the date of calendaring rather than
designation as our date of the start of treatment, we obtain similar results, though effects are
more muted and here we find an initial negative hit to property values upon calendaring, which
grows more positive over time after designation (see Table D3).
7.1. Heterogeneous Effects
The model suggested that the preservation would destroy more value in areas with
relatively short buildings and areas where there is robust demand for more space. We explore
these implications in Table 7. The pattern of coefficients displayed in Table 7 suggests that
designation has a more negative effect in neighborhoods where redevelopment would be more
valuable, as hypothesized.
In New York City, the relevant issue is whether preservation limited the ability to build
up, which suggested our focus on feasible additions to height, as determined by the maximum
allowable floor area ratio. We find that the impact of designation on property values is more
negative in community districts where the average floor-area ratio is higher and where the value
of the unused development capacity is higher. In columns 1 and 2, the impact of historic
designation is more negative in places with higher average maximum FAR and higher average
unused FAR, signaling that the lost option of redevelopment is larger. Because property owners
could build taller and more valuable buildings in these areas, the value of the foregone option to
develop is greater.
Likewise, in community districts where the median price per square foot is higher or the
value of the FAR – either the maximum FAR or the unused FAR – is higher, the impact of
historic designation is more negative (columns 3-5). We interpret these results as reflecting the
impact of fundamental demand for the neighborhood, which determines the costs of restricting
more housing supply. These results are again consistent with our theoretical model suggesting
that effects of designation will be more negative in areas, like Manhattan, where the lost option
value of redevelopment is higher. Alternatively, in areas like Manhattan, it appears that the hit to
25
land values outweighs the boost to structure values, because land values comprise such a large
share of total property values (Ellen and Gedal 2012).
8. Conclusion
This paper sheds new light on the effects of the designation of historic districts on local
housing markets, revealing that impacts vary with market conditions. Consistent with the
predictions of our theory, we find that designation results in a larger increase to property values
in community districts where the value of foregone development potential is lower. Also
consistent with theory, the act of designating historic districts appears to offer a boost to the
value of properties immediately outside the historic district. Properties located in the immediate
vicinity of a district sell at a discount relative to nearby properties, but the designation of a
district leads to an increase in their prices.
While we cannot fully address endogeneity concerns, we experiment with a few
alternative controls, and are reassured by the lack of clear price trends leading up to designation.
Further, the difference in the results in Manhattan and the rest of the city suggest that a simple
selection bias cannot be driving our full story.
As for supply effects, our analysis suggests that new construction activity within districts
falls after designation. Admittedly, our results do not answer whether the designation of
districts reduced supply overall in New York City, as we do not know if the impacts we find
result from construction decreasing in the district after designation or from construction actually
increasing in the surrounding area. At the very least, the results suggest that district designation
affects decisions to build.
The designation of historic districts has stirred controversy in cities across the country.
Our results suggest that the designation of districts can shape the course of local housing markets,
but that the effects vary across neighborhoods, consistent with our theoretical predictions. We
also find some evidence of a decline in investments in the construction of buildings within
historic districts over the long run. Significantly, however, our results do not capture the external
benefits that historic properties provide for society as a whole. Still, as policymakers consider
whether and how to preserve historic neighborhoods, our analysis underscores the need to take
the particular neighborhood environment into account and to consider the long-term impact
historic designations have on both property values and investment in housing within and just
outside of the districts.
26
References: Ahlfeldt, Gabriel M. and Wolfgang Maennig. 2010. “Substitutability and Complementarity of Urban Amenities: External Effects of Built Heritage in Berlin.” Real Estate Economics 38(2):285-323. Ahlfeldt, Gabriel M. and Alexandra Mastro. 2011. Valuing Iconic Design: Frank Lloyd Wright Architecture in Oak Park, Illinois. Working Paper from the Spatial Economics Research Center, London School of Economics. Ahlfeldt, Gabriel M., Nancy Holman and Nicolai Wendland (2012). “An assessment of the effects of conservation areas on value.” English Heritage, London, United Kingdom. Available at ://www.english-heritage.org.uk/content/imported-docs/a-e/assessment-ca-value.pdf Asabere, Paul K., George Hachey, and Steven Grubaugh. 1989. "Architecture, Historic Zoning, and the Value of Homes." Journal of Real Estate Finance and Economics 2: 181-195. Asabere, Paul K., and Forrest E. Huffman. 1991. "Historic Districts and Land Values." Journal of Real Estate Research 6:1-7. Asabere, Paul K., Forrest E. Huffman, and Seyed Mehdian. 1994. "The Adverse Impacts of Local Historic Designation: The Case of Small Apartment Buildings in Philadelphia." Journal of Real Estate Finance and Economics 8:225-234. Been, Vicki, Caitlyn Brazil, Samuel Dastrup, Ingrid Gould Ellen, John Infranca, Simon McDonnell, Max Weselcouch and Michael Williams. 2011. “State of New York City’s Housing and Neighborhoods.” A publication of the Furman Center for Real Estate & Urban Policy, New York University. Byrne, Peter J. 2012. Historic Preservation and its Cultured Despisers: Reflections on the Contemporary Role of Preservation Law in Urban Development. Georgetown Public Law and Legal Theory Research Paper No. 12-021. Carruthers, John I., David E. Clark and Michael Tealdi. 2010. The Demand for Historic Preservation. Working Paper 2010-02, College of Business Administration, Marquette University. Coulson, N. Edward, and Michael L. Lahr. 2005. "Gracing the Land of Elvis and Beale Street: Historic Designation and Property Values in Memphis." Real Estate Economics 33:487-507. Coulson, N. Edward, and Robin M. Leichenko. 2001. "The Internal and External Impact of Historic Designation on Property Values." The Journal of Real Estate Finance and Economics 23:113-124. Econsult Corp. 2010. The Economic Impact of Historic Preservation in Philadelphia. Available at http://www.preservephiladelphia.org/wp-content/uploads/Econ_Report_Final.pdf
27
Ellen, Ingrid Gould, and Michael Gedal. 2012. “Valuing Urban Land: Comparing the Use of Teardown and Vacant Land Sales.” Unpublished manuscript. Ford, Deborah Ann. 1989. "The Effect of Historic District Designation on Single-Family Home Price." Real Estate Economics 17:353-362. Glaeser, Edward L. 2010. “Preservation Follies.” City Journal 20(2). Gilderbloom, John I., Matthew J. Hanka and Joshua D. Ambrosius. 2009. “Historic preservation’s impact on job creation, property values and environmental sustainability.” Journal of Urbanism: International Research on Placemaking and Urban Sustainability 2(2): 83-101. Heintzelman, Martin D. and Jason A. Altieri. 2011. Historic Preservation: Preserving Value? Journal of Real Estate and Economics. The Historic Tax Credit Coalition. 2012. Third Annual Report on the Economic Impact of the Federal Historic Tax Credit. Report from the National Trust Community Investment Corporation and the Edward J. Bloustein School of Planning and Public Policy, Rutgers University. Leichenko, Robin M., N. Edward Coulson, and David Listokin. 2001. "Historic Preservation and Residential Property Values: An Analysis of Texas Cities." Urban Studies 38:1973-1987. Mason, Randall F. 2005. “Economics and Historic Preservation: A Guide and Review of the Literature.” Published by The Brookings Institution. Available at http://www.brookings.edu/~/media/research/files/reports/2005/9/metropolitanpolicy%20mason/20050926_preservation. Mason, Randall F. 2002. “Assessing Values in Conservation Planning: Methodological Issues and Choices.” Published in de la Torre, Marta, ed. Assessing the Values of Cultural Heritage. 2002. Available at http://www.getty.edu/conservation/publications_resources/pdf_publications/assessing.pdf Mourato, Susana & Massimiliano Mazzanti. 2002. “Economic Valuation of Cultural Heritage: Evidence and Prospects.” Published in de la Torre, Marta, ed. Assessing the Values of Cultural Heritage. 2002. Available at http://www.getty.edu/conservation/publications_resources/pdf_publications/assessing.pdf Narwold, Andrew, Jonathan Sandy, and Charles Tu. 2008. "Historic Designation and Residential Property Values." International Real Estate Review 11:83-95. Noonan, Douglas S. 2007. "Finding an Impact of Preservation Policies: Price Effects of Historic Landmarks on Attached Homes in Chicago, 1990-1999." Economic Development Quarterly 21:17-33. Noonan, Douglas S. and Douglas J. Krupka. 2011. “Making – or Picking – Winners: Evidence of Internal and External Price Effects in Historic Preservation Policies.” Real Estate Economics 39(2): 379-407.
28

Pogrebin, Robin. 2008. “An Opaque and Lengthy Road to Landmark Status.” New York Times, November 25, 2008. Rickman, Dan S. 2009. “Neighborhood Historic Preservation Status and Housing Values in Oklahoma County, Oklahoma.” Journal of Regional Analysis and Policy 39(2): 99-108. Rose, Carol. 1981. “Preservation and Community: New Directions in the Law of Historic Preservation.” Stanford Law Review 22(2):473 –XX.
Rypkema, Donovan, Caroline Cheong and Randall Mason. 2011. Measuring Economic Impacts of Historic Preservation. Available at http://www.achp.gov/docs/economic-impacts-of-historic-preservation-study.pdf Schaeffer, Peter V., and Cecily Ahern Millerick. 1991. "The Impact of Historic District Designation on Property Values: An Empirical Study." Economic Development Quarterly 5:301-312. Stipe, Robert E. 1971. “Why Preserve Historic Resources?” Published in Legal Techniques In Historic Preservation. Treffeisen, Alan. 2003. “The Impact of Historic Districts on Residential Property Values.” New York City Independent Budget Office Background Paper, available at http://www.ibo.nyc.ny.us/iboreports/HistoricDistricts03.pdf. Verrey, Robert and Laura Henley. 1991. “Creation Myths and Zoning Boards: Local Uses of Historic Preservation.” Published In The Politics Of Culture 94 (Brett Williams ed.). Wood, Anthony C. 2008. Preserving New York: Winning the Right to Protect a City's Landmarks. New York City: Routledge. Zahirovic-Herbert, Velma and Karen M. Gibler. 2012. Historic District Influence on House Prices and Marketing Duration. Journal of Real Estate Finance and Economics.
29
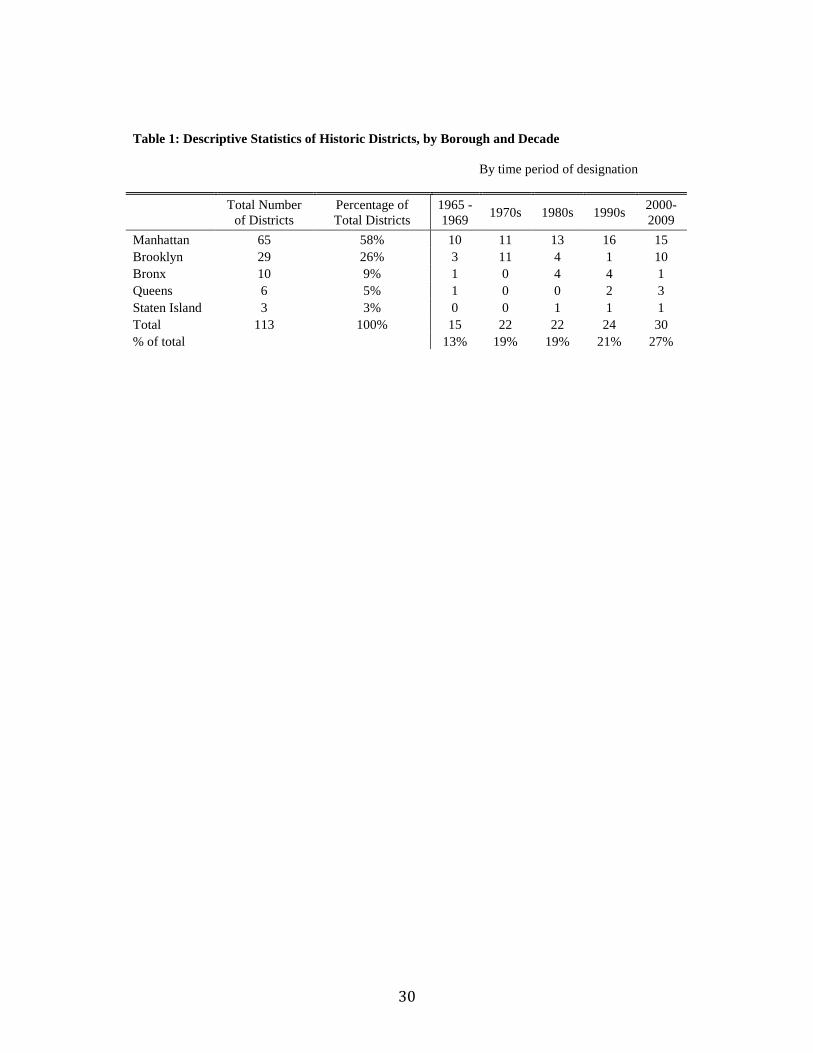
Table 1: Descriptive Statistics of Historic Districts, by Borough and Decade By time period of designation
Total Number of Districts
Percentage of Total Districts
1965 - 1969 1970s 1980s 1990s 2000-
2009 Manhattan 65 58% 10 11 13 16 15 Brooklyn 29 26% 3 11 4 1 10 Bronx 10 9% 1 0 4 4 1 Queens 6 5% 1 0 0 2 3 Staten Island 3 3% 0 0 1 1 1 Total 113 100% 15 22 22 24 30 % of total 13% 19% 19% 21% 27%
30

Table 2: Descriptive Statistics of Residential Property Transactions, 1974-2009
Properties in a Historic District (2009)
Properties not in a Historic
District (2009)
Number of sales Total 32,264 416,290 Sale occurred after designation 23,862 - Sale occurred in 0-250 ft. buffer - 17,071 Lot area (sq. ft.) 7,758 13,758 Building area (sq. ft.) 4,043 2,962 Corner 0.054 0.080 Irregular 0.109 0.113 Garage 0.045 0.267 Altered 0.117 0.042 Building age 75.034 56.431 Pre-War 0.668 0.473 Building class Single-family detached 0.127 0.192 Single-family attached 0.045 0.118 Two-family home 0.140 0.211 Three-family home 0.066 0.060 Four-family home 0.041 0.020 Five/six-family home 0.026 0.017 More than six families, no elevator 0.040 0.029 Walk-up, units not specified 0.082 0.017 Elevator apt bldg, coop 0.010 0.003 Elevator apt bldg, not coop 0.020 0.011 Loft building 0.006 0.001 Condominium, SF attached 0.038 0.008 Condominium, walk-up apartments 0.020 0.044 Condominium, elevator building 0.309 0.242 Condominium, miscellaneous 0.004 0.001 Multi-use, single family with store 0.005 0.004 Multi-use, two-family with store 0.008 0.012 Multi-use, three-family with store 0.004 0.003 Multi-use, 4+ family with store 0.008 0.007
Notes: The sample is limited to arms-length sales in the 32 community districts in New York City that contained at least one lot in a historic district by 2009.
31
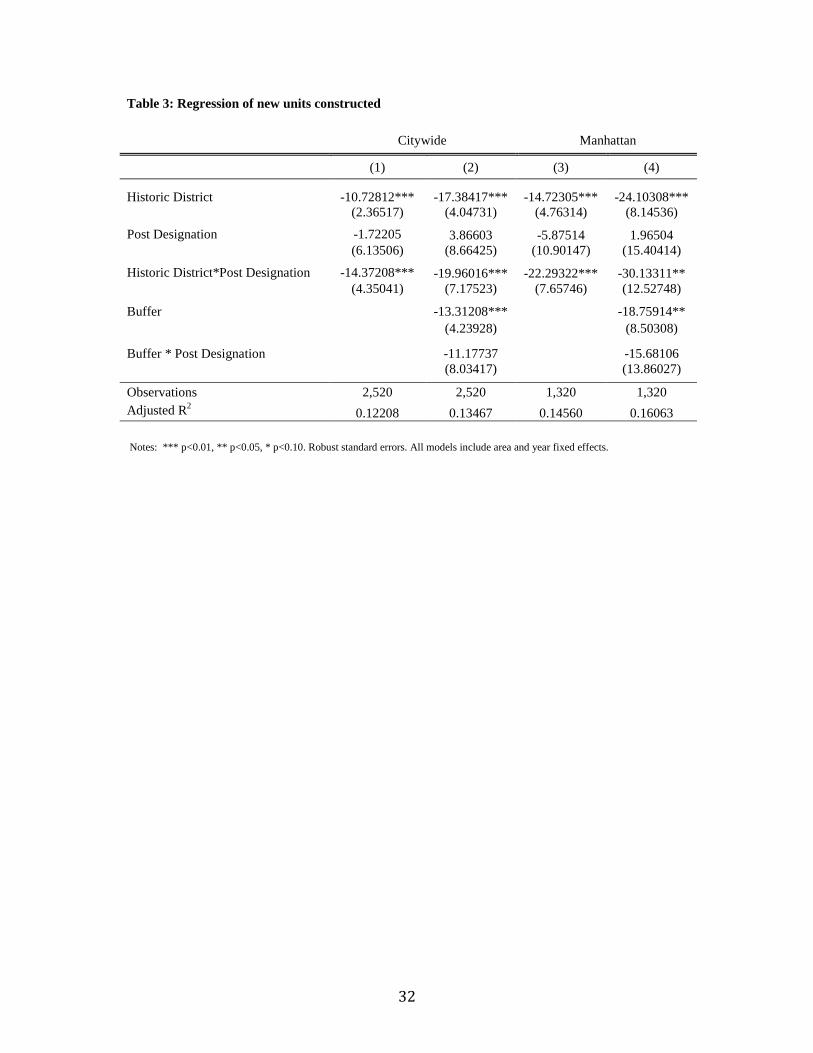
Table 3: Regression of new units constructed
Citywide Manhattan
(1) (2) (3) (4)
Historic District -10.72812*** -17.38417*** -14.72305*** -24.10308*** (2.36517) (4.04731) (4.76314) (8.14536)
Post Designation -1.72205 3.86603 -5.87514 1.96504 (6.13506) (8.66425) (10.90147) (15.40414)
Historic District*Post Designation -14.37208*** -19.96016*** -22.29322*** -30.13311** (4.35041) (7.17523) (7.65746) (12.52748)
Buffer -13.31208*** -18.75914** (4.23928) (8.50308)
Buffer * Post Designation -11.17737 -15.68106 (8.03417) (13.86027)
Observations 2,520 2,520 1,320 1,320 Adjusted R2 0.12208 0.13467 0.14560 0.16063
Notes: *** p<0.01, ** p<0.05, * p<0.10. Robust standard errors. All models include area and year fixed effects.
32
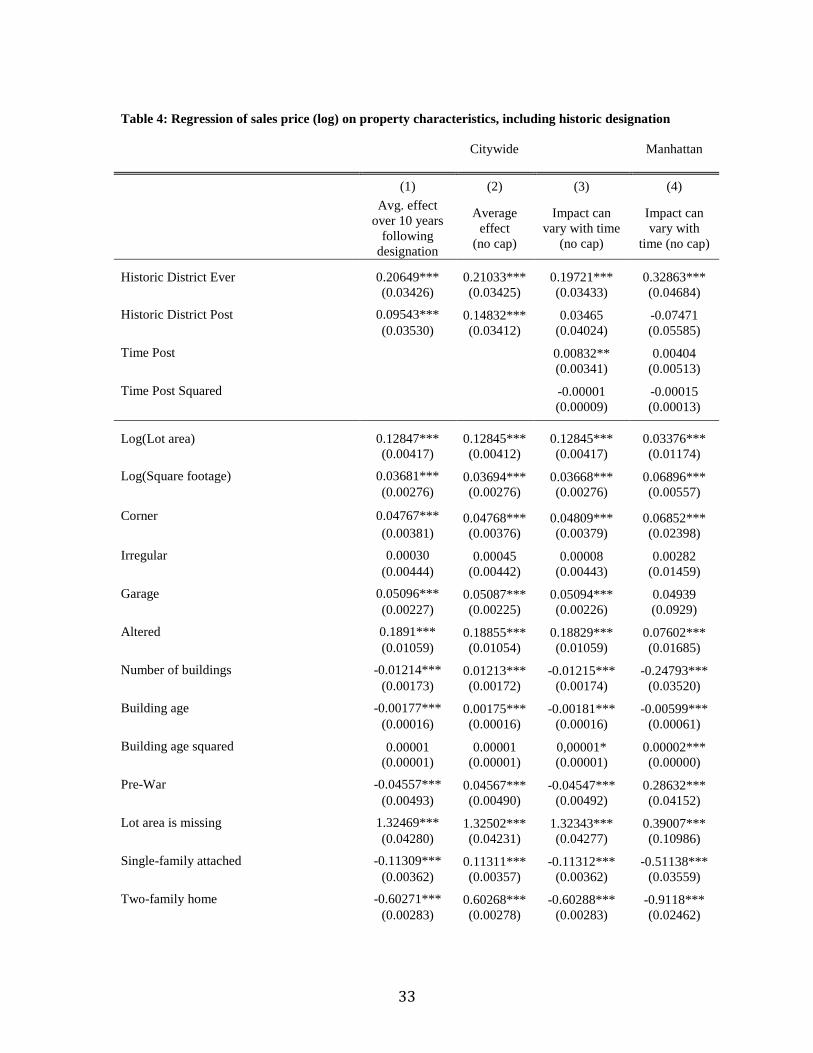
Table 4: Regression of sales price (log) on property characteristics, including historic designation
Citywide Manhattan
(1) (2) (3) (4)
Avg. effect over 10 years
following designation
Average effect
(no cap)
Impact can vary with time
(no cap)
Impact can vary with
time (no cap)
Historic District Ever 0.20649*** 0.21033*** 0.19721*** 0.32863*** (0.03426) (0.03425) (0.03433) (0.04684)
Historic District Post 0.09543*** 0.14832*** 0.03465 -0.07471 (0.03530) (0.03412) (0.04024) (0.05585)
Time Post 0.00832** 0.00404 (0.00341) (0.00513)
Time Post Squared -0.00001 -0.00015 (0.00009) (0.00013)
Log(Lot area) 0.12847*** 0.12845*** 0.12845*** 0.03376*** (0.00417) (0.00412) (0.00417) (0.01174)
Log(Square footage) 0.03681*** 0.03694*** 0.03668*** 0.06896*** (0.00276) (0.00276) (0.00276) (0.00557)
Corner 0.04767*** 0.04768*** 0.04809*** 0.06852*** (0.00381) (0.00376) (0.00379) (0.02398)
Irregular 0.00030 0.00045 0.00008 0.00282 (0.00444) (0.00442) (0.00443) (0.01459)
Garage 0.05096*** 0.05087*** 0.05094*** 0.04939 (0.00227) (0.00225) (0.00226) (0.0929)
Altered 0.1891*** 0.18855*** 0.18829*** 0.07602*** (0.01059) (0.01054) (0.01059) (0.01685)
Number of buildings -0.01214*** 0.01213*** -0.01215*** -0.24793*** (0.00173) (0.00172) (0.00174) (0.03520)
Building age -0.00177*** 0.00175*** -0.00181*** -0.00599*** (0.00016) (0.00016) (0.00016) (0.00061)
Building age squared 0.00001 0.00001 0,00001* 0.00002*** (0.00001) (0.00001) (0.00001) (0.00000)
Pre-War -0.04557*** 0.04567*** -0.04547*** 0.28632*** (0.00493) (0.00490) (0.00492) (0.04152)
Lot area is missing 1.32469*** 1.32502*** 1.32343*** 0.39007*** (0.04280) (0.04231) (0.04277) (0.10986)
Single-family attached -0.11309*** 0.11311*** -0.11312*** -0.51138*** (0.00362) (0.00357) (0.00362) (0.03559)
Two-family home -0.60271*** 0.60268*** -0.60288*** -0.9118*** (0.00283) (0.00278) (0.00283) (0.02462)
33
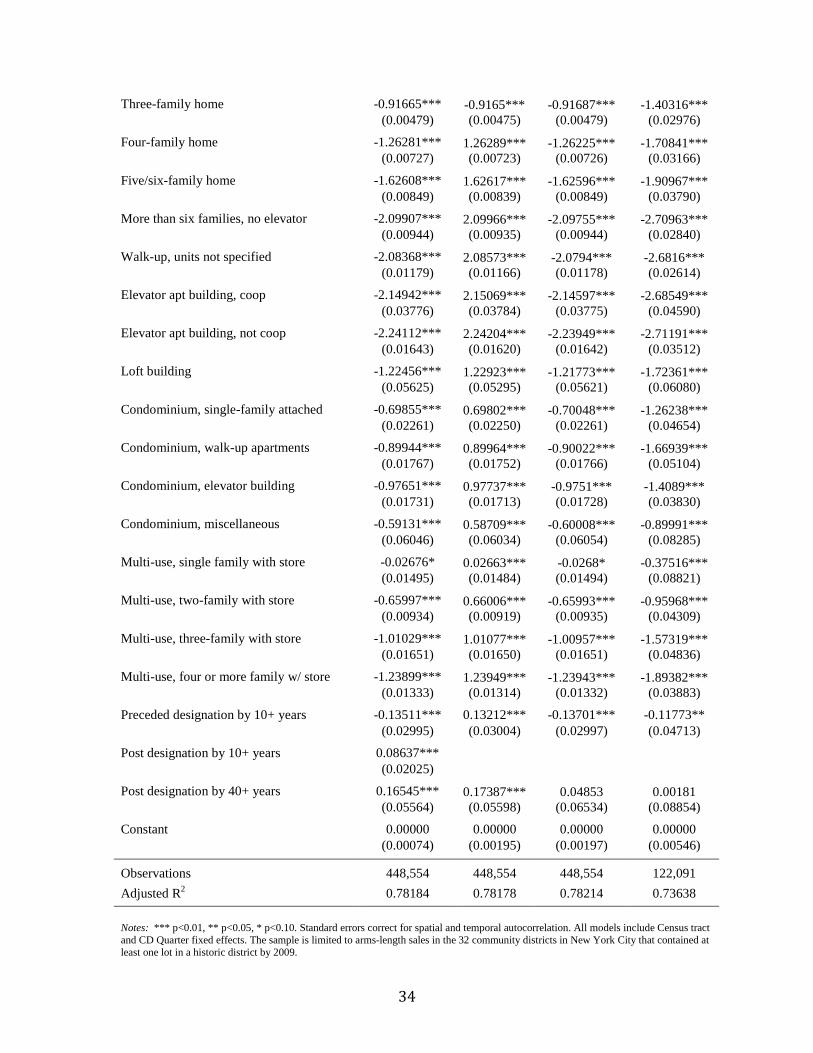
Three-family home -0.91665*** -0.9165*** -0.91687*** -1.40316*** (0.00479) (0.00475) (0.00479) (0.02976)
Four-family home -1.26281*** 1.26289*** -1.26225*** -1.70841*** (0.00727) (0.00723) (0.00726) (0.03166)
Five/six-family home -1.62608*** 1.62617*** -1.62596*** -1.90967*** (0.00849) (0.00839) (0.00849) (0.03790)
More than six families, no elevator -2.09907*** 2.09966*** -2.09755*** -2.70963*** (0.00944) (0.00935) (0.00944) (0.02840)
Walk-up, units not specified -2.08368*** 2.08573*** -2.0794*** -2.6816*** (0.01179) (0.01166) (0.01178) (0.02614)
Elevator apt building, coop -2.14942*** 2.15069*** -2.14597*** -2.68549*** (0.03776) (0.03784) (0.03775) (0.04590)
Elevator apt building, not coop -2.24112*** 2.24204*** -2.23949*** -2.71191*** (0.01643) (0.01620) (0.01642) (0.03512)
Loft building -1.22456*** 1.22923*** -1.21773*** -1.72361*** (0.05625) (0.05295) (0.05621) (0.06080)
Condominium, single-family attached -0.69855*** 0.69802*** -0.70048*** -1.26238*** (0.02261) (0.02250) (0.02261) (0.04654)
Condominium, walk-up apartments -0.89944*** 0.89964*** -0.90022*** -1.66939*** (0.01767) (0.01752) (0.01766) (0.05104)
Condominium, elevator building -0.97651*** 0.97737*** -0.9751*** -1.4089*** (0.01731) (0.01713) (0.01728) (0.03830)
Condominium, miscellaneous -0.59131*** 0.58709*** -0.60008*** -0.89991*** (0.06046) (0.06034) (0.06054) (0.08285)
Multi-use, single family with store -0.02676* 0.02663*** -0.0268* -0.37516*** (0.01495) (0.01484) (0.01494) (0.08821)
Multi-use, two-family with store -0.65997*** 0.66006*** -0.65993*** -0.95968*** (0.00934) (0.00919) (0.00935) (0.04309)
Multi-use, three-family with store -1.01029*** 1.01077*** -1.00957*** -1.57319*** (0.01651) (0.01650) (0.01651) (0.04836)
Multi-use, four or more family w/ store -1.23899*** 1.23949*** -1.23943*** -1.89382*** (0.01333) (0.01314) (0.01332) (0.03883)
Preceded designation by 10+ years -0.13511*** 0.13212*** -0.13701*** -0.11773** (0.02995) (0.03004) (0.02997) (0.04713)
Post designation by 10+ years 0.08637*** (0.02025)
Post designation by 40+ years 0.16545*** 0.17387*** 0.04853 0.00181 (0.05564) (0.05598) (0.06534) (0.08854)
Constant 0.00000 0.00000 0.00000 0.00000 (0.00074) (0.00195) (0.00197) (0.00546)
Observations 448,554 448,554 448,554 122,091 Adjusted R2 0.78184 0.78178 0.78214 0.73638
Notes: *** p<0.01, ** p<0.05, * p<0.10. Standard errors correct for spatial and temporal autocorrelation. All models include Census tract and CD Quarter fixed effects. The sample is limited to arms-length sales in the 32 community districts in New York City that contained at least one lot in a historic district by 2009.
34
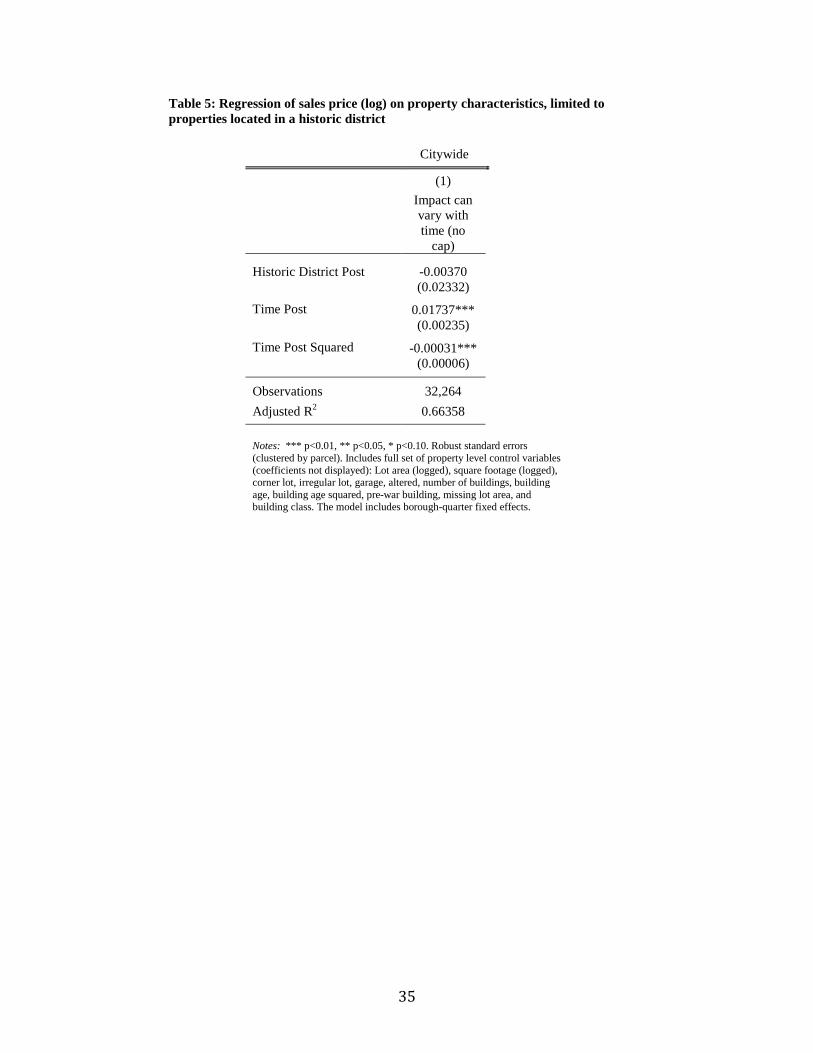
Table 5: Regression of sales price (log) on property characteristics, limited to properties located in a historic district
Citywide
(1)
Impact can vary with time (no
cap)
Historic District Post -0.00370 (0.02332)
Time Post 0.01737*** (0.00235)
Time Post Squared -0.00031*** (0.00006)
Observations 32,264 Adjusted R2 0.66358
Notes: *** p<0.01, ** p<0.05, * p<0.10. Robust standard errors (clustered by parcel). Includes full set of property level control variables (coefficients not displayed): Lot area (logged), square footage (logged), corner lot, irregular lot, garage, altered, number of buildings, building age, building age squared, pre-war building, missing lot area, and building class. The model includes borough-quarter fixed effects.
35
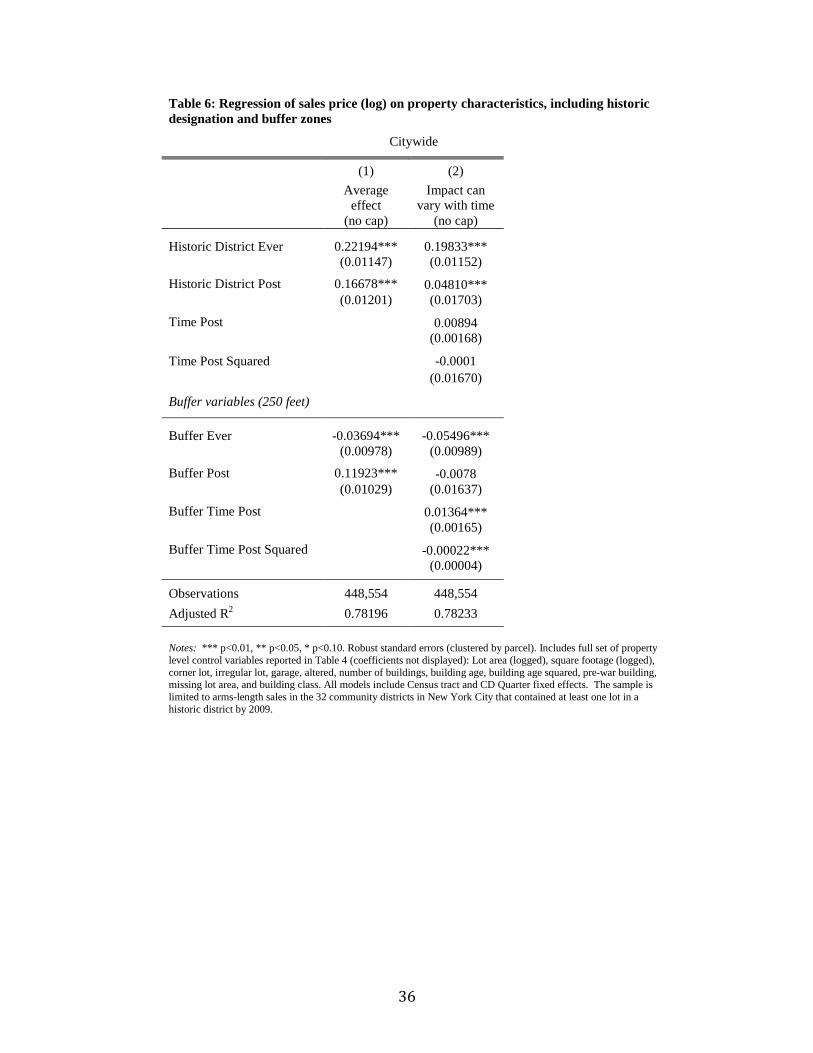
Table 6: Regression of sales price (log) on property characteristics, including historic designation and buffer zones
Citywide
(1) (2)
Average effect
(no cap)
Impact can vary with time
(no cap)
Historic District Ever 0.22194*** 0.19833*** (0.01147) (0.01152)
Historic District Post 0.16678*** 0.04810*** (0.01201) (0.01703)
Time Post 0.00894 (0.00168)
Time Post Squared -0.0001 (0.01670)
Buffer variables (250 feet)
Buffer Ever -0.03694*** -0.05496*** (0.00978) (0.00989)
Buffer Post 0.11923*** -0.0078 (0.01029) (0.01637)
Buffer Time Post 0.01364*** (0.00165)
Buffer Time Post Squared -0.00022*** (0.00004)
Observations 448,554 448,554 Adjusted R2 0.78196 0.78233
Notes: *** p<0.01, ** p<0.05, * p<0.10. Robust standard errors (clustered by parcel). Includes full set of property level control variables reported in Table 4 (coefficients not displayed): Lot area (logged), square footage (logged), corner lot, irregular lot, garage, altered, number of buildings, building age, building age squared, pre-war building, missing lot area, and building class. All models include Census tract and CD Quarter fixed effects. The sample is limited to arms-length sales in the 32 community districts in New York City that contained at least one lot in a historic district by 2009.
36
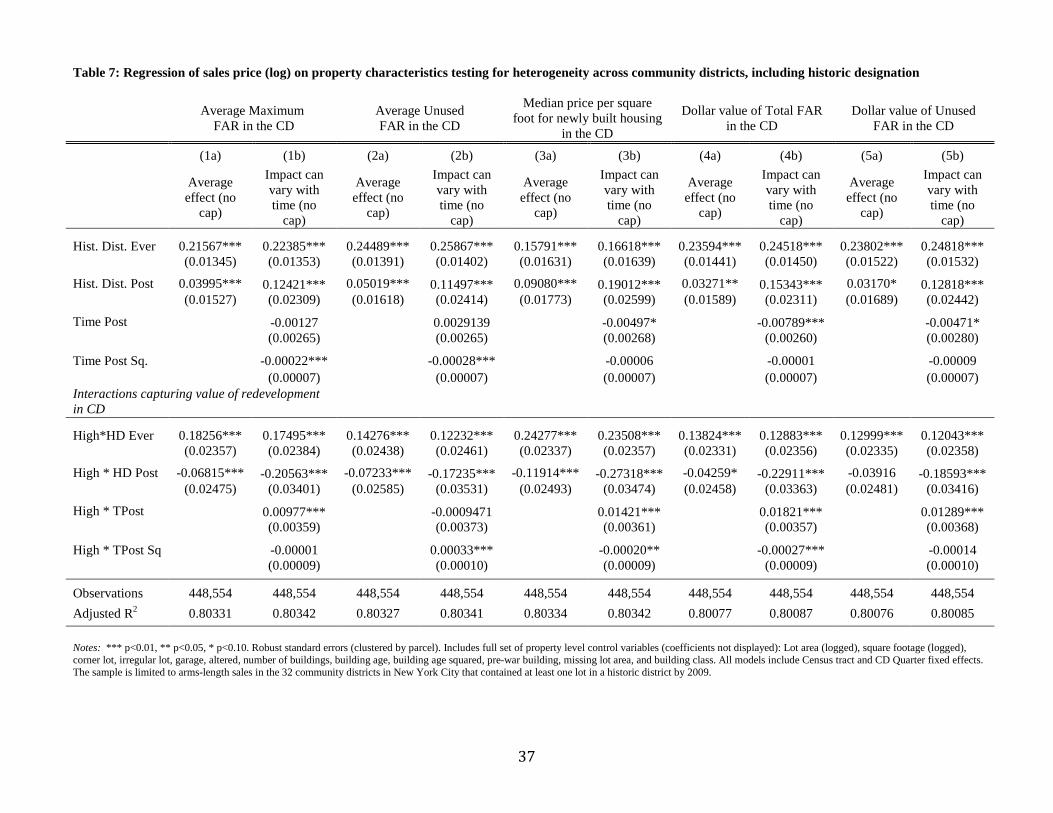
Table 7: Regression of sales price (log) on property characteristics testing for heterogeneity across community districts, including historic designation
Average Maximum FAR in the CD
Average Unused FAR in the CD
Median price per square foot for newly built housing
in the CD
Dollar value of Total FAR in the CD
Dollar value of Unused FAR in the CD
(1a) (1b) (2a) (2b) (3a) (3b) (4a) (4b) (5a) (5b)
Average effect (no
cap)
Impact can vary with time (no
cap)
Average effect (no
cap)
Impact can vary with time (no
cap)
Average effect (no
cap)
Impact can vary with time (no
cap)
Average effect (no
cap)
Impact can vary with time (no
cap)
Average effect (no
cap)
Impact can vary with time (no
cap)
Hist. Dist. Ever 0.21567*** 0.22385*** 0.24489*** 0.25867*** 0.15791*** 0.16618*** 0.23594*** 0.24518*** 0.23802*** 0.24818*** (0.01345) (0.01353) (0.01391) (0.01402) (0.01631) (0.01639) (0.01441) (0.01450) (0.01522) (0.01532)
Hist. Dist. Post 0.03995*** 0.12421*** 0.05019*** 0.11497*** 0.09080*** 0.19012*** 0.03271** 0.15343*** 0.03170* 0.12818*** (0.01527) (0.02309) (0.01618) (0.02414) (0.01773) (0.02599) (0.01589) (0.02311) (0.01689) (0.02442)
Time Post -0.00127 0.0029139 -0.00497* -0.00789*** -0.00471* (0.00265) (0.00265) (0.00268) (0.00260) (0.00280)
Time Post Sq. -0.00022*** -0.00028*** -0.00006 -0.00001 -0.00009 (0.00007) (0.00007) (0.00007) (0.00007) (0.00007) Interactions capturing value of redevelopment in CD
High*HD Ever 0.18256*** 0.17495*** 0.14276*** 0.12232*** 0.24277*** 0.23508*** 0.13824*** 0.12883*** 0.12999*** 0.12043*** (0.02357) (0.02384) (0.02438) (0.02461) (0.02337) (0.02357) (0.02331) (0.02356) (0.02335) (0.02358)
High * HD Post -0.06815*** -0.20563*** -0.07233*** -0.17235*** -0.11914*** -0.27318*** -0.04259* -0.22911*** -0.03916 -0.18593*** (0.02475) (0.03401) (0.02585) (0.03531) (0.02493) (0.03474) (0.02458) (0.03363) (0.02481) (0.03416)
High * TPost 0.00977*** -0.0009471 0.01421*** 0.01821*** 0.01289*** (0.00359) (0.00373) (0.00361) (0.00357) (0.00368)
High * TPost Sq -0.00001 0.00033*** -0.00020** -0.00027*** -0.00014 (0.00009) (0.00010) (0.00009) (0.00009) (0.00010)
Observations 448,554 448,554 448,554 448,554 448,554 448,554 448,554 448,554 448,554 448,554 Adjusted R2 0.80331 0.80342 0.80327 0.80341 0.80334 0.80342 0.80077 0.80087 0.80076 0.80085
Notes: *** p<0.01, ** p<0.05, * p<0.10. Robust standard errors (clustered by parcel). Includes full set of property level control variables (coefficients not displayed): Lot area (logged), square footage (logged), corner lot, irregular lot, garage, altered, number of buildings, building age, building age squared, pre-war building, missing lot area, and building class. All models include Census tract and CD Quarter fixed effects. The sample is limited to arms-length sales in the 32 community districts in New York City that contained at least one lot in a historic district by 2009.
37
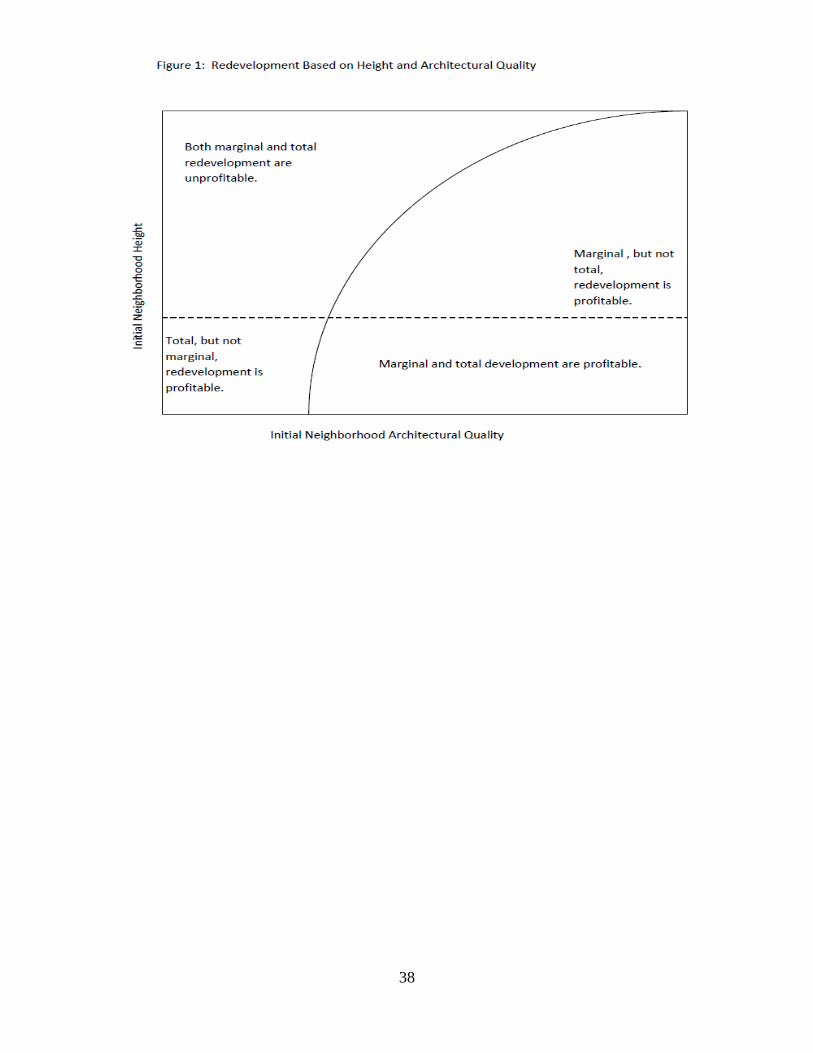
38
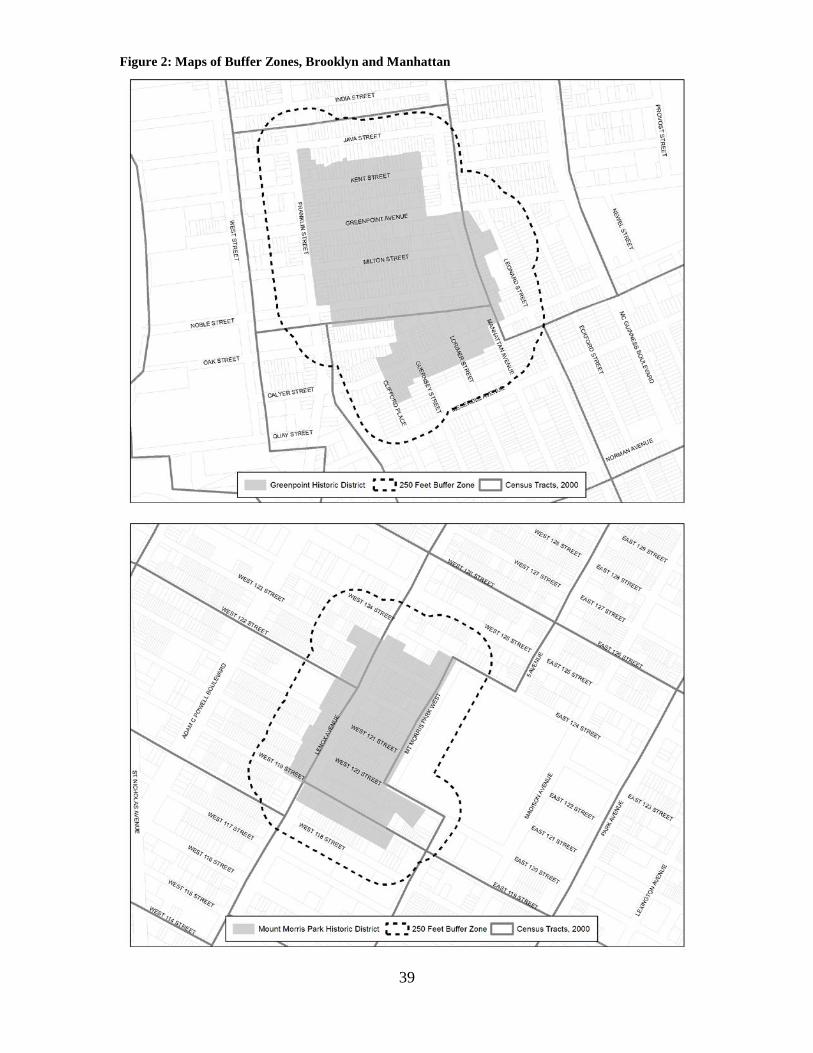
Figure 2: Maps of Buffer Zones, Brooklyn and Manhattan
39
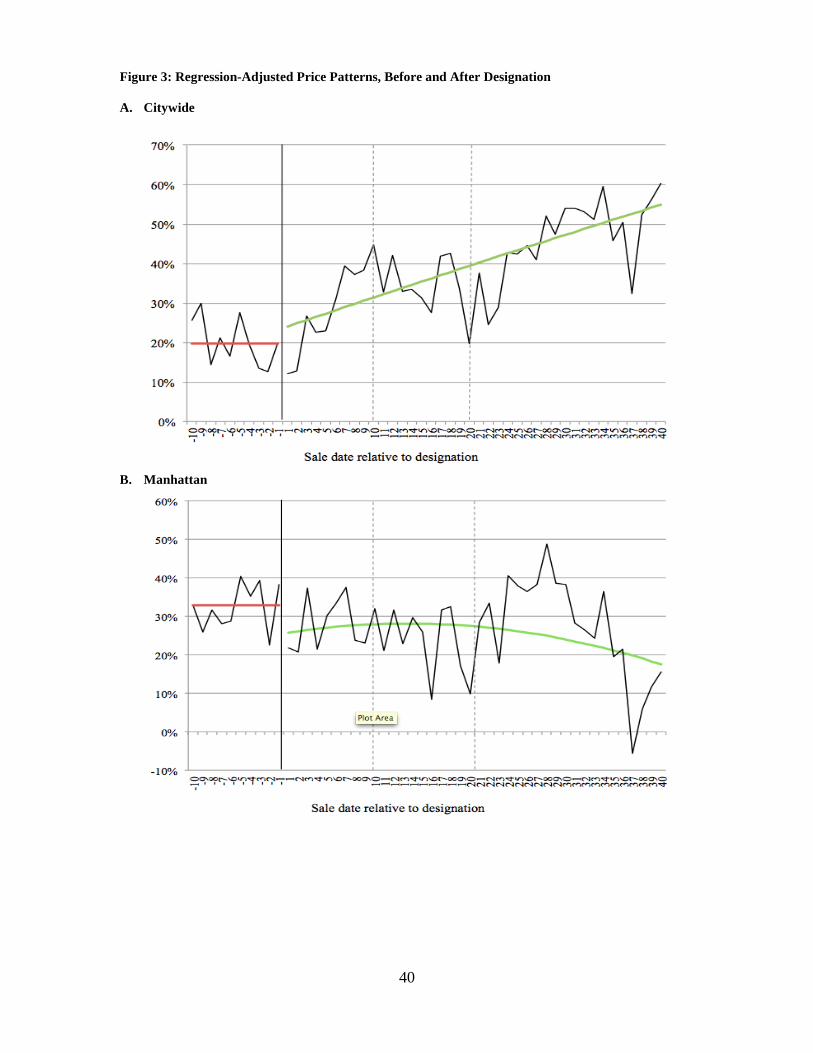
Figure 3: Regression-Adjusted Price Patterns, Before and After Designation A. Citywide
B. Manhattan
40
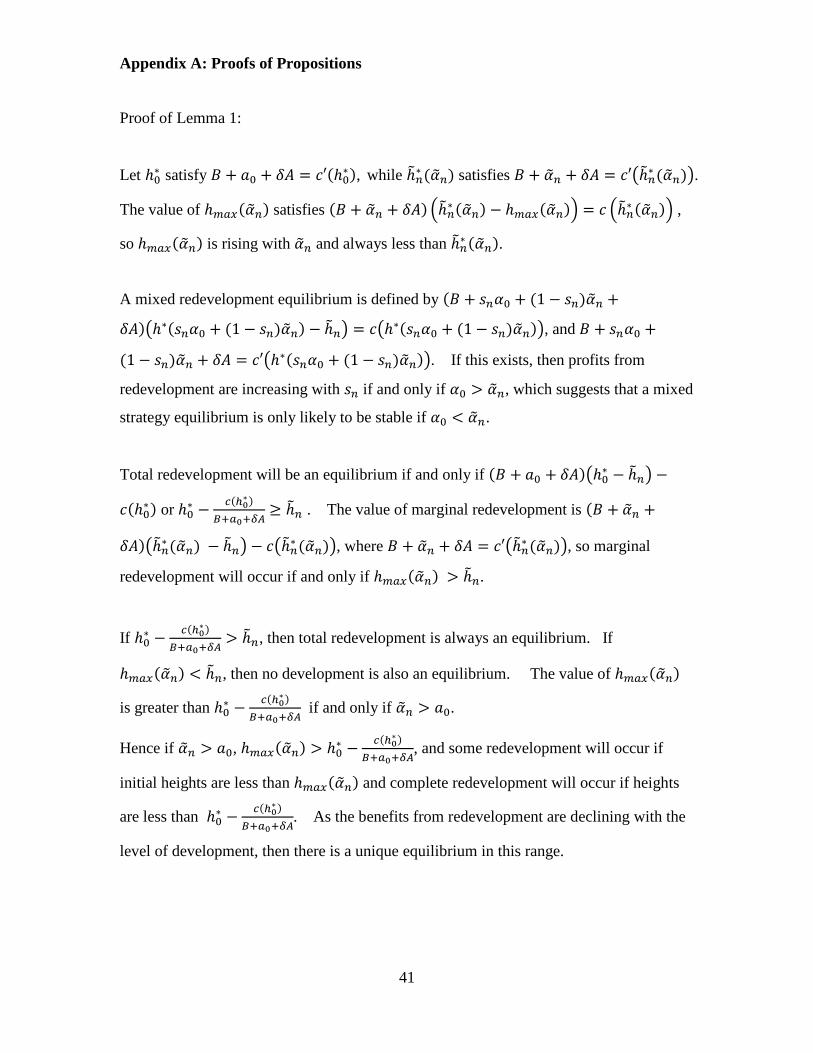
Appendix A: Proofs of Propositions
Proof of Lemma 1:
Let ℎ0∗ satisfy 𝐵 + 𝑎0 + 𝛿𝐴 = 𝑐′(ℎ0∗), while ℎ�𝑛∗ (𝛼�𝑛) satisfies 𝐵 + 𝛼�𝑛 + 𝛿𝐴 = 𝑐′�ℎ�𝑛∗ (𝛼�𝑛)�.
The value of ℎ𝑚𝑎𝑥(𝛼�𝑛) satisfies (𝐵 + 𝛼�𝑛 + 𝛿𝐴) �ℎ�𝑛∗ (𝛼�𝑛) − ℎ𝑚𝑎𝑥(𝛼�𝑛)� = 𝑐 �ℎ�𝑛∗ (𝛼�𝑛)� ,
so ℎ𝑚𝑎𝑥(𝛼�𝑛) is rising with 𝛼�𝑛 and always less than ℎ�𝑛∗ (𝛼�𝑛).
A mixed redevelopment equilibrium is defined by (𝐵 + 𝑠𝑛𝛼0 + (1 − 𝑠𝑛)𝛼�𝑛 +
𝛿𝐴)�ℎ∗(𝑠𝑛𝛼0 + (1 − 𝑠𝑛)𝛼�𝑛) − ℎ�𝑛� = 𝑐�ℎ∗(𝑠𝑛𝛼0 + (1 − 𝑠𝑛)𝛼�𝑛)�, and 𝐵 + 𝑠𝑛𝛼0 +
(1 − 𝑠𝑛)𝛼�𝑛 + 𝛿𝐴 = 𝑐′�ℎ∗(𝑠𝑛𝛼0 + (1 − 𝑠𝑛)𝛼�𝑛)�. If this exists, then profits from
redevelopment are increasing with 𝑠𝑛 if and only if 𝛼0 > 𝛼�𝑛, which suggests that a mixed
strategy equilibrium is only likely to be stable if 𝛼0 < 𝛼�𝑛.
Total redevelopment will be an equilibrium if and only if (𝐵 + 𝑎0 + 𝛿𝐴)�ℎ0∗ − ℎ�𝑛� −
𝑐(ℎ0∗) or ℎ0∗ −𝑐(ℎ0∗)
𝐵+𝑎0+𝛿𝐴≥ ℎ�𝑛 . The value of marginal redevelopment is (𝐵 + 𝛼�𝑛 +
𝛿𝐴)�ℎ�𝑛∗ (𝛼�𝑛) − ℎ�𝑛� − 𝑐�ℎ�𝑛∗ (𝛼�𝑛)�, where 𝐵 + 𝛼�𝑛 + 𝛿𝐴 = 𝑐′�ℎ�𝑛∗ (𝛼�𝑛)�, so marginal
redevelopment will occur if and only if ℎ𝑚𝑎𝑥(𝛼�𝑛) > ℎ�𝑛.
If ℎ0∗ −𝑐(ℎ0∗)
𝐵+𝑎0+𝛿𝐴> ℎ�𝑛, then total redevelopment is always an equilibrium. If
ℎ𝑚𝑎𝑥(𝛼�𝑛) < ℎ�𝑛, then no development is also an equilibrium. The value of ℎ𝑚𝑎𝑥(𝛼�𝑛)
is greater than ℎ0∗ −𝑐(ℎ0∗)
𝐵+𝑎0+𝛿𝐴 if and only if 𝛼�𝑛 > 𝑎0.
Hence if 𝛼�𝑛 > 𝑎0, ℎ𝑚𝑎𝑥(𝛼�𝑛) > ℎ0∗ −𝑐(ℎ0∗)
𝐵+𝑎0+𝛿𝐴, and some redevelopment will occur if
initial heights are less than ℎ𝑚𝑎𝑥(𝛼�𝑛) and complete redevelopment will occur if heights
are less than ℎ0∗ −𝑐(ℎ0∗)
𝐵+𝑎0+𝛿𝐴. As the benefits from redevelopment are declining with the
level of development, then there is a unique equilibrium in this range.
41
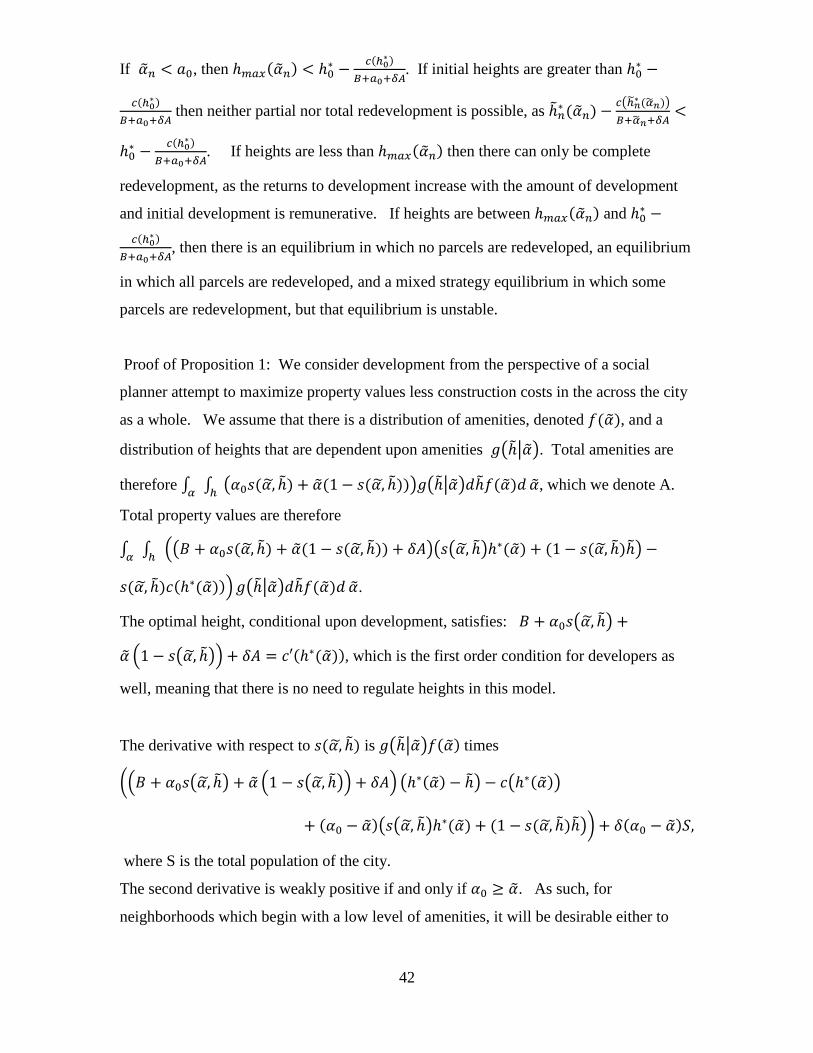
If 𝛼�𝑛 < 𝑎0, then ℎ𝑚𝑎𝑥(𝛼�𝑛) < ℎ0∗ −𝑐(ℎ0∗)
𝐵+𝑎0+𝛿𝐴. If initial heights are greater than ℎ0∗ −
𝑐(ℎ0∗)𝐵+𝑎0+𝛿𝐴
then neither partial nor total redevelopment is possible, as ℎ�𝑛∗ (𝛼�𝑛) − 𝑐�ℎ�𝑛∗ (𝛼�𝑛)�𝐵+𝛼�𝑛+𝛿𝐴
<
ℎ0∗ −𝑐(ℎ0∗)
𝐵+𝑎0+𝛿𝐴. If heights are less than ℎ𝑚𝑎𝑥(𝛼�𝑛) then there can only be complete
redevelopment, as the returns to development increase with the amount of development
and initial development is remunerative. If heights are between ℎ𝑚𝑎𝑥(𝛼�𝑛) and ℎ0∗ −𝑐(ℎ0∗)
𝐵+𝑎0+𝛿𝐴, then there is an equilibrium in which no parcels are redeveloped, an equilibrium
in which all parcels are redeveloped, and a mixed strategy equilibrium in which some
parcels are redevelopment, but that equilibrium is unstable.
Proof of Proposition 1: We consider development from the perspective of a social
planner attempt to maximize property values less construction costs in the across the city
as a whole. We assume that there is a distribution of amenities, denoted 𝑓(𝛼�), and a
distribution of heights that are dependent upon amenities 𝑔�ℎ��𝛼��. Total amenities are
therefore ∫ ∫ �𝛼0𝑠(𝛼,� ℎ�) + 𝛼�(1 − 𝑠(𝛼,� ℎ�))�𝑔�ℎ��𝛼��𝑑ℎ�𝑓(𝛼�)𝑑ℎ𝛼 𝛼�, which we denote A.
Total property values are therefore
∫ ∫ ��𝐵 + 𝛼0𝑠(𝛼,� ℎ�) + 𝛼�(1 − 𝑠(𝛼,� ℎ�)) + 𝛿𝐴��𝑠�𝛼,� ℎ��ℎ∗(𝛼�) + (1 − 𝑠(𝛼,� ℎ�)ℎ�� −ℎ𝛼
𝑠(𝛼,� ℎ�)𝑐(ℎ∗(𝛼�))�𝑔�ℎ��𝛼��𝑑ℎ�𝑓(𝛼�)𝑑 𝛼�.
The optimal height, conditional upon development, satisfies: 𝐵 + 𝛼0𝑠�𝛼,� ℎ�� +
𝛼� �1 − 𝑠�𝛼,� ℎ��� + 𝛿𝐴 = 𝑐′(ℎ∗(𝛼�)), which is the first order condition for developers as
well, meaning that there is no need to regulate heights in this model.
The derivative with respect to 𝑠(𝛼,� ℎ�) is 𝑔�ℎ��𝛼��𝑓(𝛼�) times
��𝐵 + 𝛼0𝑠�𝛼,� ℎ�� + 𝛼� �1 − 𝑠�𝛼,� ℎ��� + 𝛿𝐴� �ℎ∗(𝛼�) − ℎ�� − 𝑐�ℎ∗(𝛼�)�
+ (𝛼0 − 𝛼�)�𝑠�𝛼,� ℎ��ℎ∗(𝛼�) + (1 − 𝑠(𝛼,� ℎ�)ℎ��� + 𝛿(𝛼0 − 𝛼�)𝑆,
where S is the total population of the city.
The second derivative is weakly positive if and only if 𝛼0 ≥ 𝛼�. As such, for
neighborhoods which begin with a low level of amenities, it will be desirable either to
42
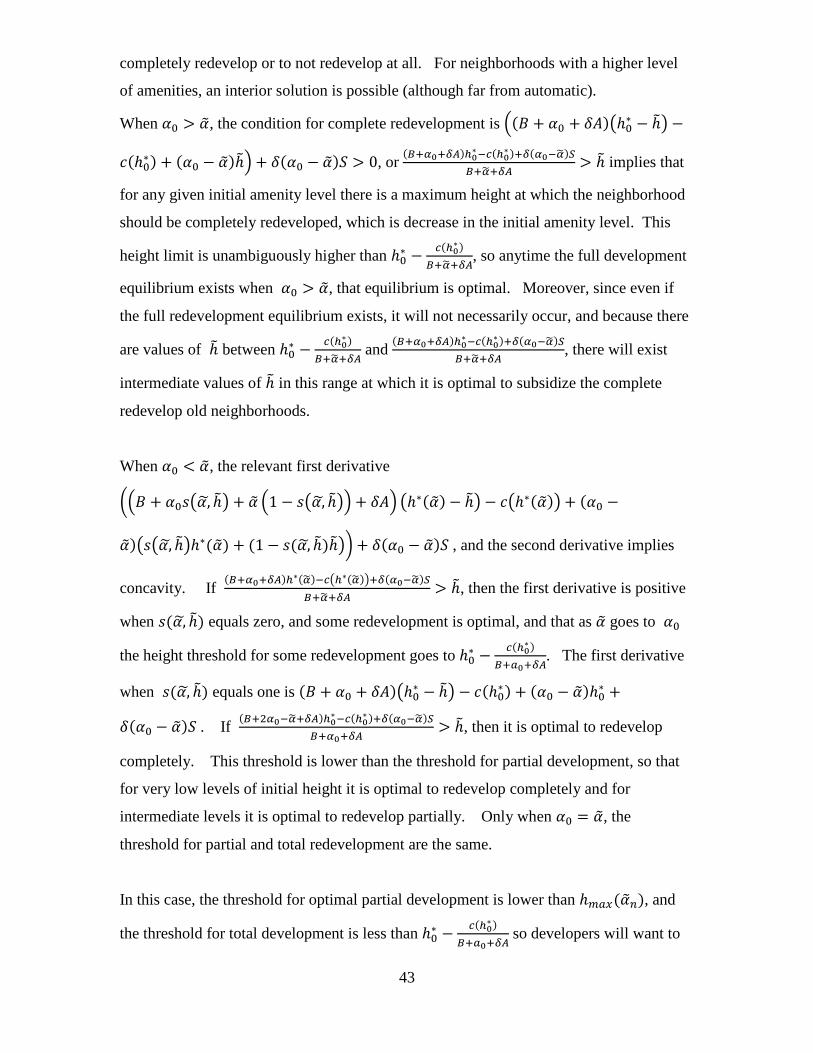
completely redevelop or to not redevelop at all. For neighborhoods with a higher level
of amenities, an interior solution is possible (although far from automatic).
When 𝛼0 > 𝛼�, the condition for complete redevelopment is �(𝐵 + 𝛼0 + 𝛿𝐴)�ℎ0∗ − ℎ�� −
𝑐(ℎ0∗) + (𝛼0 − 𝛼�)ℎ�� + 𝛿(𝛼0 − 𝛼�)𝑆 > 0, or (𝐵+𝛼0+𝛿𝐴)ℎ0∗−𝑐(ℎ0∗)+𝛿(𝛼0−𝛼�)𝑆𝐵+𝛼�+𝛿𝐴
> ℎ� implies that
for any given initial amenity level there is a maximum height at which the neighborhood
should be completely redeveloped, which is decrease in the initial amenity level. This
height limit is unambiguously higher than ℎ0∗ −𝑐(ℎ0∗)
𝐵+𝛼�+𝛿𝐴, so anytime the full development
equilibrium exists when 𝛼0 > 𝛼�, that equilibrium is optimal. Moreover, since even if
the full redevelopment equilibrium exists, it will not necessarily occur, and because there
are values of ℎ� between ℎ0∗ −𝑐(ℎ0∗)
𝐵+𝛼�+𝛿𝐴 and (𝐵+𝛼0+𝛿𝐴)ℎ0∗−𝑐(ℎ0∗)+𝛿(𝛼0−𝛼�)𝑆
𝐵+𝛼�+𝛿𝐴, there will exist
intermediate values of ℎ� in this range at which it is optimal to subsidize the complete
redevelop old neighborhoods.
When 𝛼0 < 𝛼�, the relevant first derivative
��𝐵 + 𝛼0𝑠�𝛼,� ℎ�� + 𝛼� �1 − 𝑠�𝛼,� ℎ��� + 𝛿𝐴� �ℎ∗(𝛼�) − ℎ�� − 𝑐�ℎ∗(𝛼�)� + (𝛼0 −
𝛼�)�𝑠�𝛼,� ℎ��ℎ∗(𝛼�) + (1 − 𝑠(𝛼,� ℎ�)ℎ��� + 𝛿(𝛼0 − 𝛼�)𝑆 , and the second derivative implies
concavity. If (𝐵+𝛼0+𝛿𝐴)ℎ∗(𝛼�)−𝑐�ℎ∗(𝛼�)�+𝛿(𝛼0−𝛼�)𝑆𝐵+𝛼�+𝛿𝐴
> ℎ�, then the first derivative is positive
when 𝑠(𝛼,� ℎ�) equals zero, and some redevelopment is optimal, and that as 𝛼� goes to 𝛼0
the height threshold for some redevelopment goes to ℎ0∗ −𝑐(ℎ0∗)
𝐵+𝑎0+𝛿𝐴. The first derivative
when 𝑠(𝛼,� ℎ�) equals one is (𝐵 + 𝛼0 + 𝛿𝐴)�ℎ0∗ − ℎ�� − 𝑐(ℎ0∗) + (𝛼0 − 𝛼�)ℎ0∗ +
𝛿(𝛼0 − 𝛼�)𝑆 . If (𝐵+2𝛼0−𝛼�+𝛿𝐴)ℎ0∗−𝑐(ℎ0∗)+𝛿(𝛼0−𝛼�)𝑆𝐵+𝛼0+𝛿𝐴
> ℎ�, then it is optimal to redevelop
completely. This threshold is lower than the threshold for partial development, so that
for very low levels of initial height it is optimal to redevelop completely and for
intermediate levels it is optimal to redevelop partially. Only when 𝛼0 = 𝛼�, the
threshold for partial and total redevelopment are the same.
In this case, the threshold for optimal partial development is lower than ℎ𝑚𝑎𝑥(𝛼�𝑛), and
the threshold for total development is less than ℎ0∗ −𝑐(ℎ0∗)
𝐵+𝑎0+𝛿𝐴 so developers will want to
43
redevelop more than they should. If partial development is the private outcome, then the
level of private redevelopment is always too high relative to the social optimum.
Proof of Proposition 2:
If 𝛼�𝑛 < 𝛼0, then banning redevelopment will only impact the community if
development would have happened otherwise, which means that ℎ�𝑛 < ℎ0∗ −𝑐(ℎ0∗)
𝐵+𝑎0+𝛿𝐴.
If heights are low enough so that redevelopment does occur then it will be complete, and
raise unit values by 𝛼0 − 𝛼�𝑛. If redevelopment is banned, the value of total real estate
will fall and land values will decrease by ℎ0∗(𝐵 + 𝑎0 + 𝛿𝐴) − ℎ�𝑛(𝐵 + 𝛼�𝑛 + 𝛿𝐴) − 𝑐(ℎ0∗),
which is decreasing in initial height and initial amenity levels.
If 𝛼�𝑛 > 𝛼0, then banning redevelopment will only impact the community if
ℎ�𝑛 < ℎ𝑚𝑎𝑥(𝛼�𝑛). If ℎ�𝑛 < ℎ0∗ −𝑐(ℎ0∗)
𝐵+𝑎0+𝛿𝐴, then the alternative would have been total
renovation. If ℎ0∗ −𝑐(ℎ0∗)
𝐵+𝑎0+𝛿𝐴< ℎ�𝑛 < ℎ𝑚𝑎𝑥(𝛼�𝑛), then the alternative is a mixed
redevelopment equilibrium is defined by (𝐵 + 𝑠𝑛𝛼0 + (1 − 𝑠𝑛)𝛼�𝑛 + 𝛿𝐴)�ℎ∗(𝑠𝑛𝛼0 +
(1 − 𝑠𝑛)𝛼�𝑛) − ℎ�𝑛� = 𝑐�ℎ∗(𝑠𝑛𝛼0 + (1 − 𝑠𝑛)𝛼�𝑛)�, and 𝐵 + 𝑠𝑛𝛼0 + (1 − 𝑠𝑛)𝛼�𝑛 + 𝛿𝐴 =
𝑐′�ℎ∗(𝑠𝑛𝛼0 + (1 − 𝑠𝑛)𝛼�𝑛)�. In this case, the value of 𝑠𝑛 is rising with 𝛼�𝑛 and falling
with ℎ�𝑛, so places with higher values of 𝛼�𝑛 and lower values of ℎ�𝑛, will have larger
reductions in the level of redevelopment after the ban.
A ban on redevelopment will cause ex post unit prices to be increase by 𝑠𝑛(𝛼�𝑛 −
𝛼0), which is decreasing with ℎ�𝑛, and increasing with 𝛼�𝑛. If there is partial
redevelopment, then the increase in land values from banning redevelopment equals
𝑠𝑛(𝛼�𝑛 − 𝛼0)ℎ�𝑛, which is again increasing with 𝛼�𝑛. The impact of height is initial
ambiguous. If there is total redevelopment, then the change in land or total property
values equals ℎ0∗(𝐵 + 𝑎0 + 𝛿𝐴) − ℎ�𝑛(𝐵 + 𝛼�𝑛 + 𝛿𝐴) − 𝑐(ℎ0∗), which is decreasing in
initial height and initial amenity levels, and may be positive or negative.
Proof of Proposition 3:
In the case where the social planner can completely control the share of redevelopment,
the first welfare criterion is 𝑁𝑛𝑒𝑤(𝐵(𝑆) + 𝛼0 + 𝛿𝐴) ℎ + ∫ �(𝐵(𝑆) + 𝛼0𝑠(𝛼�) + 𝛼�(1 −𝛼
𝑠(𝛼�)) + 𝛿𝐴)�𝑠(𝛼�)ℎ + (1 − 𝑠(𝛼�)ℎ� − 𝑠(𝛼�)𝑐� 𝑓(𝛼�)𝑑𝛼�, where 𝐴 = 𝑁𝑛𝑒𝑤𝛼0 +
44
∫ (𝛼0𝑠(𝛼�) + 𝛼�(1 − 𝑠(𝛼�))𝑓(𝛼�)𝛼 𝑑𝛼� and
𝑆 = 𝑁𝑛𝑒𝑤 ℎ + ∫ �𝑠(𝛼�)ℎ + (1 − 𝑠(𝛼�)ℎ�𝑓(𝛼�)𝛼 𝑑𝛼�. The second welfare criterion is
𝑁𝑛𝑒𝑤(𝐵(𝑆) + 𝛼0 + 𝛿𝐴) ℎ + ∫ �(𝐵(𝑆) + 𝛼0𝑠(𝛼�) + 𝛼�(1 − 𝑠(𝛼�)) + 𝛿𝐴)�𝑠(𝛼�)ℎ + (1 −𝛼
𝑠(𝛼�)ℎ� − 𝑠(𝛼�)𝑐� 𝑓(𝛼�)𝑑𝛼� + ∫ (𝐵𝑖 − 𝐵(𝑆))𝑞(𝐵𝑖)𝑑𝐵𝑖∞𝐵𝑖=𝐵(𝑆) .
In the first case, the net benefit of allowing redevelopment in a district is
𝑆 �−𝑞�𝐵(𝑆)��ℎ − ℎ� − 𝛿(𝛼� − 𝛼0)� + (𝐵(𝑆) + 𝛿𝐴)�ℎ − ℎ� + 𝛼0ℎ − 𝛼�ℎ − 𝑐𝑁𝑛𝑒𝑤,
which is monotonically decreasing in 𝛼�. Hence there exists a unique value of 𝛼�, equal to (𝐵(𝑆)+𝛿𝐴)�ℎ−ℎ�−𝑐𝑁𝑛𝑒𝑤+(ℎ+𝛿)𝛼0−𝑆𝑞�𝐵(𝑆)��ℎ−ℎ�
ℎ+𝛿𝑆, below which redevelopment is allowed and
above which redevelopment is not allowed. Assuming that the threshold is positive
implies that the cutoff is rising with ℎ and falling with ℎ. This cutoff point is rising with
𝛼0 and falling with 𝑞�𝐵(𝑆)� and c. In the case where the planner internalizes global
welfare, there is a higher threshold equal to (𝐵(𝑆)+𝛿𝐴)�ℎ−ℎ�−𝑐𝑁𝑛𝑒𝑤+(ℎ+𝛿)𝛼0ℎ+𝛿𝑆
, which is
independent of 𝑞�𝐵(𝑆)� and also rising with ℎ, and 𝛼0 and falling with ℎ. In the range
where 𝛼� is less than (𝐵(𝑆)+𝛿𝐴)�ℎ−ℎ�−𝑐𝑁𝑛𝑒𝑤+(ℎ)𝛼0ℎ+𝛿𝑆
, total property values would be higher if
the area wasn’t in a historic district.
If the planner can dictate the amount of redevelopment in each area, the government
maximizes 𝑁𝑛𝑒𝑤(𝐵(𝑆) + 𝛼0 + 𝛿𝐴) ℎ + ∫ �(𝐵(𝑆) + 𝛼0𝑠(𝛼�) + 𝛼�(1 − 𝑠(𝛼�)) +𝛼
𝛿𝐴)�𝑠(𝛼�)ℎ + (1 − 𝑠(𝛼�)ℎ� − 𝑠(𝛼�)𝑐� 𝑓(𝛼�)𝑑𝛼�. The first order condition for
redevelopment is in the case
𝑆 �−𝑞�𝐵(𝑆)��ℎ − ℎ� − 𝛿(𝛼� − 𝛼0)� + (𝐵(𝑆) + 𝛼0𝑠(𝛼�) + 𝛼�(1 − 𝑠(𝛼�)) + 𝛿𝐴)�ℎ − ℎ� −
𝑐𝑁𝑛𝑒𝑤 − (𝛼� − 𝛼0)�𝑠(𝛼�)ℎ + (1 − 𝑠(𝛼�)ℎ� = 0 and the share of redevelopment equals
(𝐵(𝑆)+𝛼�+𝛿𝐴)�ℎ−ℎ�−𝑐𝑁𝑛𝑒𝑤−(𝛼�−𝛼0)ℎ−𝑆�𝑞�𝐵(𝑆)��ℎ−ℎ�+𝛿(𝛼�−𝛼0)�
2(𝛼�−𝛼0)�ℎ−ℎ�= 𝑠(𝛼�). When the government
internalizes the welfare of residents, the first order condition is (𝐵(𝑆)+𝛼�+𝛿𝐴)�ℎ−ℎ�−𝑐𝑁𝑛𝑒𝑤�ℎ+𝛿𝑆�(𝛼�−𝛼0)
2(𝛼�−𝛼0)�ℎ−ℎ�= 𝑠(𝛼�), which is also weakly lower.
45

46

Appendix B: Description of the Designation Process for Historic Districts
The responsibility for the creation of a historic district in New York City falls on
the LPC, which is made up of 11 members, including at least three architects, one
qualified historian, one city planner or landscape architect, one realtor, and one resident
of each of the five boroughs, all of whom are appointed by the mayor for three-year
terms.14
The LPC may propose historic designation on its own accord, but often relies on
the efforts of community leaders and activists to bring neighborhoods up for
consideration. 15 Suggestions from outside the LPC most often begin with a Request for
Evaluation (RFE) filed with the LPC.16 Typically, civic organizations and community
groups provide extensive supporting material along with each RFE.
When a designation proposal is submitted, the RFE Committee, which includes
the Chair of the LPC along with various LPC staff members, evaluates the submission to
determine whether the full LPC should consider it.17 The LPC staff documents the
characteristics of the proposed district, a process that includes on-site survey, meetings
with local community members, and discussions of the boundaries of the potential
historic district. Because districts are required to contain only contiguous lots, the staff of
the LPC must evaluate the architectural and historic quality of all the buildings within a
proposed district before settling on the boundaries.
Following the evaluation by the RFE Committee, the Chair decides whether to
forward the proposed designation to the full LPC.18 If so, the LPC reviews the RFE
Committee’s statement of the significance of the proposed district and the Committee’s
recommendation, along with photographs and other documentation, at a public meeting.
To move the proposal forward, a majority of the Commissioners present must vote to
“calendar” a proposed designation.19 Owners of the property in question are not
14 N.Y.C. Charter § 3020(1), (2) (2009). 15 NEW YORK CITY LANDMARKS PRESERVATION COMMISSION, FAQs: The Designation Process, http://www.nyc.gov/html/lpc/html/faqs/faq_designation.shtml (last visited October 13, 2011). 16 An RFE is not required by law, but it is the LPC’s preferred form for receiving a new request. 17 Id. 18 There is no set timeline for determining whether a proposal should be submitted to the full LPC, so proposals can remain in an indeterminate status for long periods of time (e.g., see Pogrebin 2008). 19 Rules of the City of New York, Title 63, Landmarks Preservation Commission Rules 1-02, 1-01 (July 2003). Note that the meeting is not required by statute or rules to be public, but the LPC indicates that such meetings and votes are to be public. NEW YORK CITY LANDMARKS PRESERVATION COMMISSION supra note [2]. The LPC is not required to vote on calendaring every proposed designation, and each proposal is not required to go through the RFE Committee in order to be reviewed by the full LPC. Although the
47
necessarily given notice of the meeting at which a proposed designation is calendared,
however, nor is a public hearing required prior to the calendaring decision.20
While district boundaries can be modified with the same land area or reduced to a
smaller land area between the dates of calendaring and designation, they cannot be
enlarged.21 In principle, when the LPC calendars a proposed historic district, the
Department of Buildings delays the issuance of permits for development and renovations
while the LPC has the proposed district under consideration. In practice, it is not clear
that the calendaring of proposed districts actually does prevent or dissuade the
Department of Buildings from issuing work permits.
Once a proposal is calendared, the LPC is required to hold a public hearing,
during which New York City residents, including property owners and other interested
parties, are invited to offer their opinions on the proposed historic district.22 The LPC
must provide notice of a planned hearing regarding a proposed designation to the City
Planning Commission (CPC), the office of the borough president for the borough in
which the district is located, and any affected community boards.23 Further, the LPC
must publish notice of any public hearing in the City Record for the ten days preceding
the hearing, and must provide notice by mail to the owner of any property in the proposed
district.24
At the public hearing, LPC staff makes a presentation about the proposed
designation, and property owners and other interested parties are given an opportunity to
speak.25 These parties also may submit written comments.26 No environmental review is
practice of the LPC is to consider proposals in the manner described here, the only requirement in LPC rules and the city administrative code is for a vote to calendar by a majority of the commissioners present (with a minimum of six Commissioners required for a quorum). 20 Mitch Korbey, Landmarks Commission Does 30!, Herrick Zone, July 11, 2012, available at http://herrickzone.com/?p=1094&utm_source=feedburner&utm_medium=email&utm_campaign=Feed%3A+herrickzone%2FXUTe+%28HERRICK+ZONE%29
21 HISTORIC DISTRICTS COUNCIL, Preserving Your Historic Neighborhood: New York City Designation Process, http://www.hdc.org/preservingnyc.htm (last visited October 12, 2011). 22 N.Y.C. Charter § 3020(7). See also N.Y. Admin. Code § 25-313. 23 Id. 24 N.Y.C. Admin. Code § 25-313(a) (2010). Such notice must be provided by registered mail to any owner of any property at the owner’s last known address as recorded by the commissioner of finance, or alternatively if no such record, by ordinary mail to the street address of the property in question. Id. In practice, this notice to property owners includes a copy of the designation report prepared by LPC staff. NEW YORK CITY LANDMARKS PRESERVATION COMMISSION supra note [2]. 25 NEW YORK CITY LANDMARKS PRESERVATION COMMISSION supra note [2]. 26 Id.
48

required prior to the hearing, unlike the case for zoning changes.27 After a hearing, the
LPC may officially designate a proposed district by a vote of at least six
commissioners.28 While a proposed historic district is under consideration, the staff of
the LPC completes a “designation report” outlining the boundaries of the district, and
describing the historic and architectural significance of buildings within the proposed
district. If the LPC ultimately designates a historic district, that designation report forms
the basis of the justification for the designation.29 The designation is effective
immediately upon the LPC’s vote.
The LPC must then file the designation report with the City Council, the CPC and
other city agencies.30 While the designation need not go through the CPC’s Uniform
Land Use Review Process,31 the CPC must hold a public hearing on the designation of a
district and provide its own report on the designation to the City Council within 60
days.32 The CPC report must address how the designation relates to existing zoning
requirements, plans for “the development, growth, improvement or renewal” of the area,
and “projected public improvements.”33 The CPC report also may recommend the action
it believes the City Council should take regarding the LPC designation.34
Within 120 days of receiving the LPC’s designation report, the City Council is
empowered to modify or reject a proposed district.35 While the Council has rejected
individual landmark designations in recent years, it has not rejected or changed any
27 Korbey, supra note []. 28 Landmarks Preservation Commission Rules 1-04. Note that whereas a simple majority of the commissioners present is sufficient to calendar a proposal, an absolute majority of the LPC must support a designation, regardless of the number present for the vote. 29 N.Y.C. Admin. Code § 25-302(f)(1). 30 N.Y.C. Charter § 3020(8). The designation must be filed with the CPC within 10 days of the designation action, and must also be filed with the city council, the department of buildings, the Board of Standards and Appeals, the Fire Department and the Department of Health and Mental Hygiene. N.Y.C. Admin. Code § 25-303(f). In practice the LPC provides the CPC and other city agencies with a copy of the final designation report, although this is not expressly required by statute. NEW YORK CITY LANDMARKS PRESERVATION COMMISSION supra note [2]. 31Korbey, supra note []. For information about ULURP, see [].
32 N.Y.C. Admin. Code § 25-303(g)(1). 33 Id. 34 Id. 35 N.Y.C. Charter § 3020(9), N.Y.C. Admin. Code § 25-303(g)(2). A majority of the city council may either modify or “disapprove” a designation by the LPC. Id. Following a vote on such an action, the Mayor may disapprove the action of the city council within five days, in which case the city council may overrule the Mayor with the votes of two-thirds of its 51 members to reinstate the city councils disapproval (thus defeating the designation by the LPC) or modification. Id.
49

district designations.36 The mayor may veto a modification or rejection within five days
of the City Council’s vote. The City Council then has ten days to over-ride the veto by a
two-thirds vote.
36 Pearson, Marjorie. Ibid.
50
Appendix C: Description of the Restrictions on Building Modifications Imposed by
Historic District Designations
The designation of a historic district triggers a series of restrictions on building
construction and modification that are likely to affect property values and sales prices in
historic districts. The restrictions are described in detail in Appendix B. In brief, Any
property owner in New York who wants to undertake construction work that goes beyond
“ordinary repairs and maintenance” must apply for appropriate permits from the
Department of Buildings (DOB) (and in some cases, other city agencies).37 If the
property in question is in a historic district, the owner also must request and receive one
of three determinations from the LPC: (1) a “permit for minor work,” (2) a “certificate of
no effect,” or (3) a “certificate of appropriateness.”38 Until the LPC issues one of these
notices, the Department of Buildings may not approve a building permit for construction,
modification or demolition of property in a historic district,39 and the owner may not
proceed with the construction or modification.
The LPC has issued guidelines delineating types of work that constitute ordinary
maintenance and thus do not require LPC approval (for example, installing window air-
conditioning units) and work that does require LPC approval (for example, painting wood
or metal cornices a different color).40 But for anything other than ordinary maintenance,
even “minor work,”41 the LPC requires an owner to submit an “Application Form for
Work on Designated Properties.”42
The LPC forwards the Application to the DOB, which determines whether the
proposed work requires a DOB building permit.43 If the project requires a building
permit, the LPC will not grant a minor work permit, and instead will consider whether the
work qualifies for a certificate of no effect or a certificate of appropriateness.44 If the
37 See N.Y.C. Admin. Code § 25-302(r) (defining ordinary repairs and maintenance as work to “correct any deterioration or decay of or damage to such improvement or any part thereof and to restore same, as nearly as may be practicable, to its condition prior to the occurrence of such deterioration, decay or damage.”) 38 N.Y.C. Admin. Code § 25-315(c) 39 N.Y.C. Admin. Code § 25-305(b). 40 New York City Landmarks Preservation Commission, Guidelines and Materials Checklist for Performing Work on Landmarked Buildings available at http://www.nyc.gov/html/lpc/downloads/pdf/pubs/workguide.pdf. 41 N.Y.C. Admin. Code § 25-310(a)(1). 42 New York City Landmarks Preservation Commission, Application Form for Work on Designated Properties available at http://www.nyc.gov/html/lpc/downloads/pdf/forms/application_form_full.pdf. 43 N.Y.C. Admin. Code § 25-310(b). 44 Id.
51
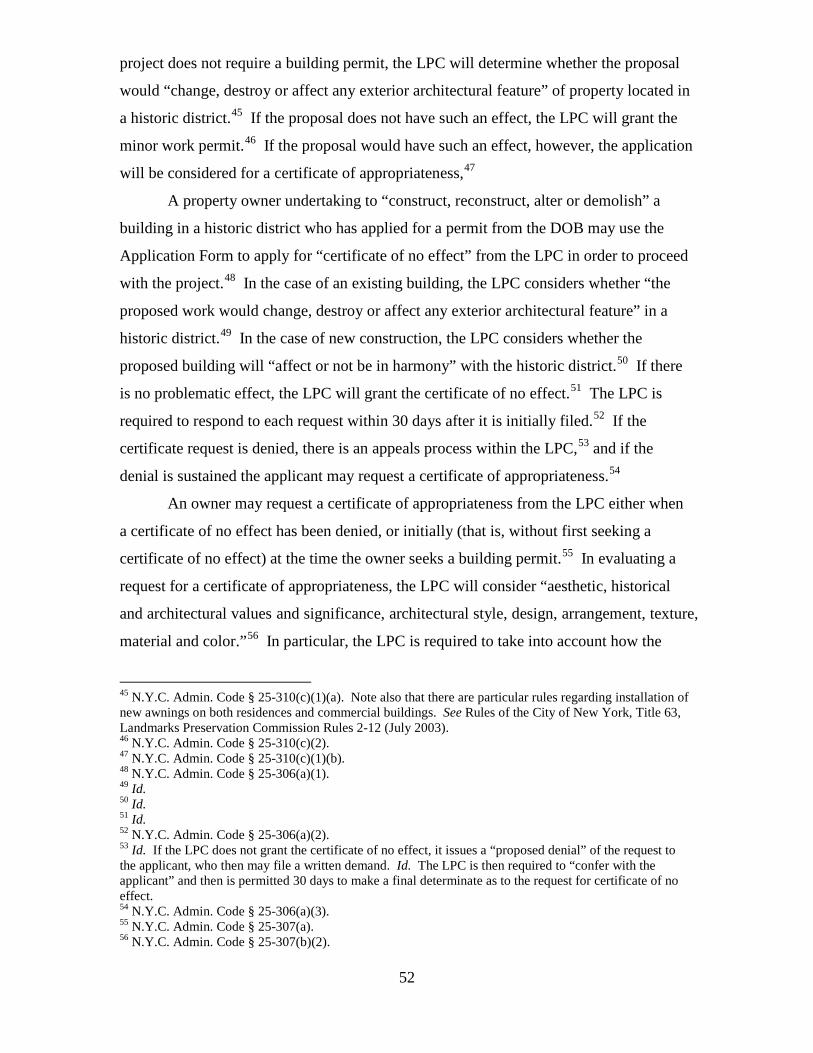
project does not require a building permit, the LPC will determine whether the proposal
would “change, destroy or affect any exterior architectural feature” of property located in
a historic district.45 If the proposal does not have such an effect, the LPC will grant the
minor work permit.46 If the proposal would have such an effect, however, the application
will be considered for a certificate of appropriateness,47
A property owner undertaking to “construct, reconstruct, alter or demolish” a
building in a historic district who has applied for a permit from the DOB may use the
Application Form to apply for “certificate of no effect” from the LPC in order to proceed
with the project.48 In the case of an existing building, the LPC considers whether “the
proposed work would change, destroy or affect any exterior architectural feature” in a
historic district.49 In the case of new construction, the LPC considers whether the
proposed building will “affect or not be in harmony” with the historic district.50 If there
is no problematic effect, the LPC will grant the certificate of no effect.51 The LPC is
required to respond to each request within 30 days after it is initially filed.52 If the
certificate request is denied, there is an appeals process within the LPC,53 and if the
denial is sustained the applicant may request a certificate of appropriateness.54
An owner may request a certificate of appropriateness from the LPC either when
a certificate of no effect has been denied, or initially (that is, without first seeking a
certificate of no effect) at the time the owner seeks a building permit.55 In evaluating a
request for a certificate of appropriateness, the LPC will consider “aesthetic, historical
and architectural values and significance, architectural style, design, arrangement, texture,
material and color.”56 In particular, the LPC is required to take into account how the
45 N.Y.C. Admin. Code § 25-310(c)(1)(a). Note also that there are particular rules regarding installation of new awnings on both residences and commercial buildings. See Rules of the City of New York, Title 63, Landmarks Preservation Commission Rules 2-12 (July 2003). 46 N.Y.C. Admin. Code § 25-310(c)(2). 47 N.Y.C. Admin. Code § 25-310(c)(1)(b). 48 N.Y.C. Admin. Code § 25-306(a)(1). 49 Id. 50 Id. 51 Id. 52 N.Y.C. Admin. Code § 25-306(a)(2). 53 Id. If the LPC does not grant the certificate of no effect, it issues a “proposed denial” of the request to the applicant, who then may file a written demand. Id. The LPC is then required to “confer with the applicant” and then is permitted 30 days to make a final determinate as to the request for certificate of no effect. 54 N.Y.C. Admin. Code § 25-306(a)(3). 55 N.Y.C. Admin. Code § 25-307(a). 56 N.Y.C. Admin. Code § 25-307(b)(2).
52
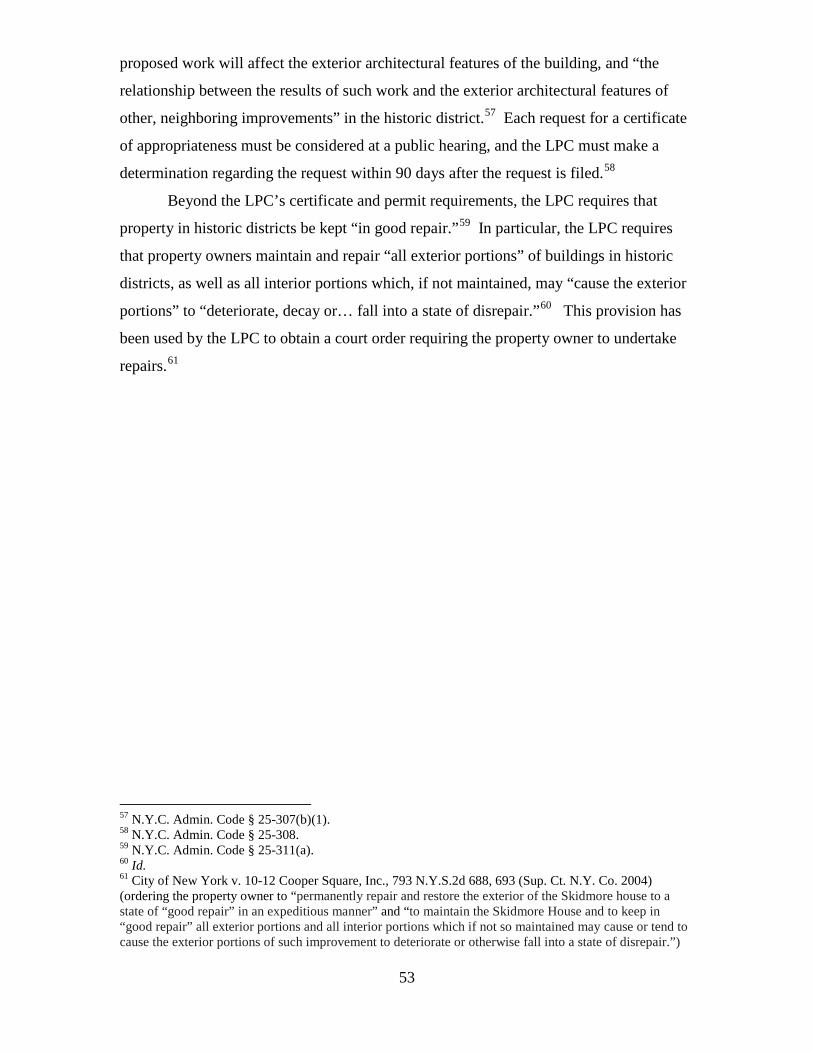
proposed work will affect the exterior architectural features of the building, and “the
relationship between the results of such work and the exterior architectural features of
other, neighboring improvements” in the historic district.57 Each request for a certificate
of appropriateness must be considered at a public hearing, and the LPC must make a
determination regarding the request within 90 days after the request is filed.58
Beyond the LPC’s certificate and permit requirements, the LPC requires that
property in historic districts be kept “in good repair.”59 In particular, the LPC requires
that property owners maintain and repair “all exterior portions” of buildings in historic
districts, as well as all interior portions which, if not maintained, may “cause the exterior
portions” to “deteriorate, decay or… fall into a state of disrepair.”60 This provision has
been used by the LPC to obtain a court order requiring the property owner to undertake
repairs.61
57 N.Y.C. Admin. Code § 25-307(b)(1). 58 N.Y.C. Admin. Code § 25-308. 59 N.Y.C. Admin. Code § 25-311(a). 60 Id. 61 City of New York v. 10-12 Cooper Square, Inc., 793 N.Y.S.2d 688, 693 (Sup. Ct. N.Y. Co. 2004) (ordering the property owner to “permanently repair and restore the exterior of the Skidmore house to a state of “good repair” in an expeditious manner” and “to maintain the Skidmore House and to keep in “good repair” all exterior portions and all interior portions which if not so maintained may cause or tend to cause the exterior portions of such improvement to deteriorate or otherwise fall into a state of disrepair.”)
53

Appendix D: Robustness Results for Price Regression Models
In Appendix D, we report the regression results from the four robustness checks
for the price models. In the first, we include zip code fixed effects, rather than census
tract fixed effects. This increases the number of comparison properties, as zip codes are
substantially larger than census tracts in New York City. We find a positive impact of
historic district designation citywide, but a negative impact when we look only at
Manhattan. We then run the buffer regressions using zip code fixed effects, again
reporting similar results to those with census tract fixed effects. Finally, we replicate the
price analysis swapping out the date of designation for the calendaring date. Typically,
the calendaring date signals the impending designation of a historic district, and we
would expect the positive impact of historic districts to occur following the public
announcement that the district has been placed on the calendar of the Landmarks
Preservation Commission.
54
Appendix Table D1: Regression of sales price (log) on property characteristics with zip code fixed effects, including historic designation
Citywide Manhattan
(1) (2) (3)
Average effect
(no cap)
Impact can vary with
time (no cap)
Impact can vary with
time (no cap)
Historic District Ever 0.270569*** 0.26983*** 0.32223*** (0.01213) 0.01 (0.02426)
Historic District Post 0.16644*** 0.02797 -0.12683*** (0.01296) (0.01894) (0.03186)
Time Post 0.01168*** 0.01580*** (0.00192) (0.00293)
Time Post Squared -0.00015*** -0.00046*** (0.00005) (0.00007)
Observations 445,096 445,096 121,909 Adjusted R2 0.75567 0.75584 0.70538
Notes: *** p<0.01, ** p<0.05, * p<0.10. Robust standard errors (clustered by parcel). Includes full set of property level control variables (coefficients not displayed): Lot area (logged), square footage (logged), corner lot, irregular lot, garage, altered, number of buildings, building age, building age squared, pre-war building, missing lot area, and building class. All models include ZIP area and CD Quarter fixed effects. The sample is limited to arms-length sales in the 32 community districts in New York City that contained at least one lot in a historic district by 2009.
55
Appendix Table D2: Regression of sales price (log) on property characteristics with zip code fixed effects, including historic designation and buffer zones
Citywide
(1) (2)
Average effect
(no cap)
Impact can vary with
time (no cap)
Historic District Ever 0.28427*** 0.27968*** (0.01203) (0.01206)
Historic District Post 0.18754*** 0.03983** (0.01281) (0.01882)
Time Post 0.01209*** (0.00192)
Time Post Squared -0.00014*** (0.00005)
Buffer variables (250 feet)
Buffer Ever 0.03780*** 0.03428*** (0.01007) (0.01012)
Buffer Post 0.12902*** -0.04247** (0.01131) (0.01757)
Buffer Time Post 0.01825*** (0.00187)
Buffer Time Post Squared -0.00034*** (0.00005)
Observations 445,096 445,096 Adjusted R2 0.75654 0.75690 Notes: *** p<0.01, ** p<0.05, * p<0.10. Robust standard errors (clustered by parcel). Includes full set of property level control variables (coefficients not displayed): Lot area (logged), square footage (logged), corner lot, irregular lot, garage, altered, number of buildings, building age, building age squared, pre-war building, missing lot area, and building class. All models include ZIP area and CD Quarter fixed effects. The sample is limited to arms-length sales in the 32 community districts in New York City that contained at least one lot in a historic district by 2009.
56
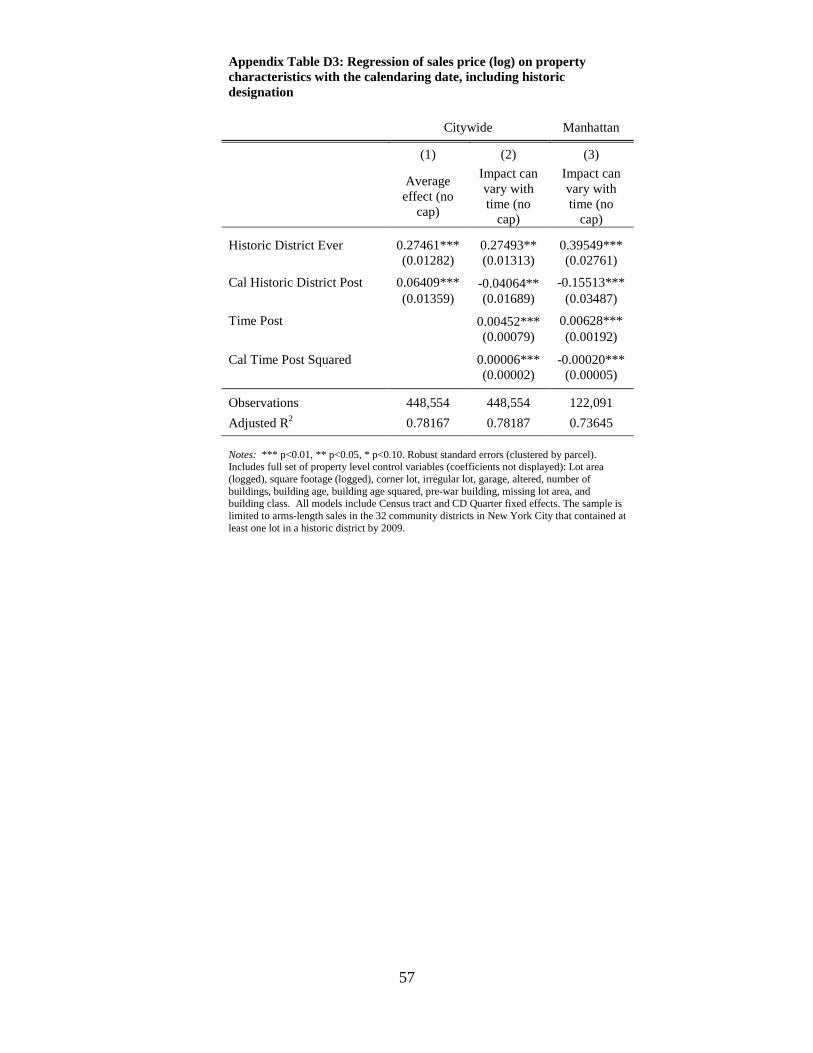
Appendix Table D3: Regression of sales price (log) on property characteristics with the calendaring date, including historic designation
Citywide Manhattan
(1) (2) (3)
Average effect (no
cap)
Impact can vary with time (no
cap)
Impact can vary with time (no
cap)
Historic District Ever 0.27461*** 0.27493** 0.39549*** (0.01282) (0.01313) (0.02761)
Cal Historic District Post 0.06409*** -0.04064** -0.15513*** (0.01359) (0.01689) (0.03487)
Time Post 0.00452*** 0.00628*** (0.00079) (0.00192)
Cal Time Post Squared 0.00006*** -0.00020*** (0.00002) (0.00005)
Observations 448,554 448,554 122,091 Adjusted R2 0.78167 0.78187 0.73645 Notes: *** p<0.01, ** p<0.05, * p<0.10. Robust standard errors (clustered by parcel). Includes full set of property level control variables (coefficients not displayed): Lot area (logged), square footage (logged), corner lot, irregular lot, garage, altered, number of buildings, building age, building age squared, pre-war building, missing lot area, and building class. All models include Census tract and CD Quarter fixed effects. The sample is limited to arms-length sales in the 32 community districts in New York City that contained at least one lot in a historic district by 2009.
57