presented by treasure island -...
TRANSCRIPT
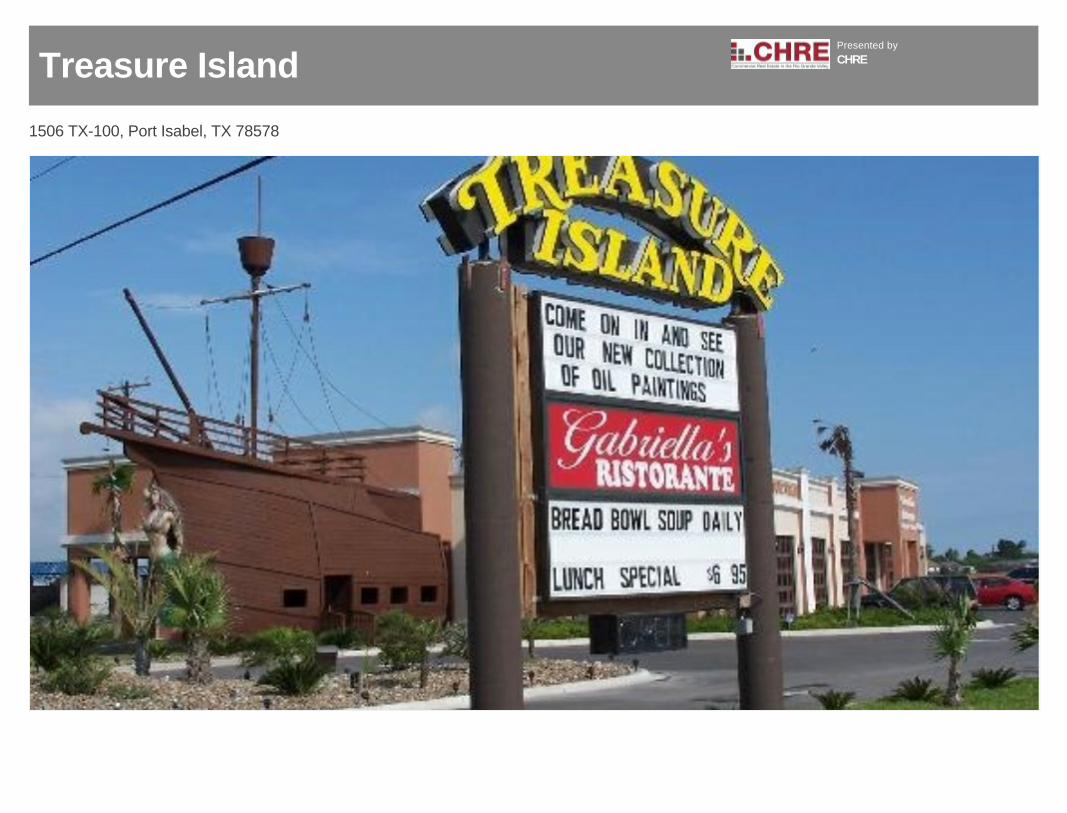
1506 TX-100, Port Isabel, TX 78578
Treasure IslandPresented by
CHRE
Cindy Hopkins, [email protected](956) 778-3255
License: 0508052
CHRE312 E HarrisonHarlingen, TX 78550
Notes
1506 TX-100, Port Isabel, TX 78578
Confidentiality Agreement
Treasure Island
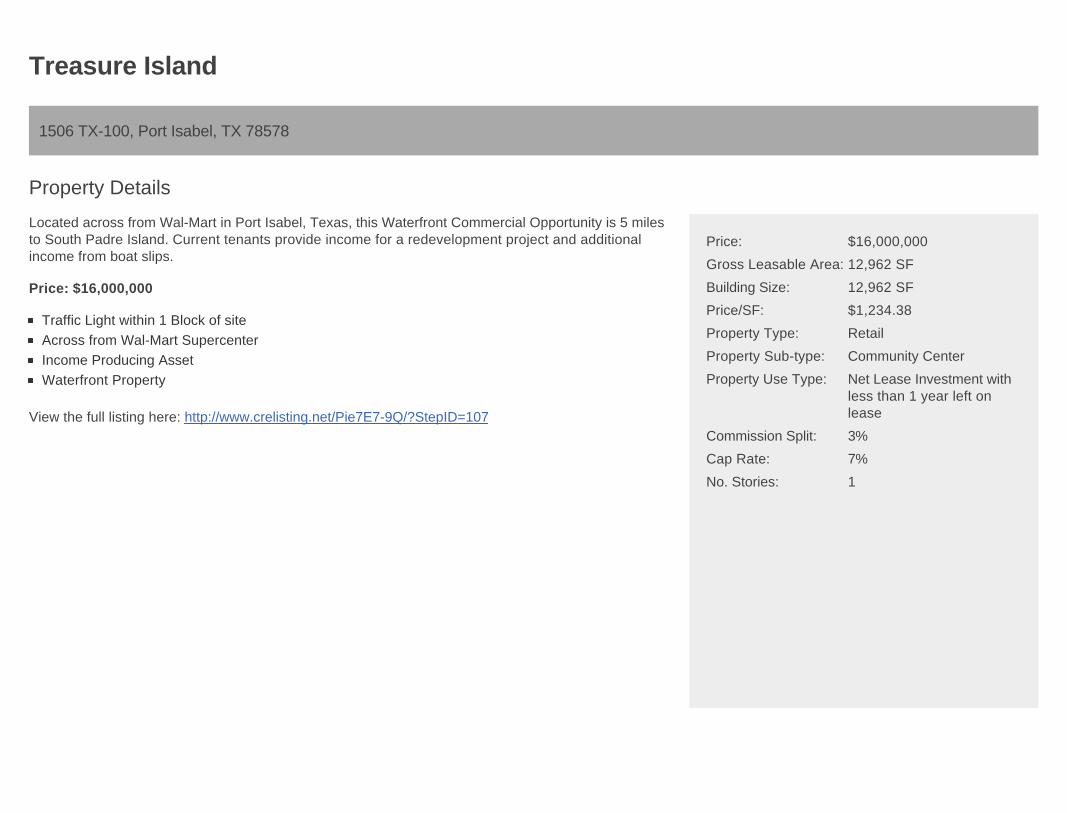
Located across from Wal-Mart in Port Isabel, Texas, this Waterfront Commercial Opportunity is 5 milesto South Padre Island. Current tenants provide income for a redevelopment project and additionalincome from boat slips.
Price: $16,000,000
Traffic Light within 1 Block of site
Across from Wal-Mart Supercenter
Income Producing Asset
Waterfront Property
View the full listing here: http://www.crelisting.net/Pie7E7-9Q/?StepID=107
Price: $16,000,000
Gross Leasable Area: 12,962 SF
Building Size: 12,962 SF
Price/SF: $1,234.38
Property Type: Retail
Property Sub-type: Community Center
Property Use Type: Net Lease Investment withless than 1 year left onlease
Commission Split: 3%
Cap Rate: 7%
No. Stories: 1
1506 TX-100, Port Isabel, TX 78578
Property Details
Treasure Island

Financial SummaryAnalysisType Actual
Year 2016
Scheduled Gross Income $135,804
Effective Gross Income $105,804
Operating Expenses $30,000
Net Operating Income $105,804
Major Tenant Information
Tenant SF Occupied Lease ExpiredThe Gym 7,000 6/1/2017
Physician's Office 4,317 3/1/2017
1506 TX-100, Port Isabel, TX 78578
Financials, Debt and Unit Mix
Treasure Island

Location DescriptionTX HWY 100 & TX 48, Port Isabel, Texas - Acrossfrom Wal-Mart
1506 TX-100, Port Isabel, TX 78578
Location
Treasure Island

Main Photo Aerial Photograph
1506 TX-100, Port Isabel, TX 78578
Property Photos
Treasure Island

1506 TX-100, Port Isabel, TX 78578
Property Photos
Treasure Island

———
Jun 16 vs. 3 mo.prior
Y-O-Y
State $152 +4.3% +12.0%
Metro $123 +2.1% -3.3%
County $123 +2.1% -3.3%
———
Jun 16 vs. 3 mo.prior
Y-O-Y
State $15.05 +0.4% +1.2%
Metro $14.31 -1.4% -2.7%
County $14.31 -1.4% -2.7%
1506 TX-100, Port Isabel, TX 78578
Market Trends
Treasure Island

1506 TX-100, Port Isabel, TX 78578
Demographics
Population 1-mi. 3-mi. 5-mi.
2015 Male Population 2,442 4,357 4,357
2015 Female Population 2,468 4,379 4,379
% 2015 Male Population 49.74% 49.87% 49.87%
% 2015 Female Population 50.26% 50.13% 50.13%
2015 Total Population: Adult 3,600 6,146 6,146
2015 Total Daytime Population 6,116 10,140 10,140
2015 Total Employees 3,004 4,648 4,648
2015 Total Population: Median Age 36 31 31
2015 Total Population: Adult Median Age 49 45 45
2015 Total population: Under 5 years 435 831 831
2015 Total population: 5 to 9 years 353 721 721
2015 Total population: 10 to 14 years 339 639 639
2015 Total population: 15 to 19 years 318 683 683
2015 Total population: 20 to 24 years 377 760 760
2015 Total population: 25 to 29 years 297 572 572
2015 Total population: 30 to 34 years 268 549 549
2015 Total population: 35 to 39 years 274 545 545
2015 Total population: 40 to 44 years 276 519 519
2015 Total population: 45 to 49 years 286 512 512
2015 Total population: 50 to 54 years 309 528 528
2015 Total population: 55 to 59 years 326 466 466
Treasure Island

1506 TX-100, Port Isabel, TX 78578
Demographics
Population (Cont.) 1-mi. 3-mi. 5-mi.
2015 Total population: 60 to 64 years 293 404 404
2015 Total population: 65 to 69 years 245 312 312
2015 Total population: 70 to 74 years 208 279 279
2015 Total population: 75 to 79 years 155 206 206
2015 Total population: 80 to 84 years 84 123 123
2015 Total population: 85 years and over 67 87 87
% 2015 Total population: Under 5 years 8.86% 9.51% 9.51%
% 2015 Total population: 5 to 9 years 7.19% 8.25% 8.25%
% 2015 Total population: 10 to 14 years 6.90% 7.31% 7.31%
% 2015 Total population: 15 to 19 years 6.48% 7.82% 7.82%
% 2015 Total population: 20 to 24 years 7.68% 8.70% 8.70%
% 2015 Total population: 25 to 29 years 6.05% 6.55% 6.55%
% 2015 Total population: 30 to 34 years 5.46% 6.28% 6.28%
% 2015 Total population: 35 to 39 years 5.58% 6.24% 6.24%
% 2015 Total population: 40 to 44 years 5.62% 5.94% 5.94%
% 2015 Total population: 45 to 49 years 5.82% 5.86% 5.86%
% 2015 Total population: 50 to 54 years 6.29% 6.04% 6.04%
% 2015 Total population: 55 to 59 years 6.64% 5.33% 5.33%
% 2015 Total population: 60 to 64 years 5.97% 4.62% 4.62%
% 2015 Total population: 65 to 69 years 4.99% 3.57% 3.57%
% 2015 Total population: 70 to 74 years 4.24% 3.19% 3.19%
Treasure Island
1506 TX-100, Port Isabel, TX 78578
Demographics
Population (Cont.) 1-mi. 3-mi. 5-mi.
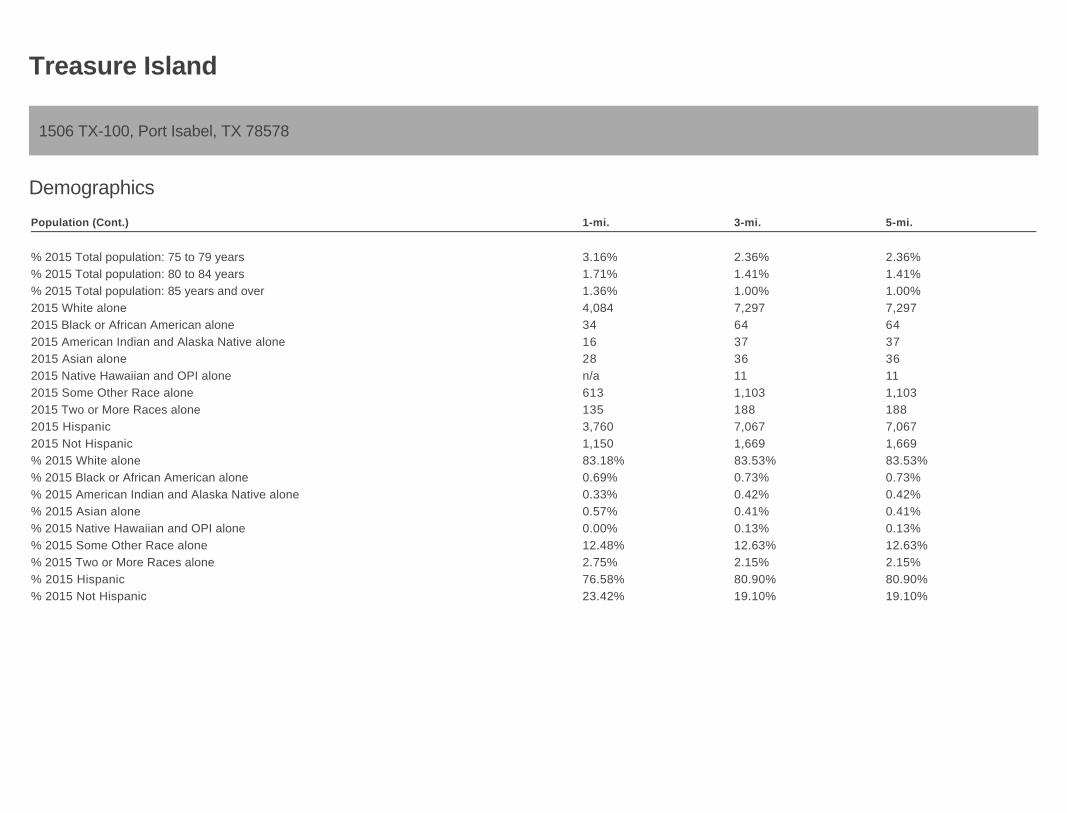
% 2015 Total population: 75 to 79 years 3.16% 2.36% 2.36%
% 2015 Total population: 80 to 84 years 1.71% 1.41% 1.41%
% 2015 Total population: 85 years and over 1.36% 1.00% 1.00%
2015 White alone 4,084 7,297 7,297
2015 Black or African American alone 34 64 64
2015 American Indian and Alaska Native alone 16 37 37
2015 Asian alone 28 36 36
2015 Native Hawaiian and OPI alone n/a 11 11
2015 Some Other Race alone 613 1,103 1,103
2015 Two or More Races alone 135 188 188
2015 Hispanic 3,760 7,067 7,067
2015 Not Hispanic 1,150 1,669 1,669
% 2015 White alone 83.18% 83.53% 83.53%
% 2015 Black or African American alone 0.69% 0.73% 0.73%
% 2015 American Indian and Alaska Native alone 0.33% 0.42% 0.42%
% 2015 Asian alone 0.57% 0.41% 0.41%
% 2015 Native Hawaiian and OPI alone 0.00% 0.13% 0.13%
% 2015 Some Other Race alone 12.48% 12.63% 12.63%
% 2015 Two or More Races alone 2.75% 2.15% 2.15%
% 2015 Hispanic 76.58% 80.90% 80.90%
% 2015 Not Hispanic 23.42% 19.10% 19.10%
Treasure Island
1506 TX-100, Port Isabel, TX 78578
Demographics
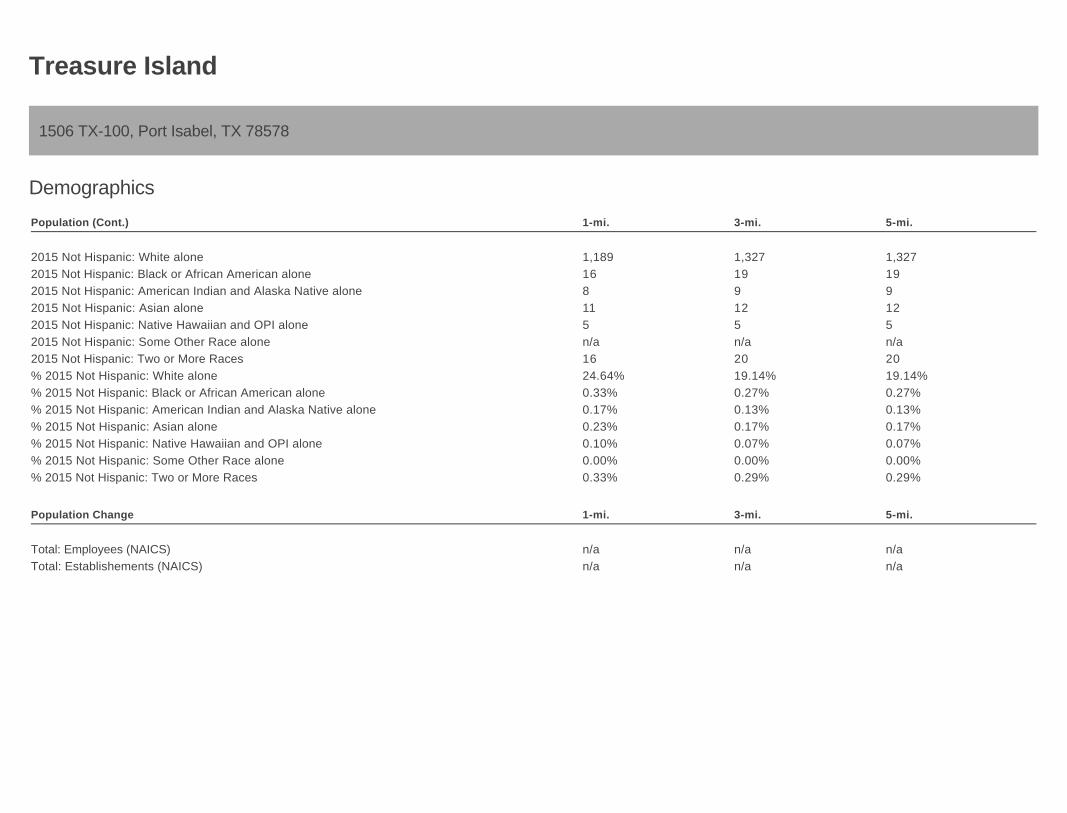
Population (Cont.) 1-mi. 3-mi. 5-mi.
2015 Not Hispanic: White alone 1,189 1,327 1,327
2015 Not Hispanic: Black or African American alone 16 19 19
2015 Not Hispanic: American Indian and Alaska Native alone 8 9 9
2015 Not Hispanic: Asian alone 11 12 12
2015 Not Hispanic: Native Hawaiian and OPI alone 5 5 5
2015 Not Hispanic: Some Other Race alone n/a n/a n/a
2015 Not Hispanic: Two or More Races 16 20 20
% 2015 Not Hispanic: White alone 24.64% 19.14% 19.14%
% 2015 Not Hispanic: Black or African American alone 0.33% 0.27% 0.27%
% 2015 Not Hispanic: American Indian and Alaska Native alone 0.17% 0.13% 0.13%
% 2015 Not Hispanic: Asian alone 0.23% 0.17% 0.17%
% 2015 Not Hispanic: Native Hawaiian and OPI alone 0.10% 0.07% 0.07%
% 2015 Not Hispanic: Some Other Race alone 0.00% 0.00% 0.00%
% 2015 Not Hispanic: Two or More Races 0.33% 0.29% 0.29%
Population Change 1-mi. 3-mi. 5-mi.
Total: Employees (NAICS) n/a n/a n/a
Total: Establishements (NAICS) n/a n/a n/a
Treasure Island
1506 TX-100, Port Isabel, TX 78578
Demographics
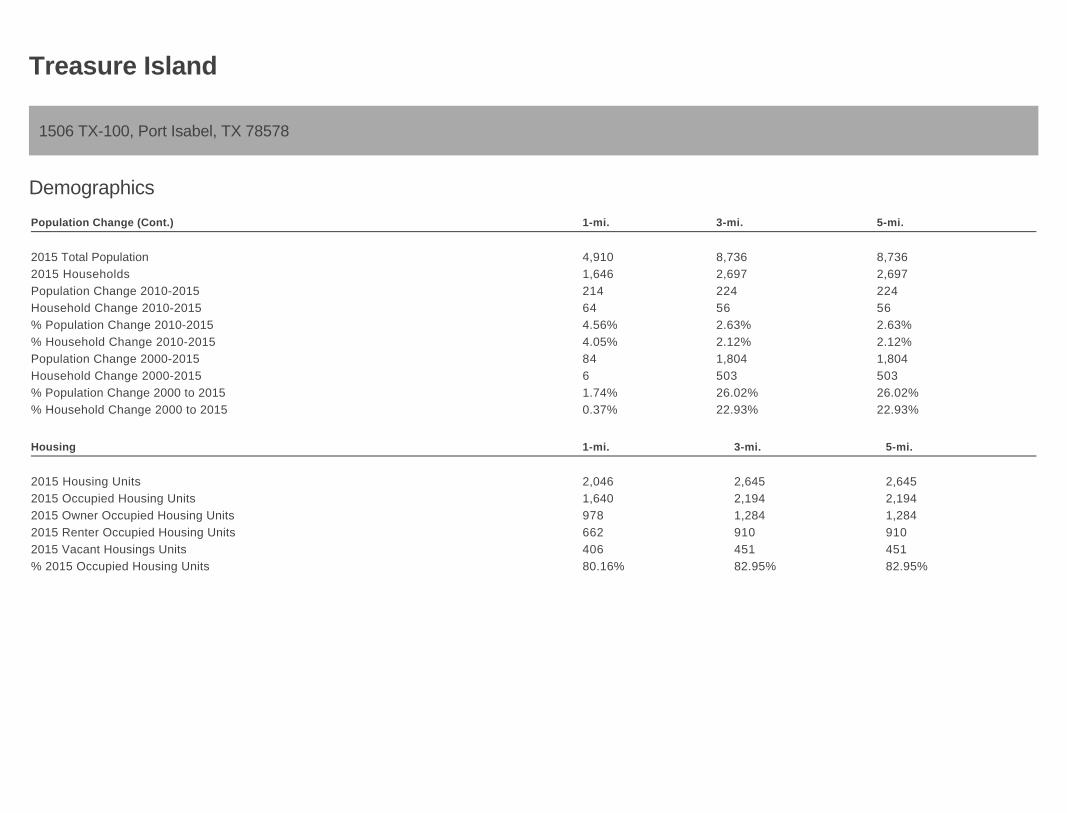
Population Change (Cont.) 1-mi. 3-mi. 5-mi.
2015 Total Population 4,910 8,736 8,736
2015 Households 1,646 2,697 2,697
Population Change 2010-2015 214 224 224
Household Change 2010-2015 64 56 56
% Population Change 2010-2015 4.56% 2.63% 2.63%
% Household Change 2010-2015 4.05% 2.12% 2.12%
Population Change 2000-2015 84 1,804 1,804
Household Change 2000-2015 6 503 503
% Population Change 2000 to 2015 1.74% 26.02% 26.02%
% Household Change 2000 to 2015 0.37% 22.93% 22.93%
Housing 1-mi. 3-mi. 5-mi.
2015 Housing Units 2,046 2,645 2,645
2015 Occupied Housing Units 1,640 2,194 2,194
2015 Owner Occupied Housing Units 978 1,284 1,284
2015 Renter Occupied Housing Units 662 910 910
2015 Vacant Housings Units 406 451 451
% 2015 Occupied Housing Units 80.16% 82.95% 82.95%
Treasure Island

1506 TX-100, Port Isabel, TX 78578
Demographics
Housing (Cont.) 1-mi. 3-mi. 5-mi.
% 2015 Owner occupied housing units 59.63% 58.52% 58.52%
% 2015 Renter occupied housing units 40.37% 41.48% 41.48%
% 2000 Vacant housing units 19.84% 17.05% 17.05%
Income 1-mi. 3-mi. 5-mi.
2015 Household Income: Median $37,856 $37,876 $37,876
2015 Household Income: Average $56,955 $55,775 $55,775
2015 Per Capita Income $19,128 $17,237 $17,237
2015 Household income: Less than $10,000 246 373 373
2015 Household income: $10,000 to $14,999 185 275 275
2015 Household income: $15,000 to $19,999 51 110 110
2015 Household income: $20,000 to $24,999 115 197 197
2015 Household income: $25,000 to $29,999 93 153 153
2015 Household income: $30,000 to $34,999 101 168 168
2015 Household income: $35,000 to $39,999 56 126 126
2015 Household income: $40,000 to $44,999 85 142 142
2015 Household income: $45,000 to $49,999 101 161 161
2015 Household income: $50,000 to $59,999 115 206 206
2015 Household income: $60,000 to $74,999 125 202 202
2015 Household income: $75,000 to $99,999 142 220 220
2015 Household income: $100,000 to $124,999 112 162 162
2015 Household income: $125,000 to $149,999 29 62 62
2015 Household income: $150,000 to $199,999 28 53 53
Treasure Island

1506 TX-100, Port Isabel, TX 78578
Demographics
Income (Cont.) 1-mi. 3-mi. 5-mi.
2015 Household income: $200,000 or more 62 87 87
% 2015 Household income: Less than $10,000 14.95% 13.83% 13.83%
% 2015 Household income: $10,000 to $14,999 11.24% 10.20% 10.20%
% 2015 Household income: $15,000 to $19,999 3.10% 4.08% 4.08%
% 2015 Household income: $20,000 to $24,999 6.99% 7.30% 7.30%
% 2015 Household income: $25,000 to $29,999 5.65% 5.67% 5.67%
% 2015 Household income: $30,000 to $34,999 6.14% 6.23% 6.23%
% 2015 Household income: $35,000 to $39,999 3.40% 4.67% 4.67%
% 2015 Household income: $40,000 to $44,999 5.16% 5.27% 5.27%
% 2015 Household income: $45,000 to $49,999 6.14% 5.97% 5.97%
% 2015 Household income: $50,000 to $59,999 6.99% 7.64% 7.64%
% 2015 Household income: $60,000 to $74,999 7.59% 7.49% 7.49%
% 2015 Household income: $75,000 to $99,999 8.63% 8.16% 8.16%
% 2015 Household income: $100,000 to $124,999 6.80% 6.01% 6.01%
% 2015 Household income: $125,000 to $149,999 1.76% 2.30% 2.30%
% 2015 Household income: $150,000 to $199,999 1.70% 1.97% 1.97%
% 2015 Household income: $200,000 or more 3.77% 3.23% 3.23%
Retail Sales Volume 1-mi. 3-mi. 5-mi.
2015 Childrens/Infants clothing stores $447,292 $744,725 $744,725
2015 Jewelry stores $154,376 $250,591 $250,591
2015 Mens clothing stores $513,867 $843,527 $843,527
2015 Shoe stores $528,446 $870,700 $870,700
Treasure Island

1506 TX-100, Port Isabel, TX 78578
Demographics
Retail Sales Volume (Cont.) 1-mi. 3-mi. 5-mi.
2015 Womens clothing stores $863,242 $1,397,211 $1,397,211
2015 Automobile dealers $6,551,741 $10,614,615 $10,614,615
2015 Automotive parts and accessories stores $1,286,728 $2,082,290 $2,082,290
2015 Other motor vehicle dealers $177,324 $283,986 $283,986
2015 Tire dealers $577,333 $933,962 $933,962
2015 Hardware stores $25,265 $40,674 $40,674
2015 Home centers $263,254 $415,801 $415,801
2015 Nursery and garden centers $319,703 $498,356 $498,356
2015 Outdoor power equipment stores $147,189 $232,996 $232,996
2015 Paint andwallpaper stores $30,409 $48,944 $48,944
2015 Appliance, television, and other electronics stores $875,946 $1,410,611 $1,410,611
2015 Camera andphotographic supplies stores $64,470 $104,543 $104,543
2015 Computer andsoftware stores $2,424,899 $3,943,361 $3,943,361
2015 Beer, wine, and liquor stores $423,226 $687,106 $687,106
2015 Convenience stores $1,948,469 $3,207,468 $3,207,468
2015 Restaurant Expenditures $1,778,500 $2,881,040 $2,881,040
2015 Supermarkets and other grocery (except convenience) stores $7,096,678 $11,577,157 $11,577,157
2015 Furniture stores $630,470 $1,023,238 $1,023,238
2015 Home furnishings stores $2,176,654 $3,502,484 $3,502,484
2015 General merchandise stores $11,488,204 $18,525,551 $18,525,551
2015 Gasoline stations with convenience stores $6,019,432 $9,849,120 $9,849,120
Treasure Island

1506 TX-100, Port Isabel, TX 78578
Demographics
Retail Sales Volume (Cont.) 1-mi. 3-mi. 5-mi.
2015 Other gasoline stations $4,308,544 $7,033,626 $7,033,626
2015 Department stores (excl leased depts) $11,333,828 $18,274,960 $18,274,960
2015 General merchandise stores $11,488,204 $18,525,551 $18,525,551
2015 Other health and personal care stores $440,080 $709,177 $709,177
2015 Pharmacies and drug stores $1,792,708 $2,882,377 $2,882,377
2015 Pet and pet supplies stores $471,240 $760,068 $760,068
2015 Book, periodical, and music stores $70,553 $112,193 $112,193
2015 Hobby, toy, and game stores $208,770 $338,057 $338,057
2015 Musical instrument and supplies stores $20,055 $32,645 $32,645
2015 Sewing, needlework, and piece goods stores $37,821 $60,618 $60,618
2015 Sporting goods stores $198,071 $320,594 $320,594
Treasure Island

[email protected](956) 778-3255License: 0508052
CHRE
312 E HarrisonHarlingen, TX 78550
Cindy Hopkins, CCIMCCIM with a diverse background, with over 15 years in the Real Estate Industry. Extensive Market Knowledge, NegotiationSkills and Diverse Client Base.TOP Producer in Sales - 2005/2006/2007/2008International Presidents Circle2007International Diamond Society 200815 years of involvement in the Real Estate IndustryCCIMCCIM Chapter Member -San AntonioCRS - Commercial Real Estate SpecialistICSC
Current Occupation: Broker
Education: San Diego State UniversityCertified Commercial Investment Member Since 2009
Organizations/Associations: CCIM, National Association of REALTORS, LoopNet, Inc., International Council of Shopping Centers(ICSC)
Honors/Awards: Top Producer Sales - Coldwell Banker - 2004 - 2009
Website: http://CHopkinsRealEstate.com
1506 TX-100, Port Isabel, TX 78578
Broker Profile
Treasure Island