presented by m. susan stegall lean certified, six sigma black belt …€¦ · · 2017-04-02lean...
TRANSCRIPT

Presented by M. Susan StegallCertified Management Consultant
Lean Certified, Six Sigma Black Belt Trained
The Four Tools—1. IPO (Inputs, Process, Outputs); 2. Process Mapping; 3. Cause and Effects Matrix; and 4. Failure Mode Effects Analysis (FMEA) Benefit of today’s session: Use these four Six Sigma tools to drive an entire DMAIC process improvement project. My Expertise: Certificates of Completion—Green and Black Belt of Six Sigma Methodology from SixSigma.us / Lean Certified by University of Michigan.
10/06/2009 2@Sprick, Stegall & Associates, LLC

10/06/2009 3@Sprick, Stegall & Associates, LLC
1. Initial Problem Perception(large, vague, complicated problem)
2. Clarify the problem
The Real Problem
3. Locate point of cause
POCDirect Cause
Cause
Cause
CauseCause
Grasp the Situation
Root Cause Investigation
Why?
Why?
Why?
Why?
Why?
4. 5 Why? Investigation of Root Cause
Root Cause
5. Countermeasure
6. Evaluate
7. Standardize
Define
Measure
Analyze
Improve
Control
80%
20%
10/06/2009
4
@Sprick, Stegall & Associates, LLC

10/06/2009@Sprick, Stegall & Associates, LLC 5
DEFINEMEASURE ANALYZE
Lean Problem Solving Six Sigma Problem Solving
Go and See Collect Data
Management by Fact Validated Data
Visual Data Displays Statistical Analysis
Shop Floor Driven Expert Driven
Daily Kaizen Project Focus
Value Stream Focus Process Focus
Bias for Action (learn by doing)
Bias for Analysis(predict and control)
10/06/2009 6

10/06/2009 7@Sprick, Stegall & Associates, LLC
Define■ “A Problem Well Stated is a Problem Half Solved.”
Y = X1, X2, X3, X4, X5, X6John Dewey
■ “An undefined problem has an infinite number of solutions.”Robert A. Humphrey
■ Criteria for Good Six Sigma ProjectsDriven by customer specificationsClearly linked to business prioritiesOf major importance to your organizationReasonable in scope—achievable in 4 to 6 monthsMeasurable quantitatively for successVisibly important to your organizationSupported and approved by management
Tool 1: IPO—a measurement tool■A high-level graphical illustration of the process Tool 2: Detailed Process Map—a measurement tool■Define each process step with inputs (controllable and
uncontrollable) and outputs clearly definedTool 3: Cause and Effect Matrix—a measurement tool■Derived from your high-level and detailed process mapTool 4: FMEA—an analysis, improvement and control tool
10/06/2009 8@Sprick, Stegall & Associates, LLC

Attendees learn to list, rapidly, a broad range of possible variables that may be causing an opportunity or a problem for their companies.Attendees learn to state the problem or opportunity as a measurable outcome—your big “Y”
10/06/2009 9@Sprick, Stegall & Associates, LLC
Goal is to get a 50,000 ft. view of the process first.Identify the process in the middle box in simple termsIdentify the Customer Requirements in the Output boxIdentify the external inputs required to make the product or service (the 6 M’s)
10/06/2009 10@Sprick, Stegall & Associates, LLC

Case study 1: You work in an acute care hospital laboratory. Your service promise to nurses and physicians is that you will have all morning run results on the patients’ charts by 7:00 AM each morning.
The laboratory staff is only meeting this service promise 50% of the time.Administration wants an improved physician satisfaction score and has specifically requested that the laboratory improve their TAT performance.
10/06/2009@Sprick, Stegall & Associates, LLC 11
IPO DIAGRAMTime allowed is 15
minutes
Your team's job is to solve this problem following the DMAIC Six Sigma process.Your first step is to develop your team's IPO
10/06/2009@Sprick, Stegall & Associates, LLC 12

Your hospital-based laboratory outreach program was launched, successfully, three years ago.Finance expects that the program will show a positive contribution margin this year (Year 4).
10/06/2009@Sprick, Stegall & Associates, LLC 13
You are three months into the calendar year, and your sales team is not meeting the expected monthly net revenues consistently—January was on track but February and March results are dismal.
IPO DIAGRAMTime allowed is 15
minutes
Your CFO has asked you to improve the net revenue line by the next quarterly review scheduled for June.Your team's job is to solve this problem following the DMAIC Six Sigma process.Your first step is to develop your team's IPO
10/06/2009@Sprick, Stegall & Associates, LLC 14

Develop your team’s IPODraw it on the flip chartPresent the IPO as you are called to the front of the room
Questions, Observations
10/06/2009 15@Sprick, Stegall & Associates, LLC
Learn to think about a process in a step-wise fashion—what happens first, second, third, etcLearn to identify the inputs required for each step and to classify the inputs as controllable vs. uncontrollable.Learn to identify the outputs from each process step as a measurable attribute.
10/06/2009 16@Sprick, Stegall & Associates, LLC

Include all value adding and non-value adding process stepsAll process step names are verbs or gerundsWrite down what comes first, then second, then third…
10/06/2009 17@Sprick, Stegall & Associates, LLC
Inputs
Inputs
Inputs
Outputs
Outputs
Outputs
10/06/2009@Sprick, Stegall & Associates, LLC 18

Time Allowed = 20 minutes Time Allowed = 20 minutes
Case Study 1: Morning TATSteps:1. Organize draw list & labels2. Perform phlebotomies3. Receive specimens and
complete pre-processing4. Distribute specimens to
testing areas5. Test specimens6. Validate and release results
Case Study 2: Monthly Sales Revenue Is Not ConsistentSteps:1. Evaluate actual net sales as
compared to planned2. Assess each sales rep’s
monthly performance3. Assess the market conditions
and competitor situation4. Draw conclusions 5. Develop Action Plan6. Implement Action Plan 7. Monitor Results
10/06/2009@Sprick, Stegall & Associates, LLC 19
Team Presentations Questions and Observations
10/06/2009@Sprick, Stegall & Associates, LLC 20

Objectives include:■To illustrate how the Cause and Effects Matrix is derived from
the Process Maps data.■To teach you the steps required to create a Cause & Effects
Matrix■To link the Cause and Effects Diagram to the Analyze,
Improve and Control Phases of the DMAIC process.■To ensure you gain some experience creating a Cause and
Effects Matrix.
10/06/2009 21@Sprick, Stegall & Associates, LLC
10/06/2009@Sprick, Stegall & Associates, LLC 22
Filtering of variables continues with the use of this tool.The Matrix quantifies and emphasizes the importance of customer requirements—your IPO Outputs—the big “Y”.The Matrix relates process input variables to your major output variables
Input variables b, c, s have direct and strong affect on your IPO Outputs, i.e. Customer Specifications

10/06/2009 23@Sprick, Stegall & Associates, LLC
10/06/2009@Sprick, Stegall & Associates, LLC 24
Process Step Process Inputs Proj
ect Y
1--
Res
ults
on
cha
rts
by 7
AM
Proj
ect Y
2--
Phys
icia
n Sa
tisfa
ctio
n Sc
ores
Im
prov
e
Proj
ect Y
3:
Proj
ect Y
4:
Total
1 Process Step 1 Input 1 02 Process Step 1 Input 2 03 Process Step 1 Input 3 04 Process Step 1 Input 4 05 Process Step 1 Input 5 06 Process Step 1 Input 6 07 Process Step 1 Input 7 08 Process Step 1 Input 8 09 Process Step 2 Input 1 0
10 Process Step 2 Input 2 011 Process Step 2 Input 3 012 Process Step 2 Input 4 013 Process Step 2 Input 5 014 Process Step 2 Input 6 0
Rating of Importance to Customer >>
Morning Run TAT
10 = Extremely Important; 0 = Not Important
Ranking Definition for Output Variables:Customer
Rating Scale
Scale 0-10Cause and Effect Matrix
Ranking Definition for Input Variables : 0 1 3 9
10/06/2009@Sprick, Stegall & Associates, LLC 25
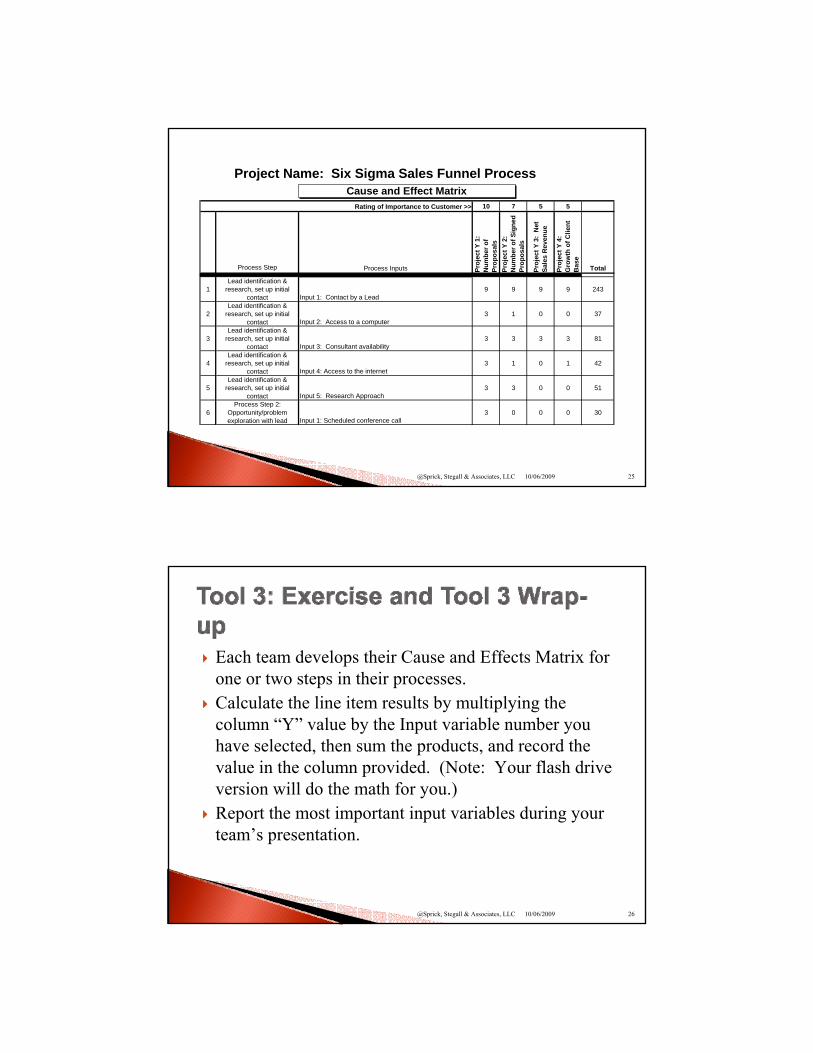
10 7 5 5
Process Step Process Inputs Proj
ect Y
1:
Num
ber o
f Pr
opos
als
Proj
ect Y
2:
Num
ber o
f Sig
ned
Prop
osal
s
Proj
ect Y
3:
Net
Sa
les
Rev
enue
Proj
ect Y
4:
Gro
wth
of C
lient
B
ase
Total
1Lead identification &
research, set up initial contact Input 1: Contact by a Lead
9 9 9 9 243
2Lead identification &
research, set up initial contact Input 2: Access to a computer
3 1 0 0 37
3Lead identification &
research, set up initial contact Input 3: Consultant availability
3 3 3 3 81
4Lead identification &
research, set up initial contact Input 4: Access to the internet
3 1 0 1 42
5Lead identification &
research, set up initial contact Input 5: Research Approach
3 3 0 0 51
6Process Step 2:
Opportunity/problem exploration with lead Input 1: Scheduled conference call
3 0 0 0 30
Rating of Importance to Customer >>
Project Name: Six Sigma Sales Funnel ProcessCause and Effect Matrix
Each team develops their Cause and Effects Matrix for one or two steps in their processes.Calculate the line item results by multiplying the column “Y” value by the Input variable number you have selected, then sum the products, and record the value in the column provided. (Note: Your flash drive version will do the math for you.)Report the most important input variables during your team’s presentation.
10/06/2009 26@Sprick, Stegall & Associates, LLC

10/06/2009@Sprick, Stegall & Associates, LLC 27
Morning TAT stability problem: Outreach Sales revenue problem
Questions, concerns and clarifications?
FMEA is a Measure, Analyze and Improve Six Sigma Tool. Session objectives include:1. Discuss the uses of FMEA2. Learn to identify sources of risk and potential failures3. Understand the steps to develop a process FMEA4. Practice creating a FMEA with our case studies
10/06/2009 28@Sprick, Stegall & Associates, LLC

1960—Aerospace industry during Apollo missions1974—Navy developed MIL-STD-1629 regarding the use of FMEALate 1970’s—automotive applications driven by liability costsNow a TS-16949 Quality System requirement
10/06/2009@Sprick, Stegall & Associates, LLC 29
A systemized & structured tool that enables the following:Measure –recognize and evaluate the potential failure of a service or processAnalyze the effects of the potential failuresImprove the service or process by implementing an action plan designed to reduce the chance of the potential failure
10/06/2009@Sprick, Stegall & Associates, LLC 30
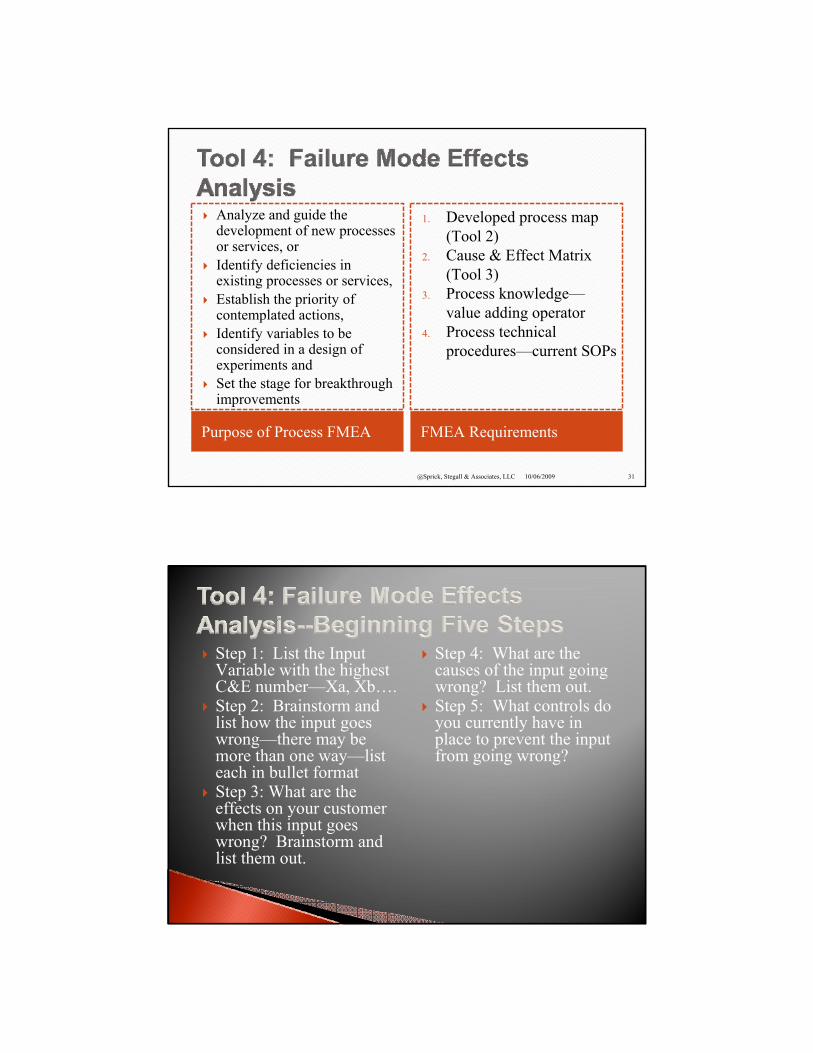
Purpose of Process FMEA FMEA Requirements
Analyze and guide the development of new processes or services, orIdentify deficiencies in existing processes or services, Establish the priority of contemplated actions,Identify variables to be considered in a design of experiments andSet the stage for breakthrough improvements
1. Developed process map (Tool 2)
2. Cause & Effect Matrix (Tool 3)
3. Process knowledge—value adding operator
4. Process technical procedures—current SOPs
10/06/2009@Sprick, Stegall & Associates, LLC 31
Step 1: List the Input Variable with the highest C&E number—Xa, Xb….Step 2: Brainstorm and list how the input goes wrong—there may be more than one way—list each in bullet formatStep 3: What are the effects on your customer when this input goes wrong? Brainstorm and list them out.
Step 4: What are the causes of the input going wrong? List them out.Step 5: What controls do you currently have in place to prevent the input from going wrong?

Your task: For each important input variable from your C&E Matrix try answering the four questions above.
10/06/2009@Sprick, Stegall & Associates, LLC 33
Worksheet for Class Exercise—Time is 20 minutes
10/06/2009@Sprick, Stegall & Associates, LLC 34
Worksheet for Class Exercise
Input Variable How the Input Variable goes wrongEffects on the customer when the input goes wrong
Severity Number
Causes of the Input variable going wrong
Occ. Number
Controls in place to prevent the Input variable from going wrong
Detection Number PRN
Cal
cu latio
n

Step 6: Create Severity, Occurrence, and Detection rating scalesStep 7: Assign Severity, Occurrence, and Detection ratings to each causeStep 8: Calculate Risk Priority Numbers for each cause
Step 9: Develop recommended actions to reduce high RPNsStep 10: Implement actions and recalculate the RPN to assure improvements occurred.
10/06/2009@Sprick, Stegall & Associates, LLC 36
= RPN

Definition of Severity—How Bad! One of Many Severity Scales
Applies only to the EffectFocus is on customer requirements (Note that customer may be external or internal)Scale is from 1 to 10◦ 1—not severe◦ 10—very severe
10/06/2009@Sprick, Stegall & Associates, LLC 37
Rating Severity of Effect10 Injure a customer or employee9 Be illegal8 Render the service unfit for use
7 Cause extreme customer dissatisfaction
6 Result in partial malfunction
5Cause a loss of performance which is likely to result in a complaint
4 Cause minor performance loss
3Cause a minor nuisance, but be overcome with no performance loss
2Be unnoticed and have only a minor affect on performance
1Be unnoticed and have no affect on performance
Definition of Occurrence—How Often!
One of Many Occurrences Scales
Estimates, based on actual measurements if possible, how often the cause occurs to create the failure mode effect.Scale is 1 to 10◦ 1—cause not likely to occur◦ 10—cause and resultant failure
mode is inevitable
10/06/2009@Sprick, Stegall & Associates, LLC 38
Rating Likelihood of Occurrence10987654321 Remote: Failure is unlikely
Very high: Failure is almost inevitable
High: Repeated Failures
Moderate: Occasional Failures
Low: Relatively few Failures

Definition of Detection—How Well! One of Many Detection Scales
Predicts how likely it is that “current controls” will detect and/or prevent causes and/or failure modes from happening.Scale is from 1 to 10◦ 1—likely to detect◦ 10—will never detect
10/06/2009@Sprick, Stegall & Associates, LLC 39
Rating Ability to Detect10 Cannot detect9 Very remote chance of detection8 Remote chance of detection7 Very low chance of detection6 Low chance of detection5 Moderate chance of detection4 Moderately high chance of detection3 High chance of detection2 Very high chance of detection1 Almost certain chance of detection
Worksheet for Class Exercise—Time is 15 minutes
10/06/2009@Sprick, Stegall & Associates, LLC 40
Worksheet for Class Exercise
Input Variable How the Input Variable goes wrongEffects on the customer when the input goes wrong
Severity Number
Causes of the Input variable going wrong
Occ. Number
Controls in place to prevent the Input variable from going wrong
Detection Number PRN
Cal
cu latio
n

10/06/2009@Sprick, Stegall & Associates, LLC 41
Develop recommendationsAssign a responsible person for implementationDevelop fictional future state RPN that shows marked improvement.Prepare for your final presentation—10 minutes
10/06/2009@Sprick, Stegall & Associates, LLC 42

IPOProcess MapCause & Effects MatrixCompleted FMEA
10/06/2009@Sprick, Stegall & Associates, LLC 43
The four tools when used together enable you to actually complete a process improvement initiative in a relatively short period of time.
10/06/2009 44@Sprick, Stegall & Associates, LLC

Sev Occ Det RPN Results Action
1 1 1 1 Ideal Situation None
1 1 10 10
10 1 1 10
10 1 10 100
1 10 1 10
1 10 10 100
10 10 1 100
10 10 10 1000 Big Trouble Emergency action!
10/06/2009 45@Sprick, Stegall & Associates, LLC
Sev Occ Det RPN Results Action1 1 1 1 Ideal Situation None1 1 10 10 Not a problem None10 1 1 10 A failure does not reach
the customerNone
10 1 10 100 Failure will reach the customer
Address your controls
1 10 1 10 Frequent failures, detectable, and cost you money
Process improvement
1 10 10 100 Frequent failures, reaches your customer
Improve detection then improve process
10 10 1 100 Frequent failures and major customer impact
Requires immediate process improvement
10 10 10 1000 Big Trouble Emergency action!
10/06/2009 46@Sprick, Stegall & Associates, LLC

Thank you for your participation.Please complete your session evaluations.
It’s been my pleasure!
10/06/2009@Sprick, Stegall & Associates, LLC 47