presented by joseph o’neill, · pdf filebasics of magnetic resonance spectroscopy ......
TRANSCRIPT

BASICS OF MAGNETIC RESONANCE SPECTROSCOPY (MRS)
Principles of Neuroimaging B– 2016 Mark S. Cohen, PhD– Instructor
March 2, 2016
presented by Joseph O’Neill, PhD
Division of Child and Adolescent Psychiatry UCLA Semel Institute of Neurosciences

MATERIALS CRIBBED FROM:Graeme Mason, PhD– Yale University
Ulrike Dydak, PhD– Indiana University
Jeffrey R. Alger, PhD-- UCLA
Joseph P. Hornak, PhD– RIT http://www.cis.rit.edu/htbooks/nmr/bnmr.htm

OUTLINE
• Elementary MRS Physics (10 min) – chemical shift effect
• Major 1H MRS Metabolites (10 min)
• MRS Methods (30 min) – acquisition – post-processing
• Questions (5-10 min)

PRELIMINARIES

1H MRS Applications in Neurology
• quantitating metabolic sequelae of hypoxia– Lac, Cr (tissue damage, acidosis, pO2, reversibility)
• mapping cell (especially neuronal) damage– NAA, Lac (extent and intensity of damage); Cho, Cr (gliosis
often masks neuron loss on MRI)• evaluating myelination and membrane breakdown
– normal brain maturation: age↑ => Cho↓, NAA ↑; membrane breakdown: Cho↑
• diagnosing inborn errors of metabolism– leukodystrophies, mitochondrial disorders, enzyme defects,
and others

NMR-Visible Nuclei (Half-Integral Spin)
1H – water, lipids, amino acids, many other metabolites
γ = 267 x 108 rad/sT
31P – ATP/ADP/AMP nucleosides, energetics, pH determination
γ = 108 x 108 rad/sT
13C - amino acids, neurotransmitters, glucose, lipids, acetate
γ = 67 x 108 rad/sT
15N - metabolism of ammonia, amino acids
19F - pharmacokinetics of fluoxetine and fluvoxamine
23Na - effects of hypoxia, challenges to Na pumps
2H - metabolism of fats
7Li - pharmacokinetics of lithium

ELEMENTARY MRS PHYSICS


MRS ACQUISITION PROCEDURE • place patient in strong magnetic field (MRI scanner)
• expose to RF induction signal from transmitter across a continuous frequency range
• record intensity of RF response at each frequency
=> series of peaks (Magnetic Resonance Spectrum) peak frequency <=> chemical functional group common to a
small family of molecules (metabolites) peak area (intensity) ∝ metabolite concentration

Water (suppressed by > 1000x)Choline compounds (Cho)
Creatine+Phosphocreatine (Cr)N-acetylaspartate (NAA) +N-acetyl-aspartyl-glutamate (NAAG)= “total NAA” (tNAA)
Brain Proton MR Spectrum - Key Signals
Lactate & Lipids
Glx
myo-inositol (mI)
Glutamate (Glu) + Glutamine (Gln) = Glx

CHEMICAL SHIFT EFFECT

CHEMICAL SHIFT EFFECT (Shielding)
B = B0(1-σ)

CHEMICAL SHIFT EFFECT (Enhancement-- Deshielding)
B = B0(1-σ)


CHEMICAL SHIFT EFFECT
B = B0(1-σ) δ(ppm) = f – f0 x106
f0

MAJOR 1H MRS METABOLITES


Water (suppressed by > 1000x)Choline compounds (Cho)
Creatine+Phosphocreatine (Cr)N-acetylaspartate (NAA) +N-acetyl-aspartyl-glutamate (NAAG)= “total NAA” (tNAA)
Brain Proton MR Spectrum - Key Signals
Lactate & Lipids
Glx
myo-inositol (mI)
Glutamate (Glu) + Glutamine (Gln) = Glx


Glutamate (Glu)+Glutamine (Gln)=Glx (2.1-2.5 ppm)
Glu excitatory amino acid NT, synthesized in neurons
Gln neutral form of Glu, synthesized in gliainteract with Krebs Cycle (energetics)
Glu excitotoxicity presumed in many diseases
Glu Gln+


myo-Inositol (mI; 3.54 ppm)
cyclic monosaccharide
more abundant in glia
cellular second-messenger
cell-membrane metabolismelevated in Alzheimer’s
disease
MRS METHODS(acquisition, post-processing)

4 STEPS TO ALL MRS ACQUISITION
• positioning (prescription)
• shimming
• water-suppression (1H MRS only)
• excitation (and reception)

POSITIONING (PRESCRIPTION)


Single-Voxel MRS Procedureselect a volume element (voxel) of interest (> 2 cc)
acquire a spectrum from that voxel (< 1 min)

MAGNETIC RESONANCE SPECTROSCOPIC IMAGING (MRSI)
O’Neill, Frew, Alger et al. (2006)


SHIMMING


WATER-SUPPRESSION

Haase et al. (1985)
CHEMICAL SHIFT SELECTIVE (CHESS)

EXCITATION(Pulse-Sequences)


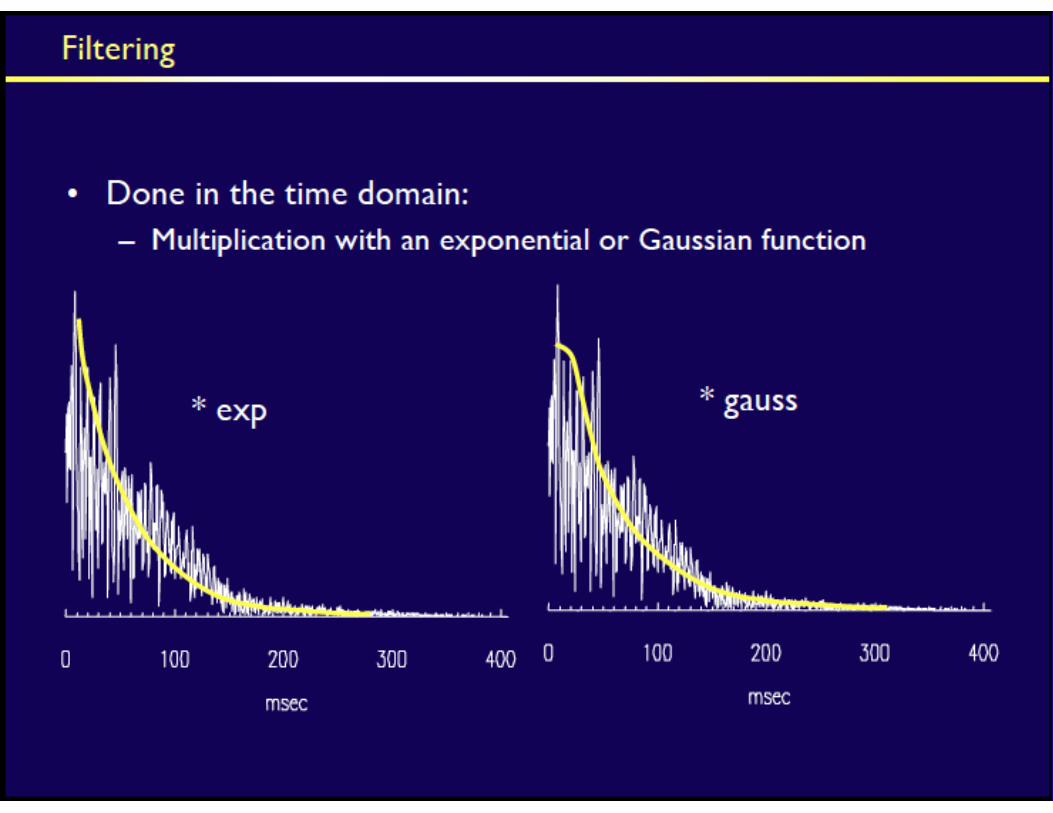
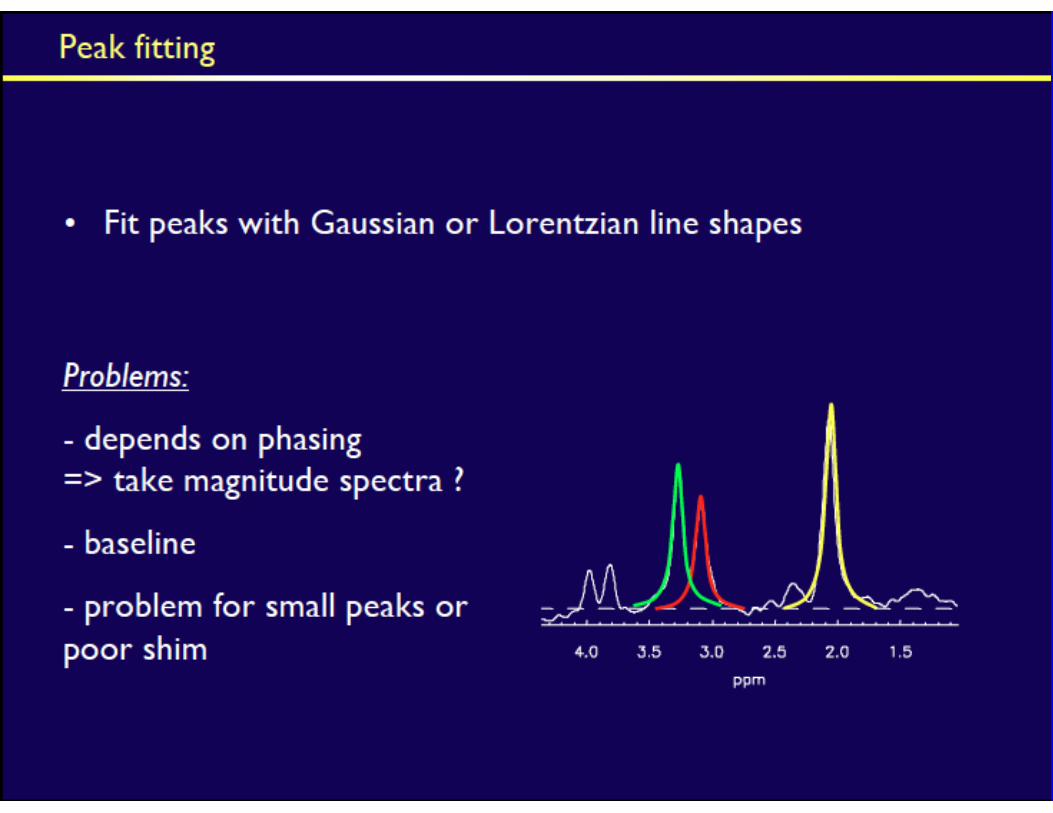
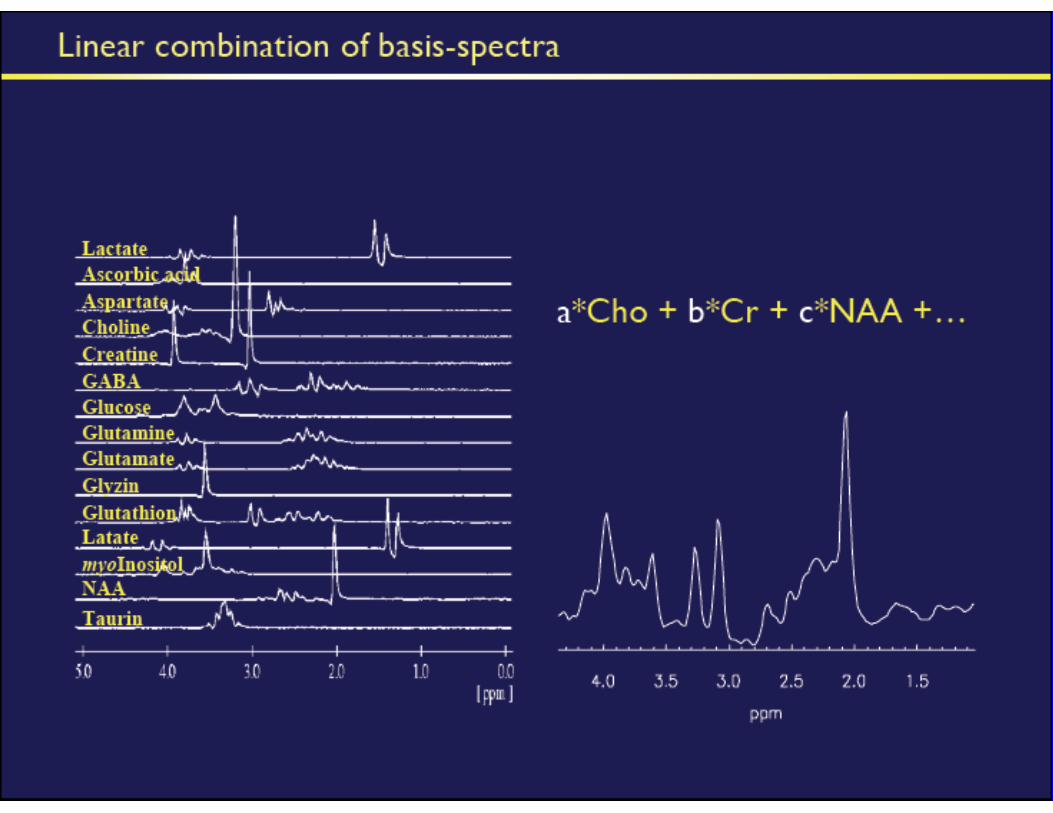
MRS POST-PROCESSING