presented by : ali muhammad lakdawala · "revisiting asian financial crisis for envisioning...
TRANSCRIPT

"Revisiting Asian Financial Crisis for Envisioning Commodity Market Outlook”
Presented by : Ali Muhammad LakdawalaITC Ltd (Foods Division)
Email : [email protected]
GLOBOIL 2017, Mumbai

Views shared in the paper are author’s view and not to be
considered as company’s view or being endorsed by
company which author represents.Disclaimer

Why Revisiting 1997 Crisis???
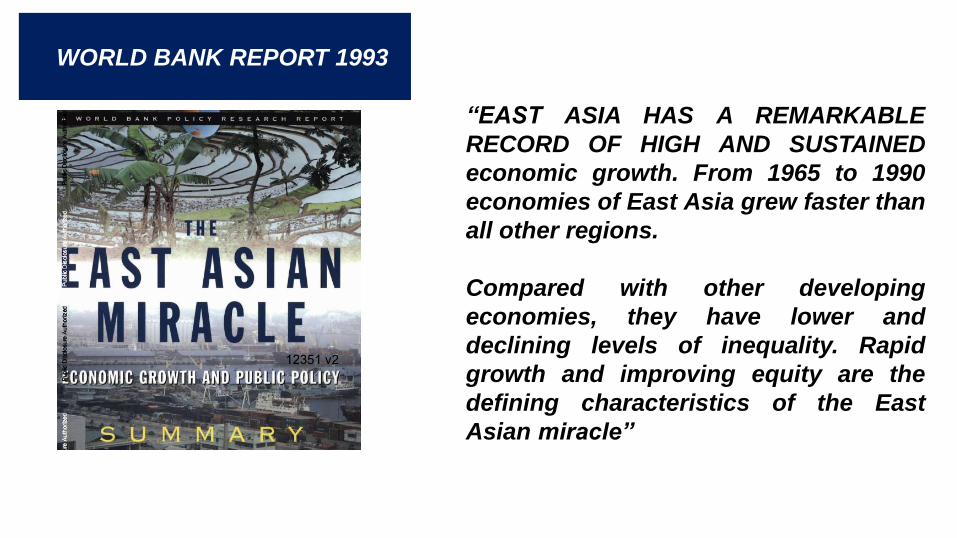
WORLD BANK REPORT 1993
“EAST ASIA HAS A REMARKABLE
RECORD OF HIGH AND SUSTAINED
economic growth. From 1965 to 1990
economies of East Asia grew faster than
all other regions.
Compared with other developing
economies, they have lower and
declining levels of inequality. Rapid
growth and improving equity are the
defining characteristics of the East
Asian miracle”
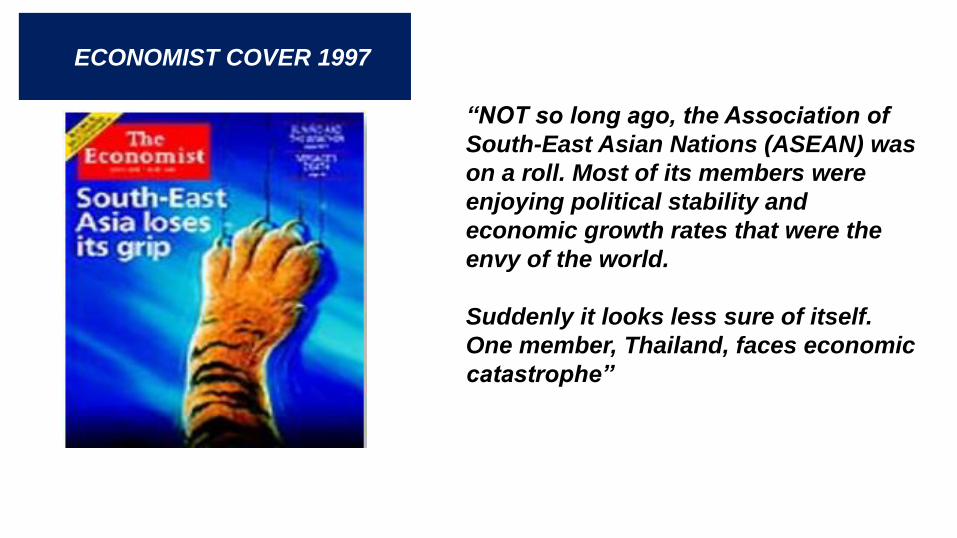
ECONOMIST COVER 1997
“NOT so long ago, the Association of
South-East Asian Nations (ASEAN) was
on a roll. Most of its members were
enjoying political stability and
economic growth rates that were the
envy of the world.
Suddenly it looks less sure of itself.
One member, Thailand, faces economic
catastrophe”
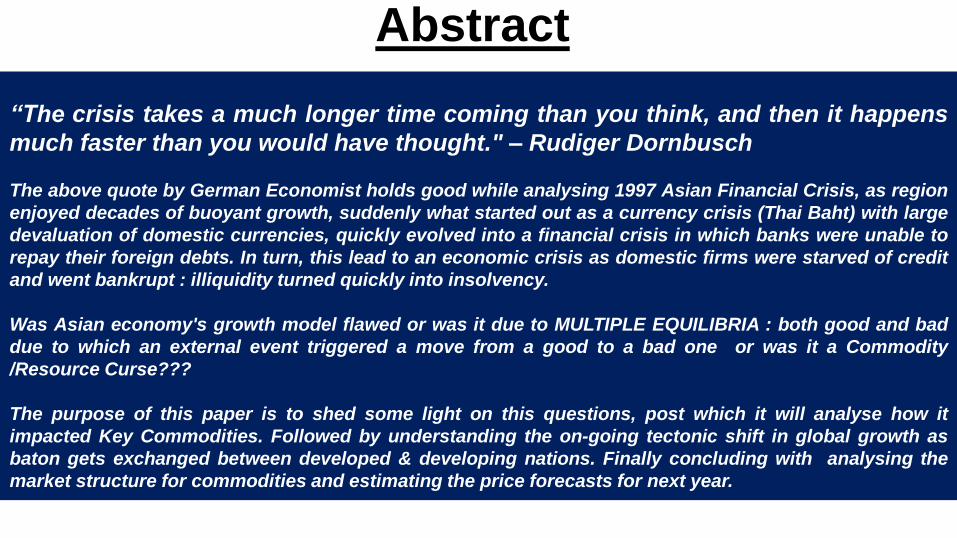
“The crisis takes a much longer time coming than you think, and then it happens
much faster than you would have thought." – Rudiger Dornbusch
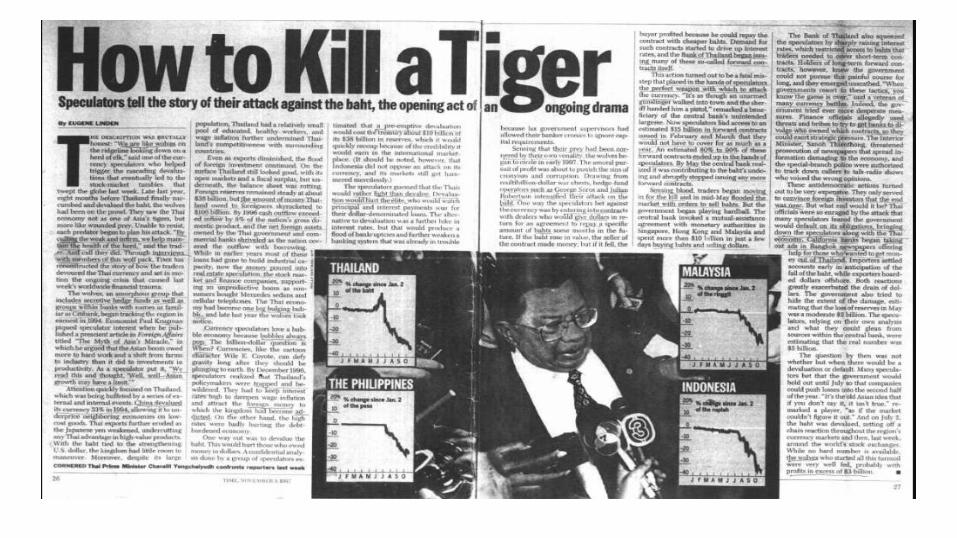
The above quote by German Economist holds good while analysing 1997 Asian Financial Crisis, as region
enjoyed decades of buoyant growth, suddenly what started out as a currency crisis (Thai Baht) with large
devaluation of domestic currencies, quickly evolved into a financial crisis in which banks were unable to
repay their foreign debts. In turn, this lead to an economic crisis as domestic firms were starved of credit
and went bankrupt : illiquidity turned quickly into insolvency.
Was Asian economy's growth model flawed or was it due to MULTIPLE EQUILIBRIA : both good and bad
due to which an external event triggered a move from a good to a bad one or was it a Commodity
/Resource Curse???
The purpose of this paper is to shed some light on this questions, post which it will analyse how it
impacted Key Commodities. Followed by understanding the on-going tectonic shift in global growth as
baton gets exchanged between developed & developing nations. Finally concluding with analysing the
market structure for commodities and estimating the price forecasts for next year.
Abstract
Presentation Flow
• Asia Growth Story
• Was it really “Asia” Financial Crisis???
• Impact on Commodities
• Current Scenario
• What NEXT???
• Commodity Market Structure
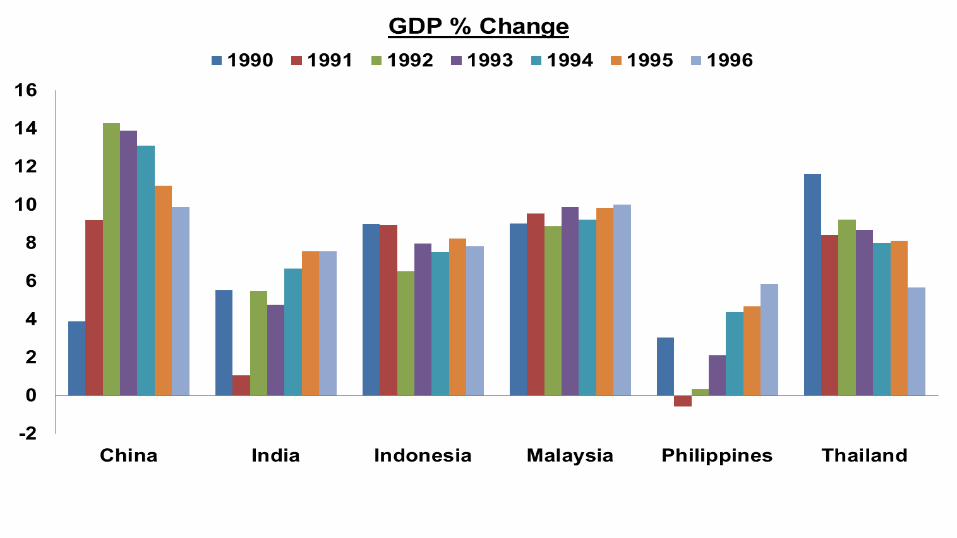
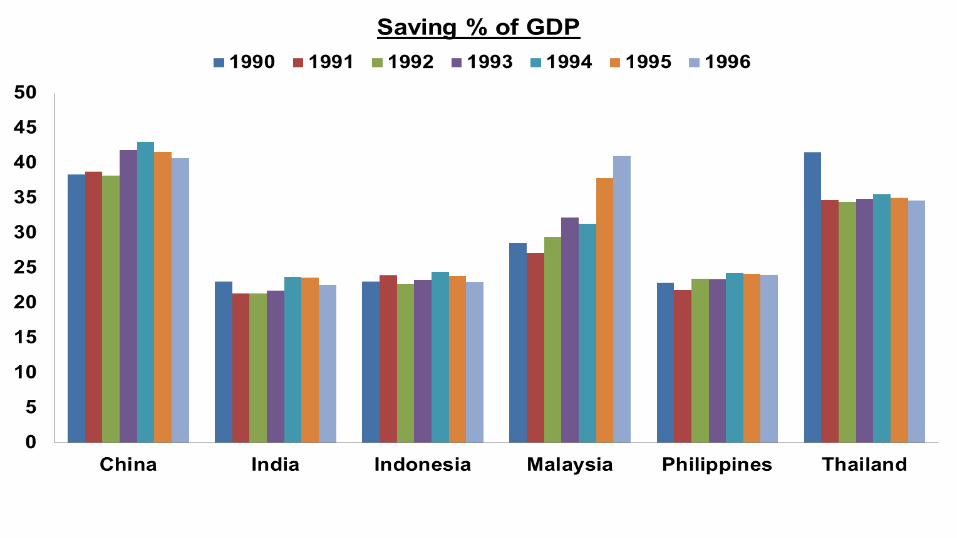
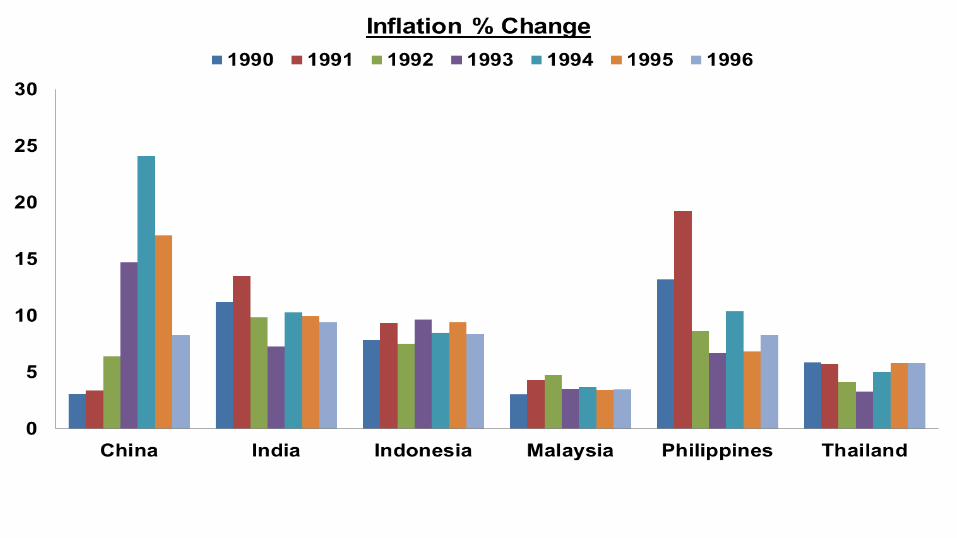
VUCA ASIA GROWTH STORYRapid economic growth, Persistence of rapid economic growth – an unprecedented long period of economic
expansion, Moderate Inflation & Political stability
WMD “Where are they???"
WMD “Where are they???"
WMD “Where are they???"
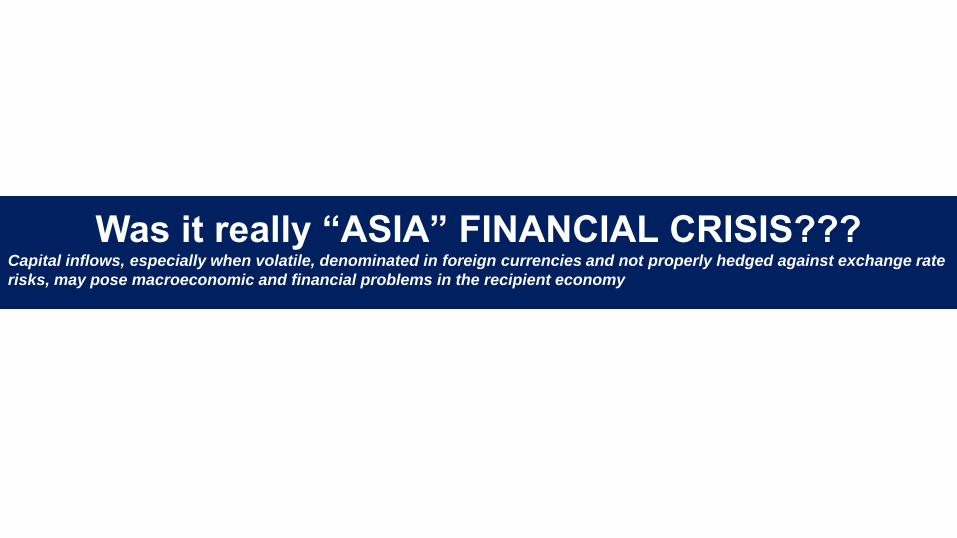
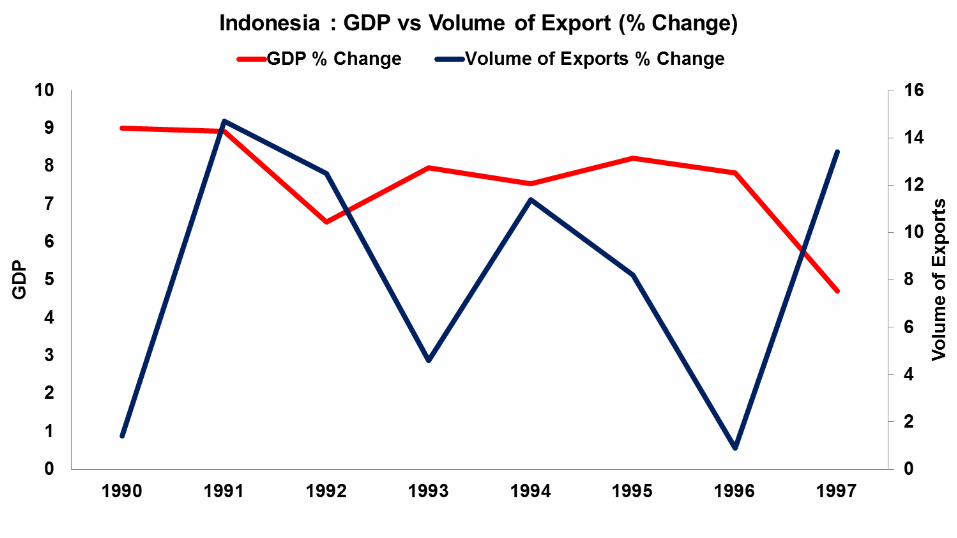
VUCAWas it really “ASIA” FINANCIAL CRISIS???
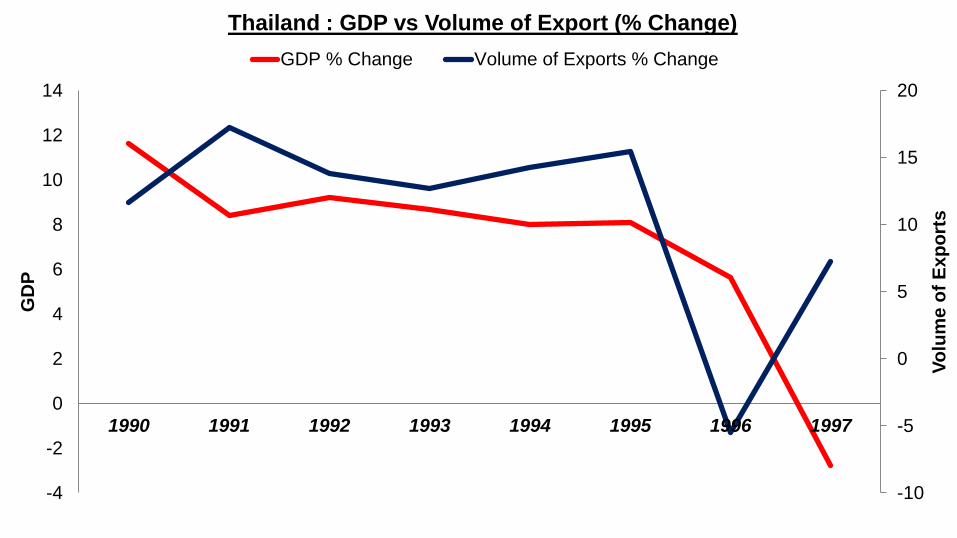
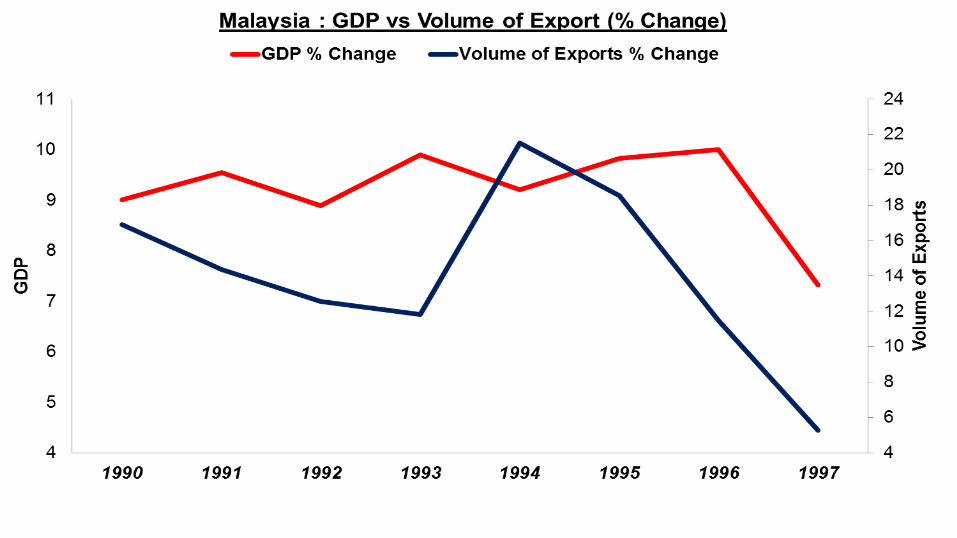
Capital inflows, especially when volatile, denominated in foreign currencies and not properly hedged against exchange rate
risks, may pose macroeconomic and financial problems in the recipient economy
-10
-5
0
5
10
15
20
-4
-2
0
2
4
6
8
10
12
14
1990 1991 1992 1993 1994 1995 1996 1997
Vo
lum
e o
f E
xp
ort
s
GD
PThailand : GDP vs Volume of Export (% Change)
GDP % Change Volume of Exports % Change
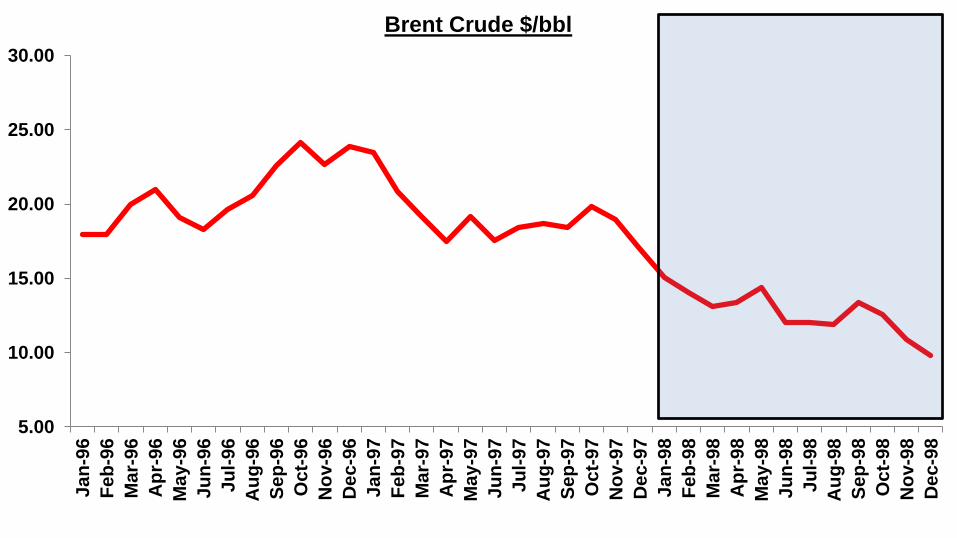
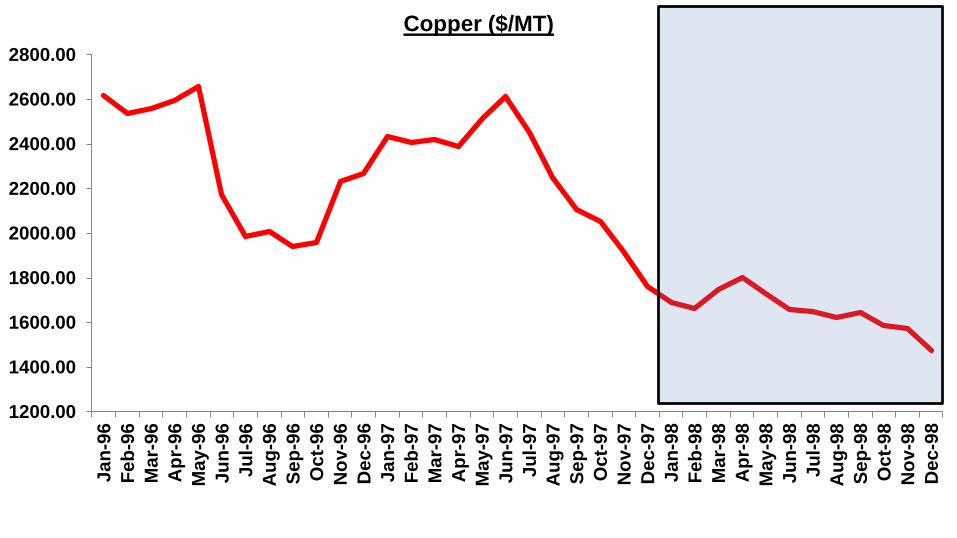
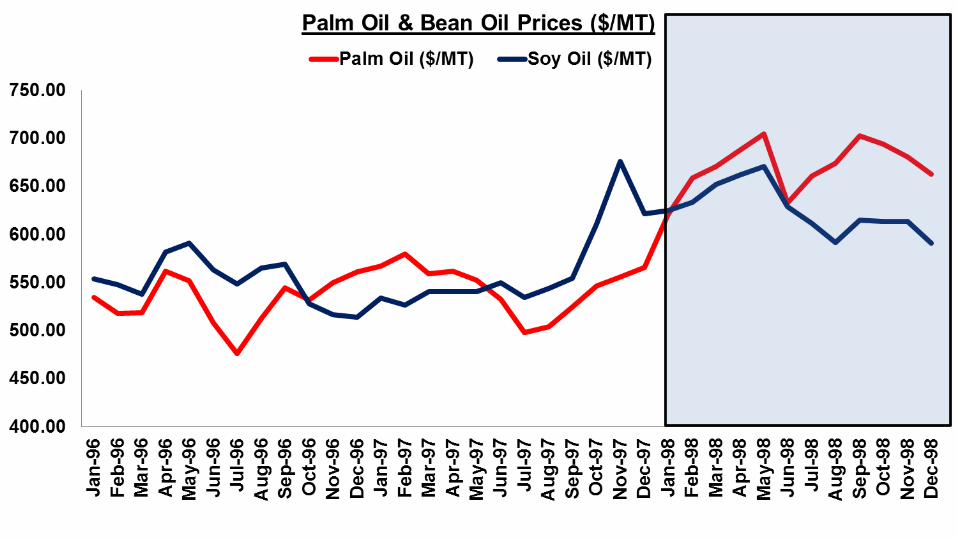
VUCAIMPACT ON COMMODITIES
Most populous region of the world needs resources to feed & fuel its economy : hence key influencer in commodity market
5.00
10.00
15.00
20.00
25.00
30.00
Ja
n-9
6
Fe
b-9
6
Ma
r-9
6
Ap
r-9
6
Ma
y-9
6
Ju
n-9
6
Ju
l-9
6
Au
g-9
6
Se
p-9
6
Oc
t-9
6
No
v-9
6
De
c-9
6
Jan
-97
Fe
b-9
7
Ma
r-9
7
Ap
r-9
7
Ma
y-9
7
Ju
n-9
7
Ju
l-9
7
Au
g-9
7
Se
p-9
7
Oc
t-9
7
No
v-9
7
De
c-9
7
Ja
n-9
8
Fe
b-9
8
Ma
r-9
8
Ap
r-98
Ma
y-9
8
Ju
n-9
8
Ju
l-9
8
Au
g-9
8
Se
p-9
8
Oc
t-9
8
No
v-9
8
De
c-9
8
Brent Crude $/bbl
1200.00
1400.00
1600.00
1800.00
2000.00
2200.00
2400.00
2600.00
2800.00
Ja
n-9
6
Fe
b-9
6
Ma
r-9
6
Ap
r-9
6
Ma
y-9
6
Ju
n-9
6
Ju
l-9
6
Au
g-9
6
Se
p-9
6
Oct-
96
No
v-9
6
De
c-9
6
Ja
n-9
7
Fe
b-9
7
Ma
r-9
7
Ap
r-9
7
Ma
y-9
7
Ju
n-9
7
Ju
l-9
7
Au
g-9
7
Se
p-9
7
Oc
t-9
7
No
v-9
7
De
c-9
7
Ja
n-9
8
Fe
b-9
8
Ma
r-9
8
Ap
r-9
8
Ma
y-9
8
Ju
n-9
8
Ju
l-9
8
Au
g-9
8
Sep
-98
Oc
t-9
8
No
v-9
8
De
c-9
8
Copper ($/MT)
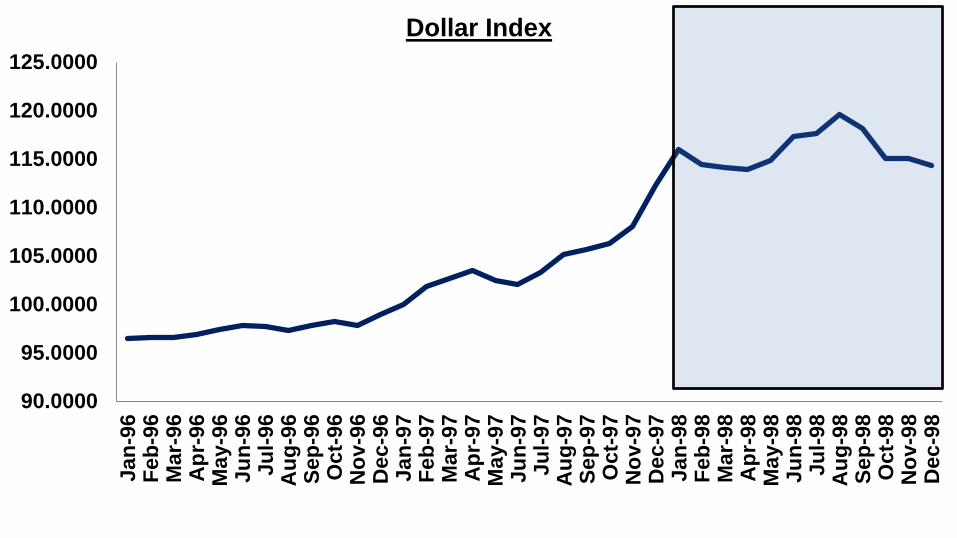
90.0000
95.0000
100.0000
105.0000
110.0000
115.0000
120.0000
125.0000
Jan
-96
Fe
b-9
6M
ar-
96
Ap
r-96
May-9
6Ju
n-9
6Ju
l-96
Au
g-9
6S
ep
-96
Oct-
96
No
v-9
6D
ec
-96
Jan
-97
Fe
b-9
7M
ar-
97
Ap
r-97
May-9
7Ju
n-9
7Ju
l-97
Au
g-9
7S
ep
-97
Oct-
97
No
v-9
7D
ec
-97
Jan
-98
Fe
b-9
8M
ar-
98
Ap
r-98
May-9
8J
un
-98
Ju
l-98
Au
g-9
8S
ep
-98
Oct-
98
No
v-9
8D
ec
-98
Dollar Index
0
1
2
3
4
5
6
7
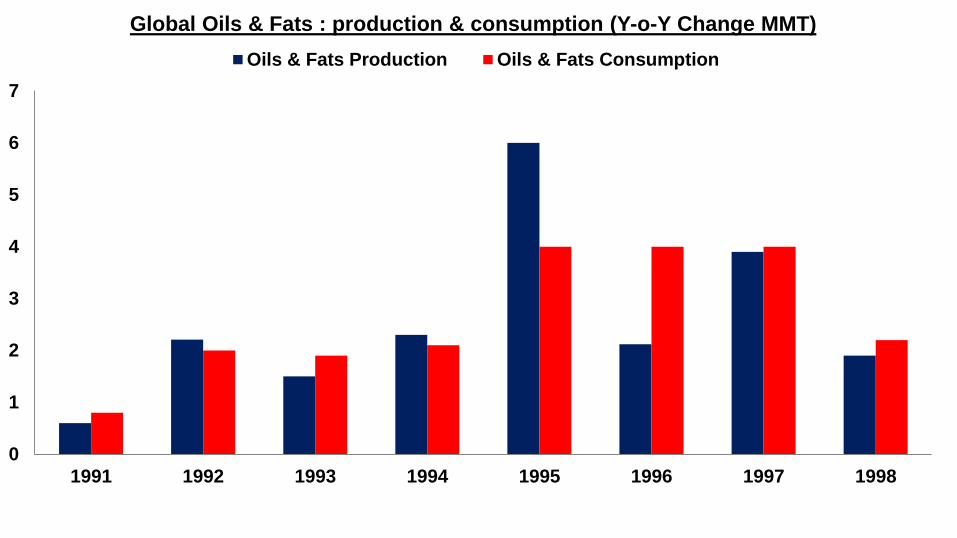
1991 1992 1993 1994 1995 1996 1997 1998
Global Oils & Fats : production & consumption (Y-o-Y Change MMT)
Oils & Fats Production Oils & Fats Consumption
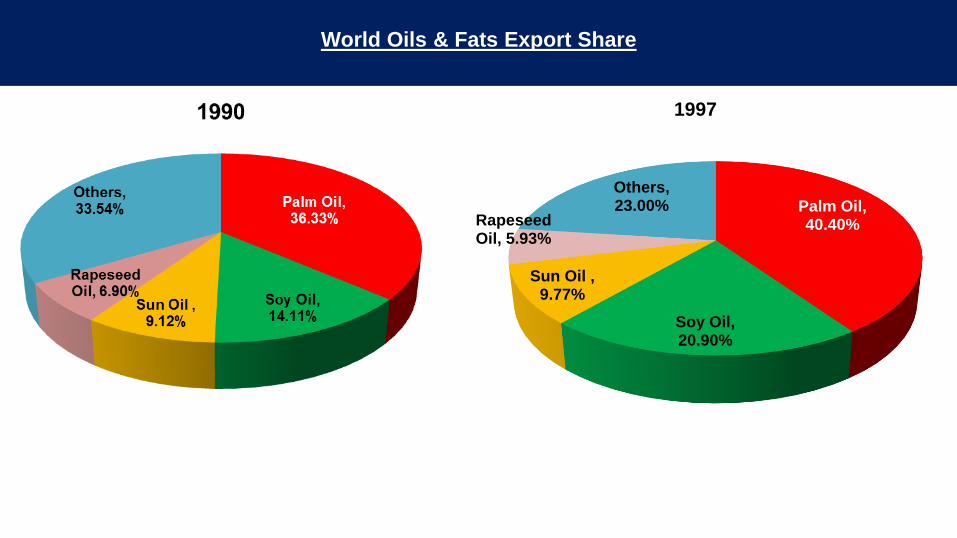
Palm Oil, 40.40%
Soy Oil, 20.90%
Sun Oil , 9.77%
Rapeseed Oil, 5.93%
Others, 23.00%
1997
World Oils & Fats Export Share
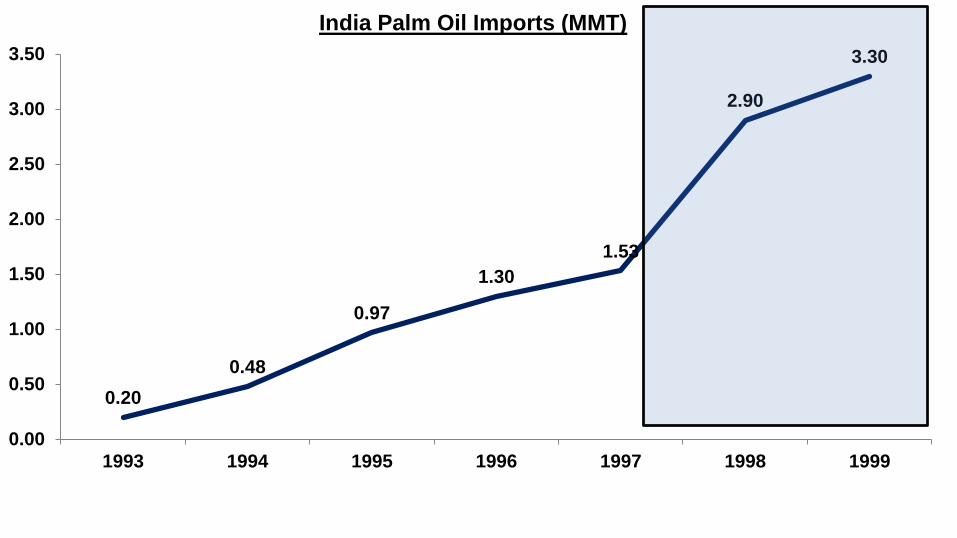
0.20
0.48
0.97
1.30
1.53
2.90
3.30
0.00
0.50
1.00
1.50
2.00
2.50
3.00
3.50
1993 1994 1995 1996 1997 1998 1999
India Palm Oil Imports (MMT)

VUCACURRENT SCENARIO
Fast Forwarding from 1997 to 2017
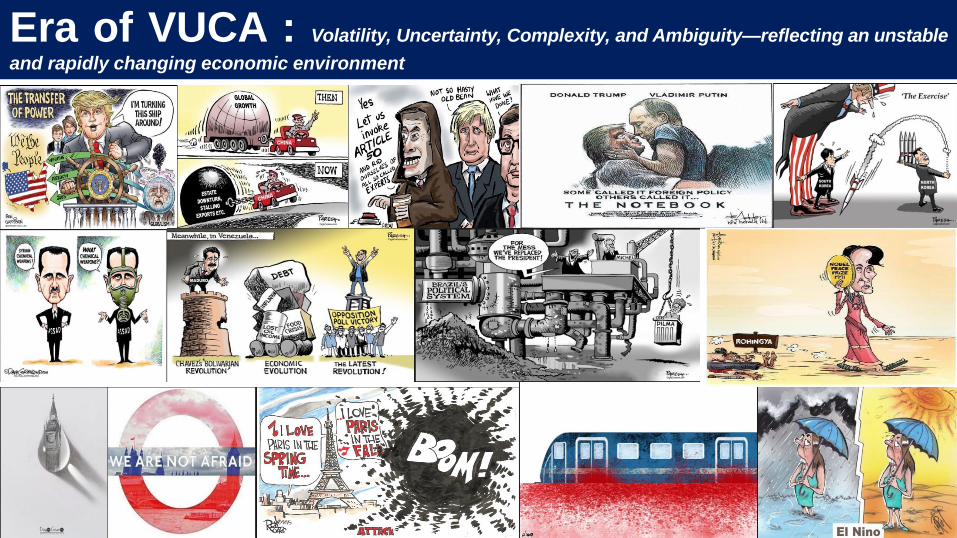
Era of VUCA : Volatility, Uncertainty, Complexity, and Ambiguity—reflecting an unstable
and rapidly changing economic environment
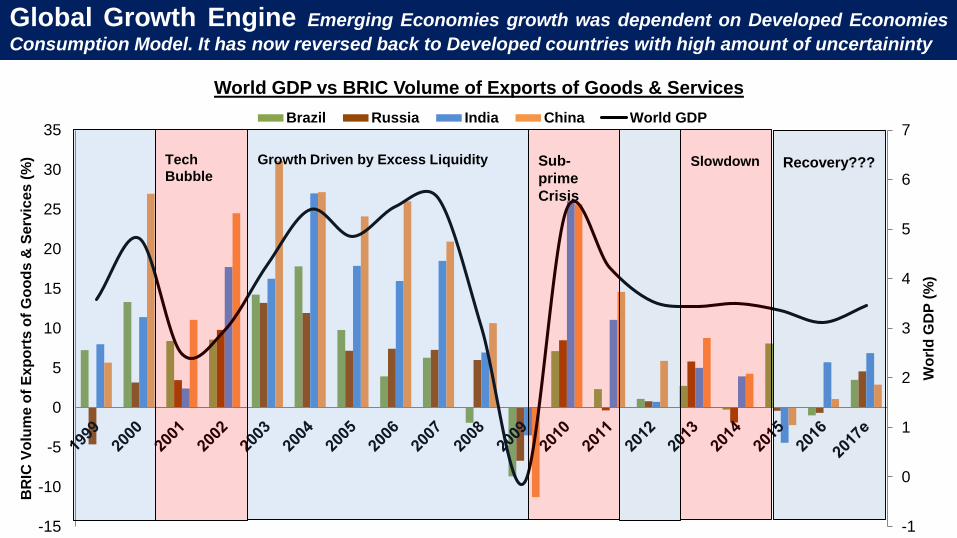
Global Growth Engine Emerging Economies growth was dependent on Developed Economies
Consumption Model. It has now reversed back to Developed countries with high amount of uncertaininty
-1
0
1
2
3
4
5
6
7
-15
-10
-5
0
5
10
15
20
25
30
35
Wo
rld
GD
P (
%)
BR
IC V
olu
me
of
Ex
po
rts
of
Go
od
s &
Se
rvic
es
(%
)
World GDP vs BRIC Volume of Exports of Goods & Services
Brazil Russia India China World GDP
Tech
BubbleSub-
prime
Crisis
Growth Driven by Excess Liquidity Slowdown Recovery???
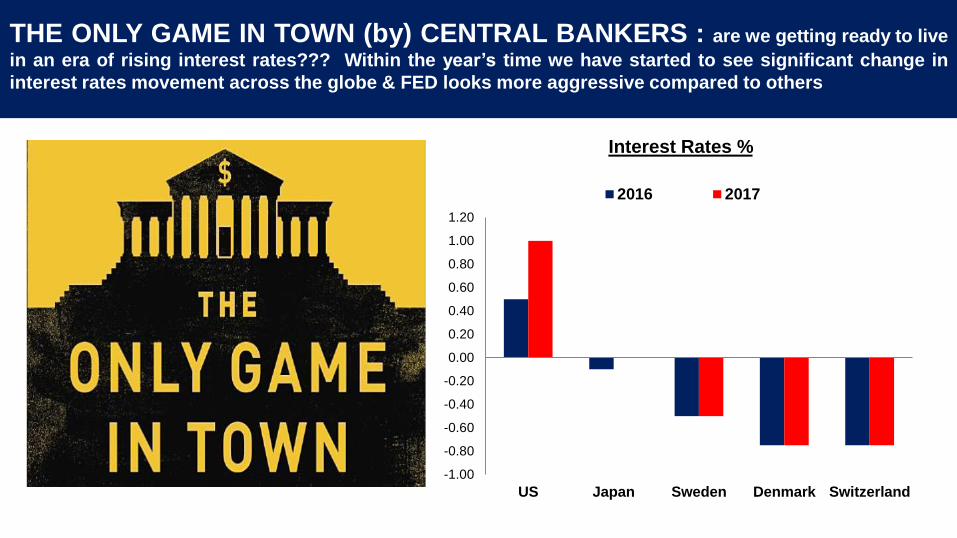
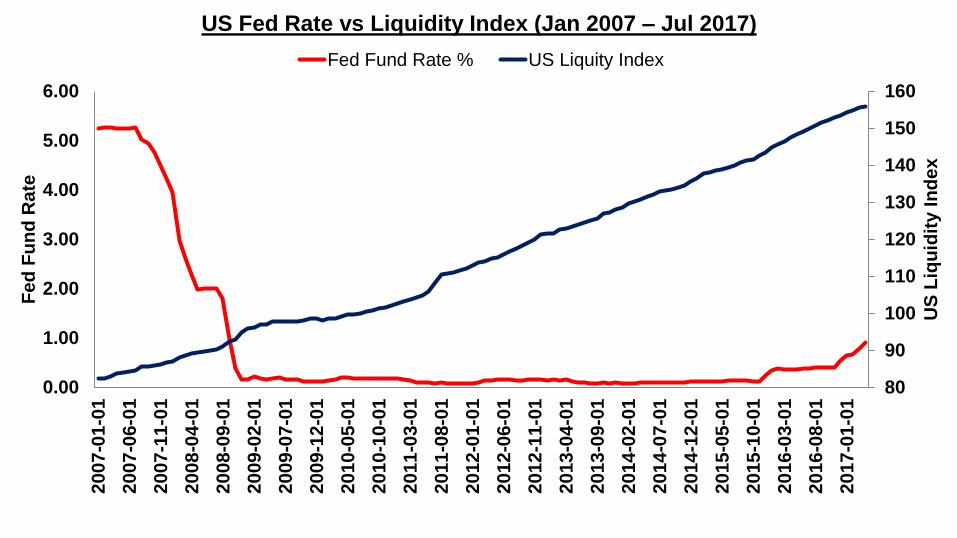
THE ONLY GAME IN TOWN (by) CENTRAL BANKERS : are we getting ready to live
in an era of rising interest rates??? Within the year’s time we have started to see significant change in
interest rates movement across the globe & FED looks more aggressive compared to others
-1.00
-0.80
-0.60
-0.40
-0.20
0.00
0.20
0.40
0.60
0.80
1.00
1.20
US Japan Sweden Denmark Switzerland
Interest Rates %
2016 2017
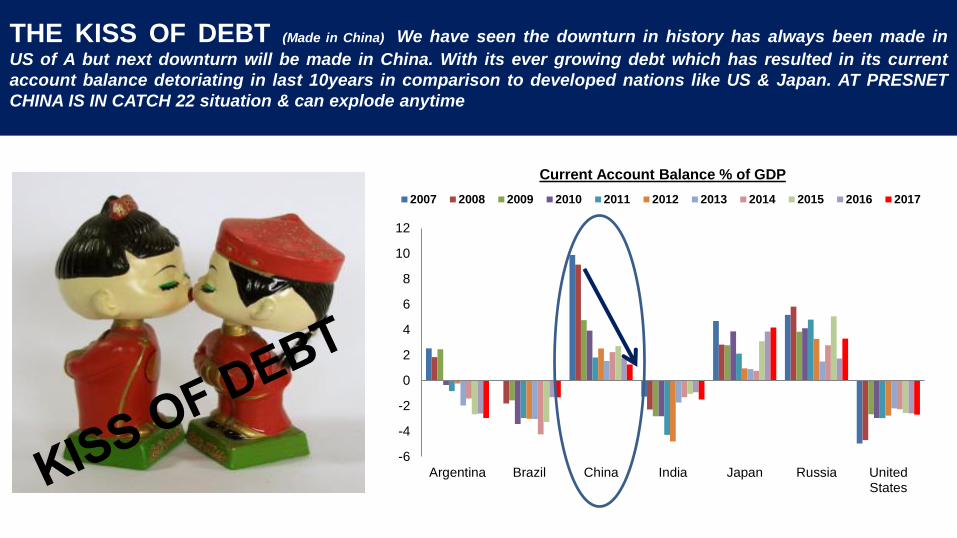
THE KISS OF DEBT (Made in China) We have seen the downturn in history has always been made in
US of A but next downturn will be made in China. With its ever growing debt which has resulted in its current
account balance detoriating in last 10years in comparison to developed nations like US & Japan. AT PRESNET
CHINA IS IN CATCH 22 situation & can explode anytime
-6
-4
-2
0
2
4
6
8
10
12
Argentina Brazil China India Japan Russia UnitedStates
Current Account Balance % of GDP
2007 2008 2009 2010 2011 2012 2013 2014 2015 2016 2017

VUCA WHAT NEXT???It’s Gonna be 4D World
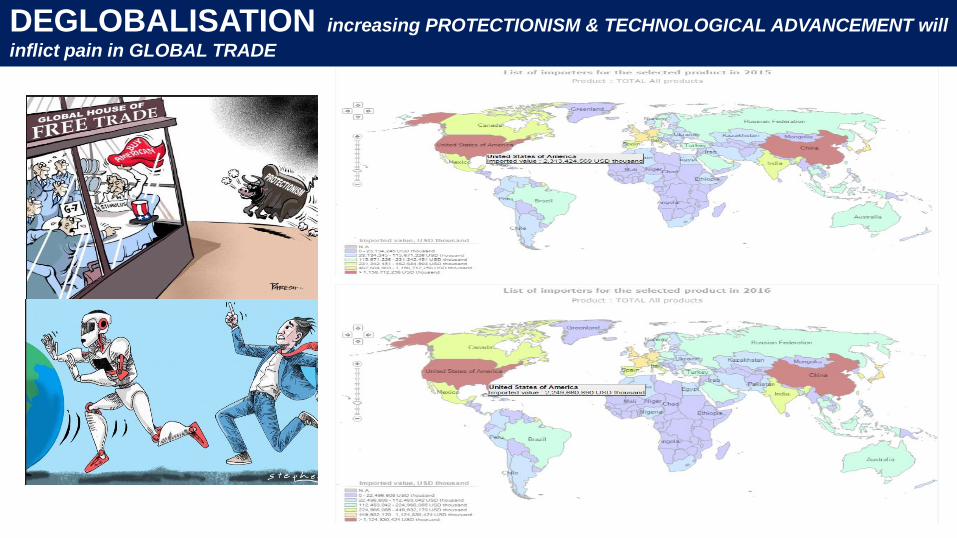
DEGLOBALISATION increasing PROTECTIONISM & TECHNOLOGICAL ADVANCEMENT will
inflict pain in GLOBAL TRADE
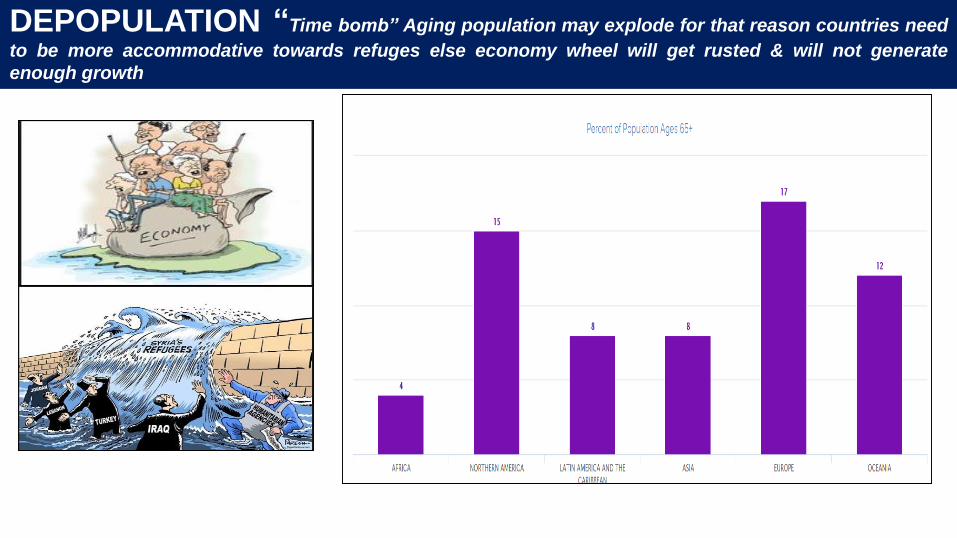
DEPOPULATION “Time bomb” Aging population may explode for that reason countries need
to be more accommodative towards refuges else economy wheel will get rusted & will not generate
enough growth
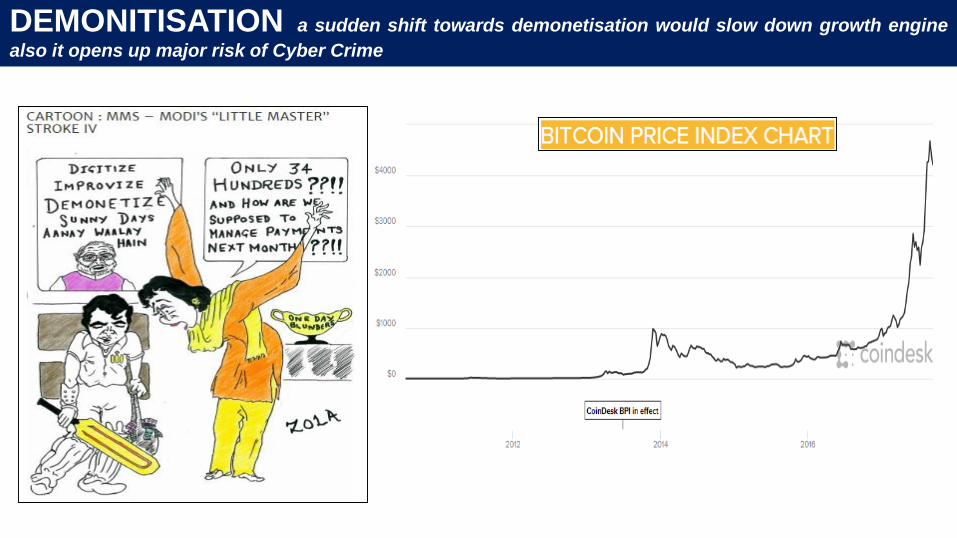
DEMONITISATION a sudden shift towards demonetisation would slow down growth engine
also it opens up major risk of Cyber Crime
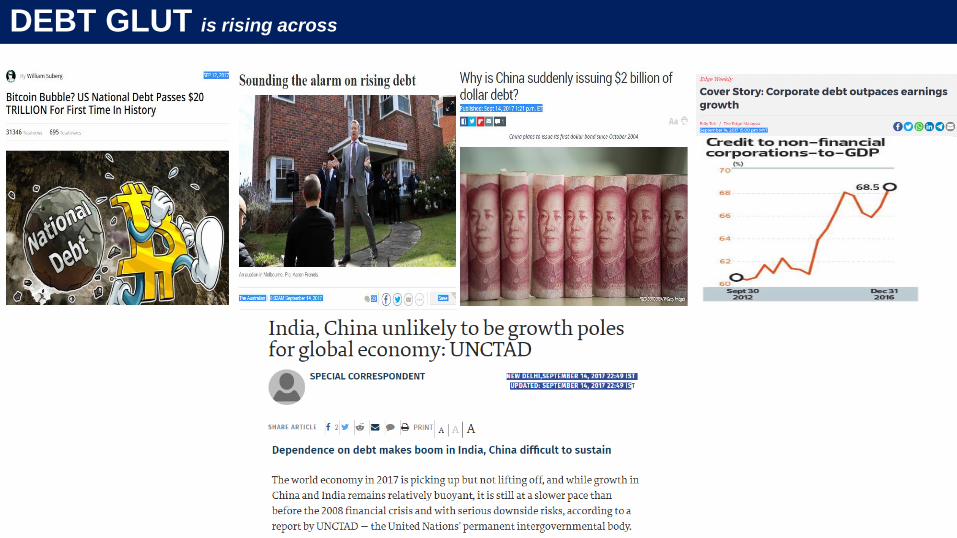
DEBT GLUT is rising across

VUCACOMMODITY MARKET STRUCTURE
100
120
140
160
180
200
220
240
260
1
1.2
1.4
1.6
1.8
2
2.2
2.4
2.6
Q1-2
011
Q2
-20
11
Q3
-20
11
Q4
-20
11
Q1
-20
12
Q2
-20
12
Q3
-20
12
Q4
-20
12
Q1
-20
13
Q2
-20
13
Q3
-20
13
Q4-2
013
Q1
-20
14
Q2
-20
14
Q3-2
014
Q4
-20
14
Q1
-20
15
Q2
-20
15
Q3
-20
15
Q4
-20
15
Q1
-20
16
Q2
-20
16
Q3
-20
16
Q4
-20
16
Q1
-20
17
Meta
l In
dex
Ch
ina
GD
P
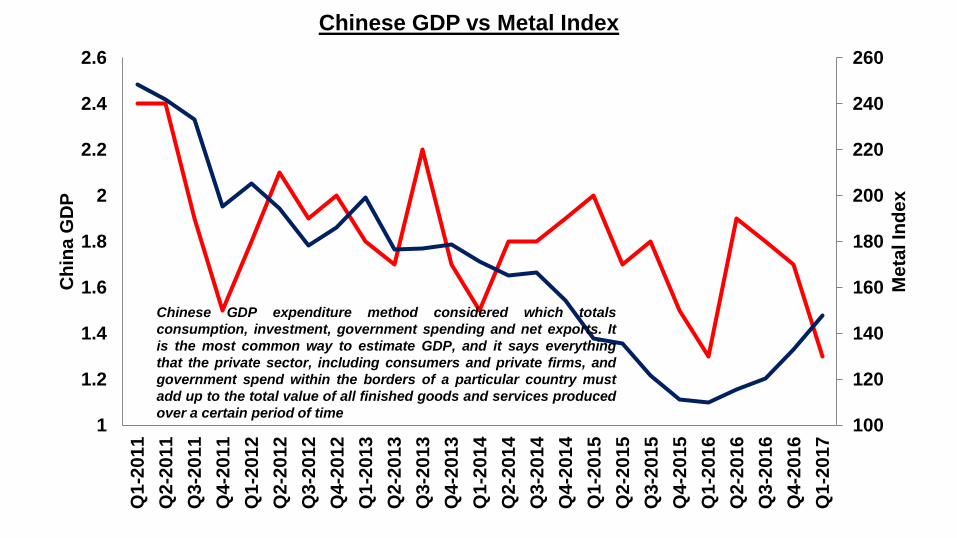
Chinese GDP vs Metal Index
Chinese GDP expenditure method considered which totals
consumption, investment, government spending and net exports. It
is the most common way to estimate GDP, and it says everything
that the private sector, including consumers and private firms, and
government spend within the borders of a particular country must
add up to the total value of all finished goods and services produced
over a certain period of time
80.00
100.00
120.00
140.00
160.00
180.00
200.00
220.00
240.00
5.0000
6.0000
7.0000
8.0000
Jan-0
7
Ju
n-0
7
No
v-0
7
Ap
r-0
8
Se
p-0
8
Fe
b-0
9
Ju
l-0
9
Dec-0
9
Ma
y-1
0
Oct-
10
Ma
r-1
1
Au
g-1
1
Ja
n-1
2
Ju
n-1
2
Nov-1
2
Ap
r-1
3
Se
p-1
3
Fe
b-1
4
Ju
l-1
4
De
c-1
4
Ma
y-1
5
Oct-
15
Ma
r-1
6
Au
g-1
6
Ja
n-1
7
Jun-1
7
Co
mD
ex
Yu
an
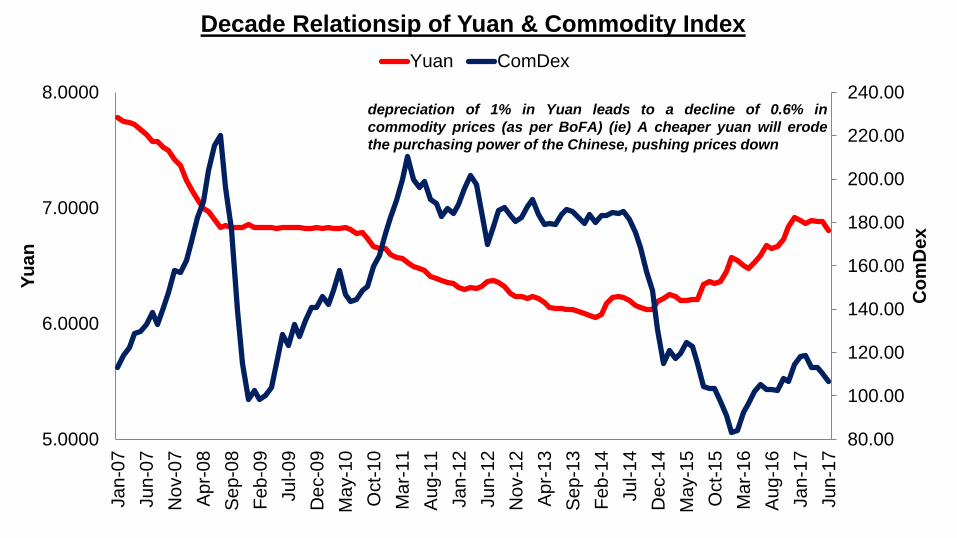
Decade Relationsip of Yuan & Commodity Index
Yuan ComDex
depreciation of 1% in Yuan leads to a decline of 0.6% in
commodity prices (as per BoFA) (ie) A cheaper yuan will erode
the purchasing power of the Chinese, pushing prices down
80
90
100
110
120
130
140
150
160
0.00
1.00
2.00
3.00
4.00
5.00
6.002
00
7-0
1-0
1
2007-0
6-0
1
20
07
-11
-01
20
08
-04
-01
20
08
-09
-01
2009-0
2-0
1
20
09
-07
-01
20
09
-12
-01
20
10
-05
-01
2010-1
0-0
1
20
11
-03
-01
20
11
-08
-01
20
12
-01
-01
2012-0
6-0
1
20
12
-11
-01
20
13
-04
-01
20
13
-09
-01
2014-0
2-0
1
20
14
-07
-01
20
14
-12
-01
20
15
-05
-01
2015-1
0-0
1
20
16
-03
-01
20
16
-08
-01
20
17
-01
-01
US
Liq
uid
ity I
nd
ex
Fe
d F
un
d R
ate
US Fed Rate vs Liquidity Index (Jan 2007 – Jul 2017)
Fed Fund Rate % US Liquity Index
80.00
100.00
120.00
140.00
160.00
180.00
200.00
220.00
240.00
90.00
95.00
100.00
105.00
110.00
115.00
120.00
125.00
130.00
Ja
n-0
7
Ju
n-0
7
No
v-0
7
Ap
r-0
8
Se
p-0
8
Fe
b-0
9
Ju
l-09
De
c-0
9
Ma
y-1
0
Oc
t-1
0
Ma
r-1
1
Au
g-1
1
Ja
n-1
2
Ju
n-1
2
No
v-1
2
Ap
r-1
3
Se
p-1
3
Fe
b-1
4
Ju
l-1
4
De
c-1
4
May-1
5
Oc
t-1
5
Ma
r-1
6
Au
g-1
6
Ja
n-1
7
Ju
n-1
7
Co
mD
ex
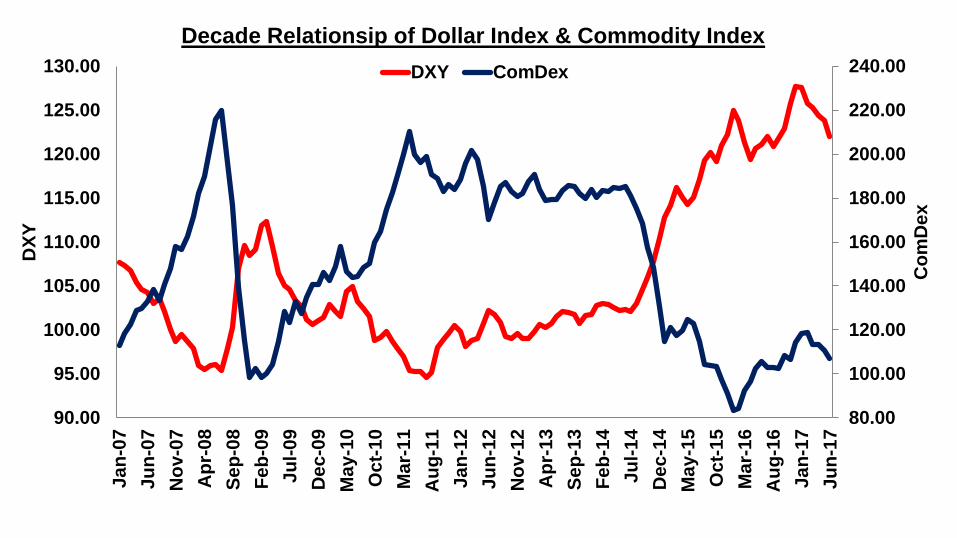
DX
YDecade Relationsip of Dollar Index & Commodity Index
DXY ComDex
40.00
60.00
80.00
100.00
120.00
140.00
160.00
20.00
40.00
60.00
80.00
100.00
120.00
140.00
160.00
180.00
200.00
Ja
n-0
7
Ju
n-0
7
No
v-0
7
Ap
r-0
8
Se
p-0
8
Feb
-09
Ju
l-0
9
De
c-0
9
May-1
0
Oc
t-1
0
Ma
r-1
1
Au
g-1
1
Ja
n-1
2
Ju
n-1
2
No
v-1
2
Ap
r-1
3
Se
p-1
3
Fe
b-1
4
Ju
l-1
4
De
c-1
4
Ma
y-1
5
Oc
t-1
5
Mar-
16
Au
g-1
6
Ja
n-1
7
Ju
n-1
7
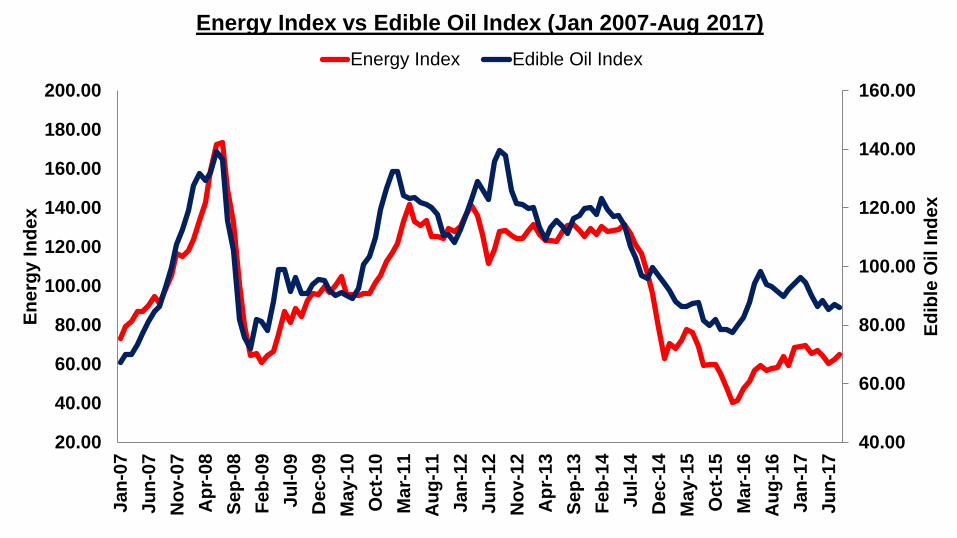
Ed
ible
Oil
In
de
x
En
erg
y I
nd
ex
Energy Index vs Edible Oil Index (Jan 2007-Aug 2017)
Energy Index Edible Oil Index

VUCAWHAT’s IN STORE FOR OIL COMPLEX???
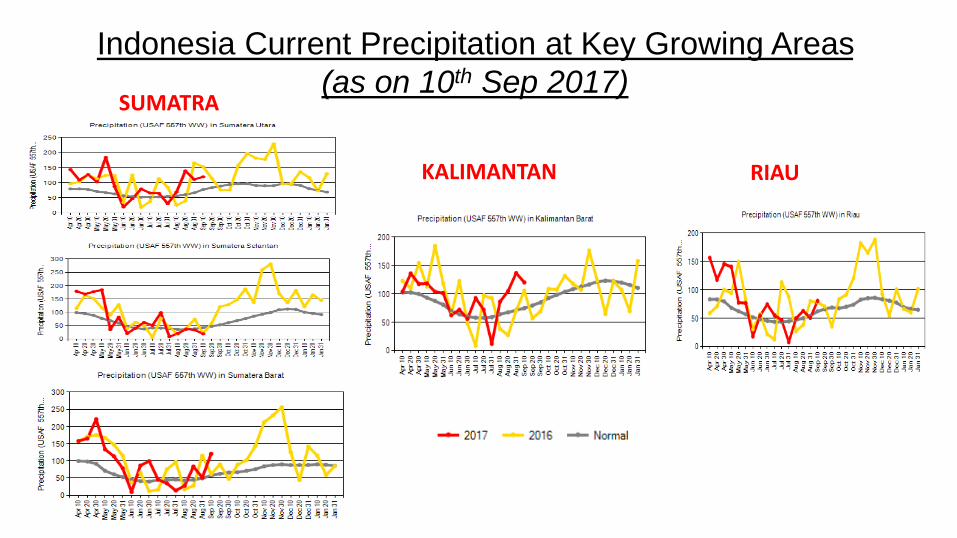
Indonesia Current Precipitation at Key Growing Areas
(as on 10th Sep 2017)SUMATRA
KALIMANTAN RIAU
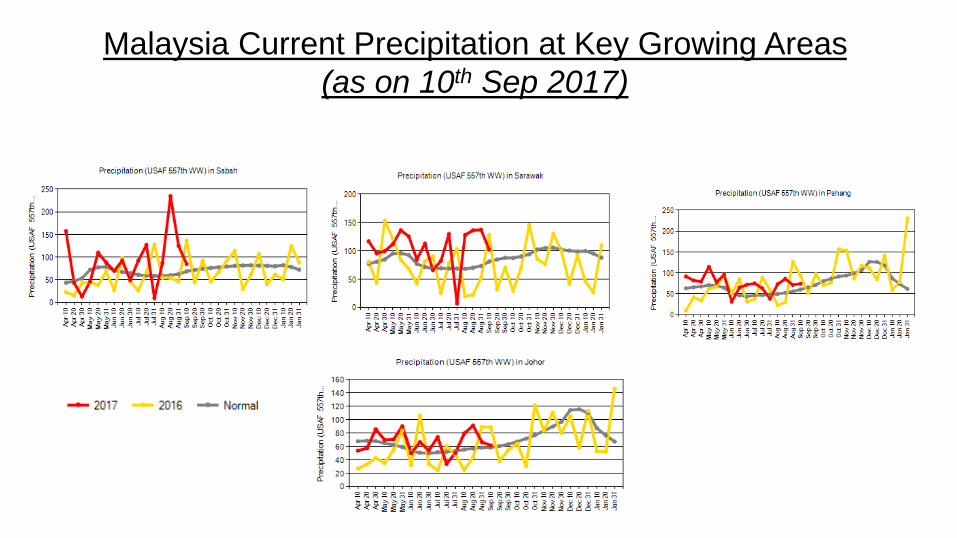
Malaysia Current Precipitation at Key Growing Areas
(as on 10th Sep 2017)
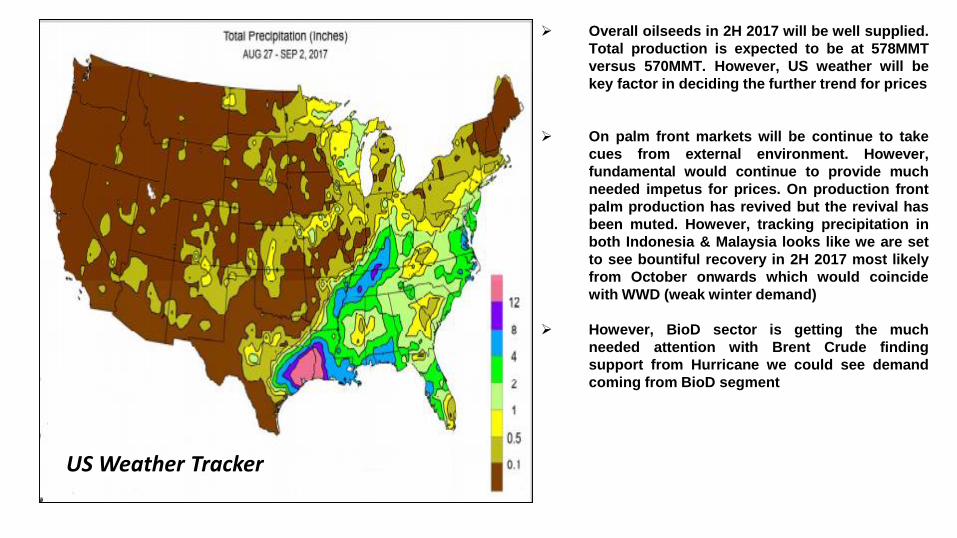
Overall oilseeds in 2H 2017 will be well supplied.
Total production is expected to be at 578MMT
versus 570MMT. However, US weather will be
key factor in deciding the further trend for prices
On palm front markets will be continue to take
cues from external environment. However,
fundamental would continue to provide much
needed impetus for prices. On production front
palm production has revived but the revival has
been muted. However, tracking precipitation in
both Indonesia & Malaysia looks like we are set
to see bountiful recovery in 2H 2017 most likely
from October onwards which would coincide
with WWD (weak winter demand)
However, BioD sector is getting the much
needed attention with Brent Crude finding
support from Hurricane we could see demand
coming from BioD segment
US Weather Tracker
• World is all set to face the 4D effect & Global Growth has become too fragile &
uncertain : 2017 was challenging year & 2018 will surpass the same in
surprises
• Currency Volatility will continue & DXY will try to get its foothold as FED will
be direction provider (rising debt will put FED on backfoot)
• Actual PAIN will be felt by Raw material exporting nations as global demand
needs strong revival
• Health of Edible Oil & Oilseeds will be more driven by US Weather, Currency
and Much Awaited Revival in Palm Oil Production
KEY TAKEAWAYS
VUCAOUTLOOK
“THE Stone Age did not end for lack of stone, and the Oil Age will end long before the world runs out of oil.”
Sheikh Zaki Yamani
EL NINO front = FUGAZI in 2017 but will 2018 have La Nina???
BRENT Crude finally got much needed steam from HURRICANE-GEOPOLITICS-OPEC CUTS. Is it for to
support listing???
Overall CRUDE with near term support could try $57-60$/bbl but will not sustain & loose it steam as
market glut will pull down prices towards $48 initially followed by $45/bbl by Q1 2018
DOLLAR under influence of FED rate decision will give much needed impetus to COMMODITIY PRICE
CHINA BLACKBOX could be busted : will be bearish commodities price trend
BioD market in dilema due to attack from US & EU on Arg & Indo BioD exports (just near term support
but it will not hold good in long run)
PALM market near term supported due to weak revival in Prodn , Slow stock build up & Festivity that
will be until Mid OCT’17 could push prices towards 3000MYR/MT after which markets should correct in
Q1 2018 towards 2700 followed by 2400 MYR/MT until fraternity gathers @ POC 2018

VUCA Thank You
Disclaimer : Views shared in the paper are author’s view and not to be considered ascompany’s view or being endorsed by company which author represents.