presentation_escap_ms. dorothea lazaro · main messages • economic growth is relatively modest...
TRANSCRIPT
Economic and Social Survey of Asia and the Pacific 2017
Governance and Fiscal Management
Launch and Panel Discussion on the UN Economic and Social Survey of Asia and the Pacific 2017: Korean Perspective
12 May 2017, Seoul

Main messages • Economic growth is relatively modest but steady, and a mild
economic expansion is expected ahead.
• Countries in the region should strengthen domestic and regional drivers of economic growth, given prolonged weakness in external demand and rising protectionist measures
• Effective fiscal management, backed by improved governance, can improve long-term economic prospects and help address social and environmental concerns.
• Given the increasing demands on fiscal policy, how governance affects the mobilization and allocation of fiscal resources warrants greater attention.
• Enhancing transparency and accountability in public fiscal administration is fundamental to improving the quality of governance and achieving better fiscal management.

#CS73
Economic Outlook and
Quality of Growth

Asia-Pacific economies lead global economic growth…at a less rapid, though steady, pace
Growth differential vis-à-vis developed economies is narrowing
Share of developing Asia-Pacific economies is increasing
0
1
2
3
4
5
6
7
8
2000s 2010-16 2017-18Baselineprojection
2017-18Alternativescenario
Ave
rage
ann
ual g
row
th (p
erce
ntag
e)
Developing Asia-Pacific regionDeveloped global economiesGrowth differential (percentage points)
0
10
20
30
40
50
60
2000
2001
2002
2003
2004
2005
2006
2007
2008
2009
2010
2011
2012
2013
2014
2015
2016
Per
cent
age
shar
e of
glo
bal o
utpu
t
Developing Asia-Pacific region Developed global economies

A firm rebound in exports seem unlikely and private investment needs to rise
Export growth has returned to positive territory but remains well below pre-crisis 2008 average
With few exceptions, private investment is not forthcoming
-50
-40
-30
-20
-10
0
10
20
30
Jan-2014 Jan-2015 Jan-2016 Jan-2017
Per
cent
age
China IndiaIndonesia ThailandRussian Federation Average 2000-2007
-5
0
5
10
15
20
25
Per
cent
age
2005-20072013-2015Regional average in 2005-2007Regional average in 2013-2015

A modest economic expansion is expected in 2017 and 2018, with downside risks
Real GDP growth
(Percentage) 2016 2017 2018
Developing Asia-Pacific region 4.9 5.0 5.1
East and North-East Asia 3.8 3.7 3.6
China 6.7 6.5 6.4
South-East Asia 4.5 4.7 4.8
Indonesia 5.0 5.2 5.3
Thailand 3.2 3.3 3.4
South and South-West Asia 5.4 5.6 5.9
India 7.1 7.1 7.5
North and Central Asia 0.1 1.4 1.7
Russian Federation -0.2 1.1 1.4 Pacific island developing economies 2.6 3.1 2.6
Least developed countries 6.0 6.5 6.5
Landlocked developing countries 1.6 3.1 3.6
Small island developing States 2.9 3.4 3.0 -10
-8
-6
-4
-2
0GDP Consumption Investment GDP Consumption Investment
Scenario 1 Scenario 3
Cha
nges
rela
tive
to b
asel
ine
grow
th
(per
cent
age
poin
ts)
Alternative growth scenario for developing Asia-Pacific economies in 2017

East and North-East Asia: Steady but still below-trend economic growth prospects
0
2
4
6
8
10
12
14
2006
2007
2008
2009
2010
2011
2012
2013
2014
2015
2016
2017
2018
Real GDP growth (%)
East and North-East AsiaEast and North-East Asia (excluding Japan)Developing Asia-Pacific region
-2
0
2
4
6
8
10
2006
2007
2008
2009
2010
2011
2012
2013
2014
2015
2016
2017
2018
Consumer inflation (%)
East and North-East AsiaEast and North-East Asia (excluding Japan)Developing Asia-Pacific region

While monetary policy shifts to ‘neutral’, fiscal policy can be used more effectively
Crude oil price and average inflation in selected net commodity importers
Fiscal space depends on interest payment, nominal growth, and tax revenues – example of
India
60
65
70
75
80
85
90
-14
-12
-10
-8
-6
-4
-2
0
2
4
6
1997 1999 2001 2003 2005 2007 2009 2011 2013 2015
Debt
(per
cent
age
of G
DP)
Perc
enta
ge o
f GDP
/ Pe
rcen
tage
poi
nts
Interest rate-nominal growth differential (left)
Primary fiscal balance (left)
General government debt (right)
1
2
3
4
5
20
30
40
50
60
70
80
90
100
110
120
Jan-2014 Jan-2015 Jan-2016 Jan-2017
Per
cent
age
Uni
ted
Sta
tes
dolla
rs p
er b
arre
l
Inflation (right-hand side)Crude oil priceProjected average oil priceProjected average inflation (right-hand side)

Widespread poverty and inequality call for enhanced social protection
Social protection financing has increased, but mostly on insurance rather than assistance side
Social protection coverage has expanded, but with substantial variation across countries
0
1
2
3
4
5
6
7
8
9
10
2000 Latest Latest
Total public social protection expenditures For working age,excluding health
Per
cent
age
of G
DP
Asia-Pacific region World
0
5
10
15
20
25
30
35
2000 Latest Legal Effective
Affilitation to contributorypension schemes
Unemployment benefit
Per
cent
age
of w
orki
ng a
ge/ l
abou
r for
ce
Asia-Pacific region World
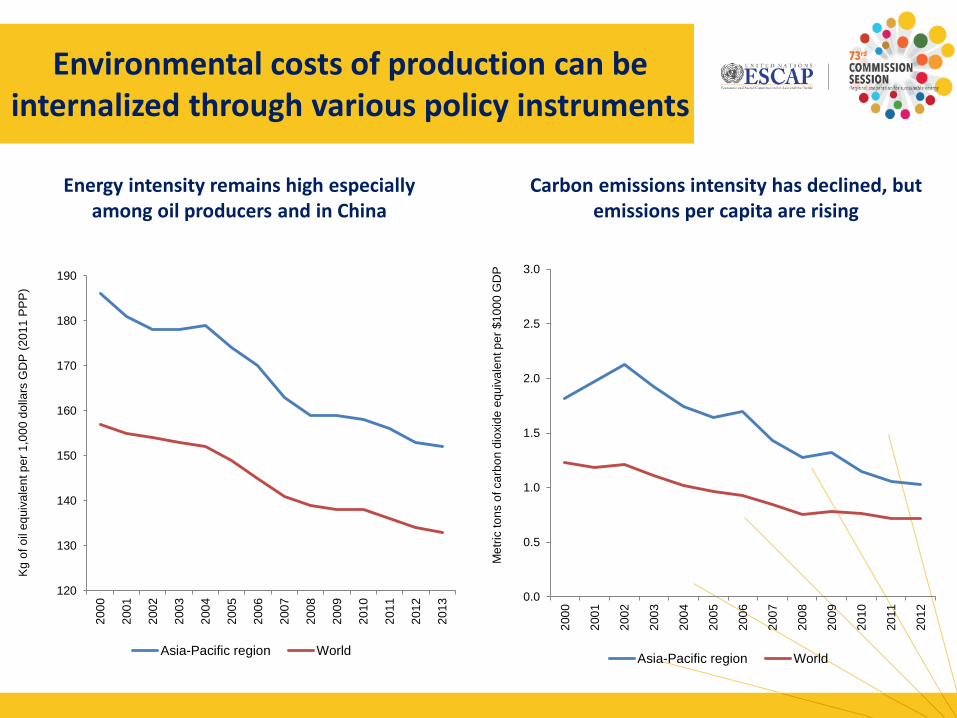
Environmental costs of production can be internalized through various policy instruments
Energy intensity remains high especially among oil producers and in China
Carbon emissions intensity has declined, but emissions per capita are rising
120
130
140
150
160
170
180
190
2000
2001
2002
2003
2004
2005
2006
2007
2008
2009
2010
2011
2012
2013
Kg
of o
il eq
uiva
lent
per
1,0
00 d
olla
rs G
DP
(201
1 P
PP
)
Asia-Pacific region World
0.0
0.5
1.0
1.5
2.0
2.5
3.0
2000
2001
2002
2003
2004
2005
2006
2007
2008
2009
2010
2011
2012
Met
ric to
ns o
f car
bon
diox
ide
equi
vale
nt p
er $
1000
GD
P
Asia-Pacific region World

#CS73
Governance and Fiscal
Management

Governance and development is a two-way relationship
-0.75 -0.5 -0.25 0 0.25 0.5 0.75 1
Percentage of 15-64 age group which didnot attent school
Natural resources rent (Percentage ofGDP)
Average years of total schooling of 15-64age group
Level of economic development
Rule of law Control of corruption Governance
0 10 20 30 40 50 60 70 80
Least developed countries
Asian landlocked developing countries
Asia-Pacific least developed countries
Landlocked developing countries
Africa
Oil exporting countries
Asia-Pacific developing countries
Asia-Pacific small island developing States
Latin America and Caribbean
Developed countries
Governance index
2005-2014 1995-2004
Governance in different regions of the world: perception based index
Correlation between governance and potential socioeconomic factors in Asia and the Pacific

Governance affects both the allocation and efficiency of public expenditures
0.00
0.02
0.04
0.06
0.08
0.10
0.12
20 30 40 50 60 70 80 90 100
Defen
se ex
pend
iture
s (p
erce
ntage
of to
tal e
xpen
ditur
e)
Control of corruption
Estimated impact of governance on public sector efficiency in the health sector
-60 -40 -20 0 20 40 60 80
Kyrgyzstan
Thailand
Maldives
Iran (Islamic Republic of)
Mongolia
Malaysia
Sri Lanka
China
Brunei Darussalam
Turkey
Indonesia
Vanuatu
Armenia
Kazakhstan
Georgia
Estimated efficiency change
Level of governance and structure of public expenditures

Better governance is associated with higher levels of tax revenues
0
5
10
15
20
25
30
35
40
15 35 55 75 95
Tax
reve
nue
(per
cent
age
of G
DP)
Governance
-30 -20 -10 0 10 20
Bhutan
India
Thailand
Nepal
Pakistan
Malaysia
Cambodia
Philippines
Armenia
Singapore
Afghanistan
Georgia
Bangladesh
Governance
Estimated impact of governance on tax revenue collection (2005-2014)
Tax revenues and governance in Asia and the Pacific, 2010-2014

Enhanced transparency and accountability are key to better governance and fiscal management

Few examples of policies to improve transparency and accountability
75
80
85
90
95
100
0 20 40 60 80Publ
ic se
ctor
effi
cien
cy in
hea
lth
Financial disclosure (percentage of assessed measures)
Financial disclosure and public expenditure efficiency in selected Asia-Pacific countries
Public access to keyfiscal information
Competition, valuefor money and
controls inprocurement
Effectiveness ofinternal controls for
non-salaryexpenditure
Effectiveness ofinternal audit
Availability ofinformation on
resources received
Quality andtimeliness of in-year
budget reports
Scope, nature andfollow-up of external
audit
Bangladesh India Nepal Pakistan
0
5
10
15
20
25
30
0 0.2 0.4 0.6 0.8 1
Tax
reve
nue
(per
cent
age
of G
DP)
e-Government Development Index
E-government and tax revenues, 2005-2014
Assessment of specific areas of the public expenditure framework in selected Asia-Pacific countries

• East and North-East Asia is at the forefront of energy-efficient and renewable technologies
• Some early gains in terms of improved energy efficiency
• Policy lessons: 3 desirable aspects of policies to promote innovation for clean energy
• Well-designed governance structure: Whole-of-government approach and multi-stakeholder partnerships
• Balanced policy mix between fiscal incentives and regulations
• Enabling, nonconventional financial system
Sub-regional case study on the role of governance: Clean energy innovation policies

Takeaway Points • Supported by steady economic growth, Asia-Pacific region is poised
to regain its historical position in the global economy and provide leadership to move towards inclusive and sustainable development
• Well-being of people depend on much more than just economic growth; there is a need in the region to pay more attention to social inclusiveness and environment sustainability
• There is room for fiscal policy to take a more prominent role in contributing to long-term economic potential, enhancing social protection and addressing environment degradation.
• Proactive fiscal policy highlights the vital role of governance: i) to mobilize resources effectively; and ii) use them efficiently.
• Enhanced transparency and accountability is key to improving quality of governance.

Thank you!
Please download the Survey at http://bit.ly/APSurvey2017
For further information about the publication, please contact:
United Nations ESCAP East and North-East Asia Office http://enea.unescap.org
UNESCAP.ENEA UN_EastAsia