presentation: using best management practices to maintain...
TRANSCRIPT

Using Best Management Practices to Maintain Turf in a Florida Friendly Landscape
Laurie E. TrenholmUrban Turfgrass BMP Specialist
UF‐IFAS

Is Turfgrass Florida Friendly?
2

What Role Does Turfgrass Play in Our Landscapes?
Functional:• Filters stormwater runoff• Traps and filters potential
pollutants• Holds soil in place• Reduces heat, noise, glare• Reduces dirt brought into home• Takes up air pollutants• Serves as fire break• Safe play area (pets and humans)
Aesthetic:• Safe play area• Extends outdoor living space• Increased property values• Compliments and ties together
the rest of the landscape
3

4

5
So, Why Do We Hate Turfgrass?
6
“IT” uses too much water
“IT” needs fertilizer
“IT” never looks good no matter how hard I work on it (or don’t work on it)
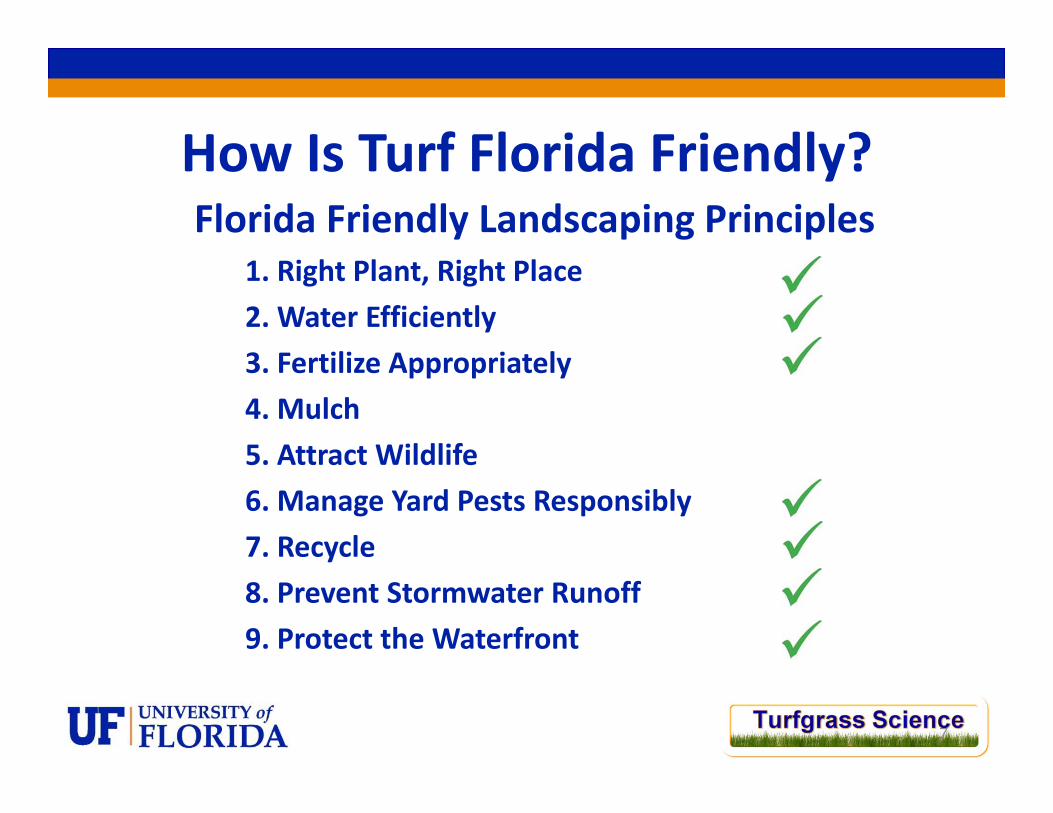
How Is Turf Florida Friendly?Florida Friendly Landscaping Principles
1. Right Plant, Right Place 2. Water Efficiently 3. Fertilize Appropriately 4. Mulch 5. Attract Wildlife 6. Manage Yard Pests Responsibly 7. Recycle 8. Prevent Stormwater Runoff9. Protect the Waterfront
7
What is Florida Friendly Turf Management?
• Best Management Practices Include:– Fertilizing correctly (rates, timing)– Irrigating correctly (amount, frequency)– Mowing– Integrated Pest Management
8
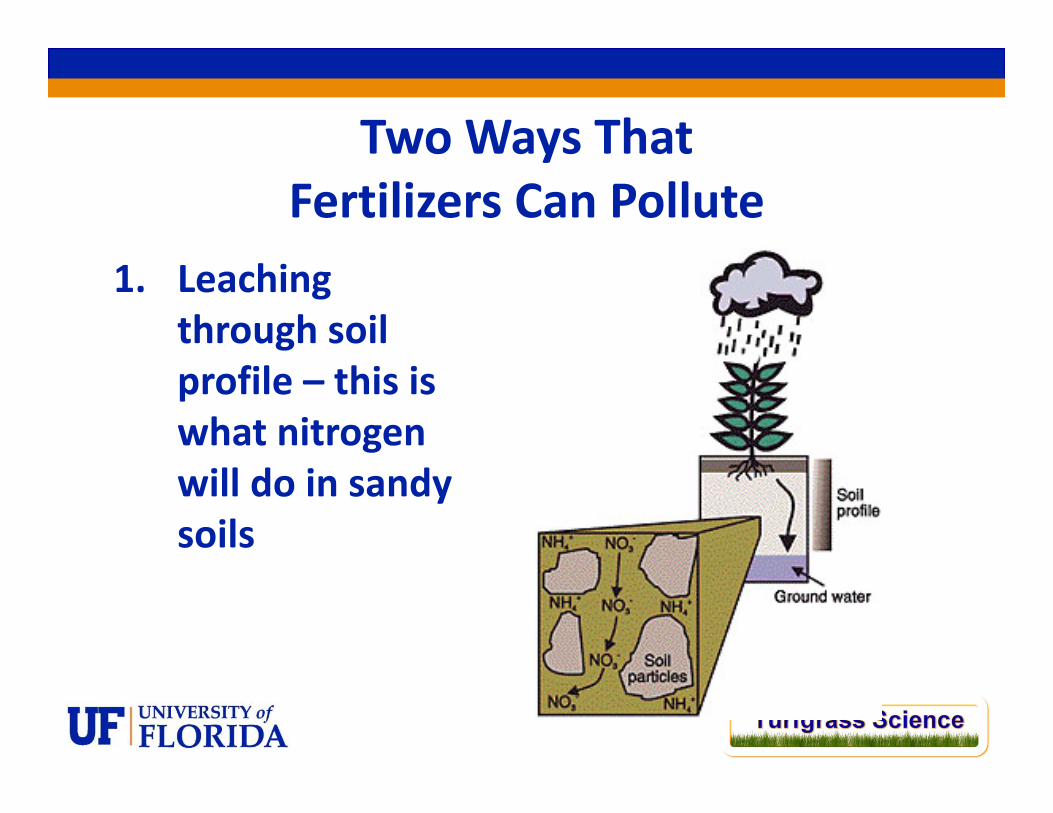
Two Ways That Fertilizers Can Pollute
1. Leaching through soil profile – this is what nitrogen will do in sandy soils
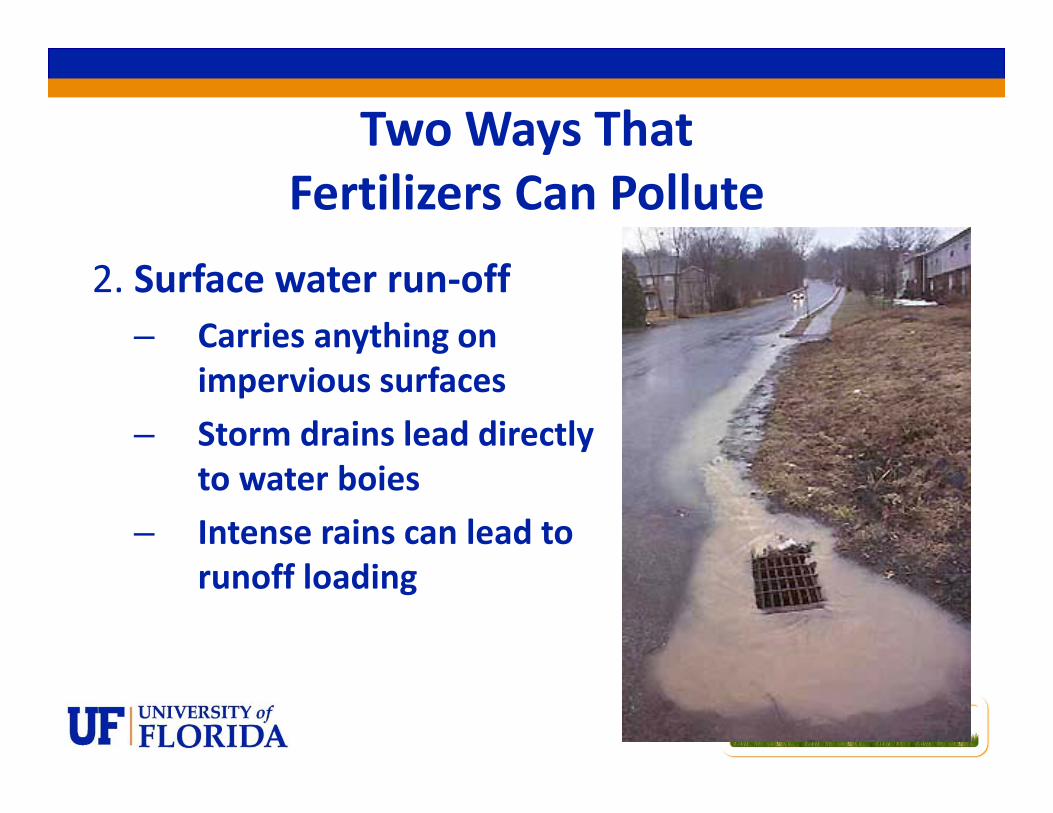
Two Ways That Fertilizers Can Pollute
2. Surface water run‐off– Carries anything on
impervious surfaces– Storm drains lead directly
to water boies– Intense rains can lead to
runoff loading

Fertilization Best Management Practices
• Soil test! What is your pH and how much of the needed nutrients do you have in your soil?
• Apply fertilizer at the correct rate for your lawn species• Apply fertilizer at the correct time – when the grass is
growing• Know how much fertilizer you are applying• Clean up spilled fertilizer• Do not fertilize before a heavy rain• Leave a 10’ unfertilized buffer strip by water bodies• Irrigate fertilizer in with approx. ¼” of water
11

Put Your Soil to the Test• Soil testing should provide
the basis for determining a fertility program
• This includes pH testing as well as extractable levels of macro and micronutrients
• Do not soil test for N, as it is very mobile
12
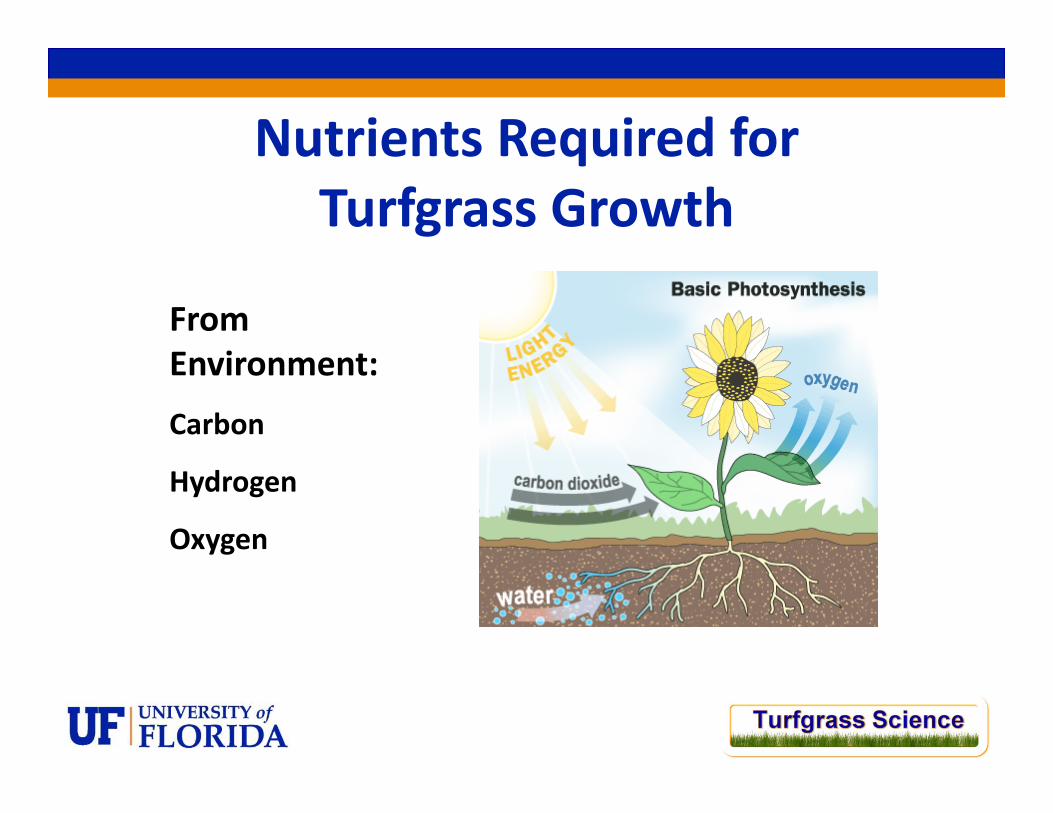
Nutrients Required for Turfgrass Growth
From Environment:
Carbon
Hydrogen
Oxygen

Nutrients Needed From Soil or Fertilizer
Micronutrients:IronManganeseBoronCopperMolybdenumZincNickel
14
Macronutrients:Primary:
NitrogenPhosphorusPotassium
Secondary:Calcium MagnesiumSulfur

Fertilizer BMPs for Turfgrass• Do not apply nitrogen fertilizer at excessive rates – stick to the UF‐IFAS recommendations
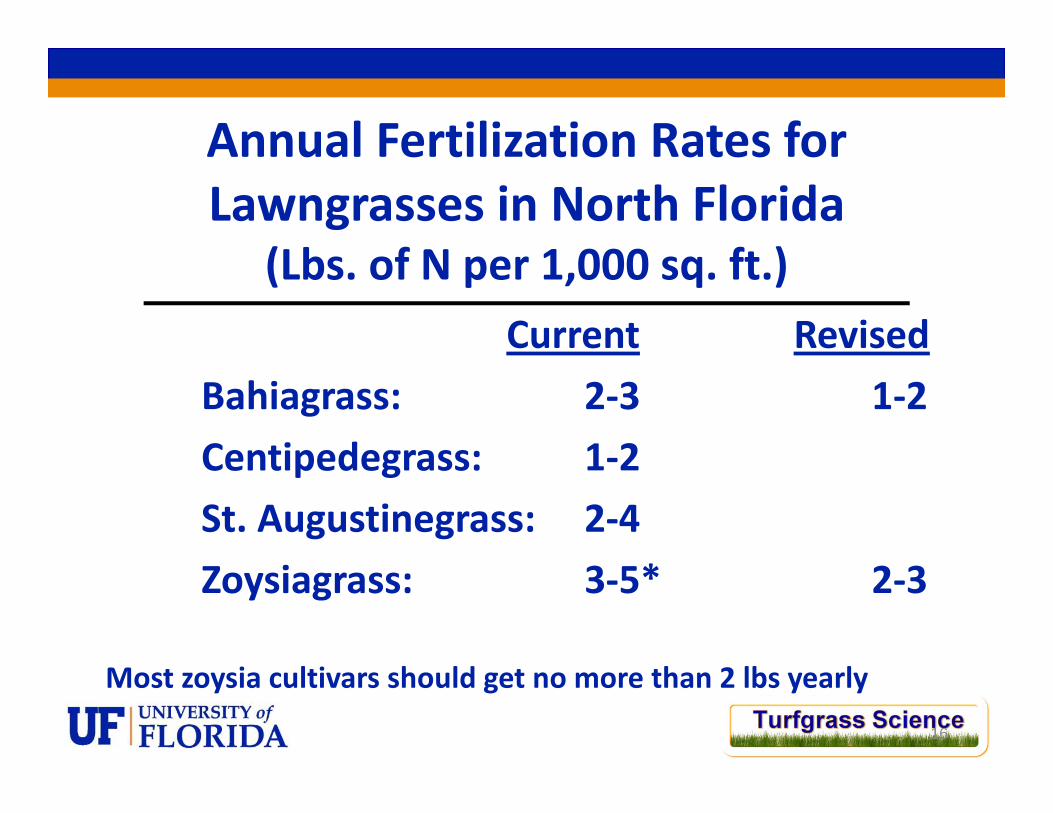
Annual Fertilization Rates for Lawngrasses in North Florida
(Lbs. of N per 1,000 sq. ft.)Current Revised
Bahiagrass: 2‐3 1‐2Centipedegrass: 1‐2St. Augustinegrass: 2‐4Zoysiagrass: 3‐5* 2‐3
Most zoysia cultivars should get no more than 2 lbs yearly
16

Annual Fertilization Rates for Lawngrasses in Central Florida
(Lbs. of N per 1,000 sq. ft.)Current Revised
Bahiagrass: 2‐4 1‐2Centipedegrass: 2‐3 1‐2St. Augustinegrass: 2‐5Zoysiagrass: 3‐6* 3
Most zoysia cultivars should get no more than 2 lbs yearly
17
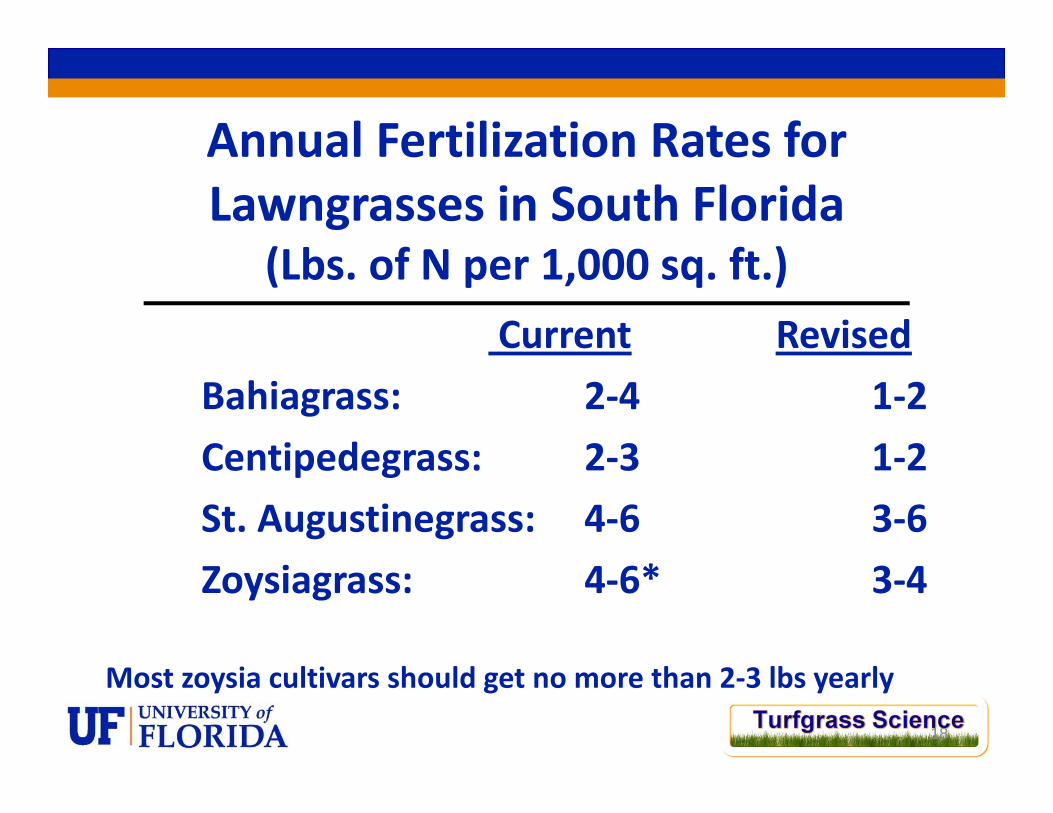
Annual Fertilization Rates for Lawngrasses in South Florida
(Lbs. of N per 1,000 sq. ft.)Current Revised
Bahiagrass: 2‐4 1‐2Centipedegrass: 2‐3 1‐2St. Augustinegrass: 4‐6 3‐6Zoysiagrass: 4‐6* 3‐4
Most zoysia cultivars should get no more than 2‐3 lbs yearly
18
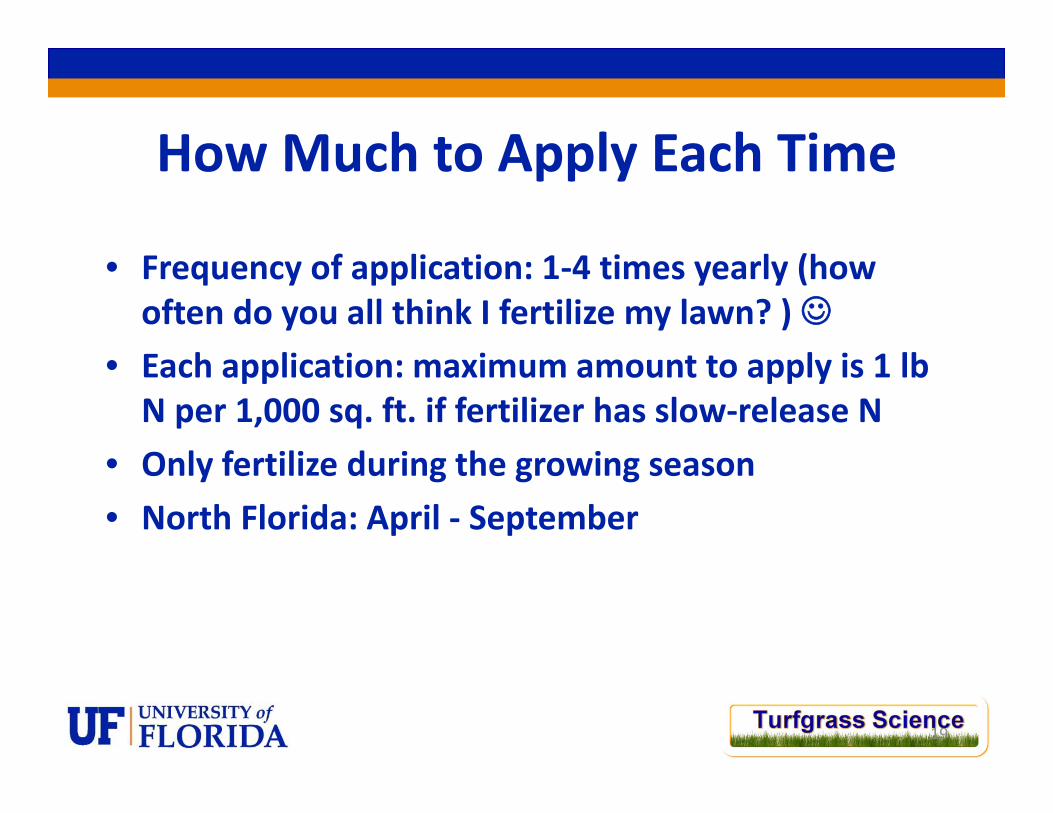
How Much to Apply Each Time
• Frequency of application: 1‐4 times yearly (how often do you all think I fertilize my lawn? )☺
• Each application: maximum amount to apply is 1 lb N per 1,000 sq. ft. if fertilizer has slow‐release N
• Only fertilize during the growing season• North Florida: April ‐ September
19

Fertilizer Calculations• Divide your yard up (front, back, sides)• Determine square footage of each area
20
40’
25’
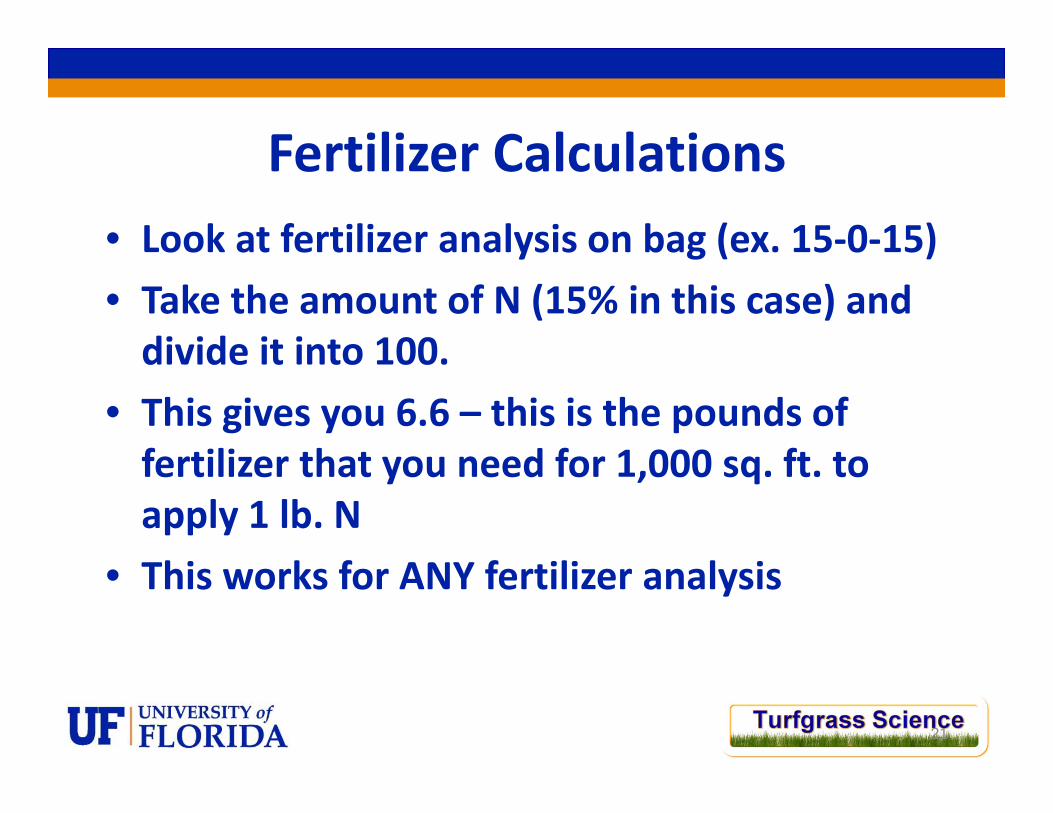
Fertilizer Calculations• Look at fertilizer analysis on bag (ex. 15‐0‐15)• Take the amount of N (15% in this case) and divide it into 100.
• This gives you 6.6 – this is the pounds of fertilizer that you need for 1,000 sq. ft. to apply 1 lb. N
• This works for ANY fertilizer analysis
21

Fertilizer Calculations• To apply the correct amount:
– Take half of the total amount of fertilizer:• 15% = 6.6 lbs fertilizer per 1,000 square feet• Half of this = 3.3 lbs fertilizer in spreader
22

Fertilizer Calculations
• To apply the correct amount:Take the remaining 3.3 lbs, put in spreader and go back and forth at 90o angles
23
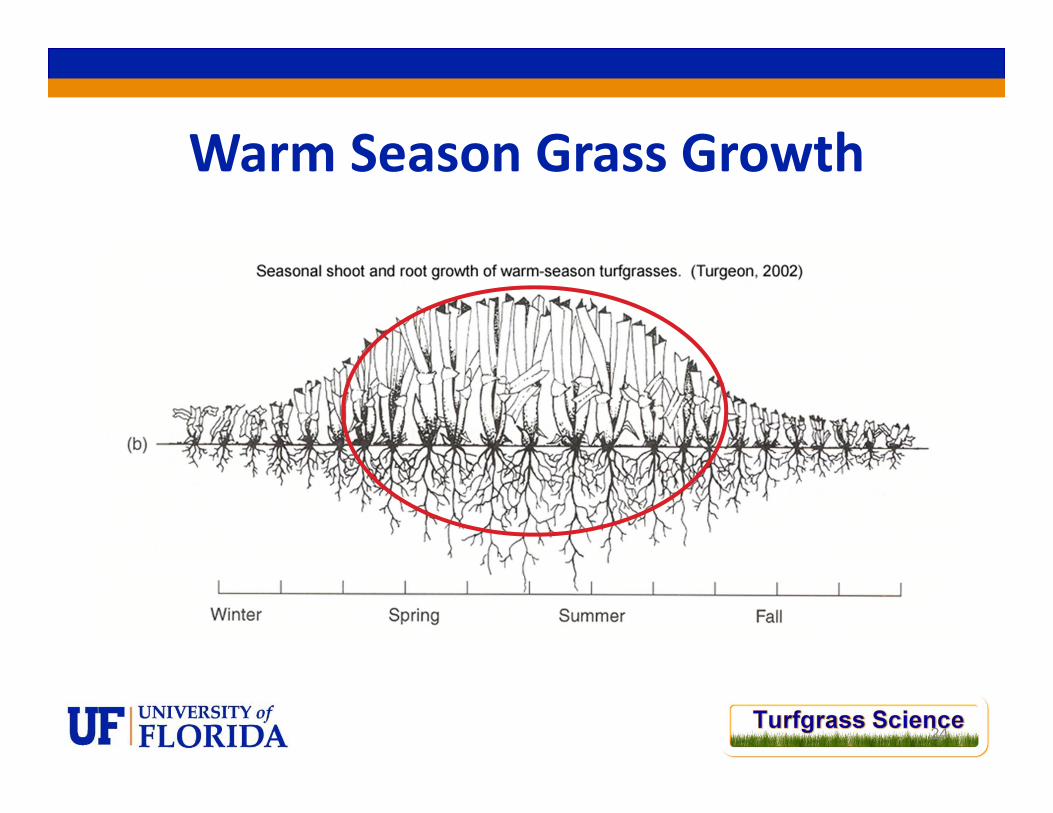
Warm Season Grass Growth
24
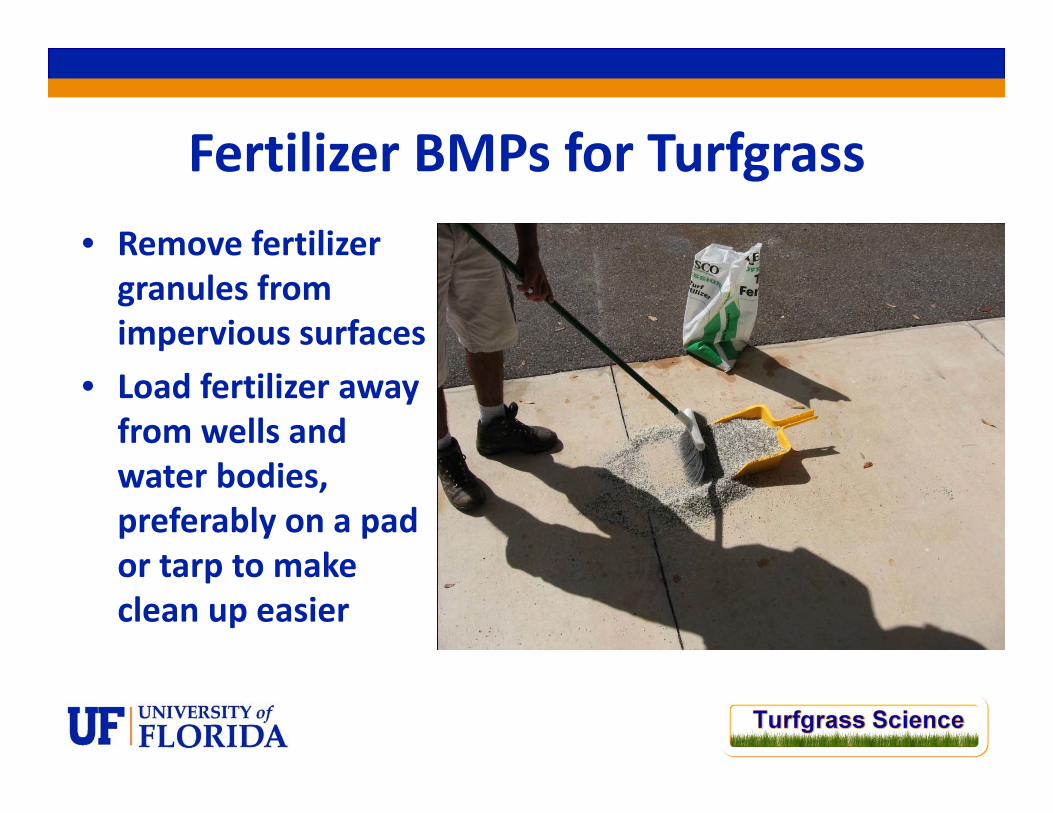
Fertilizer BMPs for Turfgrass• Remove fertilizer granules from impervious surfaces
• Load fertilizer away from wells and water bodies, preferably on a pad or tarp to make clean up easier

Fertilizer BMPs for Turfgrass• Fertilizer granules need to be applied to turf – these granules will still run off with water or rain
• Does not matter if water soluble or slow release N source
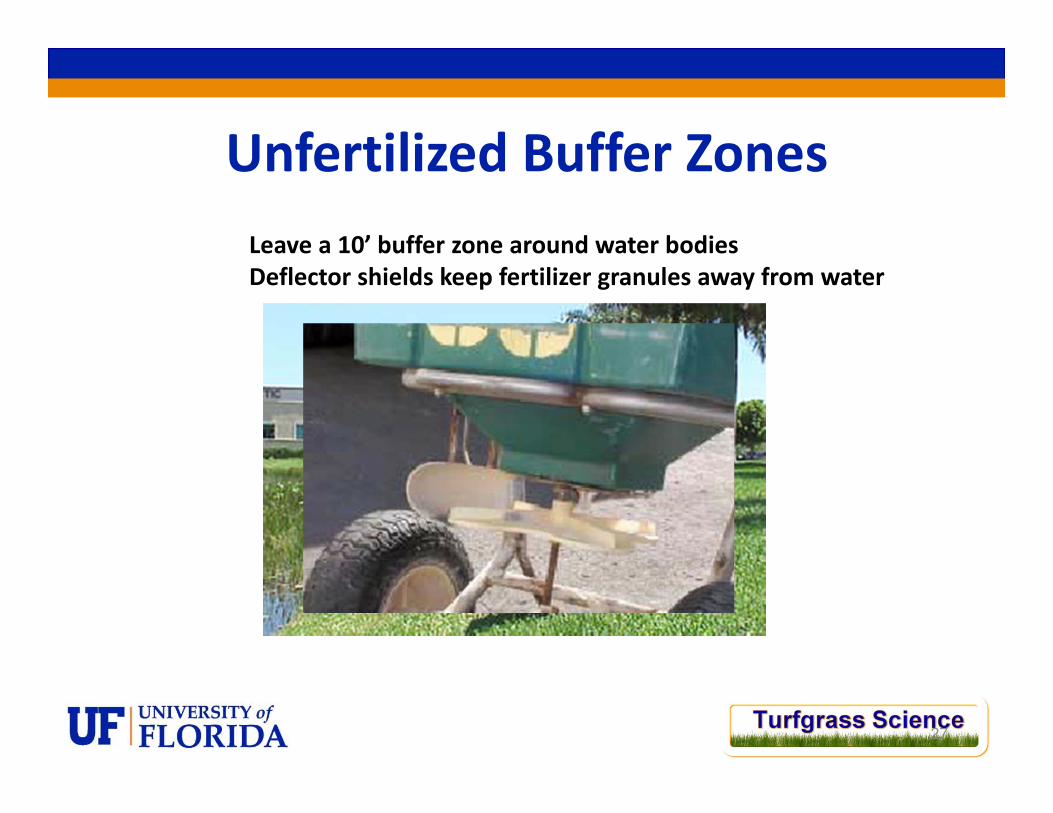
Unfertilized Buffer Zones
27
Leave a 10’ buffer zone around water bodiesDeflector shields keep fertilizer granules away from water

Irrigating Fertilizer In
28
Use about ¼” water to wash fertilizer into soil, not further down past roots
Don’t use rainfall to wash fertilizer in!

Turf Irrigation BMPs
29

Turf Irrigation BMPs• Frequency of irrigation
– Grass species– Season– Soil– Shade
• Amount to water• Calibrating• Inspecting
30

Turfgrass Water Requirements
• St. Augustinegrass (N FL): ~ 30” year (Dukes et al., 2009)
• Bahiagrass (N FL): ~33” year (Jia et al., 2007)• Warm‐season turf: 20‐25” year (Smajstrla, 1990)
• Average historical rainfall ~ 45‐50” year• So why do we need to irrigate at all?
31

Turfgrass Water Requirements
• Bahiagrass water use 11% greater than St. Augustinegrass under well watered conditions (Zazueta et al., 1999)
• Under water deficits, no differences in water use between St. Augustinegrass, bahiagrass, bermudagrass (Dukes et al., 2010)
• TAMU study showed that best recovery following drought was in Floratam St. Augustinegrass
32

33
Turfgrass Irrigation BMPs• Irrigation Frequency:
– Winter: every 14-21 days– Spring: 3-5 days– Summer: 2-3 days– Fall: 3-5 days
• Varies between (and within) yards• Monitoring for wilt is and watering when 30-
50% of the yard shows wilt is a great way to water
• WMD restrictions do not always allow for this
Turfgrass Irrigation BMPs• Water about ½ ‐ ¾” each time (may vary depending on soil)
• The amount applied does not change, just the frequency of application
• Don’t be afraid to change irrigation controller OR turn it to OFF and only turn it on when grass is wilting
• Remember that rain shutoff sensor is state law for all irrigation systems installed after 1990
34

Calibrating the Irrigation System
35

Calibrating the Irrigation System• Place evenly sized cans around irrigation zone• Run system for 15 minutes• Measure amount in each can – amounts should be similar or distribution not uniform
• Find average amount per can– If ¼”, system needs to run for 30‐45 minutes to apply correct amount of water
• Do not water past runoff
36

Inspect the Irrigation System• Watch for broken or
misaligned heads, leaks, etc.
• Watch for alignment/overspray –don’t water the driveway
• Watch for shrubs that have matured and may now be blocking sprinkler
37

UF West Florida Research and Education Center, Jay
UF Plant Science Research and Education Unit, Citra
Ft. Lauderdale Research and Education Center
DEP Nutrient Leaching Study
2004-2011

DEP Research – Nutrient Leaching
• $5 million grant to study nutrient leaching in lawn grasses
• Statewide project• Apply nitrogen and phosphorus to lawngrasses under a wide variety of circumstances
• Completely funded by FDEP
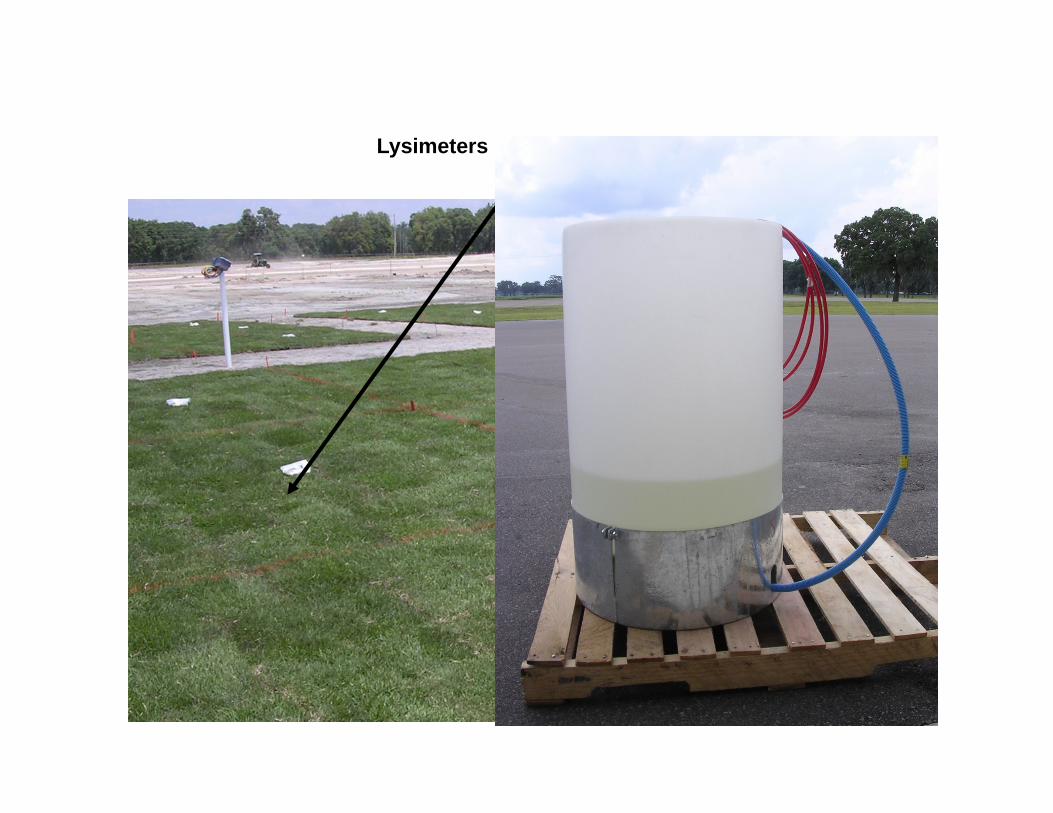
Lysimeters buried in center of each plot
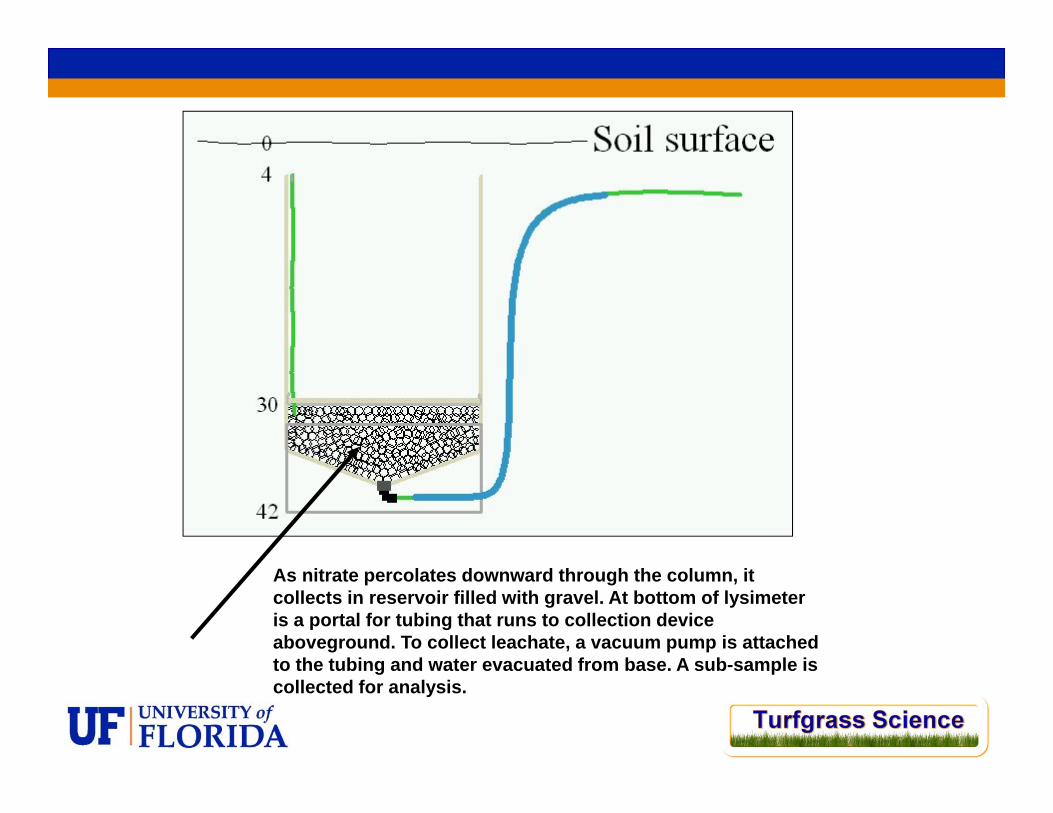
As nitrate percolates downward through the column, it collects in reservoir filled with gravel. At bottom of lysimeter is a portal for tubing that runs to collection device aboveground. To collect leachate, a vacuum pump is attached to the tubing and water evacuated from base. A sub-sample is collected for analysis.
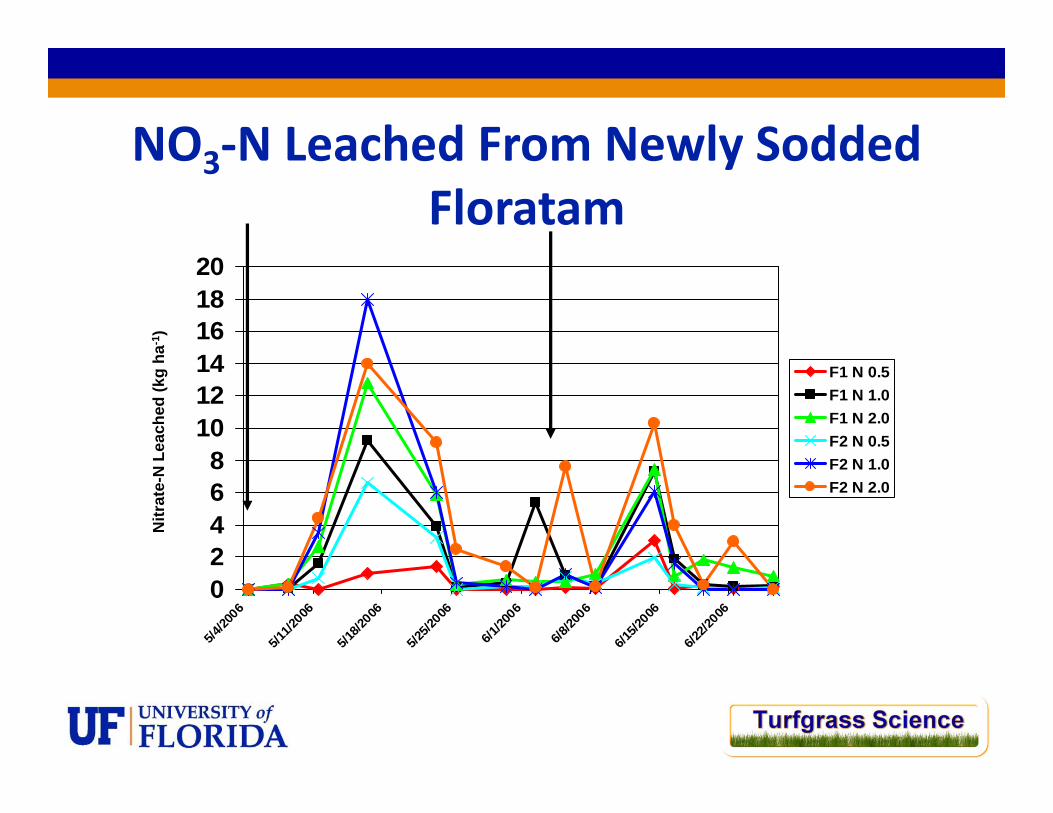
NO3‐N Leached From Newly Sodded Floratam
02468
101214161820
5/4/20
06
5/11/2
006
5/18/2
006
5/25/2
006
6/1/20
06
6/8/20
06
6/15/2
006
6/22/2
006
F1 N 0.5F1 N 1.0F1 N 2.0F2 N 0.5F2 N 1.0F2 N 2.0
Nitr
ate-
N L
each
ed (k
g ha
-1)
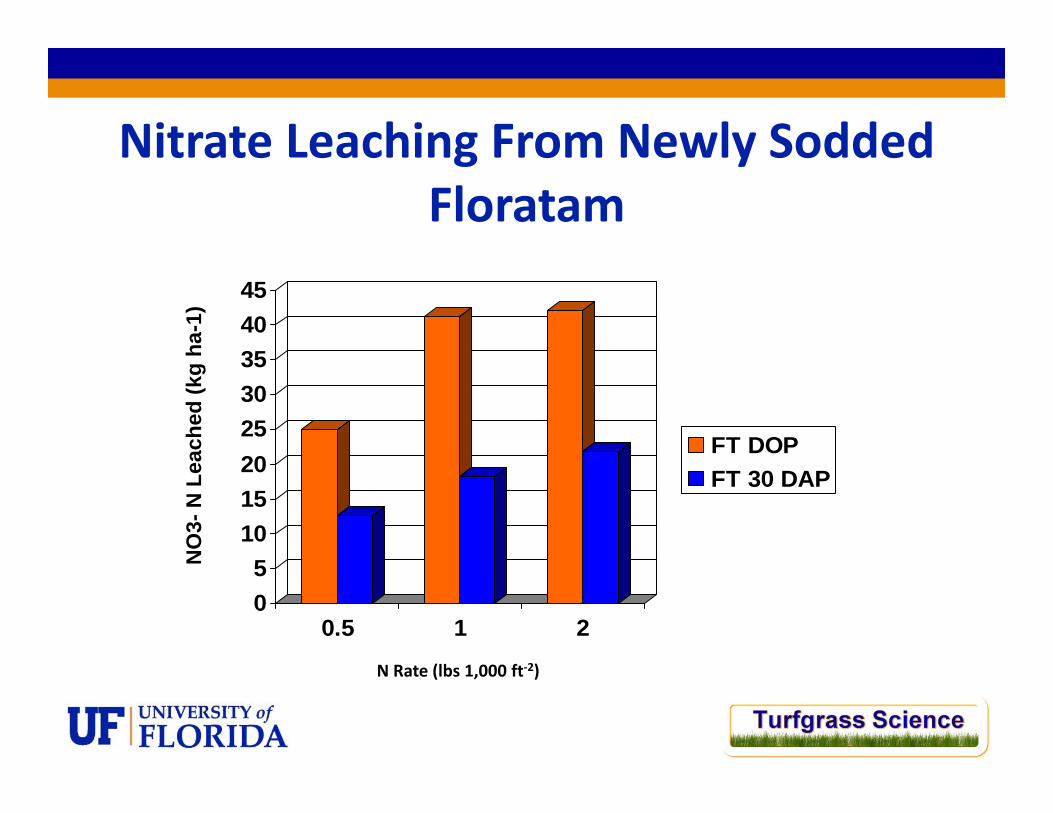
Nitrate Leaching From Newly Sodded Floratam
05
1015202530354045
0.5 1 2
FT DOPFT 30 DAP
NO
3-N
Lea
ched
(kg
ha-1
)
N Rate (lbs 1,000 ft‐2)

Percent of Applied N Leached From Newly Sodded Floratam
0
10
20
30
40
50
60
0.5 1 2
DOP30 DAP
NO
3-N
Lea
ched
(kg
ha-1
)
N Rate (lbs 1,000 ft‐2)

NO3‐N Leached From Empire
0
2
4
6
8
10
12
14
Nitr
ate-
N L
each
ed (k
g ha
-1)
2005
0
2
4
6
8
10
12
14
2008

Conclusions• Important to note that these rates of leaching are MUCH higher than from established turf
• Do not fertilize newly planted sod for 30‐60 days after planting
• Without an established root system, more N likely to leach
• Turf quality and establishment time not compromised by lack of fertilization
• Results indicate that N rate is more important than timing in reducing leaching, unless N application rates are very high

Nitrate Leaching Due to N Rate• 3‐yr study 2005‐2007• Established Floratam and Empire• N applied in 4 applications throughout the year at rates of 1, 4, 7, or 10 lbs N 1,000 ft‐2
• N applied as quick‐release urea dissolved in water and applied through sprayer
• 2 irrigation regimes (1” @ 1x wkly, 0.5” @ 2x wkly)
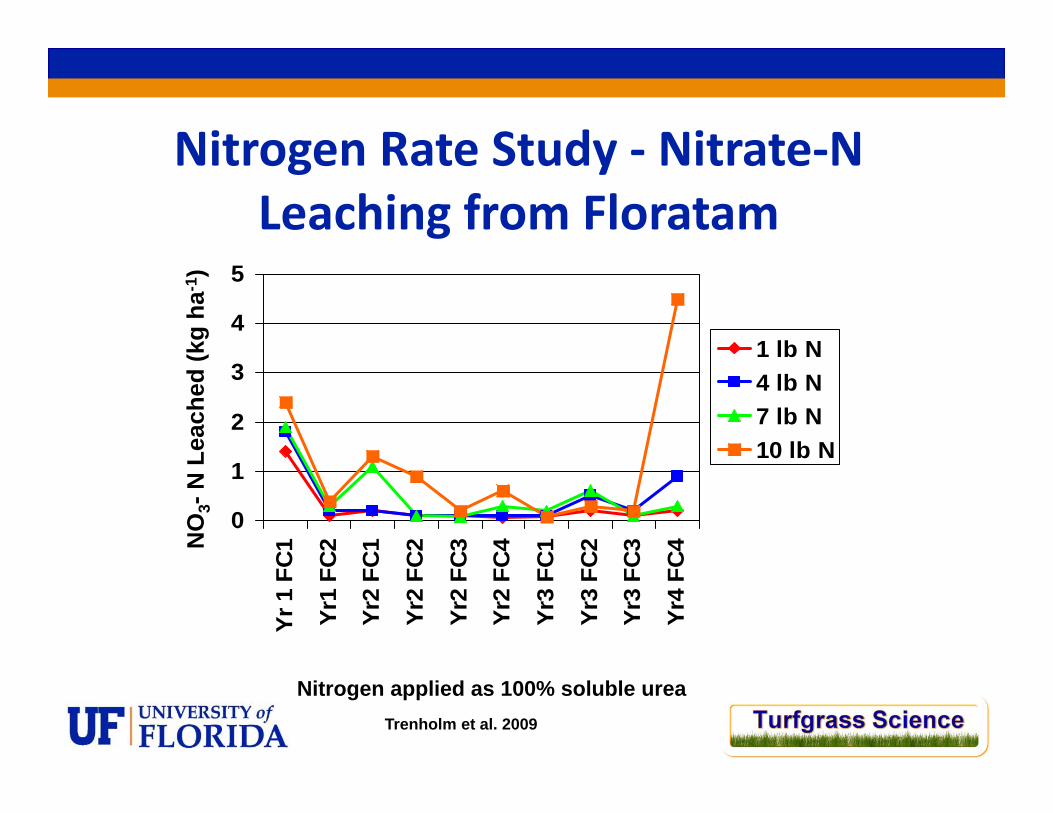
Nitrogen Rate Study ‐ Nitrate‐N Leaching from Floratam
0
1
2
3
4
5Yr
1 F
C1
Yr1
FC2
Yr2
FC1
Yr2
FC2
Yr2
FC3
Yr2
FC4
Yr3
FC1
Yr3
FC2
Yr3
FC3
Yr4
FC4
1 lb N4 lb N7 lb N10 lb N
Nitrogen applied as 100% soluble urea
NO
3-N
Lea
ched
(kg
ha-1
)
Trenholm et al. 2009

Nitrogen Rate Study ‐Percent of Applied N Leached from Floratam
0123456789
10
Yr 1 FC1
Yr1 FC2
Yr2 FC1
Yr2 FC2
Yr2 FC3
Yr2 FC4
Yr3 FC1
Yr3 FC2
Yr3 FC3
Yr3 FC4
SA 1 lb NSA 4 lb NSA 7 lb NSA 10 lb N
Nitrogen applied as 100% soluble urea
Perc
ent o
f App
lied
N L
each
ed
Trenholm et al. 2009
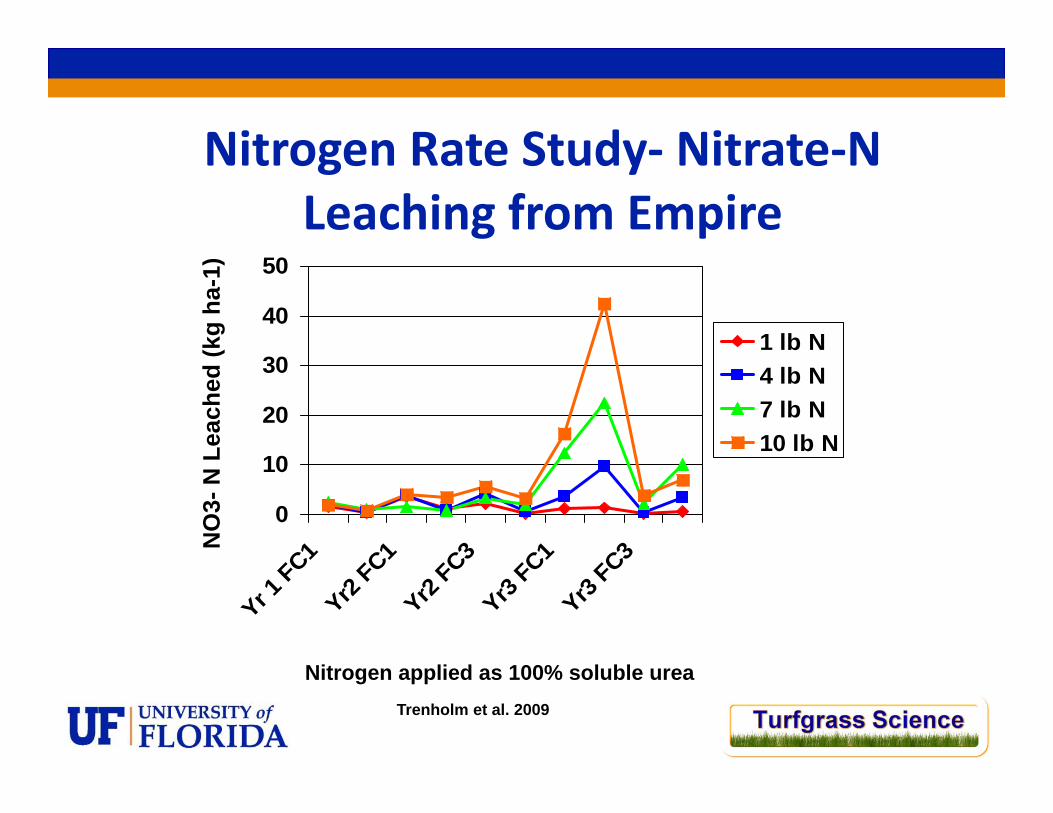
Nitrogen Rate Study‐ Nitrate‐N Leaching from Empire
0
10
20
30
40
50
Yr 1 FC1
Yr2 FC1
Yr2 FC3
Yr3 FC1
Yr3 FC3
1 lb N4 lb N7 lb N10 lb N
Nitrogen applied as 100% soluble urea
NO
3-N
Lea
ched
(kg
ha-1
)
Trenholm et al. 2009

Nitrogen Rate Study ‐ Percent of Applied N Leached from Empire
05
10152025303540
Yr 1 FC1
Yr1 FC2
Yr2 FC1
Yr2 FC2
Yr2 FC3
Yr2 FC4
Yr3 FC1
Yr3 FC2
Yr3 FC3
Yr3 FC4
Zoy 1 lb NZoy 4 lb NZoy 7 lb NZoy 10 lb N
Nitrogen applied as 100% soluble urea
NO
3-N
Lea
ched
(kg
ha-1
)
Trenholm et al. 2009
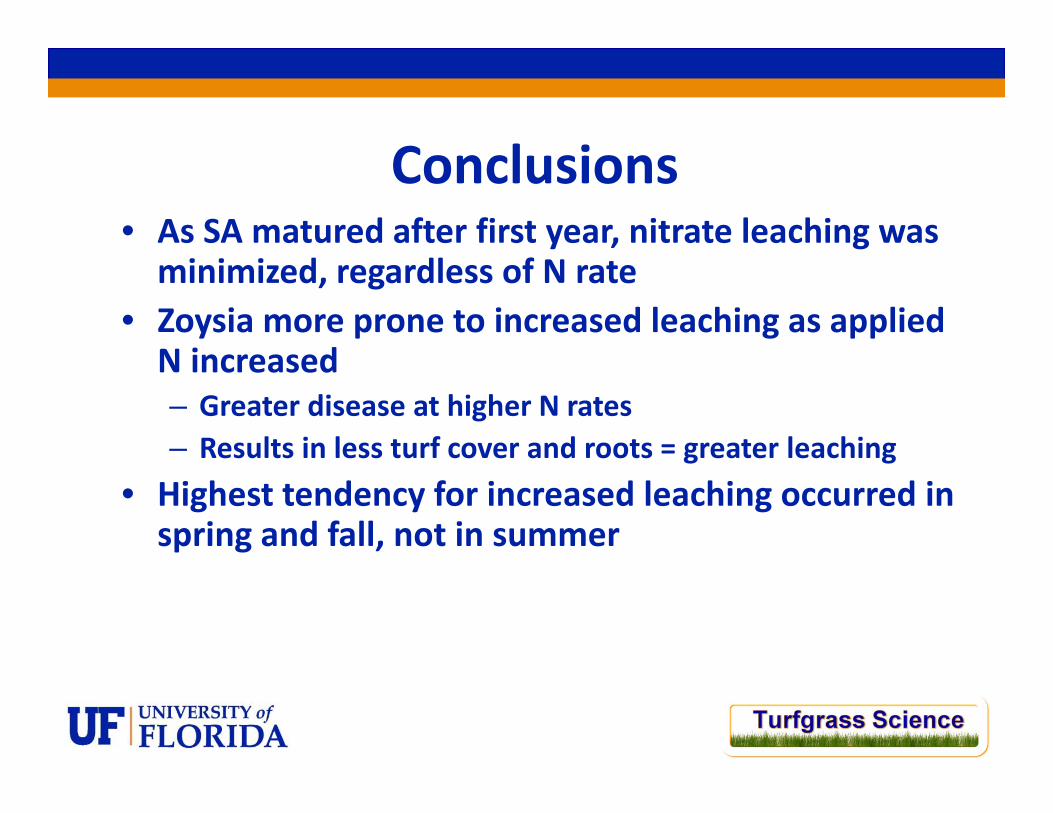
Conclusions• As SA matured after first year, nitrate leaching was minimized, regardless of N rate
• Zoysia more prone to increased leaching as applied N increased– Greater disease at higher N rates– Results in less turf cover and roots = greater leaching
• Highest tendency for increased leaching occurred in spring and fall, not in summer
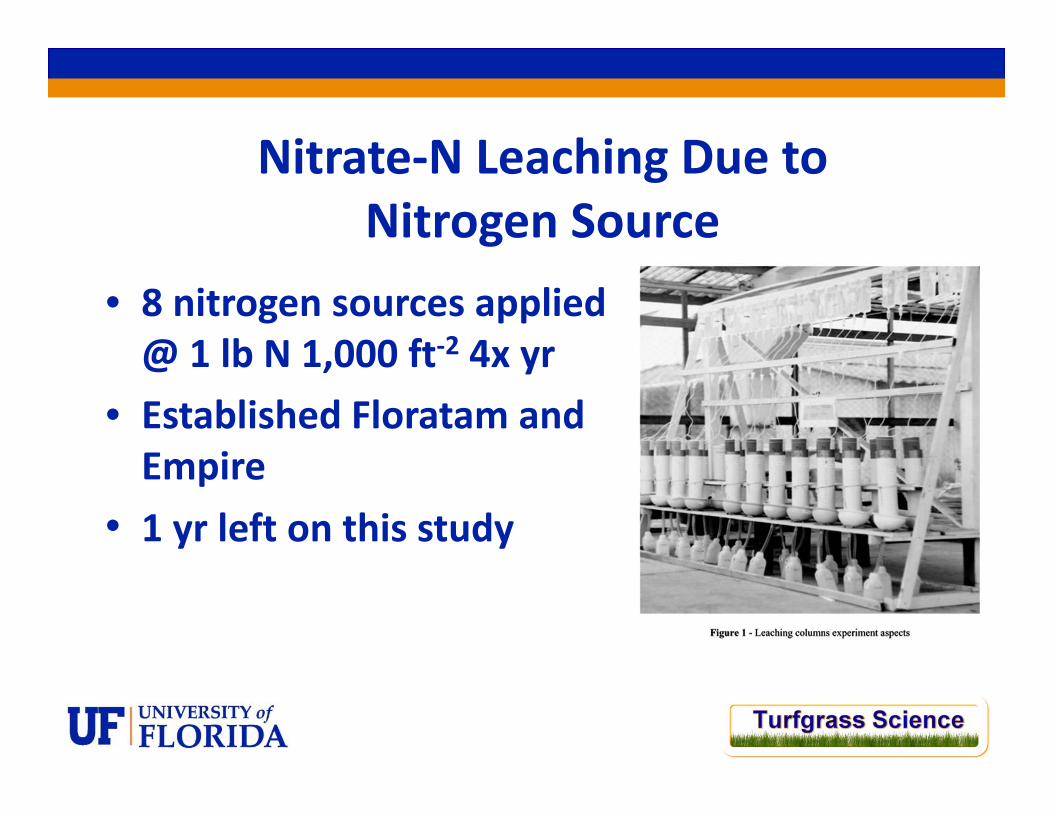
Nitrate‐N Leaching Due to Nitrogen Source
• 8 nitrogen sources applied @ 1 lb N 1,000 ft‐2 4x yr
• Established Floratam and Empire
• 1 yr left on this study
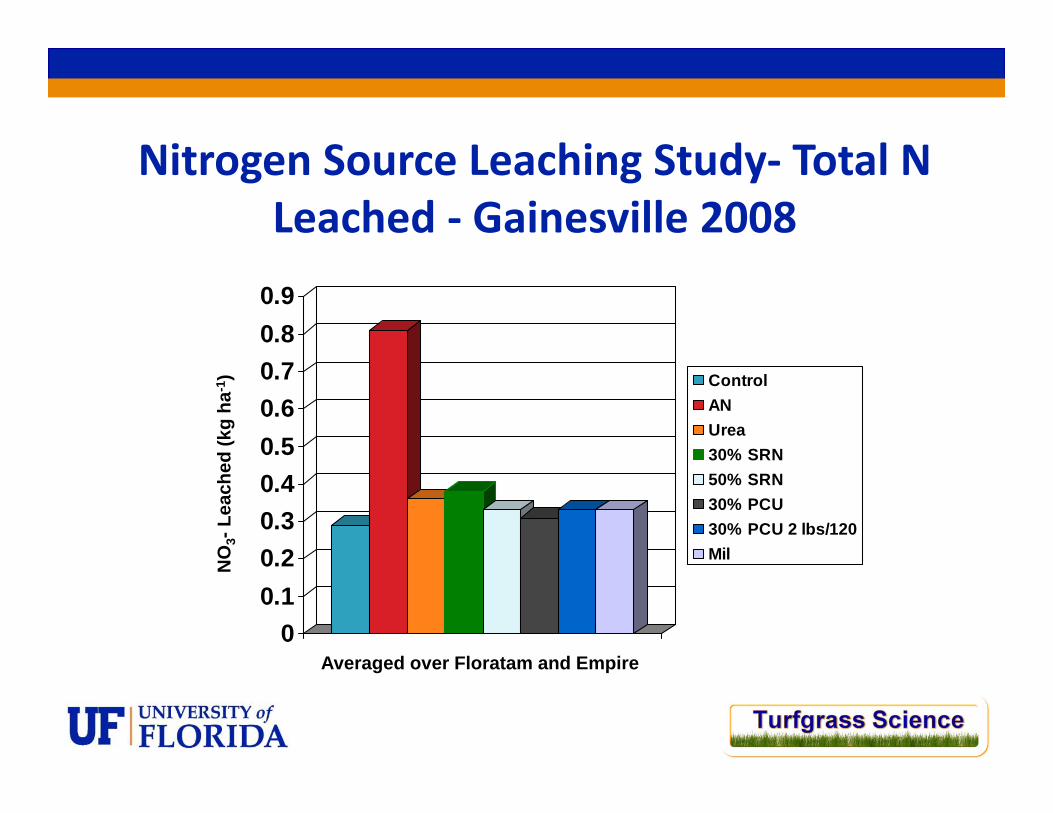
Nitrogen Source Leaching Study‐ Total N Leached ‐ Gainesville 2008
00.10.20.30.40.50.60.70.80.9
ControlANUrea30% SRN50% SRN30% PCU30% PCU 2 lbs/120Mil
NO
3-Le
ache
d (k
g ha
-1)
Averaged over Floratam and Empire
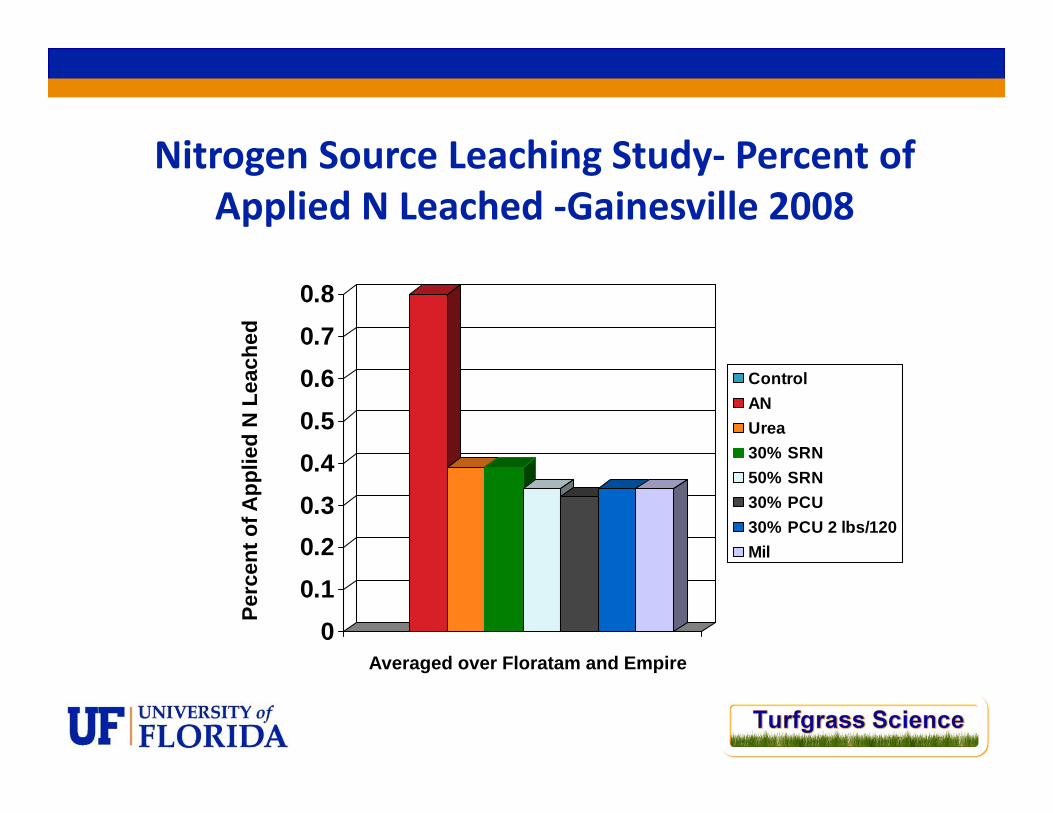
Nitrogen Source Leaching Study‐ Percent of Applied N Leached ‐Gainesville 2008
00.10.20.30.40.50.60.70.8
ControlANUrea30% SRN50% SRN30% PCU30% PCU 2 lbs/120Mil
Perc
ent o
f App
lied
N L
each
ed
Averaged over Floratam and Empire
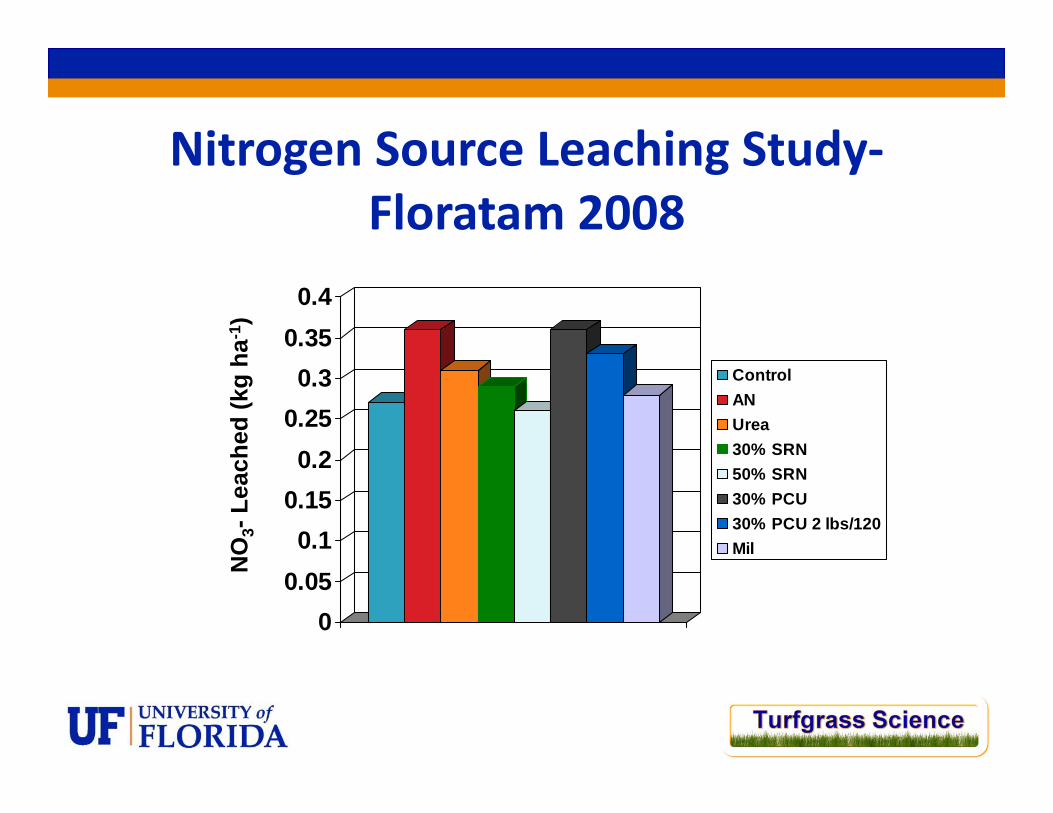
Nitrogen Source Leaching Study‐Floratam 2008
00.050.1
0.150.2
0.250.3
0.350.4
ControlANUrea30% SRN50% SRN30% PCU30% PCU 2 lbs/120Mil
NO
3-Le
ache
d (k
g ha
-1)

Nitrogen Source Leaching Study‐Empire 2008
0
0.2
0.4
0.6
0.8
1
1.2
1.4
ControlANUrea30% SRN50% SRN30% PCU30% PCU 2 lbs/120Mil
NO
3-Le
ache
d (k
g ha
-1)

Conclusions• From 2 yrs of data, there are no differences between
products (except AN) when nitrogen applied at the recommended UF‐IFAS rates
• More important in nitrate leaching reduction is application (getting fertilizer to the grass, not on sidewalk), time of year, application rate, health of grass, etc.
• Any nitrogen source OK to sue as long as it is handled and applied correctly
