presentation to universita’roma3 low cost-modello differenziato di business 13 th of december 2010...
TRANSCRIPT

1
Presentation to Universita’Roma3
Low Cost-Modello differenziato di Business
13th of December 2010
1

2
easyJet Business Model easyJet’s business model is centred on being:
low cost, financially strong and highly efficient
Building Europe’s number one air transport network – by establishing a dense point-to-point network serving Europe’s largest unique catchments through convenient airports
Providing a strong customer proposition and
strong visible brand
Dynamic fares…if you book early, you pay less
Optional extras – pay only for what you need
Distribution - over 98% initial sales on-line
Operate a highly utilised fleet

3
Europe’s best performing airline-Highlights 2010
easyJet’s advantaged network and improved consumer demand has driven strong revenue performance
Total revenue per seat up 5.1% reported, +3.3% at constant currency
Seats flown grew by 6.0%, with a 15.9% increase in mainland Europe
Market share has grown from 6.5% to 7.6% over the last year
Underlying profit per seat grew by £2.53 to £3.36
Fuel costs reduced by £2.19 per seat as higher priced hedges rolled off
Mix improvement offset the increased costs of disruption
Return on equity grew 3.1ppt to 8.6%
Continued strong cash generation, net cash flow from operations improved by £229m to £363m
3* Excludes interest income* Excludes interest income

4
easyJet has strengthened
4

5
Cost per seat - key drivers
5

6
Delivering cost savings
Additional £65m of cost reduction identified
Original target p.a. by F’11
Increased target p.a. by F’12
Ownership - exit expensive aircraft from fleet £40m £30m
Maintenance - in-sourcing, SRT deal & further contract renegotiation, efficiency projects
£8m £35m
Overheads - leverage scale £6m £10m
Airports & Handling – handing & volume deals, check-in process improvement, some self handling & low cost terminals
£9m £60m
Crew – productivity & flexibility initiatives, Boeing exit (no requirement to ring fence crew), new rostering systems
£30m £35m
Fuel – GPU usage, flight planning, fuel reporting and pilot technique
£30m £20m
Total £125m £190m
Delivers a net benefit to the bottom line of £1 per seat by end F’12

7
Efficient fleet management
771 includes 4 aircraft held for sale (4 x A320) which will exit the fleet by 30.09.10

8
easyJet’s Growth First flight operated on the 10th
November 1995 between Luton and Glasgow
Average year on year growth of 15% 2006 -2008
Passenger Growth
20 bases across Europe inc. Rome (FCO) established in 2009
Further mid-term growth 7.5% per annum - over 5 year
48.8 M passengers transported in 2010 (+7,9%)

9
easyJet’s phenomenal growth in Europe
easyJet has seen continued growth since start of operations in 1995
easyJet is No3 in Italy, No2 in France and Spain and No1 in the UK
easyJet has seen continued growth since start of operations in 1995
easyJet is No3 in Italy, No2 in France and Spain and No1 in the UK
0
10,000,000
20,000,000
30,000,000
40,000,000
50,000,000
60,000,000
Year
Passen
gers
easyJet France
easyJet
easyJet France 5,500,000 6,600,000 8,000,000 10,000,000 11,000,000 12,000,000
easyJet 33,000,000 38,000,000 44,000,000 45,000,000 48,000,000 53,000,000
2006 2007 2008 2009 2010 2011

10
Network- What we are interested in
Slots in primary, congested Airports, to attract good yields
Airfields is not our Business
Good catchment areas, with natural, healthy mix of outgoing and incoming passengers
Airports with different services for different Airlines models
Airports available to share investments principles
Airports which come up with ideas to promote, and not kill, high load factor
Less spreadsheets, more facts
Point to point- W patterns are operational and cost burdening

11
Network – Connecting Convenient Airports
UK’s largest airline
Europe’s 4th largest airline
Accessible Network:
Over 300m inhabitants within one hours drive on an easyJet airport
Increasing diversity
Pan European Network – 53% of passengers originate from outside the UK
Third of flying does not touch the UK
Vital Network Statistics:
29 countries
20 bases
123 airports
More than 500 routes
196 aircraft
48.8 million passengers

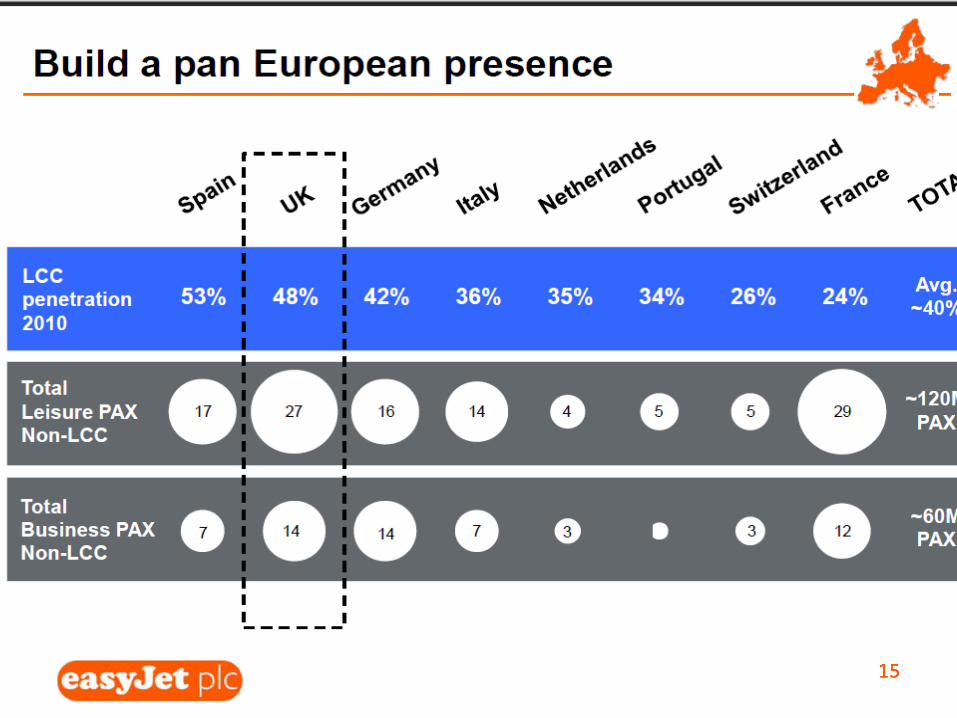
12
Breadth and depth of network Leading presence on Europe’s
top 100 routes
Strong, defendable positions
London Gatwick No.1
Milan Malpensa No.1
Geneva No.1
Paris No.2
Berlin Schönefeld No.1

13
Efficient fleet management
1313

141414
151515

16
easyJet growth in Fiumicino
Start of Operations in November 08
Start of based operations in November 09
Steady, Constant growth year on year
99000
1058000
1921000
0
500000
1000000
1500000
2000000
2500000
2008 2009 2010
YEAR OF OPERATIONS
PA
SS
EN
GE
RS
NU
MB
ER

17
easyJet in Ciampino
Decrease of traffic in favour of FCO started in 2009
Process continues based on slots and infrastructures availability
1034000
884000
682000
0
200000
400000
600000
800000
1000000
1200000
2008 2009 2010
YEAR OF OPERATIONS
PA
SS
EN
GE
RS
NU
MB
ER

18
Differential pricing for LCC’s = Growth
Airports across Europe moving to ‘pay for use’ & ‘differential pricing’ – rewarding efficient use of Airports
Establishing a differential pricing structure should be easier and does not need to represent a downgraded quality of services
Low cost does not mean no seats and no shops
More efficient infrastructure usage allows for differential pricing (as per EU regs) e.g.:
Parking positions accessible by foot (walk in-walk out everywhere); no buses, no airbridges
Per usage charges; not per departing passenger

19
The Key Economic Driver- “The passenger”
Growth incentives to be encouraged at all airports, especially where infrastructure changes are not possible, to reward growth in overall traffic volumes
A charging structure that favours efficient airlines; with lesser passenger weighted charges, delivers demonstrable and measurable benefits:
Higher load factors and therefore more passengers driving commercial revenues for airport
Lower environmental impact of air travel for passengers, through efficient use of aircraft
20
…..we need each other to get the job done!
easyJet
Airports

21
Thank you!