presentation to the health market inquiry · bonitas open scheme market share 53,8% 13,4% ......
TRANSCRIPT

PRESENTATION TO THE
HEALTH MARKET
INQUIRY
19 May 2016
BONITAS | HMI1

Agenda
• Presenters
• Dr A Ramasia (Principal Officer)
• Mr R Cowlin (Trustee)
• Mr G van Emmenis ( Chief Operations Officer)
• Historical Overview and Scheme Profile
• Risk Management and Non-Healthcare Costs
• Market Forces
BONITAS | HMI2

HISTORICAL OVERVIEW
AND SCHEME PROFILEDr A Ramasia
BONITAS | PRESENTATION TITLE3

Historical Overview
• Founded in 1982 primarily as a scheme for the black civil servants,
within the Medscheme stable
• 34 years old
• Second largest open medical scheme in South Africa
• Manages 650 000 lives
• R3.3 bn in reserves
• Solvency of 26%
• Largest general practitioner network in South Africa
(6200 contracted GPs)
• Specialist network of 2600 practitioners
• Membership within Municipalities (SALGA), Eskom, Other large
corporate entities
BONITAS | HMI4

BONITAS | HMI5
Bonitas open scheme market share
53,8%
13,4%
4,6% 4,6% 3,9% 3,3% 3,0% 2,4% 2,4%
8,6%
Discovery Bonitas Momentum Medihelp Bestmed Medshield Fedhealth Sizwe Liberty Otherschemes
2013 2014
Source: CMS Annual Reports

BONITAS | HMI6
BONITAS GOVERNANCE STRUCTURES
Board of Trustees
11 positions
1 vacancy
Audit and Risk
3 Independent members
2 Board members
Working and Strategic Committee
5 Board members
2 Executives
Investment
1 Independent members
2 Board members
Remco
2 Independent members
3 Board members
Appeals
3 Independent members
7
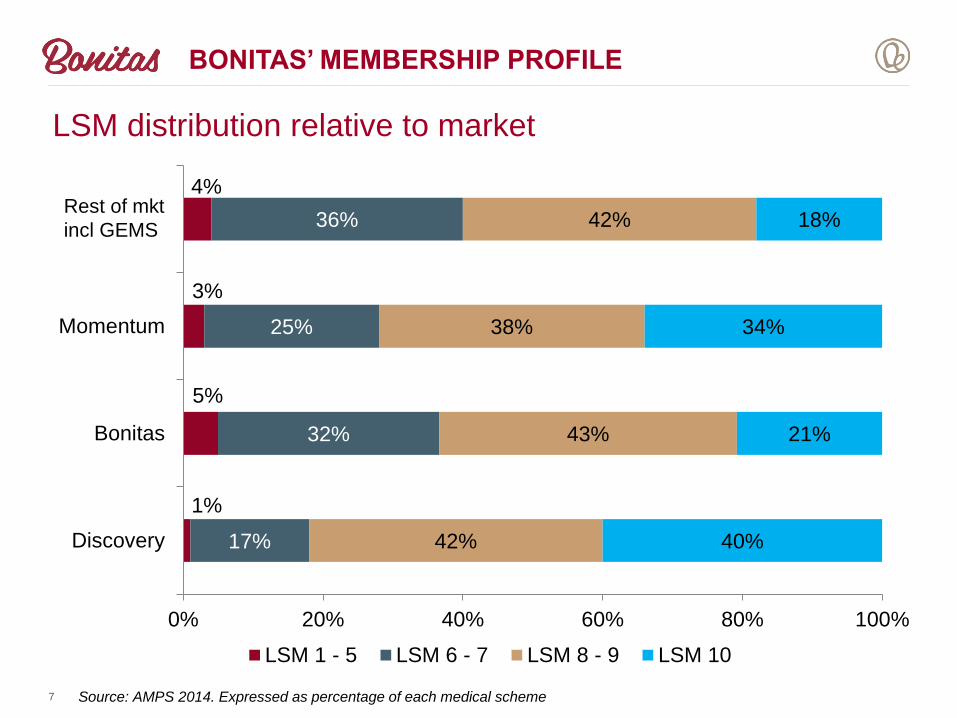
LSM distribution relative to market
Source: AMPS 2014. Expressed as percentage of each medical scheme
1%
5%
3%
4%
17%
32%
25%
36%
42%
43%
38%
42%
40%
21%
34%
18%
0% 20% 40% 60% 80% 100%
Discovery
Bonitas
Momentum
Market
LSM 1 - 5 LSM 6 - 7 LSM 8 - 9 LSM 10
BONITAS’ MEMBERSHIP PROFILE
Rest of mkt
incl GEMS

BONITAS | HMI8
BONITAS’ MEMBERSHIP PROFILE
67%
22%
7%
4%
Black
White
Coloured
Indian
39%
54%
4%
3%
Black
White
Coloured
Indian
39%
45%
6%
10%
Black
White
Coloured
Indian
Discovery
Bonitas Fedhealth
Momentum
44%
44%
5%
7%
Black
White
Coloured
Indian
Source: AMPS 2014

BONITAS | HMI9
PMB cost graphs
5 145
5 885
6 597
7 830
2011 2012 2013 2014
PMB cost - R per beneficiary per year
14%
12%
19%
52%
THE IMPACT OF PMBS

BONITAS | HMI10
Bonitas PMB claims as a proportion of total risk claims
38,7% 39,9%43,3% 45,9% 48,1% 49,4%
52,9% 53,9%
8,4% 8,9%
10,2%9,4%
9,3% 9,5%9,7% 10,5%
52,9% 51,2%46,5% 44,6% 42,6% 41,0%
37,3% 35,6%
0%
10%
20%
30%
40%
50%
60%
70%
80%
90%
100%
2008 2009 2010 2011 2012 2013 2014 2015
Risk Amt PMB IH Risk Amt PMB OOH Risk Amt Non PMB
THE IMPACT OF PMBS

Managed care moving from rules based to member-centric
initiatives with providers playing a key role
BONITAS | HMI11
MHC EVOLVING
Empowerment
Activation tailored
to needs
Improved
outcomes
Positive
experience
Transactional
Defined Benefit
Contained Cost
! VALUE-BASED

Managed care moving from rules based to member-centric
initiatives with providers playing a key role
MHC EVOLVING
High
risk
individuals
Emerging risk
individuals
Diseased individuals
Individuals with risk factors or acute episodes
Healthy individuals
Stratified scheme
population
Stratified Disease Management (DM)
High risk beneficiary
programme (DM) +
lifestyle interventions
Emerging Risk
(DM) + lifestyle
interventions
Other (DM)
Cases +
interventions
Strategic
purchasing
Coordination
of care
Individual wellness
Benefit utilisation risk
management/exception
management
Fraud, waste & abuse
management
BI, analysis and
monitoring

2015 Savings
Total Estimated (net) Reduction in Claims R158.30 pmpm
Total Estimated (net) Reduction in Claims R559.1 million
Reduction as a % of 2015 Risk Claims 6.3%
Reduction as a % of 2015 Risk Contributions 5.3%
BONITAS | HMI13
VALUE OF MANAGED CARE
Based on directly measurable savings only and does not take in to account behaviour change as a
result of managed care interventions (“halo” effect) and direct savings which cannot currently be
quantified.

RISK MANAGEMENT AND
NON-HEALTHCARE
COSTSGerhard van Emmenis
BONITAS | PRESENTATION TITLE14

Independent relationship between Scheme and Administrator -
Managing the risk• As seen from the Historical overview, the Scheme commenced
operating as such within the Medscheme stable.
• Due to the change in the legislative environment, the Scheme had to
be re-structured and exist in its current form
• The Scheme separated completely from Medscheme, which it retains
as a strategic service provider.
• The Scheme is the dominant partner in the relationship
• Branding of the Scheme and Medscheme remains completely separate
– there is a concerted effort to ensure that both the corporate identities
and the branding of the Scheme remains distinct from that of its
administrator.
• Also, the Scheme ensures its independence by ensuring that the
following elements remains fully within its control
BONITAS | HMI15

CORPORATE GOVERNANCE PRINCIPLES
• Tariffs negotiations with Service Providers are done by the Fund
• With managed care agreements, the Schemes MHO only facilitates the negotiation process
• Final decisions and contracts concluded solely by the Scheme
Tariffs Negotiations
• Procurement is done by the Scheme strictly in line with its own procurement process
• Independently managed internally by the Scheme
Procurement
BONITAS | HMI16

• Opening and closing of bank accounts are only done on instruction of the Board of Trustees
• Control is maintained over these bank accounts as is required in terms of section 26(1)(c) of the Medical Schemes Act
• The Scheme’s investments are independently maintained by the Scheme’s duly appointed investment advisors
Banking & Investments
BONITAS | HMI17
CORPORATE GOVERNANCE PRINCIPLES
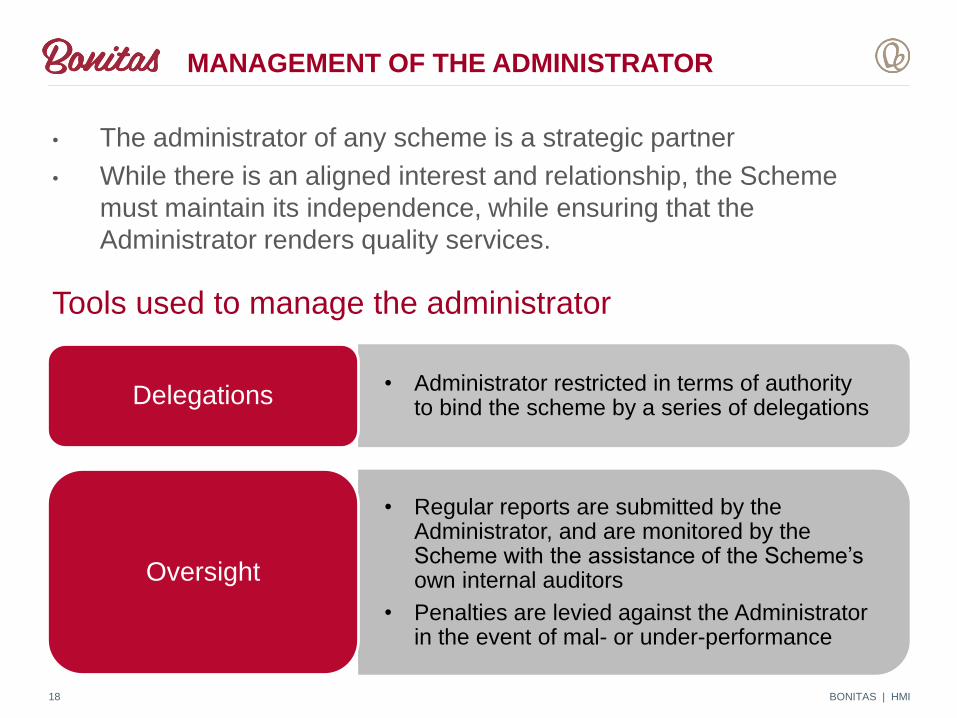
Tools used to manage the administrator
BONITAS | HMI18
• Administrator restricted in terms of authority to bind the scheme by a series of delegations
Delegations
• Regular reports are submitted by the Administrator, and are monitored by the Scheme with the assistance of the Scheme’s own internal auditors
• Penalties are levied against the Administrator in the event of mal- or under-performance
Oversight
MANAGEMENT OF THE ADMINISTRATOR
• The administrator of any scheme is a strategic partner
• While there is an aligned interest and relationship, the Scheme
must maintain its independence, while ensuring that the
Administrator renders quality services.
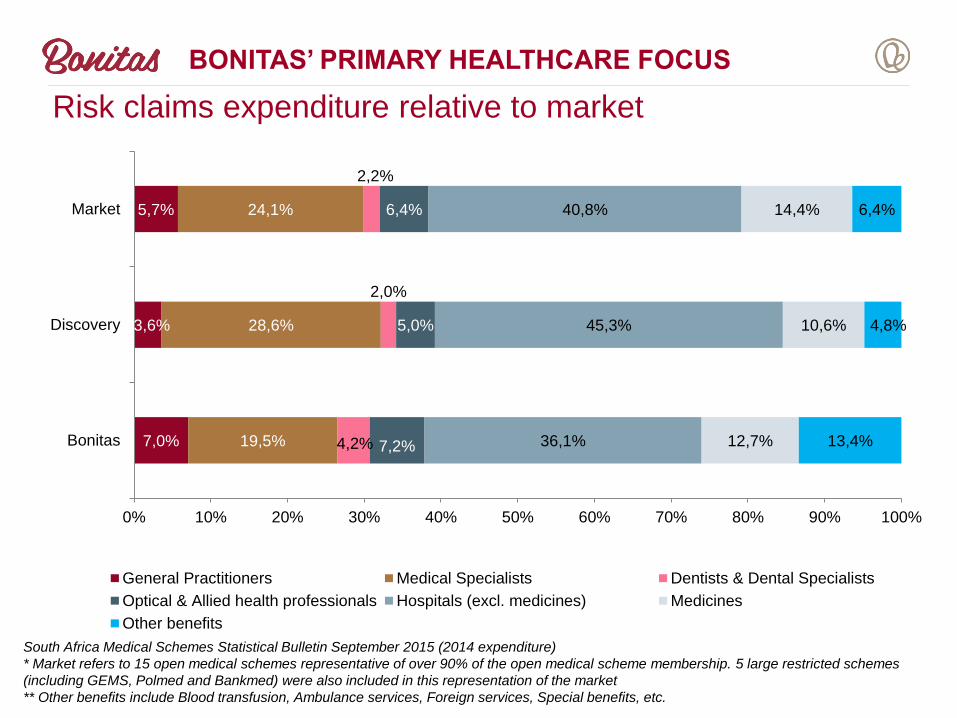
Risk claims expenditure relative to market
South Africa Medical Schemes Statistical Bulletin September 2015 (2014 expenditure)
* Market refers to 15 open medical schemes representative of over 90% of the open medical scheme membership. 5 large restricted schemes
(including GEMS, Polmed and Bankmed) were also included in this representation of the market
** Other benefits include Blood transfusion, Ambulance services, Foreign services, Special benefits, etc.
7,0%
3,6%
5,7%
19,5%
28,6%
24,1%
4,2%
2,0%
2,2%
7,2%
5,0%
6,4%
36,1%
45,3%
40,8%
12,7%
10,6%
14,4%
13,4%
4,8%
6,4%
0% 10% 20% 30% 40% 50% 60% 70% 80% 90% 100%
Bonitas
Discovery
Market
General Practitioners Medical Specialists Dentists & Dental Specialists
Optical & Allied health professionals Hospitals (excl. medicines) Medicines
Other benefits
BONITAS’ PRIMARY HEALTHCARE FOCUS

Risk+Savings claims expenditure relative to market
South Africa Medical Schemes Statistical Bulletin September 2015 (2014 expenditure)
* Market refers to 15 open medical schemes representative of over 90% of the open medical scheme membership. 5 large restricted schemes
(including GEMS, Polmed and Bankmed) were also included in this representation of the market
** Other benefits include Blood transfusion, Ambulance services, Foreign services, Special benefits, etc.
7,5%
5,8%
6,8%
21,6%
27,8%
25,1%
4,1%
4,8%
3,4%
7,4%
8,3%
8,0%
35,5%
34,6%
36,1%
15,5%
16,7%
17,9%
8,3%
2,1%
2,8%
0% 10% 20% 30% 40% 50% 60% 70% 80% 90% 100%
Bonitas
Discovery
*Market
General Practitioner Specialists, Pathology & Radiology Dentists & Dental Specialists
Optical & Allied Health Professionals Hospital Medicines
** Other benefits
RISK TRANSFER MODELS
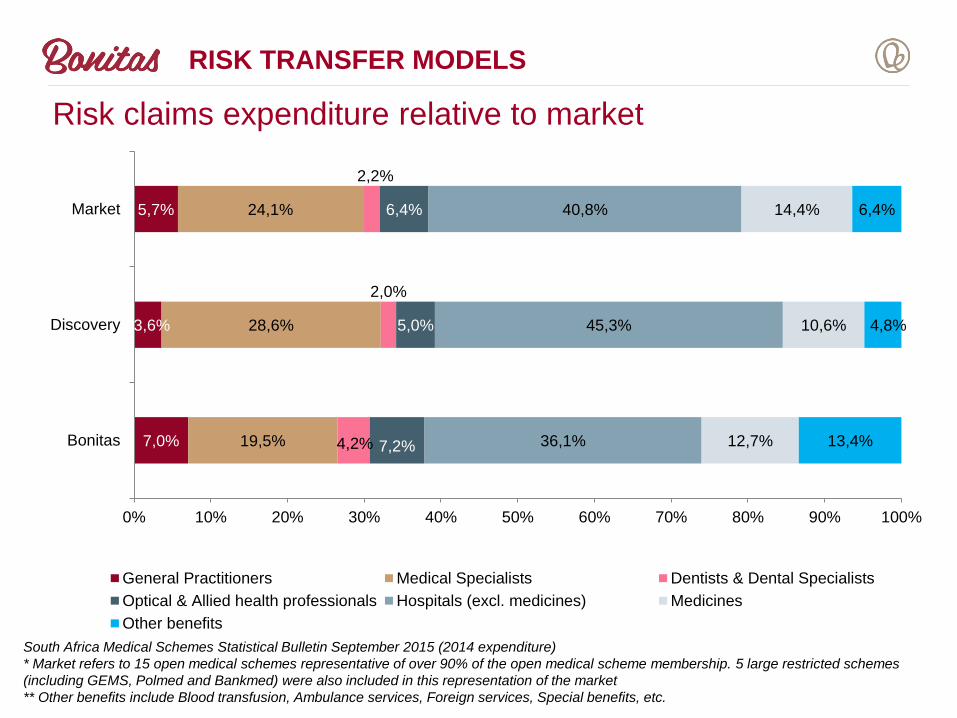
Risk claims expenditure relative to market
South Africa Medical Schemes Statistical Bulletin September 2015 (2014 expenditure)
* Market refers to 15 open medical schemes representative of over 90% of the open medical scheme membership. 5 large restricted schemes
(including GEMS, Polmed and Bankmed) were also included in this representation of the market
** Other benefits include Blood transfusion, Ambulance services, Foreign services, Special benefits, etc.
7,0%
3,6%
5,7%
19,5%
28,6%
24,1%
4,2%
2,0%
2,2%
7,2%
5,0%
6,4%
36,1%
45,3%
40,8%
12,7%
10,6%
14,4%
13,4%
4,8%
6,4%
0% 10% 20% 30% 40% 50% 60% 70% 80% 90% 100%
Bonitas
Discovery
Market
General Practitioners Medical Specialists Dentists & Dental Specialists
Optical & Allied health professionals Hospitals (excl. medicines) Medicines
Other benefits
RISK TRANSFER MODELS

Risk Transfer Arrangements: Costs maintained at or near CPI
since inception in 2004
BONITAS | HMI22
Claims and Capitation Fees
0
50
100
150
200
250
300
350
400
450
500
2001 2002 2003 2004 2005 2006 2007 2008 2009 2010 2011 2012 2013 2014 2015
Ind
ex
Dental: DENIS Optical: PPN/Iso Leso
Total In-hospital Claims CPI
RISK TRANSFER MODELS

BONITAS | HMI23
RISK TRANSFER MODELS - DENTAL
Dental costs contained in risk transfer arrangement

BONITAS | HMI24
Administration Costs pmpm
Year 2008 2009 2010 2011 2012 2013 2014
Discovery Health Medical Scheme 223 238 232 233 236 245 254
Bonitas Medical Fund 150 173 183 193 214 223 230
Momentum Health 182 187 183 169 170 173 184
Medihelp 212 204 209 216 234 266 311
Bestmed Medical Scheme 236 263 244 269 274 240 233
Medshield Medical Scheme 208 162 130 131 151 174 204
Fedhealth Medical Scheme 210 217 213 248 261 271 288
Liberty Medical Scheme 201 227 272 315 316
Sizwe Medical Fund 203 214 214 246 264 272 314
Keyhealth 201 222 240 245 251 254 283
MHC Costs pmpm
Year 2008 2009 2010 2011 2012 2013 2014
Discovery Health Medical Scheme 49 53 67 70 74 79 83
Bonitas Medical Fund 56 61 67 74 71 81 80
Momentum Health 48 50 51 49 46 45 47
Medihelp 37 40 40 46 54 56 63
Bestmed Medical Scheme 45 53 55 56 50 53 48
Medshield Medical Scheme 47 46 40 43 47 51 57
Fedhealth Medical Scheme 40 45 49 58 56 70 74
Liberty Medical Scheme 55 60 64 77 75
Sizwe Medical Fund 50 45 48 53 58 70 75
Keyhealth 43 51 52 56 62 65 70
Source: CMS Annual Reports
COMPARISON OF ADMIN AND MHC FEES

Comparison of Admin Fees: % of Contributions
BONITAS | HMI25
2008 2009 2010 2011 2012 2013 2014
Discovery Health Medical Scheme 13,7% 13,4% 12,4% 11,7% 11,2% 10,6% 10,2%
Bonitas Medical Fund 8,9% 9,4% 8,8% 8,8% 9,3% 8,7% 8,2%
Momentum Health 11,8% 10,8% 9,9% 9,6% 9,2% 9,2% 9,4%
Medihelp 8,5% 8,4% 8,0% 7,8% 8,7% 9,5% 10,4%
Bestmed Medical Scheme 14,0% 14,5% 9,9% 10,3% 10,2% 8,5% 7,8%
Medshield Medical Scheme 13,0% 9,6% 6,8% 6,1% 6,3% 6,9% 7,7%
Fedhealth Medical Scheme 11,6% 10,8% 9,2% 9,7% 9,8% 9,6% 9,9%
Liberty Medical Scheme 10,8% 10,5% 11,4% 12,1% 11,4%
Sizwe Medical Fund 10,7% 10,3% 9,4% 9,3% 9,0% 8,5% 9,0%
Keyhealth 8,5% 8,4% 8,3% 7,5% 7,0% 6,8% 7,2%
0,0%
2,0%
4,0%
6,0%
8,0%
10,0%
12,0%
14,0%
16,0%
Discovery Health Medical Scheme
Bonitas Medical Fund
Momentum Health
Medihelp
Bestmed Medical Scheme
Medshield Medical Scheme
Fedhealth Medical Scheme
Liberty Medical Scheme
Sizwe Medical Fund
Keyhealth
Source: CMS Annual Reports
COMPARISON OF ADMIN FEES
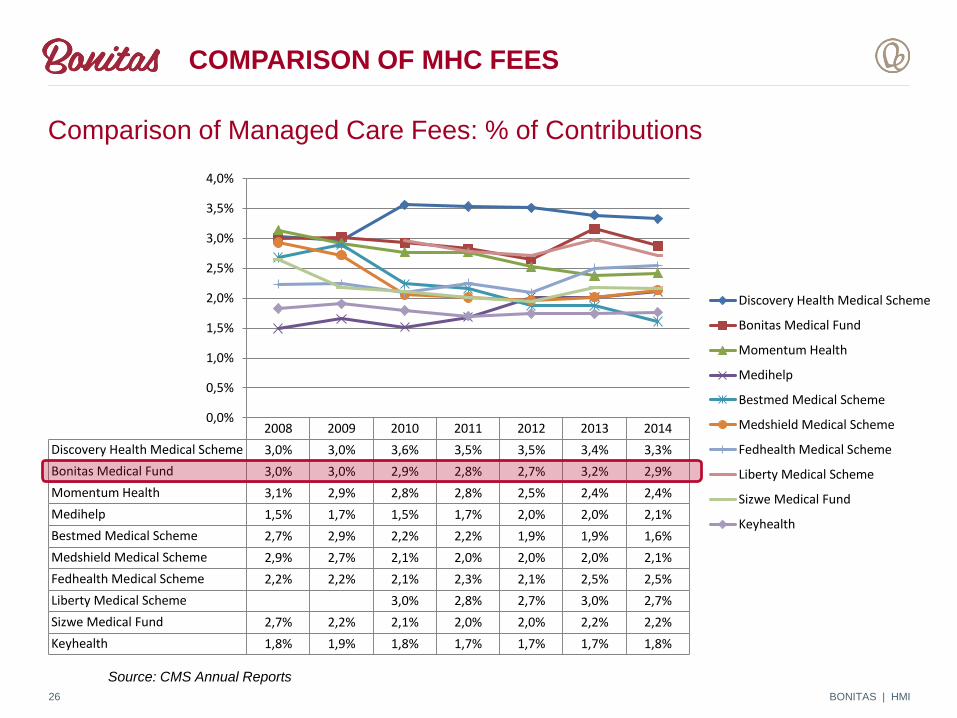
2008 2009 2010 2011 2012 2013 2014
Discovery Health Medical Scheme 3,0% 3,0% 3,6% 3,5% 3,5% 3,4% 3,3%
Bonitas Medical Fund 3,0% 3,0% 2,9% 2,8% 2,7% 3,2% 2,9%
Momentum Health 3,1% 2,9% 2,8% 2,8% 2,5% 2,4% 2,4%
Medihelp 1,5% 1,7% 1,5% 1,7% 2,0% 2,0% 2,1%
Bestmed Medical Scheme 2,7% 2,9% 2,2% 2,2% 1,9% 1,9% 1,6%
Medshield Medical Scheme 2,9% 2,7% 2,1% 2,0% 2,0% 2,0% 2,1%
Fedhealth Medical Scheme 2,2% 2,2% 2,1% 2,3% 2,1% 2,5% 2,5%
Liberty Medical Scheme 3,0% 2,8% 2,7% 3,0% 2,7%
Sizwe Medical Fund 2,7% 2,2% 2,1% 2,0% 2,0% 2,2% 2,2%
Keyhealth 1,8% 1,9% 1,8% 1,7% 1,7% 1,7% 1,8%
0,0%
0,5%
1,0%
1,5%
2,0%
2,5%
3,0%
3,5%
4,0%
Discovery Health Medical Scheme
Bonitas Medical Fund
Momentum Health
Medihelp
Bestmed Medical Scheme
Medshield Medical Scheme
Fedhealth Medical Scheme
Liberty Medical Scheme
Sizwe Medical Fund
Keyhealth
Comparison of Managed Care Fees: % of Contributions
BONITAS | HMI26
Source: CMS Annual Reports
COMPARISON OF MHC FEES

Tax Matters
• Tax contributions treated less favourably
• Largest impact in change in tax dispensation felt by higher LSM
groups which traditionally can afford medical aid
• Many buying down
• Unintended consequence may be to add to the burden of public
health care
• Misconception that self administered schemes save 14% VAT on
administration fee – saving is much less as VAT would be paid on
the components necessary for self administration
BONITAS | HMI27

BONITAS | HMI28
FRAUD, WASTE AND ABUSE
Fraud, Waste &
Abuse
Over-
Servicing
Billing
agents
Member
participation
Tariff
manipulation
False
claimsSyndicated
Opportunistic
Member
apathy
Provider
behaviour
(PMB’s)

BONITAS | HMI29
FRAUD, WASTE AND ABUSE
R1.4bn claims
assessed for HCPs
only
2.05m claim
events; 4.5m lines
Identified R72m FWA
= 5% of claims
5-month analysis (medical professionals only)

BONITAS | HMI30
Operational
improvements to
systemic
weaknesses and
policy gaps
Focused
member &
provider
education
Change
provider
billing
behavior
ZERO Tolerance
Policy
Industry
Consortium
Predictive
Analytics
Preventative
rather than
reactive
FRAUD, WASTE AND ABUSE

MARKET FORCESRodney Cowlin
BONITAS | PRESENTATION TITLE31

BONITAS | HMI32
No of new members brought on by brokers
66 272
43 921
61 162
51 794
29 745
43 618
38 335
34 608 34 675 34 547
2006 2007 2008 2009 2010 2011 2012 2013 2014 2015
No Broker Broker
Note: The Prosano amalgamation impact has been removed in the 2013 figure
BROKERS

BONITAS | HMI33
No of new members by type of broker26 8
21
19 8
86 31 8
04
27 4
69
13 7
97
24 6
59
22 5
99
28 8
10
20 5
25
20 9
37
12 021
4 756
4 55010 540
7 625
18 116
8 247
10 108
7 242 6 172
40 6
05
26 5
59
32 4
61
24 1
87
15 8
10
18 9
42
15 7
35
16 2
05
14 1
50
13 5
62
0
10000
20000
30000
40000
50000
60000
70000
80000
90000
2006 2007 2008 2009 2010 2011 2012 2013 2014 2015
Corporate Broker Direct Medical Scheme Broker
Note: The Prosano amalgamation impact has been removed in the 2013 figure
BROKERS

BONITAS | HMI34
NEW VS LEFT MEMBERS
79 447
51 190
68 815
62 196
37 837
52 177
37 762
44 344
39 422 40 473
47 794
43 575 44 17241 560
49 024
44 75642 289
21 897
35 880
42 227
10 000
20 000
30 000
40 000
50 000
60 000
70 000
80 000
2006 2007 2008 2009 2010 2011 2012 2013 2014 2015
New Left
Note: The Prosano amalgamation impact has been removed in the 2013 figure
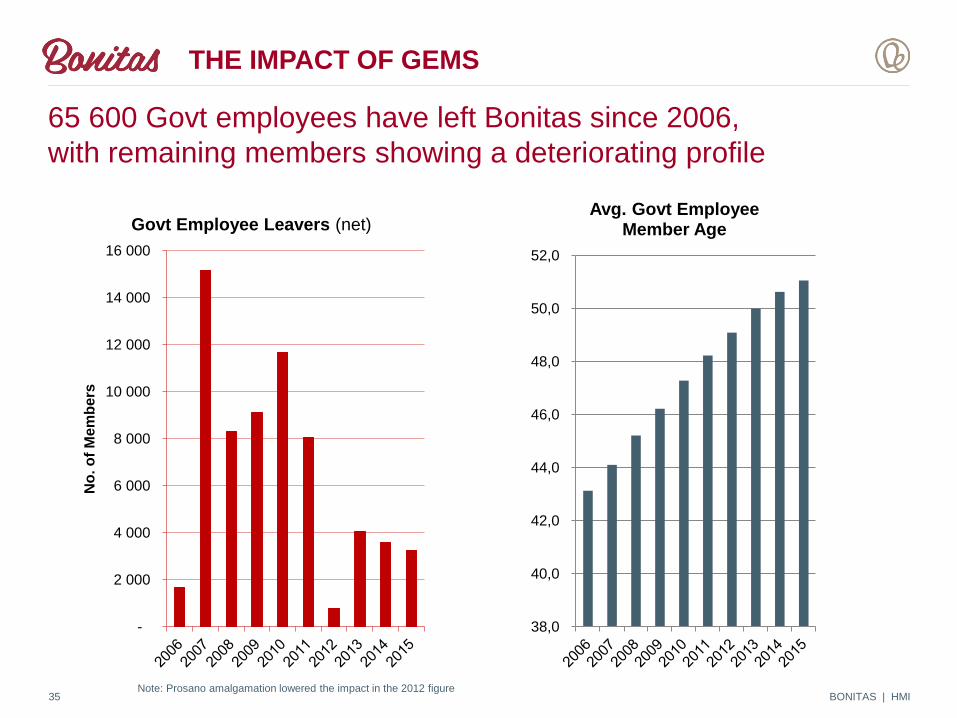
65 600 Govt employees have left Bonitas since 2006,
with remaining members showing a deteriorating profile
BONITAS | HMI35
-
2 000
4 000
6 000
8 000
10 000
12 000
14 000
16 000
No
. o
f M
em
bers
Govt Employee Leavers (net)
38,0
40,0
42,0
44,0
46,0
48,0
50,0
52,0
Avg. Govt Employee Member Age
Note: Prosano amalgamation lowered the impact in the 2012 figure
THE IMPACT OF GEMS

Summary
• Governance structures
• The impact of PMBs
• The impact of GEMS
• Brokers
• Risk share models
• Value based services
• Fraud, waste and abuse
BONITAS | HMI36

THANK YOU
BONITAS | HMI37