presentation to stakeholders - idaho
TRANSCRIPT

Presentation to Stakeholders
November 10, 2020

AGENDA
• Introductions• Study Background• Existing Conditions (Year 2020)• Future Conditions (Year 2040)• Origin-Destination Analysis & Findings• River Crossing Options, Analysis & Findings• Next Steps
2

STUDY PURPOSE AND STUDY AREA
• Understand trip generation and origin-destination (OD) characteristics within the study area
• Identify possible river crossing locations and opportunities to expand existing crossings
• Assess the effects that a new river crossing or an expanded existing crossing would have on regional traffic and freight patterns
• Work with Idaho Transportation Department (ITD) and partnering agencies to collaborate on river crossing strategies
• This study focuses on the traffic components of a new river crossing – a potential next step could be an environmental study.
3

STUDY SCHEDULE
4

EXISTING CONDITIONS (YEAR 2020)
5

LAND USE
6
• High concentration of commercial uses
• At Pole Line Rd/Blue Lakes Blvd intersection
• Along Blue Lakes Blvd
• Industrial and food processing facilities on southern edge between Twin Falls and Kimberly
6

ENVIRONMENTAL CONSIDERATIONS
77
FREIGHT CONSIDERATIONS
8
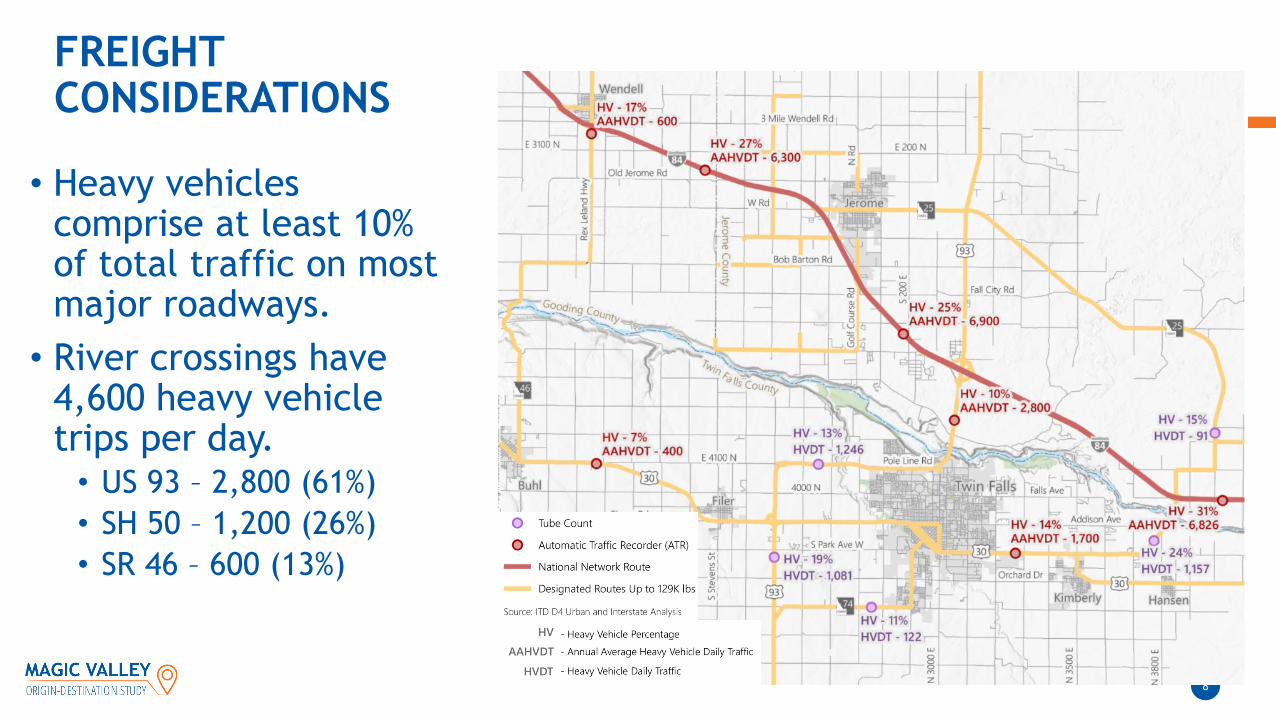
• Heavy vehicles comprise at least 10% of total traffic on most major roadways.
• River crossings have 4,600 heavy vehicle trips per day.
• US 93 – 2,800 (61%)• SH 50 – 1,200 (26%)• SR 46 – 600 (13%)

EXISTING TRAFFIC OPERATIONS (2020)
9
• Majority of roadways and intersections operate at level-of-service (LOS) C or better during the PM peak hour.
• Intersections that operate at LOS D or worse include:
• Blue Lakes Blvd/Pole Line Rd
• Blue Lakes Blvd/Addison Ave

FUTURE CONDITIONS (YEAR 2040)
10

YEAR 2040 GROWTH
11
• Future year 2040 conditions were established using growth rates ranging from 1.4% to 3.3% per year and information from the statewide travel demand model.

YEAR 2040 TRAFFIC OPERATIONS
12
• Several roadways and intersections in Twin Falls are expected to operate at LOS F during the PM peak hour in year 2040 traffic conditions.
• Blue Lakes Blvd/Pole Line Rd• Blue Lakes Blvd/Addison Ave• Washington St/Addison Ave• Shoshone St/Minidoka Ave• Blue Lakes Blvd/Kimberly Rd• Blue Lakes Blvd (Snake River to Kimberly Rd)• Falls Ave (Blue Lakes Blvd to Hankins Rd)• Washington St (South of Addison Ave)• Addison Ave (Hankins Rd to N 3400 E• Pole Line Rd (East of US 93)
• Most roadway segments outside of Twin Falls are expected to operate at LOS C or better in year 2040.

RIVER CROSSING CHARACTERISTICS
13

ORIGIN-DESTINATION ANALYSIS & FINDINGS
14

ORIGIN-DESTINATION ANALYSIS
15
• StreetLight Data was used to understand trip characteristics and travel patterns.
• StreetLight Data sources OD data from Location-Based Services (LBS) and Global Positioning Systems (GPS)

ORIGIN-DESTINATION SNAPSHOT
16
Which crossings are utilized by all vehicle trips between Twin Falls and I-84?
Which crossings are utilized by heavy vehicles going to/coming from industrial areas south of Twin Falls?

17
• US 93 River Crossing• Approximately 56% of all vehicles and 23% of heavy vehicles are trips to or from
North-Central Twin Falls • These trips are unlikely to shift to another crossing location from US 93.
• Trips between Twin Falls and eastern Idaho are split evenly between the US 93 and SH 50 river crossings.
• SH 50 River Crossing• Primarily used by vehicle trips between the Twin Falls area (south of the river) and
I-84 east• Utilized by heavy vehicle trips between the Twin Falls Industrial Area (on US 30)
and I-84 west
• SR 46 River Crossing• Generally not utilized for inter-regional trips between Twin Falls and I-84
ORIGIN-DESTINATION SUMMARY

RIVER CROSSING OPTIONS, ANALYSIS & FINDINGS
18

RIVER CROSSING OPTIONS
19
• Six options considered for further evaluation.
• Option 6 not analyzed further.
• Expansion of US 93 constrained by ROW and adjacent businesses
• Does not address other regional capacity deficiencies
• Options 1-5 selected for further analysis.
• ITD’s Statewide Travel Demand Model (+40K people, +25K jobs in 2040)

OPTION 1 - CONNECT W OF US 93 (CONNECT TO SH 25 IC)
20
• 2-3 lane limited-access roadway that crosses 6 miles west of the US 93 crossing
• 10 miles of new or modified roadway
• 5 new or modified intersections
• 2 new or modified interchanges
• 1,700-2,000 feet bridge span
• 5,300 Daily Trips

21
• 2-3 lane limited-access roadway that crosses 6 miles west of the US 93 crossing
• 8 miles of new or modified roadway
• 5 new or modified intersections
• 2 new or modified interchanges
• 1,700-2,000 feet bridge span
• 7,300 Daily Trips
OPTION 2 - CONNECT W OF US 93 (CONNECT TO S JEROME IC)

22
• 2-3 lane roadway that crosses 3 miles west of the US 93 crossing
• 6 miles of new or modified roadway
• Requires access management along Golf Course Road
• 7 new or modified intersections
• 1 modified interchange
• 5,200-5,500 feet bridge span
• Could be single-span structure or descend into Canyon
• 12,800 Daily Trips
OPTION 3 - CONNECT W OF US 93 (CONNECT TO S JEROME IC)
23
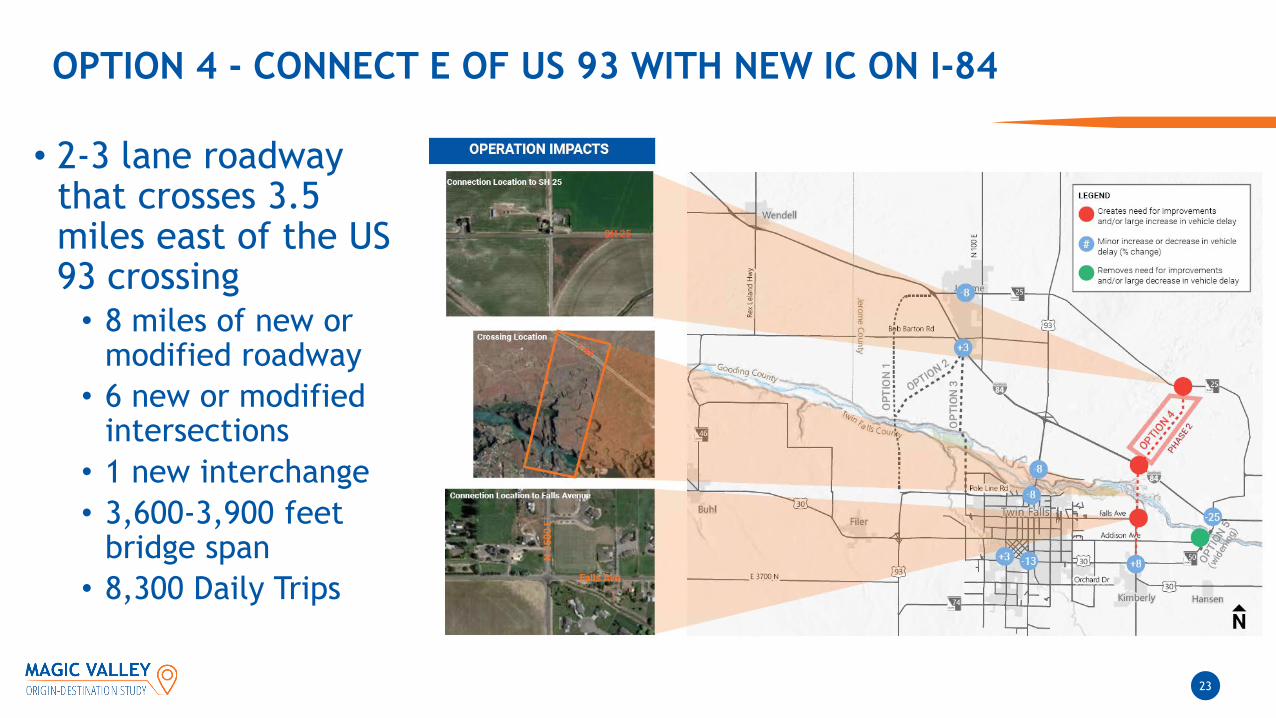
• 2-3 lane roadway that crosses 3.5 miles east of the US 93 crossing
• 8 miles of new or modified roadway
• 6 new or modified intersections
• 1 new interchange• 3,600-3,900 feet
bridge span• 8,300 Daily Trips
OPTION 4 - CONNECT E OF US 93 WITH NEW IC ON I-84

24
• Widens SH 50 to 4/5 lanes from the SH 50 interchange to Addison Ave
• 1 miles of modified roadway
• 1 modified intersection
• 1,200 feet bridge span
• 18,000 Daily Trips (+2,400 from no-build conditions)
OPTION 5 – WIDEN HANSEN BRIDGE (SH 50 CROSSING)

OPTIONS 1-5 SAFETY COMPARISON (YEAR 2040)
25
• Evaluated expected change in crashes on US 93 and SH 50/US 30 corridors
• Small expected reduction of crashes on US 93 (Options 1-4)
• Small expected reduction of crashes on SH 50/US 30 (Option 4)
• Small expected increase in crashes on SH 50/US 30 (Option 5)
• Evaluated predicted crashes for the new roadway alignments.
• All options predicted to have crashes on the new alignment.
• Highest predicted crash rate (Option 3)
US 93 Corridor
SH 50/US 30 Corridor

OPTIONS 1-5 COMPARISON SUMMARY (YEAR 2040) TRAFFIC VOLUMES, TRAVEL TIME, SAFETY
26
Option
New Crossing Volumes
Total Decrease in PM Peak Hour Volume from Existing Crossings
(% Change)
Total Decrease in PM Peak Hour Travel Time (%
Change)
Expected Change in Crashes on US 93 and
SH 50/US 30Daily PM Peak Hour SR 46 US 93 SH 50 Jerome to
Twin FallsSH 50 IC to Twin Falls
Option 1 (W of US 93
@ SH 25)5,300 407 -16% -11% -5% -8% (2 min) -3% (<1 min)
Option 2 (W of US 93
@ Jerome IC)7,300 598 -21% -15% -8% -10% (3 min) -4% (1 min)
Option 3 (W of US 93
@ Jerome IC)12,800 944 -17% -24% -10% -13% (4 min) -4% (1 min)
Option 4 (E of US 93
with new IC)8,300 663 -6% -8% -28% -5% (2 min) -13% (2 min)
Option 5 (SH 50
Widening)
2,400**additional volume on
SH 50
190**additional volume on
SH 50
+6% -5% +16% -3% (1 min) -17% (3 min)

OPTIONS 1-5 COMPARISON SUMMARY (YEAR 2040) INFRASTRUCTURE IMPACTS AND FREIGHT BENEFITS
27
Option
Length of
Bridge Span
Length of Impacted Roadway
# of Impacted Intersections
# of Impacted Interchanges Freight Benefits
New Modified New Modified New Modified Daily Heavy Vehicles Travel Time Savings
Option 1 (W of US 93
@ SH 25)
1,700-2,000 ft 4 miles 6 miles 3 2 1 1 800
Minor travel time savings on US 30/SH 50 (-3%) and US 93 (-8%)
corridors
Option 2 (W of US 93
@ Jerome IC)
1,700-2,000 ft 6 miles 2 miles 4 1 1 1 1,200
Minor travel time savings on US 30/SH 50 (-4%) and US 93 (-10%)
corridors
Option 3 (W of US 93
@ Jerome IC)
5,200-5,500 ft 2 miles 4 miles 2 5 0 1 1,100
Minor travel time savings on US 30/SH 50 (-4%) and US 93 (-13%)
corridors
Option 4 (E of US 93
with new IC)
3,600 –3,900 ft 5 miles 3 miles 2 4 1 0 1,200
Minor travel time savings on US 30/SH 50 (-13%) and US 93 (-5%)
corridors
Option 5 (SH 50
Widening)1,200 ft 0 miles 1 mile 0 1 0 0
600* *additional volume
on SH 50
Travel time savings on US 30/SH 50 (-17%) and US 93 (-3%)
corridors

OPTIONS 1-5 ESTIMATED COST COMPARISON
28
Option Total Estimated Cost
Option 1 (W of US 93 @ SH 25) $245 million
Option 2 (W of US 93 @ Jerome IC) $235 million
Option 3 (W of US 93 @ Jerome IC) $405 million
Option 4 (E of US 93 with new IC) $390 million
Option 5 (SH 50 Widening) $75 million
• Assumptions• 50’ roadway cross-section• 70’ bridge cross-section• 120’ Right-of-Way width• Roundabouts at major
intersections• 40% Contingency• Unit costs
• Bridge Cost = $430/sf• AC = $74/ton• Base/Subbase = $35/CY
NEXT STEPS
29

NEXT STEPS
30

QUESTIONS & DISCUSSION
31

OTHER SLIDES
32

PROJECT COMPARISON – BILLINGS BYPASS
33
• 6 miles new/modified roadway• Modified interchange at I-90• New Crossing over Yellowstone River• Cost = >$115 million• Total time (planning -> construction)
• 17 years (phase 1)• >25 years (all phases)
Feasibility Study
2001
EIS Begins (Notice of
Intent)
2003
EIS Finished (Record of Decision)
2014
Final Design Process Started
2015
Construction on Phase 1
Begins
2019
Construction on all Phases
Complete
2026+

PROJECT COMPARISON – IDAHO 16
34
• 7 miles grade-separated roadway• New interchange at I-80• Crossing over Boise River• Cost
• $102 million (already completed)• $450 million (to complete next phases)
• Total time (planning -> construction)• >8 years (initial phase)• >15 years (all phases)
2006
EIS Begins (Notice of
Intent)
EIS Finished (Record of Decision)
2011
Update to EIS
2014
Construction of Initial Phase
Complete
2018-2020
Design is Finalized
2021
Project is Constructed
2021+ (when funding is available)

YEAR 2020 TRAFFIC VOLUMES
35

YEAR 2040 TRAFFIC VOLUMES
36

YEAR 2020 POPULATION
37
• Taken from the ITD Statewide Travel Demand Model
• Total Population = 103,000

YEAR 2040 POPULATION
38
+10,400
+7,900
+5,400
• Growth concentrated in Twin Falls
• Some growth in Jerome and outside urban areas
• Total Population = 144,000
• Annual growth rate = 1.8%
+1,200

YEAR 2020 EMPLOYMENT
39
• Taken from the ITD Statewide Travel Demand Model
• Total # of Jobs = 44,194

YEAR 2040 EMPLOYMENT
40
+4,400+5,700
+5,100
• Similar trend to population growth
• concentrated in Twin Falls
• some growth in Jerome and outside urban areas
• Total # of Jobs = 68,679• Annual growth rate = 2.2%
+1,000
+1,700