presentation to investors - mahanagar gas
TRANSCRIPT

www.mahanagargas.com1
PRESENTATION TO INVESTORS
September - 2020

MGL : An Introduction
2

3
One of the largest CGD Companies in India
Attractive
MarketSole authorized distributor of CNG and PNG in Mumbai, its Adjoining Areas and
Raigad with more than 25-years consistent growth (1)
Low-Cost Gas
AvailabilityCost-effective availability of domestic natural gas with sourcing flexibility
Infrastructure
ExclusivityOver 5,700 kms of pipeline(2) with infrastructure exclusivity(3) and 261 CNG filling
stations(2)
Robust
Financial
Performance
Revenue CAGR (FY15-20): 7.2%
Return on Net Worth (FY20): 26.87%
Total cash balance of INR 15.1 bn(4,5)
Net worth of INR 28.90 bn(5)
Blue-Chip
Shareholders
GAIL (India) Ltd. (”GAIL”) (32.5%)
Government of Maharashtra (“GoM”) (10.0%)
Public and Other (57.5%)
Commitment
to Health
and Safety
Safety management systems to ensure safe, reliable and uninterrupted distribution of
gas
Strong
Customer
Base
CNG supplied to about 0.77 mn vehicles and PNG connectivity to approximately 1.53
mn domestic households(2)
Note: (1) Established in 1995; (2) As of November 30, 2020; (3) Infrastructure exclusivity prevailing in Mumbai, 2030 in its Adjoining Areas and 2040
in Raigad; (4) Includes Current Investments. (5) As of March 31, 2020
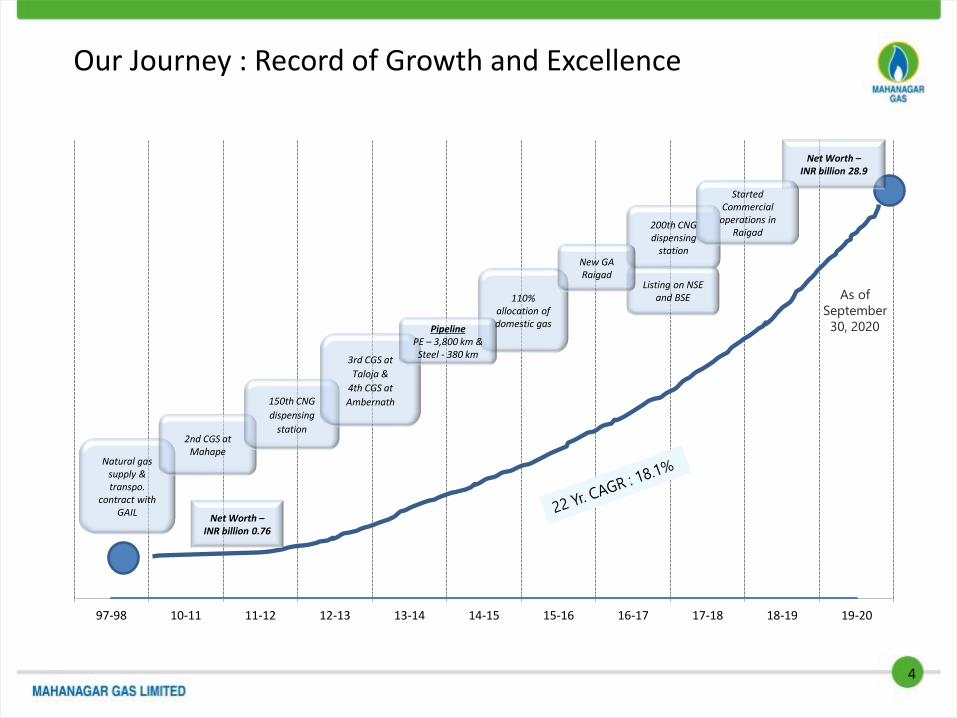
Our Journey : Record of Growth and Excellence
4
97-98 10-11 11-12 12-13 13-14 14-15 15-16 16-17 17-18 18-19 19-20
Natural gas supply & transpo.
contract with GAIL
Net Worth –INR billion 0.76
2nd CGS at Mahape
150th CNG
dispensing
station
3rd CGS at
Taloja &
4th CGS at
Ambernath
110% allocation of domestic gas
200th CNG dispensing
station
Listing on NSE and BSE
Net Worth –INR billion 28.9
Started Commercial
operations in Raigad
PipelinePE – 3,800 km &Steel - 380 km
New GA Raigad
As of
September
30, 2020

Areas of Operation
(1) Figures for Mumbai Metropolitan Region – Total population and technically feasible households out of total population; (2) As of November 30,
2020
Business Operations
MGL Pipeline(2) 5703 kms
MGL PNG
Connections(2) ~ 1.53 mn
MGL CNG
Stations(2) 261
Areas of
OperationMumbai &
Greater Mumbai
Mira-
Bhayander, Navi
Mumbai, Thane
City, Kalyan,
Taloja,
Ambernath,
Dombivli,
Ulhasnagar,
Badlapur,
Bhiwandi,
Kharghar and
Panvel
Raigad District
(adjacent to
existing area of
operation)
Infrastructure
Exclusivity2020 2030 2040
Mumbai Thane District
Raigad
Bhiwandi
Kalyan
Badlapur
Thane
Mira-Bhayander
Arabian Sea
Alibaug
Pen
Khalapur
Karjat
Taloja
Kharghar
Panvel
Uran
Sudhagad
Floha
Tala Mangaon
Wadala
Dombivily
Mahad
Poladpur
Shrivardhan
Navi Mumbai
Ambernath
Population (mn) 20.7 mn population and 3.2 mn households (1)
MGL CNG
Customers(2) ~ 0.77 mn
5

The MGL Proposition
Significant Growth Potential Backed by Favorable
Industry Conditions✓
Underpenetrated Market with Significant Potential for
Expansion✓
Robust Infrastructure in Place to Support Future
Growth✓
Cost Effective Sourcing Strategy✓
Strong Operational and Financial Performance✓
Focused Growth Strategy in Place✓
6
Favorable Regulatory Environment✓
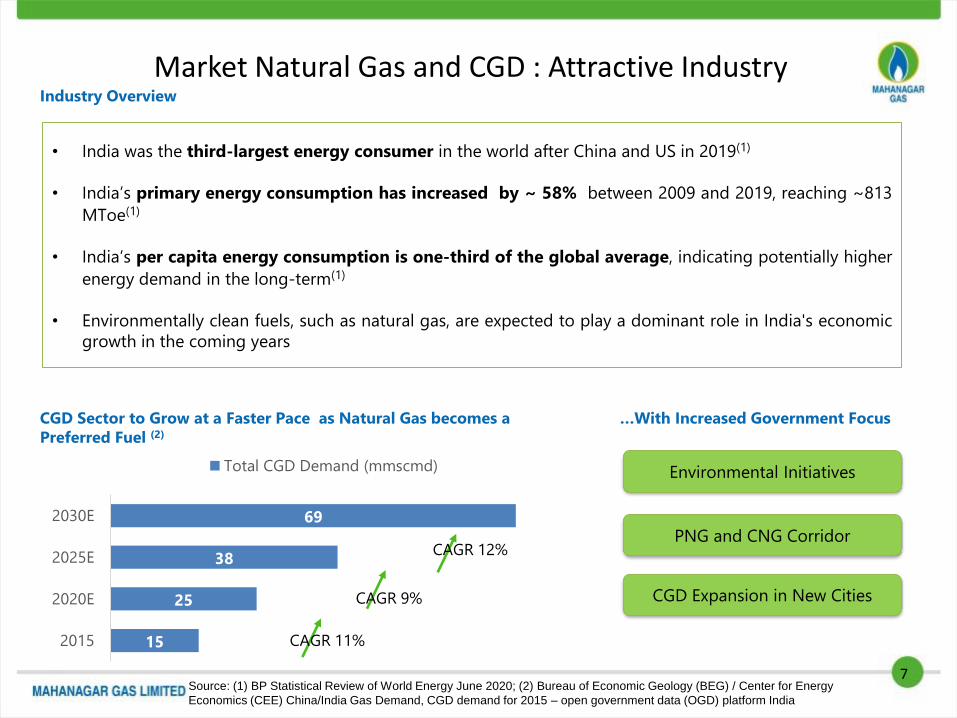
Market Natural Gas and CGD : Attractive Industry
CGD Sector to Grow at a Faster Pace as Natural Gas becomes a
Preferred Fuel (2)
…With Increased Government Focus
15
25
38
69
2015
2020E
2025E
2030E
Total CGD Demand (mmscmd)
CAGR 11%
CAGR 9%
CAGR 12%
• India was the third-largest energy consumer in the world after China and US in 2019(1)
• India’s primary energy consumption has increased by ~ 58% between 2009 and 2019, reaching ~813
MToe(1)
• India’s per capita energy consumption is one-third of the global average, indicating potentially higher
energy demand in the long-term(1)
• Environmentally clean fuels, such as natural gas, are expected to play a dominant role in India's economic
growth in the coming years
Industry Overview
Source: (1) BP Statistical Review of World Energy June 2020; (2) Bureau of Economic Geology (BEG) / Center for Energy
Economics (CEE) China/India Gas Demand, CGD demand for 2015 – open government data (OGD) platform India
Environmental Initiatives
PNG and CNG Corridor
CGD Expansion in New Cities
7

8
Attractive Fuel EconomicsCNG Retains its Price Competitiveness vs. Other Fuels
Comparison of Alternative Fuel Costs
Domestic PNG Provides Savings with respect to Non-
subsidized L/Subsidized LPG Cylinder
Subsidized and Non-subsidized LPG cylinders price is same at
present, Consumers are incentivized to purchase PNG due to
significant savings
Particulars INR / kg or INR / L
CNG 47.90 (1)
Diesel 80.51 (1)
Petrol 90.34 (1)
41%
Diffe
ren
tial
(2)
64%
Diffe
ren
tial
(3)
• Price Advantage
Natural gas provides economic benefits over most
alternative liquid fuels
• Fuel Efficiency
CNG vehicles typically enjoy higher fuel efficiency
• Payback Period
Lower running costs result in lower payback
period and savings
Particulars UoM
PNG (4) INR/SCM 29.58
Commercial LPG (4) INR/Kg 62.58
PNG INR/MMBTU 877
Commercial LPG INR/MMBTU 1275
~31%
diffe
ren
tial
Commercial PNG Favorably Priced vs. Alternate Fuels
Note: (1) Based on prices prevailing in Mumbai as on December 10th , 2020, (2) Mileage of CNG LCV – 10 km/ kg, Diesel LCV – 10 km/
ltr (3) Mileage of CNG Car – 26 km/kg, Petrol car – 18 kms/ ltr ; (4) Based on prices prevailing in Mumbai for November 2020
INR / Year
LPG
Domestic PNG
% Difference
7728
6468
16%

Diversified Sourcing Strategy
CNG & Domestic PNG Industrial / Commercial PNG
• Domestic supply agreement - MoPNG
allocates gas for entire requirement of CNG
and domestic PNG under Administered
Price Mechanism (APM) and Non-APM
Agreements.
• Allocation of 110% of consumption in
previous 6 months to be compulsorily
supplied by GAIL and to be only used for
the Domestic PNG & CNG segments
• Price to be fixed on 6 monthly basis
(market linked – US$ 1.79 / MMBTU on
GCV basis (1)
• Purchase of imported RLNG for industrial/
commercial PNG customers
• Mix of spot and term contracts
• Brent crude prices have recently increased.
APMWestern offshore
Term
RLNG
Spot
RLNGSource
Suppliers
Allocation
Policy
MoPNG
• Assured supply of gas for priority sector requirement
• Priority given to CGDs under new policy
Note: (1) Applicable from 01 October 2020 to 31 March 2021
GAIL
• GAIL
• GSPCL
• HPCL
• IOCL
• TPL
• BPCL
• BGIES
• Hazira LNG
• PLL
• SEMTIPL
9
Non-APM Western Offshore
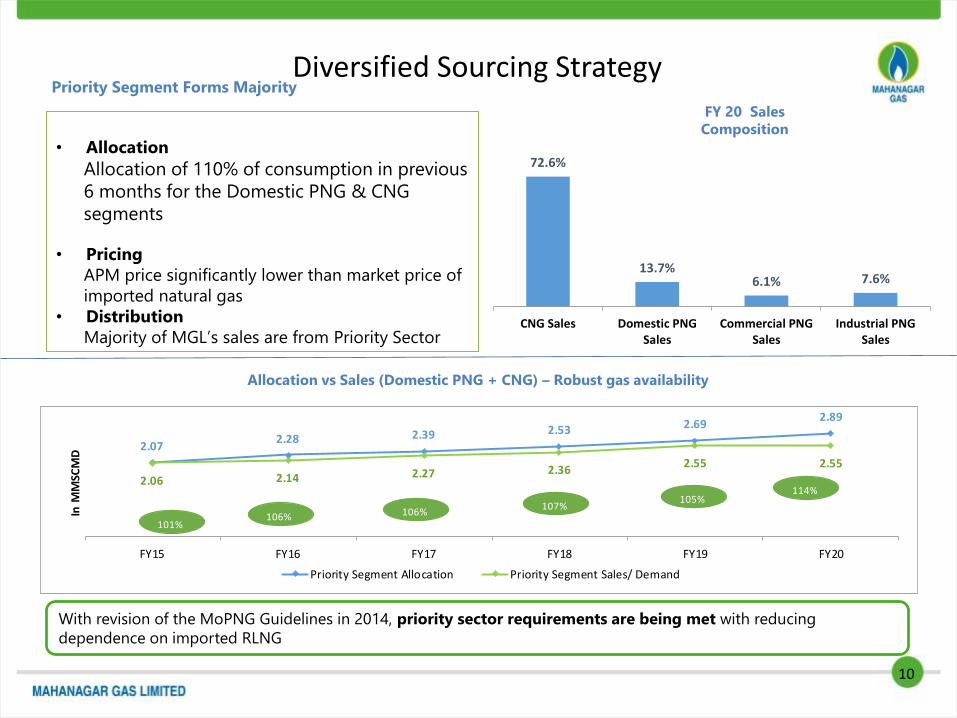
Diversified Sourcing Strategy
Allocation vs Sales (Domestic PNG + CNG) – Robust gas availability
Priority Segment Forms Majority
With revision of the MoPNG Guidelines in 2014, priority sector requirements are being met with reducing
dependence on imported RLNG
FY 20 Sales
Composition
• Allocation
Allocation of 110% of consumption in previous
6 months for the Domestic PNG & CNG
segments
• Pricing
APM price significantly lower than market price of
imported natural gas
• Distribution
Majority of MGL’s sales are from Priority Sector
10
Priority Allocation as a % of Priority Sales
2.072.28 2.39 2.53 2.69
2.89
2.06 2.14 2.27 2.362.55 2.55
FY15 FY16 FY17 FY18 FY19 FY20
In M
MSC
MD
Priority Segment Allocation Priority Segment Sales/ Demand
101%106% 106%
107%105%
114%
72.6%
13.7%6.1% 7.6%
CNG Sales Domestic PNGSales
Commercial PNGSales
Industrial PNGSales

Infrastructure in place
MGL has established a widespread network and plans for expansion to enter into new areas and increase penetration in
existing areas
• Infrastructure Exclusivity
✓Mumbai: Prevailing
✓Adjoining Areas: Up to 2030
✓ Raigad: Up to 2040
• Tariff Flexibility
✓New operator can use MGL’s
pipeline network only on
payment of transportation tariff
Extensive Supply Network Built Over 25 Years
En
ab
lers
Asset Base
Fixed Asset of INR 25.39 Bn(1)
Capex for 2020 INR 2.9 Bn(2)
CNG Customer Base(3)
~0.77 Mn
PNG Customer Base(3)
~ 1.53 Mn
261 CNG filling stations(3)
187 - OMCs
74- MGL & its Franchisees
Pipeline and CGS(3)
Over 5700 kms of
pipeline and 5 City Gate
Stations
11Note: (1) As on March 31, 2020, Includes purchase of fixed assets, including intangible assets, capital work in progress and capital advances; (2)
Lease Contract required to be treated as asset under ‘Right to Use Asset’ of Rs.1.18 bn as per AS 116. (3) As on of November 30, 2020;

Regulatory Environment Creating Strong Barriers to Entry & Incumbent Advantage
Regulatory tailwinds are driving sector growth, given the policies laid out by the MoPNG and PNGRB
Description Implication for MGL
AuthorizationAuthorization to lay, build, operate or
expand a CGD network
• Built-in advantage for incumbent
• Authorization for Mumbai, its
adjoining areas and Raigad
ExclusivityInfrastructure exclusivity in Mumbai and
certain Adjoining Areas, and marketing
exclusivity in Raigad
• Infrastructure exclusivity prevailing in
Mumbai, 2030 in Adjoining areas and
2040 in Raigad
Gas Allocation110% allocation for CNG and domestic
PNG requirements
• Ensured allocation for priority sectors
• Revenue mix for MGL
• Limited LNG requirement
Price DeterminationPricing benchmarked to market price of
alternative fuels
Ability to manage margins and pass on
cost increases to customers
Accelerated BiddingPNGRB/GOI agenda to expand CGDs
across India
Opportunities for expand to MGL in
another GAs
12

MGL Growth Strategy
Seek Growth
Opportunities
Continue Cost-
Effective and
Reliable Sourcing
Arrangement
Increase
penetration in
existing markets
Further develop
infrastructure
• Innovative modes of
gas supply planned to
augment growth
• New applications and
technologies for CNG
• PNGRB/GOI agenda to
expand CGDs across
India
• Inorganic CGD
expansion
• Monitor cost of natural
gas and endeavor to
source natural gas in
the most cost effective
manner
• Continue with
commercially viable
sourcing arrangements
• MoPNG allocation
policy and pricing
guidelines for domestic
gas
• Term and spot
contracts for
commercial and
industrial sourcing
• Increasing population
expected to increase
demand for
commercial and
domestic natural gas
• Increase reach to new
customers for CNG and
PNG – additional
growth opportunities
in the Raigad district
• Government’s plan on
removing LPG
subsidies combined
with savings made
from using PNG are
expected to further
increase demand for
PNG
• Invest in infrastructure
to cater to MGL’s larger
customer base and
improve the quality of
services
• Incur substantial
capital expenditure to
expand operations
• Add over 1000 kms of
steel and PE pipeline
and 150 CNG filling
stations during the
next five years, in areas
of operations
13

14
Innovative Modes of Gas Supply
Hub & Spoke Method for demand centers located away from pipelines
(Virtual pipeline mode)✓
✓
LNG and LCNG fueling stations along Highways✓
CNG-in-a-box / Pole mounted dispensing to optimize CNG station forecourt space✓
Hub & Spoke model
Small LNG cylinders
LCNG fueling stations
Mother CNG stations/ LCV PRS FLAME IN KITCHEN
CGS (Supply Point) (Delivery Point)
Virtual mode of gas supply
Supply of LNG through small cryogenic cylinders

MGL Shareholders
GAIL (India) Ltd.
Government of Maharashtra
• India’s largest natural gas company
with a market share of over 80%
• Possesses transmission network of
~11,000 kms of natural gas pipeline
transmission network with total
capacity of 206 MMSCMD
• Governor for the State of
Maharashtra in Western India
• Current shareholding in MGL: 10%
Shareholding Pattern as of 30th September 2020
15
FIIs / FPIs, 26%
Government, 10.0%
Mutual Fund, 7.6%
Other, 23.9%
Promoter, 32.5%

Our Experienced Management Team – As on 30th September 2019 ….
Mr. Sunil M Ranade,
Chief Financial Officer
• Over 24 years of experience at MGL
• Prior experience at Wander Ltd., Herdillia
Polymers, Goodlass Nerolac and Ashok
Organic Industries
Mr. Rajesh P Wagle,
Senior Vice President — Marketing
• Over 18 years of experience at MGL
• Prior experience at GAIL, Quantum
Information Systems Limited and Enron
India Private Limited
Mr. Srinivasan Murali,
Senior Vice President - Operations and
Maintenance
• Over 18 years of experience at MGL
• Prior experience at Bilt Chemicals, Cabot
India, Cement Corporation of India and
Indian Aluminium Company
Mr. Sanjib Datta
Managing Director (Nominee of GAIL)
• Over 33 years of experience
• Heading business development function
in GAIL Prior to joining
• Experience includes Merger & Acquisition
initiative & Steering of Globalization
efforts
Mr. Deepak Sawant
Deputy Managing Director (Nominee of
GAIL)
• Over 29 years of experience
• Experience also includes overseas
assignment in Myanmar for exploration
and production of Natural Gas
• Prior Experience with GAIL (I) Limited.
Mr. T L Sharnagat,
Vice President - Contracts & Procurement
and Chief Risk Officer
• Over 29 years of experience in Contracts
& Procurement
• Prior experience at L&T, GAIL(India)
Limited
16

…. Our Experienced Management Team – As on 30th September 2019
Mr. Chakrapani Atmakur
Vice President - Human Resources &
Corporate Communication
• Over 29 years of experience
• Prior experience at SI Group(I) Pvt Ltd,
Owens Corning (I) Ltd and M/s Indian
Petrochemicals Corporation
Mr. Gurvinder Singh,
Vice President - Projects
• Over 28 years of experience
• Prior experience at Nayara Energy Limited
(formerly Essar Oil Limited) and BPCL.
17
Mr. Manas Das
Vice President – Business Development &
Commercial
• Over 29 years of Oil and Gas Industry
experience.
• Prior experience at Value Endow
Consulting Private Limited, Kuwait
Petroleum and Gail (India) Ltd.

Financial and Operational Performance
18

Growth backed by increased customer base and coverage area
19`1. Total volume CAGR of 4.3%
2. FY 21 H1 performance was severely impacted since except in household customer category, sales volume were down due to lock down
caused by COVID 19. In December, sales level has reached 86% of pre COVID volume in February 2020.
421 470
545 609
692 751 761.2
FY 15 FY 16 FY 17 FY 18 FY 19 FY 20 FY 21-H1
CNG Customers (end users) Growth
(In ‘000s)
804 865
952 1,037
1,150 1,273 1,287
FY 15 FY 16 FY 17 FY 18 FY 19 FY 20 FY 21-H1
PNG Customers Growth(In ‘000s)
1.77 1.80 1.90 1.98 2.17 2.14
0.88
FY 15 FY 16 FY 17 FY 18 FY 19 FY 20 FY 21-H1
CNG Volume (mmscmd)5 yr. CAGR 3.9%
0.62 0.63 0.67
0.72
0.78 0.81
0.72
FY 15 FY 16 FY 17 FY 18 FY 19 FY 20 FY 21-H1
PNG Volume (mmscmd)5 yr. CAGR 5.5%

Revenue and Profitability
20
Note:1) Revenue from Operations (Net) excluding Other Income
2) Gross Profit = Sale of Natural Gas and Traded Items - Cost of Natural Gas and Traded Items + Other Operating Income
3) FY 21 H1 performance was severely impacted since except in household customer category, sales volume were down due to lock down
caused by COVID 19. In December, sales level has reached 86% of pre COVID volume in February 2020.
13.5 14.7 14.3 15.4 18.8 20.5
4.1
7.3 6.0 5.8 6.8
8.8 8.9
3.5
FY 15 FY 16 FY 17 FY 18 FY 19 FY 20 FY 21-H1
Others PNG CNG
Revenue (INR Bn)5 yr. CAGR CNG 8.7%5 yr. CAGR PNG 4.3%5 yr. CAGR Total 7.2%
8.0 8.510.2
12.013.9
15.9
4.9
FY 15 FY 16 FY 17 FY 18 FY 19 FY 20 FY 21-H1
Gross Profit (INR Bn)

Profitability
21
Note: 1) EBITDA = Revenue from Operations - Total expenses excluding Finance Costs and Depreciation and Amortization Expense. (2) Profit After Tax = Total
Revenue – Total Expenses – Tax Expense. (3) Due to Taxation Law (Amendment) Ordinance, 2019 tax rate has reduced to 25.17%. In FY 20, reduction in
opening liability of Deferred Tax of Rs.56.69 Crores and Current Tax reduction of Rs.97 Crores has been considered. (4) FY 21 H1 performance was severely
impacted since except in household customer category, sales volume were down due to lock down caused by COVID 19. In December, sales level has reached
86% of pre COVID volume in February 2020.
4.9 5.1 6.4
7.8 8.9 10.5
3.0
FY 15 FY 16 FY 17 FY 18 FY 19 FY 20 FY 21 - H1
EBITDA (INR Bn)
3.0 3.1 3.9
4.8 5.5
7.9
1.9
FY 15 FY 16 FY 17 FY 18 FY 19 FY 20 FY 21 - H1
PAT (INR Bn)
o Cautious pricing in view offorthcoming 110% allocationof domestic gas
o In 2nd half of FY 16, lowerBrent → lower Industrial &Commercial prices

Capex and Operating Cash Flows
22
The Company’s financial position provides it with flexibility to expand its network in existing markets
and expand to new markets in India
Note: (1) Includes purchase of fixed assets, including intangible assets, capital work in progress and capital
advances. (2) Net cash flow from operating activities as per the cash flow statement.
2.0 2.2
2.5 2.7
3.6
4.2
0.8
FY 15 FY 16 FY 17 FY 18 FY 19 FY 20 FY 20 -H1
4.3 4.2
5.3
6.5 6.8
9.8
2.3
FY 15 FY 16 FY 17 FY 18 FY 19 FY 20 FY 21 -H1
In 18-19, OMC tradediscount settlement ofRs 0.36 bn & higherdirect tax proportioncompared to 17-18

23
Other Financial Metrics
(1) Note: Return on Net Worth = Profit After Tax / Average Net Worth (Share Capital + Reserves and Surplus) for the current year and previous
year.
(2) EPS are not annualized for the interim period
Particulars FY 15 FY 16 FY17 FY 18 FY 19 FY 20 FY 21-H1
Avg Realization / SCM (INR) 23.8 23.2 21.5 22.4 25.7 27.3 26.1
Gross Margin / SCM (INR) 9.0 9.4 10.7 12.1 12.7 14.5 16.7
Opex / SCM (INR) 3.6 3.8 4.0 4.3 4.7 5.0 6.6
EBITDA / SCM (INR) 5.6 5.7 6.9 7.9 8.2 9.7 10.3
EBITDA Margin % 23.4% 24.7% 31.7% 34.9% 31.7% 35.4% 39.2%
Days Receivable (Days) 14.6 13.6 13.6 12.2 10.0 8.3 20.8
RONW % (1) 20.8% 18.8% 22.0% 24.3% 24.3% 29.6% 6.5%
EPS (INR) 33.7 31.5 39.8 48.4 55.3 80.33 19.2

24
Creating value for shareholders
Note: 1. Payout Ratio calculated including Dividend Distribution Tax
17.5 17.5 19.0 19.0 20.0
35.0
60.8%58.8%
56.4%
47.3%43.6% 46.0%
0.0%
10.0%
20.0%
30.0%
40.0%
50.0%
60.0%
70.0%
-
5.0
10.0
15.0
20.0
25.0
30.0
35.0
40.0
FY 15 FY 16 FY 17 FY 18 FY 19 FY 20
DPS (INR) Payout Ratio %

Appendix
25

Board of Directors – As on 30th September 2020
26
Mr. Raj Kishore Tewari, Independent Non-executive Director
• On the board since March 2015
• Previously served as the Chairman of the Central Board of Direct Taxes in the Ministry of Finance, Govt. of India
• M.Sc. (Fiscal Studies) from the University of Bath, UK, M.Sc. (Physics) from the University of Lucknow and Bachelor’s degreein Law from the University of Mumbai
Mr. Sanjib Datta, Managing Director (Nominee of GAIL)
▪ Over 33 years of experience
▪ Heading business development function in GAIL Prior to joining
▪ Holds a Bachelor's degree in Electrical Engineering from Jadavpur University, Kolkata.
Mr. Deepak Sawant, Deputy Managing Director (Nominee of GAIL)
▪ Over 29 years of experience
▪ Handling 6 Geographical areas directly including Bengaluru and 6 Geographical areas with JV partners, in GAIL Prior tojoining
▪ Holds a Mechanical Engineer degree
• On the Board effective from May 06, 2020• Chairman and Managing Director, GAIL (India) Limited• Mechanical Engineering Graduate; MBA in Operations Management .
Mr. Manoj Jain, , Chairman

Board of Directors – As on 30th September 2019
27
• On the Board effective from September 9, 2019
• Prior to taking over the charge of Additional Chief Secretary, GOM, additionally held the post of Principal Secretary of Revenue, Forest, Rural Development. He was also the CEO of Zilla Parishad, Nagpur and District Collector & Magistrate, Latur, Maharashtra.
• B.A. (Hons.) in English and M.A. in English from University of Mumbai. He has also completed his M.Sc. in Admin Sciences & Development Problems from York University, UK.
Mr. Syed S. Hussain, , Independent Non-executive Director
Mr. Premesh Kumar Jain, Independent Non-executive Director
• On the Board effective from April 09, 2018.
• Over 35 years of experience in Oil & Gas sector in areas of FX Risk Mgmt, Budgeting & Corporate Accounts
• Former Director (Finance) of GAIL for more than 6 years
• Chartered Accountant and MBA (University of Hull, UK)

Statement of Financial Results for the six months ended September 30, 2020INR Mn
28
Sr. No.
ParticularsFor the six months ended
30th September 2020For the six months ended
30th September 2019I Revenue from Contracts with Customers 8,264.14 16,927.44 II Other Income 429.54 433.20 III Total Income (I + II) 8,693.69 17,360.64 IV Expenses :
Cost of Natural Gas and Traded Items 2,758.46 7,267.55 Changes in Inventories 0.44 (0.43)Excise Duty on Sale of Compressed Natural Gas 579.43 1,516.64 Employee Benefits Expense 494.48 435.26 Finance Costs 35.56 28.25 Depreciation and Amortisation Expenses 847.17 762.86 Other Expenses 1,420.61 2,206.00 Total Expenses 6,136.15 12,216.12
V Profit Before Tax for the year (III- IV) 2,557.54 5,144.53 VI Income Tax Expense :
(i) Current Tax 630.71 1,223.93 (ii) Deferred Tax 30.90 (488.04)Total Income Tax Expense (i+ii) 661.61 735.90
VII Profit After Tax for the year (V - VI) 1,895.93 4,408.63 VIII Other Comprehensive Income
Items that will not be reclassified to profit or loss :Gains/(Losses) on Remeasurements of the Defined Benefit Plans
(11.45) (24.82)
Income tax relating to items that will not be reclassified to profit or loss
2.88 12.44
Total Other Comprehensive Income (8.57) (12.38)IX Total Comprehensive Income for the year (VII + VIII) 1,887.36 4,396.25

Statement of Assets and Liabilities as at September 30, 2020 INR Mn
29
ParticularsAs at As at
30th September 2020 31st March 2020ASSETSI. Non-current Assets
(a) Property, Plant and Equipment 19,015.88 19,262.19 (b) Capital Work-in-Progress 4,931.76 4,865.33 (c) Intangible Assets 56.14 46.35 (d) Right to Use Assets 1,132.51 1,183.37 (e) Financial Assets
(i) Trade receivables 0.14 0.23 (ii) Security Deposits 284.09 279.89 (iii) Other Financial Assets 0.97 0.38
(f) Income Tax Assets (net) 587.15 409.28 (g) Other Non-current Assets 170.58 181.24 Total Non-current Assets (I) 26,179.22 26,228.27
II. Current assetsInventories 213.58 185.68 (b) Financial Assets
(i)Investments 8,659.18 11,214.68 (ii) Trade Receivables 1,427.62 684.30 (iii) Cash and Cash Equivalents 124.76 153.76 (iv) Bank balances other than (iii) above 6,319.97 2,140.97 (v) Security Deposits 38.51 44.14 (vi) Other Financial Assets 485.49 501.02
(c) Other current assets 100.45 132.19 Total Current assets (II) 17,369.56 15,056.74Total Assets (I+II) 43,548.78 41,285.01

Statement of Assets and Liabilities as at September 30, 2020 (Contd….)INR Mn
30
ParticularsAs at As at
30th September 2020 31st March 2020EQUITY AND LIABILITIESI. Equity
(a) Equity Share Capital 987.78 987.78 (b) Other Equity 27,907.43 28,538.90 Total Equity (I) 28,895.21 29,526.68
II. LiabilitiesA. Non-current Liabilities
(a) Financial Liabilities(i) Lease Liabilities 449.58 490.01
(ii) Security Deposits 5.24 5.57
(b) Provisions 230.47 184.10
(c) Deferred Tax Liabilities (net) 1,637.09 1,606.66
Total Non-current Liabilities (A) 2,322.39 2,286.34
B. Current Liabilities(a) Current Financial Liabilities
(i) Trade Payables 1,395.63 1,317.75
(ii) Security Deposits 5,959.16 5,817.48
(iii) Lease Liabilities 181.51 176.07
(iii) Other Financial Liabilities 3,806.54 1,590.94
(b) Provisions 109.20 79.29
(c) Income Tax Liabilities (net) 29.69 29.69
(e) Other Current Liabilities 849.46 460.78
Total Current Liabilities (B) 14,653.57 11,758.34
Total Liabilities (II = A+B) 14,653.57 11,758.34
Total - Equity and Liabilities (I+II) 43,548.78 41,285.01

Statement of Assets and LiabilitiesINR Mn
ParticularsAs at
30th Sept, 2020As at
31st March, 2020As at
31st March, 2019As at
31st March, 2018As at
31st March, 2017ASSETS
I. Non-current Assets
(a) Property, Plant and Equipment 19,015.88 19,262.19 17,587.53 15,280.59 13,003.09
(b) Capital Work-in-Progress 4,931.76 4,865.33 3,696.87 3,566.23 4,115.28
(c) Intangible Assets 56.14 46.35 46.61 38.91 44.43
(d) Right to Use Assets 1,132.51 1,183.37 - - -
(d) Financial Assets
(i) Trade receivables 0.14 0.23 0.63 2.05 3.66
(ii) Security Deposits 284.09 279.89 192.14 177.5 217.2
(iii) Other Financial Assets 0.97 0.38 3.58 251.65 4.29
(e) Income Tax Assets (net) 587.15 409.28 336.14 239.93 79.93
(f) Other Non-current Assets 170.58 181.24 805.77 790.51 815.34
Total Non-current Assets (I) 26,179.22 26,228.27 22,669.26 20,347.37 18,283.22
II. Current assets
(a) Inventories 213.58 185.68 191.18 239.99 237.63
(b) Financial Assets
(i) Investments 8,659.18 11,214.68 6,540.17 6,876.84 4,666.66
(ii) Trade Receivables 1,427.62 684.30 995.31 884.69 945.44
(iii) Cash and Cash Equivalents 124.76 153.76 265.31 150.15 73.89
(iv) Bank balances other than (iii) above 6,319.97 2,140.97 2,723.09 768.63 1407.19
(v) Security Deposits 38.51 44.14 85.96 155.22 121.91
(vi) Other Financial Assets 485.49 501.02 774.93 507.99 286.87
(c) Other current assets 100.45 132.19 165.03 171.48 219.69
Total Current assets (II) 17,369.56 15,056.74 11,740.99 9,754.99 7,959.28
Total Assets (I+II) 43,548.78 41,285.01 34,410.25 30,102.36 26,242.50

Statement of Assets and Liabilities (Contd….)INR Mn
ParticularsAs at
30th Sept, 2020As at
31st March, 2020As at
31st March, 2019As at
31st March, 2018As at
31st March, 2017EQUITY AND LIABILITIESI. Equity
(a) Equity Share Capital 987.78 987.78 987.78 987.78 987.78
(b) Other Equity 27,907.43 28538.90 23,000.92 19,965.69 17,412.60
Total Equity (I) 28,895.21 23,988.70 23,988.70 20,953.47 18,400.38
II. Liabilities
A. Non-current Liabilities
(a) Financial Liabilities
(i) Borrowings - - - 11.95 27.00
(ii) Lease Liabilities 449.58 490.01 - - -
(ii) Security Deposits 5.24 5.57 18.09 8.59 1.96
(b) Provisions 230.47 184.10 143.11 147.52 140.06
(c) Deferred Tax Liabilities (net) 1,637.09 1,606.66 2048.39 1,748.29 1,376.27
Total Non-current Liabilities (A) 2,322.39 2,286.34 2,209.59 1,916.35 1,545.29
B. Current Liabilities
(a) Current Financial Liabilities 1,395.63 (i) Trade Payables 5,959.16 1,317.75 1,524.49 1,100.27 1,489.60 (ii) Security Deposits 181.51 5,817.48 5,179.17 4,431.54 3,878.16 (iii) Lease Liabilities 3,806.54 176.07 - - -(iv) Other Financial Liabilities 109.20 1,590.94 994.46 1,256.86 383.68
(b) Provisions 29.69 79.29 68.84 51.43 147.67 (c) Income Tax Liabilities (net) 849.46 29.69 8.08 8.08 11.64 (d) Other Current Liabilities 14,653.57 460.78 436.93 384.36 389.08 Total Current Liabilities (B) 14,653.57 9,472.00 8,211.96 7,232.54 6,296.83 Total Liabilities (II = A+B) 43,548.78 11,758.34 10,421.55 9,148.89 7,842.12

Statement of Profit and LossINR Mn
33
Sr. No.
ParticularsFor the period ended
30th September 2020
31st March 2020
31st March 2019
31st March 2018
31st March 2017
I Revenue from Contracts with Customers 8,264.14 32,644.86 30,567.93 24,529.17 22,390.71
II Other Income 429.54 989.53 777.13 576.81 526.57
III Total Income (I + II) 8,693.69 33,634.39 31,345.06 25,105.98 22,917.28
IV Expenses :
Cost of Natural Gas and Traded Items 2,758.46 13,794.90 13,992.64 10,291.62 10,183.62
Changes in Inventories 0.44 0.50 (1.04) (0.47) 0.40
Excise Duty on Sale of Compressed Natural Gas 579.43 2,923.58 2,657.20 2,199.10 2,050.99
Employee Benefits Expense 494.48 806.34 708.79 670.17 600.19
Finance Costs 35.56 65.25 3.23 0.9 10.21
Depreciation and Amortisation Expenses 847.17 1,617.26 1,259.31 1,111.85 951.32
Other Expenses 1,420.61 4,591.19 4,355.81 3,567.67 3,113.95
Total Expenses 6,136.15 23,799.02 22,975.94 17,840.84 16,910.68
V Profit Before Tax for the year (III- IV) 2,557.54 9,835.37 8,369.12 7,265.14 6,006.60
VI Income Tax Expense :
(i) Current Tax 630.71 2,331.01 2,613.97 2,117.58 1,894.72
(ii) Deferred Tax 30.90 (430.74) 291.26 368.83 177.61
Total Income Tax Expense (i+ii) 661.61 1,900.27 2,905.23 2,486.41 2,072.33
VII Profit After Tax for the year (V - VI) 1,895.93 7,935.10 5,463.89 4,778.73 3,934.27
VIII Other Comprehensive Income
Items that will not be reclassified to profit or loss :Gains/(Losses) on Remeasurements of the Defined Benefit Plans
(11.45) (28.97) 19.25 15.9 (10.15)
Income tax relating to items that will not be reclassified to profit or loss
2.88 13.49 (6.73) (5.63) 0.35
Total Other Comprehensive Income (8.57) (15.48) 12.52 10.27 (6.64)IX Total Comprehensive Income for the year (VII + VIII) 1,887.36 7,919.61 5,476.41 4,789.00 3,927.63

INR MnStatement of Cash Flows
34
PARTICULARSFor the period ended
30.09.2020 31.03.2020 31.03.2019 31.03.2018 31.03.2017I. CASH FLOW FROM OPERATING ACTIVITIES
Profit before tax as per Statement of Profit and Loss 2,557.54 9,835.37 8,369.12 7,265.13 6,006.60 Adjustments for:
Depreciation and Amortisation Expense 847.17 1,617.26 1,259.31 1,111.85 951.32 Finance Costs 35.56 65.25 3.23 0.90 10.21 Dividend Income on Investments (9.82) (156.84) (195.26) (188.98) (135.18)Interest Income (173.17) (329.35) (267.49) (144.93) (142.37)Gain on sale of Investments (419.45) (225.20) (28.16) (44.19) (69.50)Unrealised Gain on Investments 227.21 (88.68) (117.89) (62.92) (59.15)Writeoff, Disposal of Property, Plant and Equipment (Net) 35.53 (8.88) 42.17 24.92 10.10 Allowance for inventory obsolescence 1.43 22.91 54.98 - -Expected credit loss allowance and write off on Financial Assets
7.51 100.14 75.98 15.28 20.91
Net unrealised foreign exchange (gain)/ loss (0.23) 0.69 (7.45) 5.99 (9.75)Operating Profit Before Working Capital Changes 3,109.27 10,832.67 9,188.53 7,983.06 6,583.19 Movements in working capital :
(Increase)/Decrease in Inventories (27.90) 9.94 (3.34) (2.35) (57.37)(Increase)/Decrease in Trade Receivables (746.01) 294.01 (115.20) 50.01 (42.48)(Increase)/Decrease in Security Deposits (2.48) (54.21) (6.60) (6.07) (72.18)(Increase)/Decrease in Other Financial Assets 14.72 200.37 (275.65) (91.53) (75.93)(Increase)/Decrease in Other Non Current Assets 10.68 30.04 (0.99) 25.85 (371.03)(Increase)/Decrease in Other Current Assets 31.74 32.84 (11.08) 44.48 (36.79)Increase/(Decrease) in Other Financial Liabilities 64.33 386.75 (494.99) 344.61 477.25 Increase/(Decrease) in Provisions 64.84 22.47 32.25 8.27 33.60 Increase/(Decrease) in Trade Payables 78.11 (207.43) 431.67 (106.62) 29.25 Increase/(Decrease) in Security Deposits (Liability) 137.74 634.96 757.33 559.93 684.78 Increase/(Decrease) in Other Current Liabilities 388.68 23.86 52.56 (4.72) 32.25
14.44 1,373.61 365.96 821.85 601.35 Cash Generated from Operations 3,123.72 12,206.28 9,554.49 8,804.90 7,184.54 Income Taxes Paid (Net off refund) (806.17) (2,380.05) (2,708.07) (2,283.58) (1,861.87)
Net Cash from Operating Activities 2,317.55 9,826.23 6,846.42 6,521.32 5,322.67

INR MnStatement of Cash Flows
35
PARTICULARSFor the period ended
30.09.2020 31.03.2020 31.03.2019 31.03.2018 31.03.2017II. CASH FLOW FROM INVESTING ACTIVITIES
Payments for Property, Plant and Equipment/ Intangibles/ Right to Use Assets
(848.06) (4,348.89) (3,627.33) (2,690.29) (2,545.21)
Sale of Property, Plant and Equipment/ Intangibles/ Right to Use Assets
0.12 116.70 2.66 1.66 0.55
Payments for purchase of Investments (12,199.79) (45,862.51) (40,496.17) (32,420.48) (25,616.04)
Proceeds from sale of Investments 14,954.82 41,546.48 40,969.66 30,378.19 25,012.03 Movements in Bank Deposits not considered as Cash and Cash Equivalents
(4,213.65) 551.33 (1,611.95) 248.44 248.37
Interest Received 199.93 317.80 182.23 106.85 132.04
Dividend Received on Investments 9.82 156.84 195.26 188.98 135.18
Net Cash (used in) Investing Activities (2,096.79) (7,522.24) (4,385.63) (4,186.65) (2,633.09)
III. CASH FLOW FROM FINANCING ACTIVITIES
Repayment of Borrowings - - (11.95) (15.05) (18.32)Payment of Lease Liability (94.28) (157.88) - - -Dividend Paid (Includes Dividend Distribution Tax) (123.53) (2,183.25) (2,330.24) (2,235.90) (2,816.16)Interest on Lease Liability (30.18) (57.97) - - -Interest Paid (1.76) (16.45) (3.44) (7.45) (3.12)Net Cash used in Financing Activities (249.76) (2,415.54) (2,345.63) (2,258.41) (2,837.60)
Net Increase/(Decrease) in Cash and Cash Equivalents (I+II+III)
(29.01) (111.55) 115.16 76.26 (148.02)
Cash and Cash Equivalents at the beginning of the year 153.76 265.31 150.15 73.89 221.91 Cash and Cash Equivalents at the end of the year 124.75 153.76 265.31 150.15 73.89

Safe Harbor
• This presentation may contain statements which reflect the management’s current views and estimates and could be construed as forward looking statements.
• The future involves certain risks and uncertainties that could cause actual results to differ materially from the current views being expressed.
• Potential risks and uncertainties include such factors as general economic conditions, competitive product and pricing pressures and regulatory developments.
36
MGL House, G-33, Bandra Kurla Complex, Bandra (E)
Mumbai – 400 051
T +91 22 6678 5000 F +91 22 6540093/1046
https://www.mahanagargas.com
CIN : L40200MH1995PLC088133
Thank You…….
37