presentation to equity investors - alpha bank · pdf fileseptember greece has new government...
TRANSCRIPT

Alpha Bank
Presentation to Equity Investors
October 2015

9M 2013 Results FY 2013 Results 2 Investor Relations Presentation
Disclaimer
This presentation contains certain forward-looking statements. These forward-looking statements involve risks and uncertainties that could significantly affect expected results and are based on certain key assumptions. Many factors could cause actual results to differ materially from those projected or implied in any forward-looking statements. Due to these uncertainties and risks, readers are cautioned not to place undue reliance on such forward-looking statements, which speak only as of the date of this announcement. Alpha Bank disclaims any obligation to update any forward-looking statements contained herein, except as required pursuant to applicable law. This presentation is not an offer of securities for sale in the United States, Australia, Canada, South Africa, Japan or in any jurisdiction in which such offer is unlawful. Securities may not be offered or sold in the United States absent registration under the US Securities Act of 1933 (“Securities Act”) or an exemption from registration. Subject to certain exceptions, the securities referred to herein may not be offered or sold in Australia, Canada, South Africa or Japan or to, or for the account or benefit of, any national, resident or citizen of Australia, Canada, South Africa or Japan. The securities referred to herein have not been and will not be registered under the Securities Act or under the applicable securities laws of Australia, Canada, South Africa or Japan. This presentation is only addressed to and is only directed at persons in member states of the European Economic Area (the “EEA”) who are “qualified investors” within the meaning of Article 2.1(e) of the Prospectus Directive (Directive 2003/71/EC), as amended by Directive 2010/73/EU together with any applicable implementing measures in any member state of the EEA. In addition, in the United Kingdom, this presentation is directed solely at persons who (i) are investment professionals falling within Article 19(5) of the Financial Services and Markets Act 2000 (Financial Promotion) Order 2005 (the “Order”) or (ii) are high net worth entities and other persons to whom it may lawfully be communicated falling within Article 49(2)(a) to (d) of the Order (all such persons together being referred to as "relevant persons"). This presentation is addressed only to, and directed only at, relevant persons and qualified investors and must not be acted on or relied on (i) in the United Kingdom, by persons who are not relevant persons or (ii) in any member state of the EEA other than the United Kingdom, by qualified investors. Any investment or investment activity to which this presentation relates is available only to, and will be engaged in only with, in the United Kingdom, relevant persons, and in any member state of the EEA other than the United Kingdom, qualified investors. This presentation is not a prospectus for the purposes of applicable measures implementing EU Directive 2003/71/EC (such Directive, together with any applicable implementing measures in the relevant home member state under such Directive) and as such does not constitute an offer to sell or the solicitation of an offer to purchase securities. This presentation and the information contained herein are not intended and shall not constitute a public offer or advertisement of securities in Greece or an invitation to make offers to purchase any securities in Greece within the meaning of Art. 2 (1) (d) of Greek Law 3401/2005. Any investment decision should be based exclusively on the information contained in the prospectus prepared in connection with the offering and the admission of the Company’s shares to trading on the Athens Exchange as the sole legally binding and approved document by the Hellenic Capital Market Commission containing information on the Company and the offering of its shares in Greece.

9M 2013 Results FY 2013 Results 3 Investor Relations Presentation
Table of Contents
Pages
I. Introduction 4
II. Recent development update 7
III. Path to normalisation 17
Appendix I: Q1 2015 Results 31
Appendix II: Stress Tests Macro Assumptions 43

9M 2013 Results FY 2013 Results 4 Investor Relations Presentation
I. Introduction

9M 2013 Results FY 2013 Results 5 Investor Relations Presentation
Alpha Bank - A conservative, predominantly Greek focused bank
Balance sheet (Mar-15, € billion) Greece SE Europe Group¹
Net Loans 41.4 8.0 49.7
Deposits 30.3 5.0 36.0
Tangible Book Value ─ ─ 7.0
Loans / Deposits 137% 161% 138%
NPL ratio 35% 31% 34%
Coverage ratio 61% 72% 63%
CET1 ratio (Phased-in) ─ ─ 13.1%
CET1 ratio (Fully Loaded) ─ ─ 12.6%
Income statement (Q1’15, € million) Greece SE Europe Group
Net Interest Income 389.0 87.8 481.5
Net fee and Commission Income 74.8 10.1 86.3
Income from Financial Operations 42.9 (17.3) 26.2
Other Income 9.2 3.1 12.3
Operating Income 515.8 83.7 606.4
Operating Expenses (219.8) (63.6) (286.8)
Pre-Provision income 296.0 20.1 319.6
Impairment Losses (372.8) (53.5) (426.3)
Profit / (Loss) Before Tax (76.8) (33.4) (106.6)
Branches and employees (Mar-15) Greece SE Europe Total Group
Branches 627 396 1,024
Employees 9,625 5,457 15,149
Second largest bank with a 22% loan market share in a highly concentrated Greek banking sector
High capitalisation levels and well provided, predominantly corporate focused portfolio
SE Europe operations with limited impact on Group’s liquidity position and profitability
Hellenic Financial Stability Fund remains the largest shareholder with a 66.24% stake
33%
12% 55%
Gross loan split (Mar-15)
Greece: €52.6bn Group: €63.1bn
33%
12% 55%
Mortgage Other consumer Business
¹ Including UK operations

9M 2013 Results FY 2013 Results 6 Investor Relations Presentation
Alpha Bank exhibits best-in-class performance amongst its peers based on a number of key metrics
4.9% 4.4%
5.7%
4.2%
2.6% 2.0% 2.3%
1.7%
Peer 1 Peer 2 Peer 3
Op.income / average net loans PPI / average net loans
Alpha Bank compares well to peers based on PPI generation…
%
47.3% 53.5% 59.5% 58.5%
12.6% 10.2% 11.1%
8.7%
14.1%
10.1% 12.2%
9.8%
Peer 1 Peer 2 Peer 3
FL CET1 ratio TBV / net loans
… and capital position
… its prudent approach to provisioning…
39.7% 79.6% 55.6% 53.6%
DTC / FL CET1
110% 92% 102% 102%
Repaid prefs?
% RWA / Net loans
% Cost / income
¹ Defined as NPL net of total provisions
63%
56%
61%
56%
Peer 1 Peer 2 Peer 3
33.8% 34.0% 24.3% 38.9%
%
115% 199% 125% 192%
% NPL coverage NPL ratio Net NPLs¹ / FL CET1
Strong operating income generation and efficient cost control allow Alpha Bank to deliver the highest PPI margin amongst its peers
The most prudent approach manifested by the highest NPL coverage in the sector as well as the lowest ratio of NPLs to CET1 capital
The highest capitalisation levels and the highest quality of capital as demonstrated by the amount of DTC and RWA/Net loans ratio

9M 2013 Results FY 2013 Results 7 Investor Relations Presentation
II. Recent development update

9M 2013 Results FY 2013 Results 8 Investor Relations Presentation
Key highlights of recent events in Greece
Greek economy exhibited positive real GDP growth in Q1’15 and Q2’15 despite prevailing political uncertainty on the back of growing private and public consumption and tourism
3rd bailout programme for Greece agreed between Greece and the EU accompanied by a 3rd Economic Adjustment Programme of a total amount up to €86bn
Since Monday, 21st September Greece has new government with a fresh mandate to implement the economic adjustment program
Macroeconomic and political update
Capital controls have slowed down deposit outflows combined with steep lowering of deposit margins
Deposit outflows only in ¼ driven by deposits transfer abroad Comprehensive Assessment (CA) by the ECB’s Single Supervisory Mechanism has already
begun and results are expected during the 23-25 October weekend
Banking sector
In accordance with the new Stability Program, Greece has amended its legislative framework by adopting the Code of Civil Procedure as well as changes in corporate and household insolvency laws. Also, it has introduced the Bank Recovery and Resolution Directive.
Changes in insolvency law and judicial framework will help opening NPL servicing market to facilitate clean-up of banking sector loan books
Legislative changes
Non-performing loans in the Greek banking sector still remain at elevated levels Prevailing macroeconomic pressure might lead to further increase in NPL and NPE levels in short
term although early indications appear encouraging Recently signed MoU addresses asset quality issues and has set ground for addressing NPL
issues in medium term
Asset quality picture

9M 2013 Results FY 2013 Results 9 Investor Relations Presentation
0%
5%
10%
15%
20%
25%
30%
0 200 400 600 800
1,000 1,200 1,400 1,600 1,800
Greek economic contraction has reversed and forecasts suggest a U-shaped recovery
(4.4%) (5.3%)
(8.9%)
(6.6%)
(4.0%)
0.7%
(1.8%) (0.9%)
2.5%
-10%
-8%
-6%
-4%
-2%
0%
2%
Source: ELSTAT, Alpha Bank Economic Research Division forecasts * Seasonally adjusted, y-o-y % change
Greek economic activity is expected to drive back into a negative territory in 2015, triggered by capital controls imposition and implementation of the new fiscal austerity measures including new and increased taxes
Greece exhibited the most significant reductions in the Unit Labor Cost (ULC) among all countries in the EU in recent years, a clear reflection of the magnitude of the labor market reforms
The internal devaluation1 of 18.6% in Q4 2014 vs. Q4 2009, led to a complete reversal of competitiveness loss from 2000 until 2009
In mid-term, growth will be supported by more than €70bn from EU structural funds and the new bailout program as well as economic and political reforms required by Troika
Unemployment continued the decline started in 2014 and further dropped to 25.2% in June vs. the average level of c. 27.5% in 2013
However, economic sentiment deteriorated sharply as of July 2015 after announcement of referendum and imposition of capital controls, which may result in pick-up in unemployment rate
Real GDP: A U-shaped Recovery
Competitiveness (REER)¹
2005=100 Improvement (-) vs. 2009
85
90
95
100
105
110
115
2005
2006
2007
2008
2009
2010
2011
2012
2013
2014
2015
Source: European Commission, Price and cost competitiveness 1 Measured as the devaluation of the relative (against 35 trading partner countries) Unit Labor Cost based Real Effective Exchange Rate (REER) of the Euro
Unemployment rate Total funding available to Greece in the mid-term
Italy (2.5%) Germany (1.4%)
Spain (12.7%)
Portugal (9.3%)
Greece (18.6%)
35.0
Up to 25.0
10.7
EU Budget and ESPA Bank recapitalisation
State arrears clearance and other
(€ billion)
3rd Programme
Source: ELSTAT, Alpha Bank Economic Research Division forecasts * Non seasonally adjusted
Unemployment rate
1,400 In thousands
Less than 12 months
First time Unemployed
Over 12 months
Source: European Commission
Banking sector Legislative changes Macro & political update Asset quality

9M 2013 Results FY 2013 Results 10 Investor Relations Presentation
Q2 performance has shown certain resilience and could support a more benign environment
-10%
-8%
-6%
-4%
-2%
0%
2%
I II III IV I II III IV I II III IV I II III IV I II III IV I II III IV I II
2009 2010 2011 2012 2013 2014 2015
qoq % change
yoy % change
Source: ELSTAT
Surprisingly Positive Q2 2015: Real GDP growth (seasonally adjusted)
Banking sector Legislative changes Macro & political update Asset quality
Source: ELSTAT
GDP components: % yoy changes (s.a.)
Higher than expected real GDP growth at 1.6% yoy in Q2 2015 despite the escalating uncertainty signals a GDP decline of no more than 2% in 2015
Private consumption was the main driver of GDP growth in the second quarter as it increased by 2.5% yoy, against 0.8% yoy increase in Q2 2014 Household disposable income increase, the key driver behind the increase
in private consumption was predominantly driven by lower oil prices (-43.7% yoy in Q2) and deflation (2.1%)
Private consumption was also supported by Improvements in employment which increased by 2.4% yoy and unemployment rate which fell to 24.6% in Q2, compared to 26.6% in the second quarter of 2014
Partially on the back of the banking crisis, exports of goods and services declined by 1.8% yoy in the second quarter, for the first time after five consecutive quarters of gradual increase Also investment fell further, in tandem with the declining business
sentiment indicator Exports of services increased by 1.6% yoy (s.a.) in Q2 2015 indicating that
tourism remains the driving force of economic activity Net exports contributed a positive +0.6% to GDP in the second quarter
Lower oil prices driving higher disposable income
3.6 2.7
Q2'14 Q2'15
Oil imports (€bn)
(25.0%)
Average oil price fell by 43.7% yoy
Oil imports accounted for 24.3% of total imports in Q2
2015)
1.3
(2.5)
19.3
9.9
17.5
1.4 1.7
(1.2)
13.9
1.1
9.7
0.6 2.5 2.3
(3.3) (1.8) (3.5)
1.6
Private Consumption
Public Consumption
Investment Exports Imports Real GDP
Q4 2014 Q1 2015 Q2 2015
Source: Bank of Greece
9M 2013 Results FY 2013 Results 11 Investor Relations Presentation
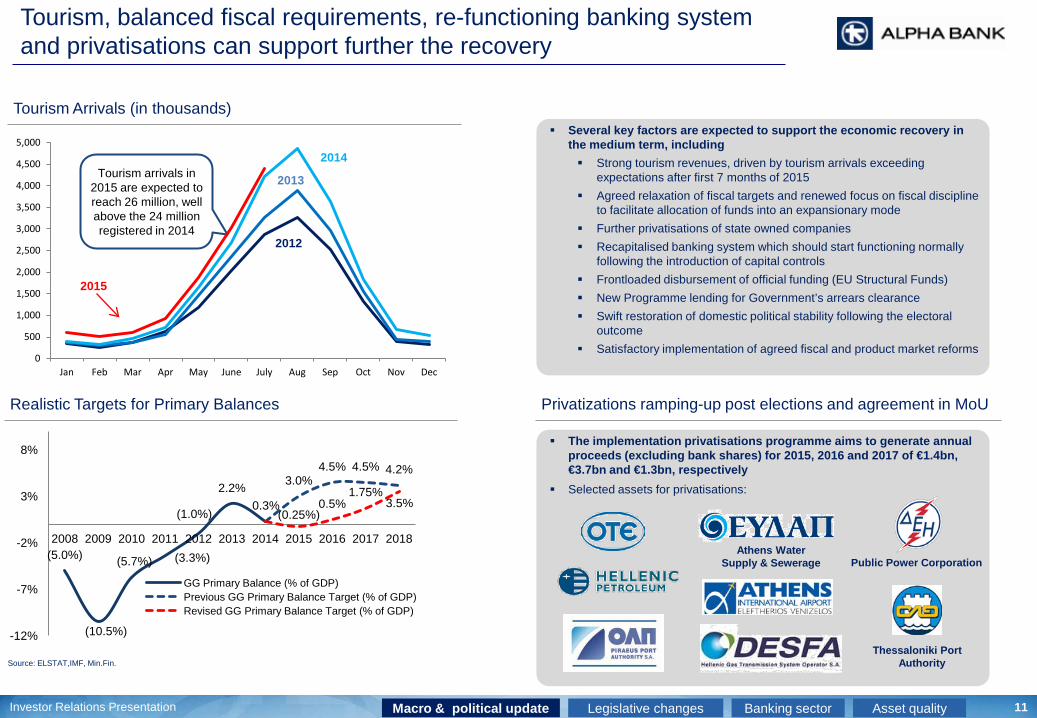
Tourism, balanced fiscal requirements, re-functioning banking system and privatisations can support further the recovery
Tourism Arrivals (in thousands)
Banking sector Legislative changes Macro & political update Asset quality
Source: ELSTAT,IMF, Min.Fin.
(5.0%)
(10.5%)
(5.7%) (3.3%)
(1.0%)
2.2% 0.3%
3.0% 4.5% 4.5% 4.2%
(0.25%) 0.5%
1.75% 3.5%
-12%
-7%
-2%
3%
8%
2008 2009 2010 2011 2012 2013 2014 2015 2016 2017 2018
GG Primary Balance (% of GDP) Previous GG Primary Balance Target (% of GDP) Revised GG Primary Balance Target (% of GDP)
Realistic Targets for Primary Balances
Several key factors are expected to support the economic recovery in the medium term, including Strong tourism revenues, driven by tourism arrivals exceeding
expectations after first 7 months of 2015 Agreed relaxation of fiscal targets and renewed focus on fiscal discipline
to facilitate allocation of funds into an expansionary mode Further privatisations of state owned companies Recapitalised banking system which should start functioning normally
following the introduction of capital controls Frontloaded disbursement of official funding (EU Structural Funds) New Programme lending for Government’s arrears clearance Swift restoration of domestic political stability following the electoral
outcome Satisfactory implementation of agreed fiscal and product market reforms
Privatizations ramping-up post elections and agreement in MoU
Tourism arrivals in 2015 are expected to reach 26 million, well above the 24 million registered in 2014
0
500
1,000
1,500
2,000
2,500
3,000
3,500
4,000
4,500
5,000
Jan Feb Mar Apr May June July Aug Sep Oct Nov Dec
2015
2014
2013
2012
The implementation privatisations programme aims to generate annual proceeds (excluding bank shares) for 2015, 2016 and 2017 of €1.4bn, €3.7bn and €1.3bn, respectively
Selected assets for privatisations:
Public Power Corporation
Thessaloniki Port Authority
Athens Water Supply & Sewerage
9M 2013 Results FY 2013 Results 12 Investor Relations Presentation
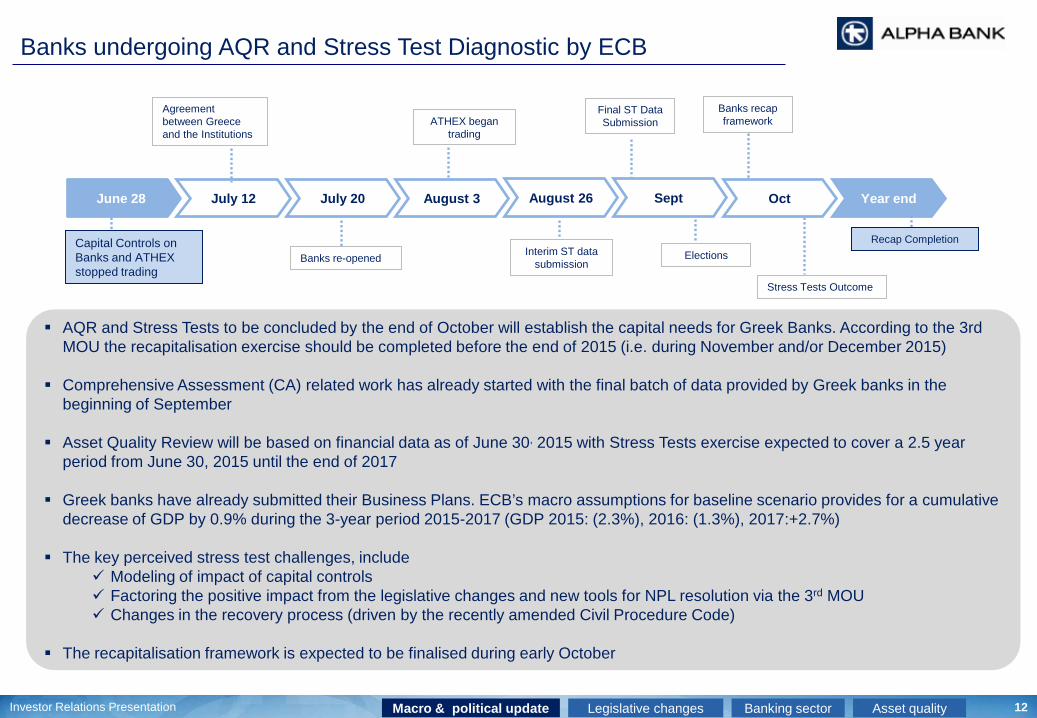
Banks undergoing AQR and Stress Test Diagnostic by ECB
July 12 Oct Year end June 28 July 20 August 3
Recap Completion Capital Controls on Banks and ATHEX stopped trading
Banks recap framework
Stress Tests Outcome
Agreement between Greece and the Institutions
Banks re-opened
ATHEX began trading
Sept
Final ST Data Submission
August 26
Interim ST data submission
Elections
AQR and Stress Tests to be concluded by the end of October will establish the capital needs for Greek Banks. According to the 3rd MOU the recapitalisation exercise should be completed before the end of 2015 (i.e. during November and/or December 2015)
Comprehensive Assessment (CA) related work has already started with the final batch of data provided by Greek banks in the beginning of September
Asset Quality Review will be based on financial data as of June 30, 2015 with Stress Tests exercise expected to cover a 2.5 year period from June 30, 2015 until the end of 2017
Greek banks have already submitted their Business Plans. ECB’s macro assumptions for baseline scenario provides for a cumulative decrease of GDP by 0.9% during the 3-year period 2015-2017 (GDP 2015: (2.3%), 2016: (1.3%), 2017:+2.7%)
The key perceived stress test challenges, include Modeling of impact of capital controls Factoring the positive impact from the legislative changes and new tools for NPL resolution via the 3rd MOU Changes in the recovery process (driven by the recently amended Civil Procedure Code)
The recapitalisation framework is expected to be finalised during early October
Banking sector Legislative changes Macro & political update Asset quality
9M 2013 Results FY 2013 Results 13 Investor Relations Presentation
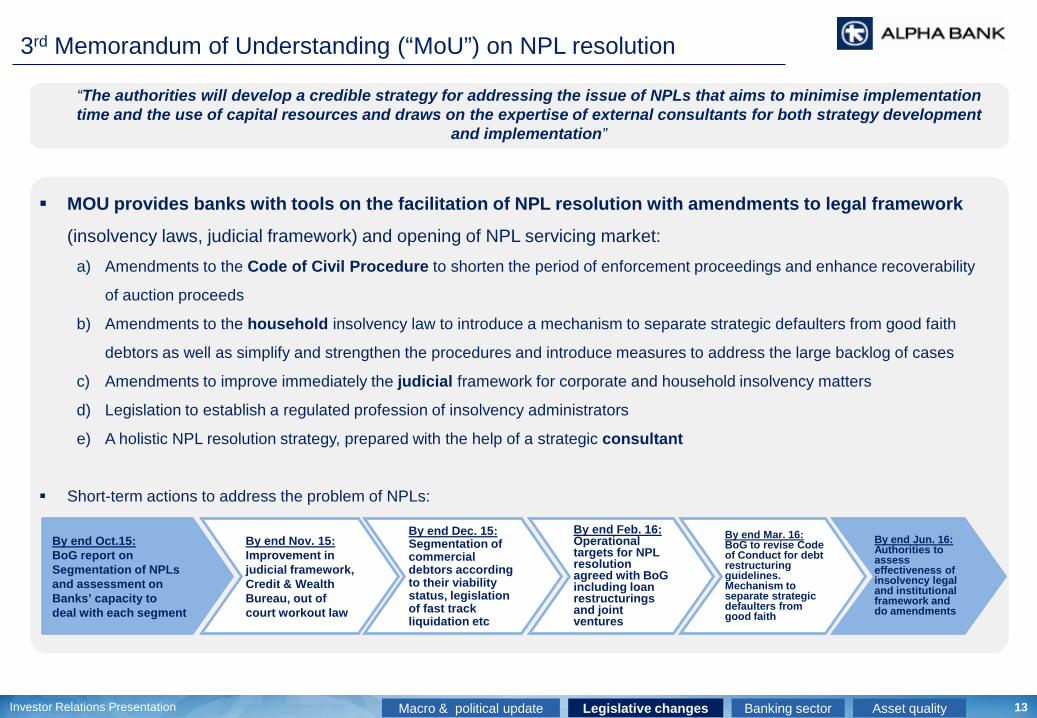
3rd Memorandum of Understanding (“MoU”) on NPL resolution
MOU provides banks with tools on the facilitation of NPL resolution with amendments to legal framework
(insolvency laws, judicial framework) and opening of NPL servicing market: a) Amendments to the Code of Civil Procedure to shorten the period of enforcement proceedings and enhance recoverability
of auction proceeds
b) Amendments to the household insolvency law to introduce a mechanism to separate strategic defaulters from good faith
debtors as well as simplify and strengthen the procedures and introduce measures to address the large backlog of cases
c) Amendments to improve immediately the judicial framework for corporate and household insolvency matters
d) Legislation to establish a regulated profession of insolvency administrators
e) A holistic NPL resolution strategy, prepared with the help of a strategic consultant
Short-term actions to address the problem of NPLs:
By end Jun. 16: Authorities to assess effectiveness of insolvency legal and institutional framework and do amendments
By end Oct.15: BoG report on Segmentation of NPLs and assessment on Banks’ capacity to deal with each segment
By end Nov. 15: Improvement in judicial framework, Credit & Wealth Bureau, out of court workout law
By end Dec. 15: Segmentation of commercial debtors according to their viability status, legislation of fast track liquidation etc
By end Feb. 16: Operational targets for NPL resolution agreed with BoG including loan restructurings and joint ventures
By end Mar. 16: BoG to revise Code of Conduct for debt restructuring guidelines. Mechanism to separate strategic defaulters from good faith
“The authorities will develop a credible strategy for addressing the issue of NPLs that aims to minimise implementation time and the use of capital resources and draws on the expertise of external consultants for both strategy development
and implementation”
Banking sector Legislative changes Macro & political update Asset quality
9M 2013 Results FY 2013 Results 14 Investor Relations Presentation
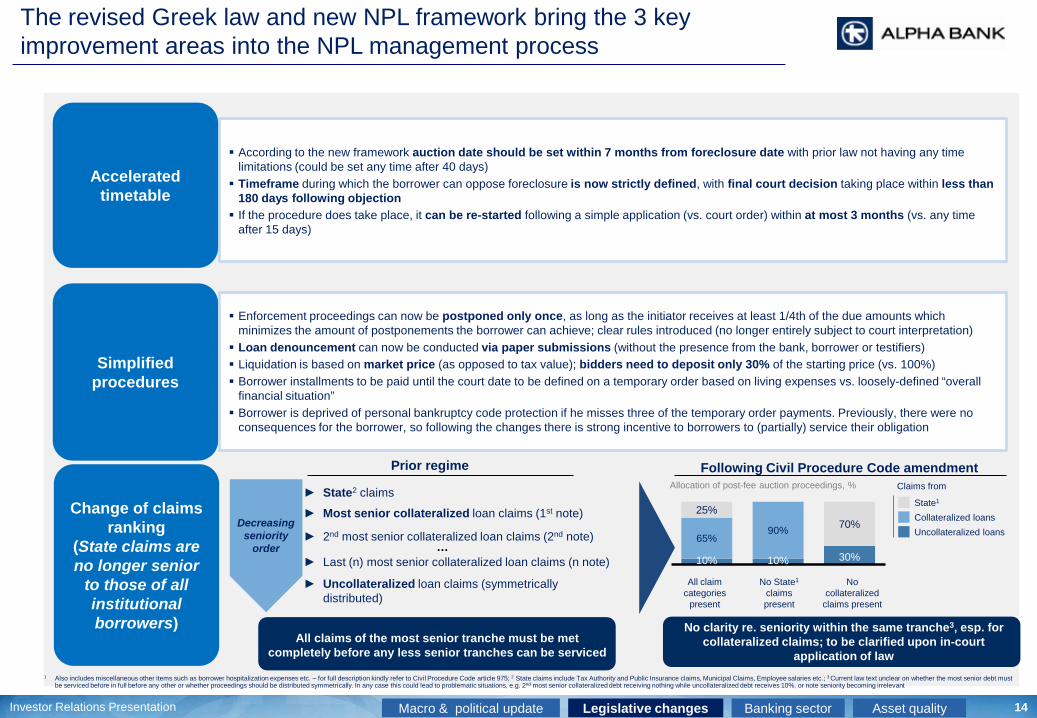
The revised Greek law and new NPL framework bring the 3 key improvement areas into the NPL management process
According to the new framework auction date should be set within 7 months from foreclosure date with prior law not having any time limitations (could be set any time after 40 days) Timeframe during which the borrower can oppose foreclosure is now strictly defined, with final court decision taking place within less than
180 days following objection If the procedure does take place, it can be re-started following a simple application (vs. court order) within at most 3 months (vs. any time
after 15 days)
Accelerated timetable
Simplified procedures
Change of claims ranking
(State claims are no longer senior
to those of all institutional borrowers)
Enforcement proceedings can now be postponed only once, as long as the initiator receives at least 1/4th of the due amounts which minimizes the amount of postponements the borrower can achieve; clear rules introduced (no longer entirely subject to court interpretation) Loan denouncement can now be conducted via paper submissions (without the presence from the bank, borrower or testifiers) Liquidation is based on market price (as opposed to tax value); bidders need to deposit only 30% of the starting price (vs. 100%) Borrower installments to be paid until the court date to be defined on a temporary order based on living expenses vs. loosely-defined “overall
financial situation” Borrower is deprived of personal bankruptcy code protection if he misses three of the temporary order payments. Previously, there were no
consequences for the borrower, so following the changes there is strong incentive to borrowers to (partially) service their obligation
All claims of the most senior tranche must be met completely before any less senior tranches can be serviced
No clarity re. seniority within the same tranche3, esp. for
collateralized claims; to be clarified upon in-court application of law
Prior regime Following Civil Procedure Code amendment
► State2 claims
► Most senior collateralized loan claims (1st note)
► 2nd most senior collateralized loan claims (2nd note) …
► Last (n) most senior collateralized loan claims (n note)
► Uncollateralized loan claims (symmetrically distributed)
Decreasing seniority
order
Allocation of post-fee auction proceedings, %
State1 Collateralized loans Uncollateralized loans
Claims from
All claim categories
present
No State1 claims present
No collateralized
claims present
10% 10% 30%
65% 90%
25% 70%
1 Also includes miscellaneous other items such as borrower hospitalization expenses etc. – for full description kindly refer to Civil Procedure Code article 975; 2 State claims include Tax Authority and Public Insurance claims, Municipal Claims, Employee salaries etc.; 3 Current law text unclear on whether the most senior debt must be serviced before in full before any other or whether proceedings should be distributed symmetrically. In any case this could lead to problematic situations, e.g. 2nd most senior collateralized debt receiving nothing while uncollateralized debt receives 10%, or note seniority becoming irrelevant
Banking sector Legislative changes Macro & political update Asset quality
9M 2013 Results FY 2013 Results 15 Investor Relations Presentation
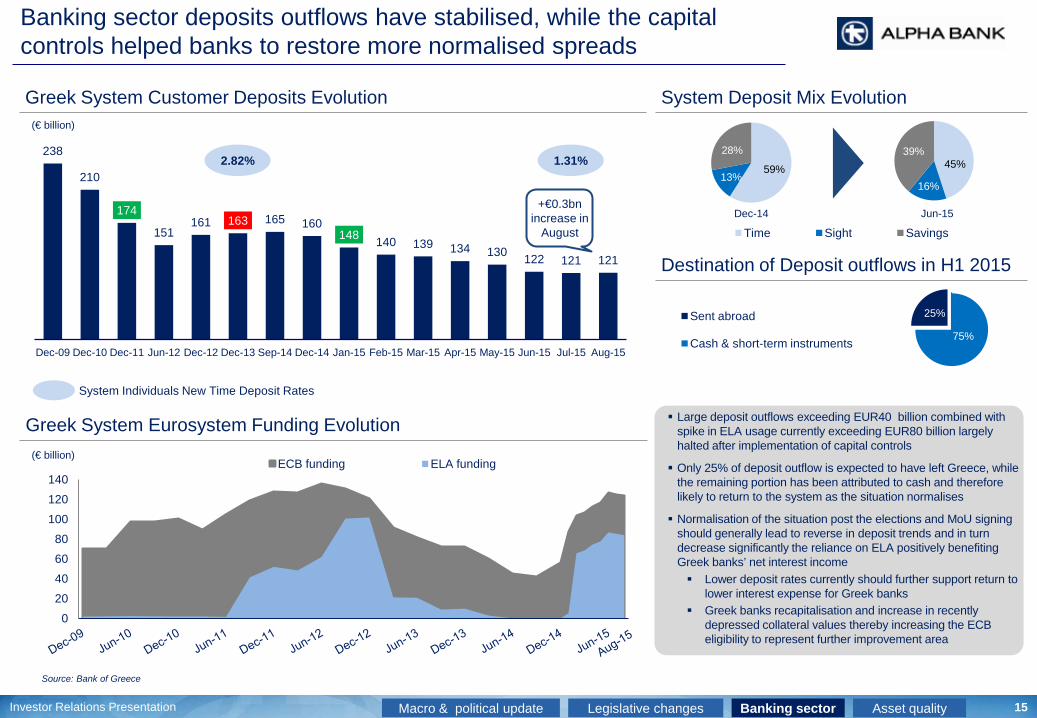
Banking sector deposits outflows have stabilised, while the capital controls helped banks to restore more normalised spreads
Greek System Customer Deposits Evolution System Deposit Mix Evolution
59% 13%
28%
Time Sight Savings
Greek System Eurosystem Funding Evolution
45%
16%
39%
0 20 40 60 80
100 120 140
ECB funding ELA funding
Source: Bank of Greece
238
210
174
151 161 163 165 160
148 140 139 134 130 122 121 121
Dec-09 Dec-10 Dec-11 Jun-12 Dec-12 Dec-13 Sep-14 Dec-14 Jan-15 Feb-15 Mar-15 Apr-15 May-15 Jun-15 Jul-15 Aug-15
2.82% 1.31%
System Individuals New Time Deposit Rates
Banking sector Legislative changes Macro & political update Asset quality
(€ billion)
(€ billion)
Dec-14 Jun-15
Destination of Deposit outflows in H1 2015
25%
75%
Sent abroad
Cash & short-term instruments
Large deposit outflows exceeding EUR40 billion combined with spike in ELA usage currently exceeding EUR80 billion largely halted after implementation of capital controls
Only 25% of deposit outflow is expected to have left Greece, while the remaining portion has been attributed to cash and therefore likely to return to the system as the situation normalises
Normalisation of the situation post the elections and MoU signing should generally lead to reverse in deposit trends and in turn decrease significantly the reliance on ELA positively benefiting Greek banks’ net interest income Lower deposit rates currently should further support return to
lower interest expense for Greek banks Greek banks recapitalisation and increase in recently
depressed collateral values thereby increasing the ECB eligibility to represent further improvement area
+€0.3bn increase in
August

9M 2013 Results FY 2013 Results 16 Investor Relations Presentation
NPL and NPE levels remain elevated, with increased NPL formation in the first quarter 2015
Greek banks NPE ratios
New NPL formation per quarter
€ million 1Q’14 2Q’14 3Q’14 4Q’14 1Q’15 1Q’14-1Q’15
228 158 116 260 554 1,316
Peer 1 681 382 236 239 391 1,929
Peer 2 380 304 346 265 477 1,772
Peer 3 773 500 370 8 264 1,915
Total 2,062 1,344 1,068 772 1,686 6,932
46.0% 39.3%
31.0%
48.0% 46.6% 40.1%
30.9%
52.4%
Peer 1 Peer 2¹ Peer 3
NPE ratio Dec-14 NPE ratio Mar-15
48% 43% 47% 46% 45% 47% 42% 48%
% NPE coverage ratio
Source: Company information 1 NPE level implied by using Group’s total NPLs and adding Greek NPL to NPE adjustment
Alpha Bank since 2014 has had the lowest cumulative NPL formation
Alpha Bank continues to improve its NPL and NPE
coverage levels
Greek banks NPL ratios
33.0% 33.4%
24.3%
38.8% 33.8% 34.0%
24.3%
38.9%
Peer 1 Peer 2 Peer 3
NPL ratio Dec-14 NPL ratio Mar-15
56% 57% 60% 63% 62% 56% 56% 61%
% NPL coverage ratio
Banking sector Legislative changes Macro & political update Asset quality

9M 2013 Results FY 2013 Results 17 Investor Relations Presentation
III. Path to normalisation

9M 2013 Results FY 2013 Results 18 Investor Relations Presentation
Greek banks are yet to benefit from the massive consolidation effort in the banking system as the situation normalises
€mm 2008 2014 Change
Greece nominal GDP 242,096 179,081 (26%)
Greek banking sector data
Total loans 249,324 211,637 (15%)
Total deposits 227,620 160,285 (30%)
Total revenue 15,286 10,626 (30%)
Operating expenses (8,532) (6,499) (24%)
Pre-provision income 6,754 4,127 (39%)
Provisions (3,383) (11,455) +2.4x
Number of banks 21 6 (71%)
Number of employees 64,152 44,186 (31%)
Number of branches 3,888 2,557 (34%)
Evolution of key metrics
Source: IMF, Bank of Greece, Hellenic Bank Association
Greek banking sector has contracted in a similar fashion as nominal GDP since financial crisis
Greek banking sector has subsequently undergone massive restructuring reducing number of banks from 21 to 6, reducing headcount and number of branches
Still, the positive effect from economies of scale is not filtering through yet due to associated large restructuring costs and high cost of risk
Once economy stabilises, the concentrated Greek banking sector should fully benefit from its reorganisation potentially exceeding 2008 PPI levels

9M 2013 Results FY 2013 Results 19 Investor Relations Presentation
Prevailing asset quality issues in the Greek banking sector has significantly increased level of provisions Alpha Bank has had to record
Going forward, as Alpha Bank initiates its NPL decrease programme, its loan loss provisions might return to 2007 levels
Alpha Bank’s return to profitability rests on 3 key main improvement areas
1,701 1,285 1,142
2007 2014 Q1'15 annualised
445
1,853 1,705
2007 2014 Q1'15 annualised
Alpha Bank operating expense evolution (€mm)²
Alpha Bank loan loss provisions evolution (€mm)
Pro-forma Emporiki
Cost of risk
normalisation
Operating expense
reduction initiatives
Decline of cost of funding
Alpha Bank demonstrated outstanding delivery on announced cost savings having achieved its 2016 target one year ahead of the plan
Additional cost savings compared to the plan could be expected given Alpha Bank’s strict cost control approach
Time deposits repricing has supported Greek banks’ NII throughout the economic crisis and will further continue to benefit significantly going forward
Decreasing proportion of more expensive time deposits in the overall deposit portfolio
Stabilising economy should facilitate the closing of the gap of time deposit rates seen in other European countries and Greece even further
Alpha Bank is currently paying 115 bps government guarantee fee on c. €10.7bn Pillar II bonds – high potential impact from fee elimination
New time deposit rates (%)
1.99%
0.56% 0.51%
4.83%
1.81% 1.30%
0% 1% 2% 3% 4% 5%
Mar '12 Jun '15 Jul '15
Euro Area Greece Italy Spain
Cost of guarantee fee on Pillar II bonds (bps)
Pro-forma Emporiki
Pro-forma Emporiki
€10.7bn
Pillar II bonds
115 bps guarantee
fee per annum
Cost almost €123mm per
year
Source: ECB Statistical Data Warehouse ¹ At core deposit cost of 0.12% ² Before extraordinary expenses
Mar-12 peak before
consolidation
(3.02%) Annualised benefit per €10bn since June:
PBT impact €mm
Converge to EU Avg. +130
Convert into Core¹ +169
(0.51%)
40% of repricing already achieved in July
0.77%
% Cost of risk
2.96% 2.72%
9M 2013 Results FY 2013 Results 20 Investor Relations Presentation
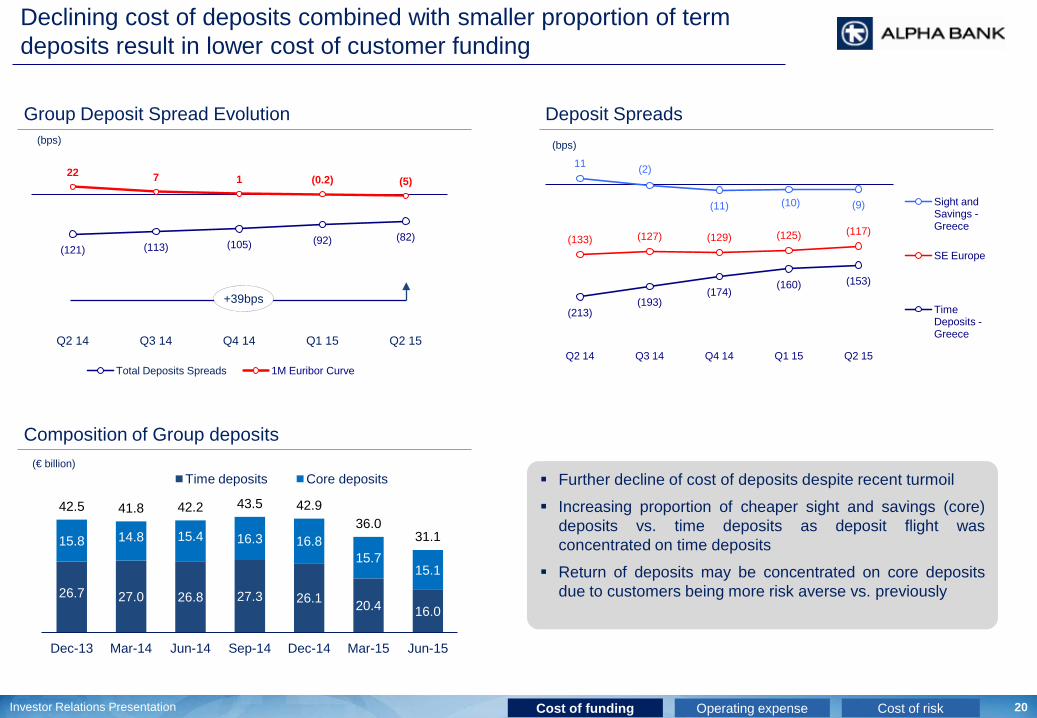
Declining cost of deposits combined with smaller proportion of term deposits result in lower cost of customer funding
Group Deposit Spread Evolution (bps)
Deposit Spreads
(121) (113) (105) (92) (82)
22 7 1 (0.2) (5)
Q2 14 Q3 14 Q4 14 Q1 15 Q2 15
Total Deposits Spreads 1M Euribor Curve
11 (2)
(11) (10) (9)
(133) (127) (129) (125) (117)
(213) (193)
(174) (160) (153)
Q2 14 Q3 14 Q4 14 Q1 15 Q2 15
Sight and Savings - Greece
SE Europe
Time Deposits - Greece
+39bps
(bps)
Further decline of cost of deposits despite recent turmoil
Increasing proportion of cheaper sight and savings (core) deposits vs. time deposits as deposit flight was concentrated on time deposits
Return of deposits may be concentrated on core deposits due to customers being more risk averse vs. previously
Composition of Group deposits (€ billion)
26.7 27.0 26.8 27.3 26.1 20.4 16.0
15.8 14.8 15.4 16.3 16.8 15.7
15.1
42.5 41.8 42.2 43.5 42.9 36.0
31.1
Dec-13 Mar-14 Jun-14 Sep-14 Dec-14 Mar-15 Jun-15
Time deposits Core deposits
Cost of funding Operating expense Cost of risk
9M 2013 Results FY 2013 Results 21 Investor Relations Presentation
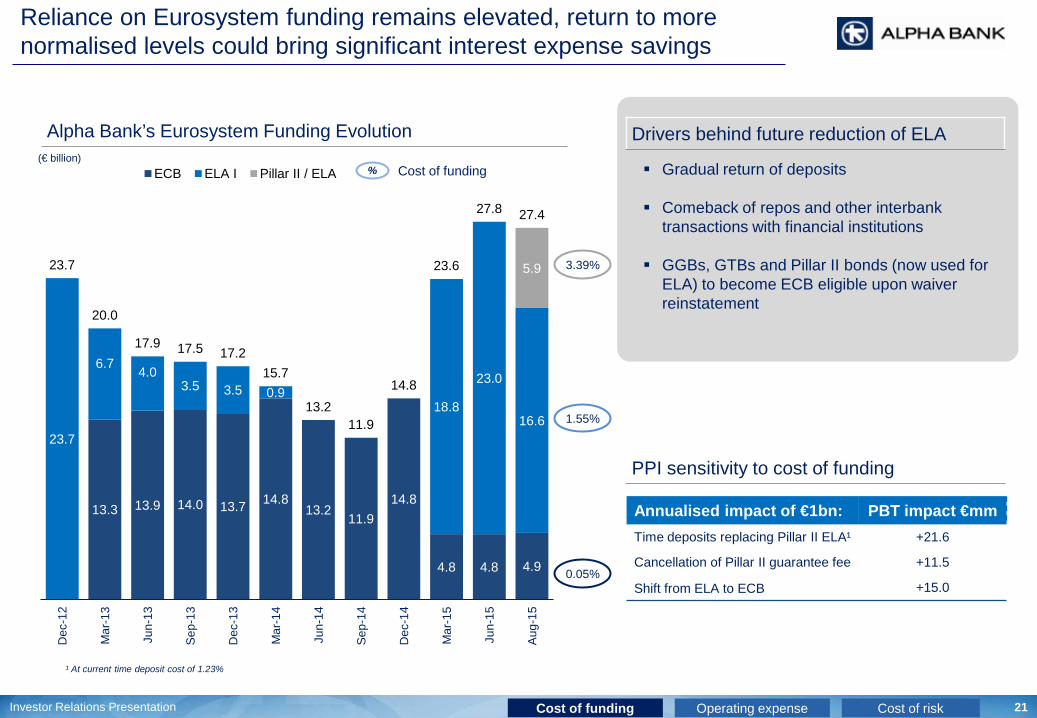
Gradual return of deposits
Comeback of repos and other interbank transactions with financial institutions
GGBs, GTBs and Pillar II bonds (now used for ELA) to become ECB eligible upon waiver reinstatement
Reliance on Eurosystem funding remains elevated, return to more normalised levels could bring significant interest expense savings
Annualised impact of €1bn: PBT impact €mm Time deposits replacing Pillar II ELA¹ +21.6
Cancellation of Pillar II guarantee fee +11.5
Shift from ELA to ECB +15.0
PPI sensitivity to cost of funding
Drivers behind future reduction of ELA
Cost of funding Operating expense Cost of risk
13.3 13.9 14.0 13.7 14.8 13.2
11.9 14.8
4.8 4.8 4.9
23.7
6.7 4.0 3.5 3.5 0.9
18.8
23.0
16.6
5.9 23.7
20.0
17.9 17.5 17.2 15.7
13.2 11.9
14.8
23.6
27.8 27.4
Dec
-12
Mar
-13
Jun-
13
Sep
-13
Dec
-13
Mar
-14
Jun-
14
Sep
-14
Dec
-14
Mar
-15
Jun-
15
Aug
-15
ECB ELA I Pillar II / ELA
Alpha Bank’s Eurosystem Funding Evolution
0.05%
% Cost of funding
1.55%
3.39%
¹ At current time deposit cost of 1.23%
(€ billion)
9M 2013 Results FY 2013 Results 22 Investor Relations Presentation
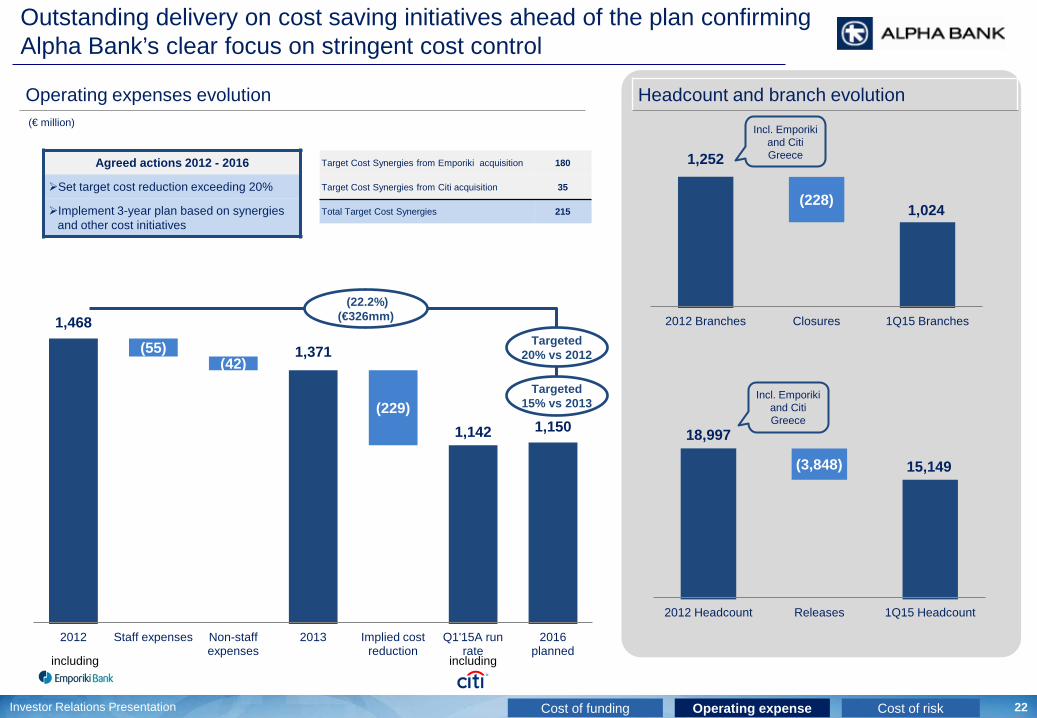
Outstanding delivery on cost saving initiatives ahead of the plan confirming Alpha Bank’s clear focus on stringent cost control
Operating expenses evolution
1,468
1,371
1,142 1,150
(55) (42)
(229)
2012 Staff expenses Non-staff expenses
2013 Implied cost reduction
Q1'15A run rate
2016 planned
(22.2%) (€326mm)
(€ million)
Agreed actions 2012 - 2016
Set target cost reduction exceeding 20%
Implement 3-year plan based on synergies and other cost initiatives
Targeted 15% vs 2013
Cost of funding Operating expense Cost of risk
Target Cost Synergies from Emporiki acquisition 180
Target Cost Synergies from Citi acquisition 35
Total Target Cost Synergies 215
including including
Headcount and branch evolution
Targeted 20% vs 2012
1,252
1,024 (228)
2012 Branches Closures 1Q15 Branches
18,997
15,149 (3,848)
2012 Headcount Releases 1Q15 Headcount
Incl. Emporiki and Citi Greece
Incl. Emporiki and Citi Greece

9M 2013 Results FY 2013 Results 23 Investor Relations Presentation
Detailed overview of Alpha Bank’s asset quality
Cost of funding Operating expense Cost of risk
Group Greece
€bn Business Mortgages Consumer Total Business Mortgages Consumer Total
Gross loans 34.7 21.2 7.3 63.1 28.8 17.3 6.5 52.6
NPLs 11.5 6.7 3.1 21.3 10.0 5.4 2.8 18.2
(+) FNPLs <90dpd +2.3 +2.1 +1.0 +5.4 1.8 1.7 0.9 4.3
(+) Individually impaired +2.7 +0.0 +0.0 +2.7 1.8 0.1 0.1 2.0
NPEs 16.5 8.9 4.0 29.4 13.6 7.1 3.7 24.5
Provisions 8.4 2.6 2.4 13.4 7.1 1.9 2.2 11.1
NPL ratio 33% 32% 42% 34% 35% 31% 43% 35%
NPL cash coverage 73% 39% 78% 63% 71% 34% 78% 61%
NPL cash+collateral coverage 131% 108% 104% 120% 128% 108% 104% 118%
NPE ratio 48% 42% 55% 47% 47% 41% 57% 47%
NPE cash coverage 51% 29% 59% 46% 52% 26% 59% 45%
NPE cash+collateral coverage 112% 102% 84% 105% 113% 102% 83% 105%
Alpha Bank asset quality by portfolio (Mar-15)

9M 2013 Results FY 2013 Results 24 Investor Relations Presentation
NPLs to NPEs Bridge
(€ billion) 5.4
2.7
21.3
29.4
IFRS NPLs 31/3/2015
FNPLs <90dpd
Individually Impaired Loans
NPEs 31/3/2015
The alignment to full EBA definition results to an NPE figure of
€29.4bn that includes:
Forborne non performing loans (FNPLs) of €5.4bn which
are currently below 90dpd, but under full EBA definitions
must be considered as non performing for at least 12
months after the forbearance measures have been applied
Loans of €2.7bn which are either individually impaired or
“unlikely to pay” and that are currently below 90dpd, but
under full EBA definitions are considered as non
performing exposures (NPEs)
NPE ratio at 47% with cash coverage of 46% and total
coverage at 105%
NPLs or NPEs ratio
34%
47%
(€ bn) Total NPLs
FNPLs <90dpd
Individually Impaired 1
Total NPEs
NPE ratio
Cash Coverage
Total Coverage
Business 11.5 2.3 2.7 16.5 48% 51% 112%
Mortgages 6.7 2.1 0.0 8.9 42% 29% 102%
Consumer 3.1 1.0 0.0 4.0 55% 59% 84%
Total 21.3 5.4 2.7 29.4 47% 46% 105%
31%
48%
21%
Business Mortgages Consumer
Forborne Loans €13.6bn o/w FNPLs>90dpd of €3.5bn
1 Including Unlikely to Pay
1
Cost of funding Operating expense Cost of risk
9M 2013 Results FY 2013 Results 25 Investor Relations Presentation
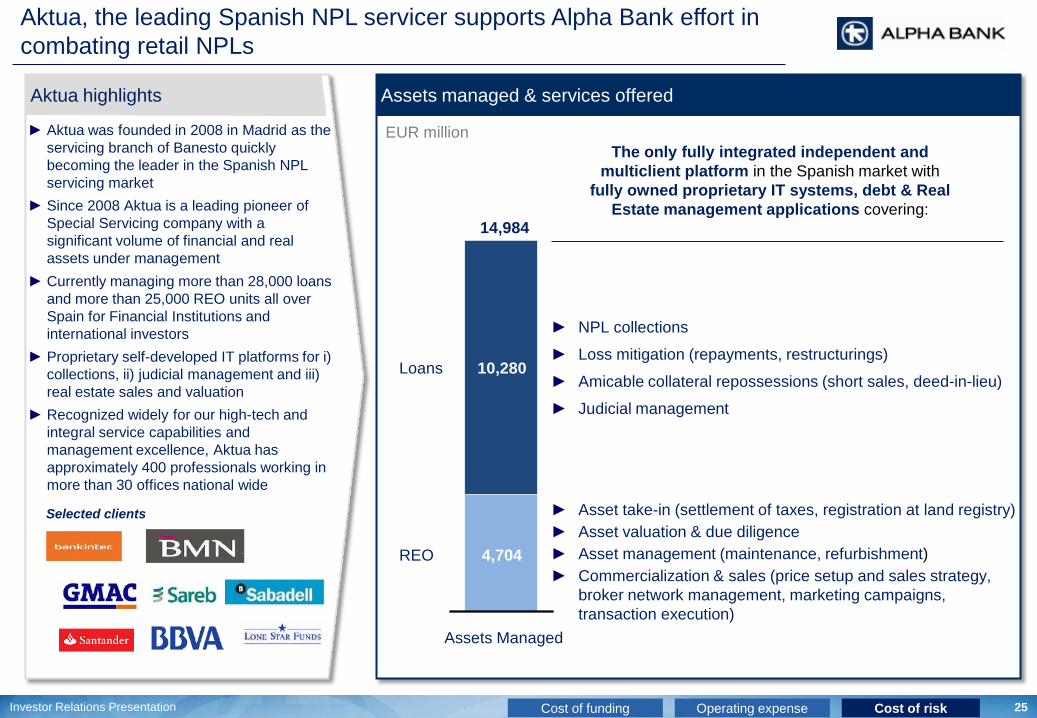
Aktua, the leading Spanish NPL servicer supports Alpha Bank effort in combating retail NPLs
Assets managed & services offered
REO
Loans
14,984
Assets Managed
4,704
10,280
EUR million
► NPL collections
► Loss mitigation (repayments, restructurings)
► Amicable collateral repossessions (short sales, deed-in-lieu)
► Judicial management
► Asset take-in (settlement of taxes, registration at land registry) ► Asset valuation & due diligence ► Asset management (maintenance, refurbishment) ► Commercialization & sales (price setup and sales strategy,
broker network management, marketing campaigns, transaction execution)
The only fully integrated independent and multiclient platform in the Spanish market with
fully owned proprietary IT systems, debt & Real Estate management applications covering:
Aktua highlights
► Aktua was founded in 2008 in Madrid as the servicing branch of Banesto quickly becoming the leader in the Spanish NPL servicing market
► Since 2008 Aktua is a leading pioneer of Special Servicing company with a significant volume of financial and real assets under management
► Currently managing more than 28,000 loans and more than 25,000 REO units all over Spain for Financial Institutions and international investors
► Proprietary self-developed IT platforms for i) collections, ii) judicial management and iii) real estate sales and valuation
► Recognized widely for our high-tech and integral service capabilities and management excellence, Aktua has approximately 400 professionals working in more than 30 offices national wide
Cost of funding Operating expense Cost of risk
Selected clients
9M 2013 Results FY 2013 Results 26 Investor Relations Presentation
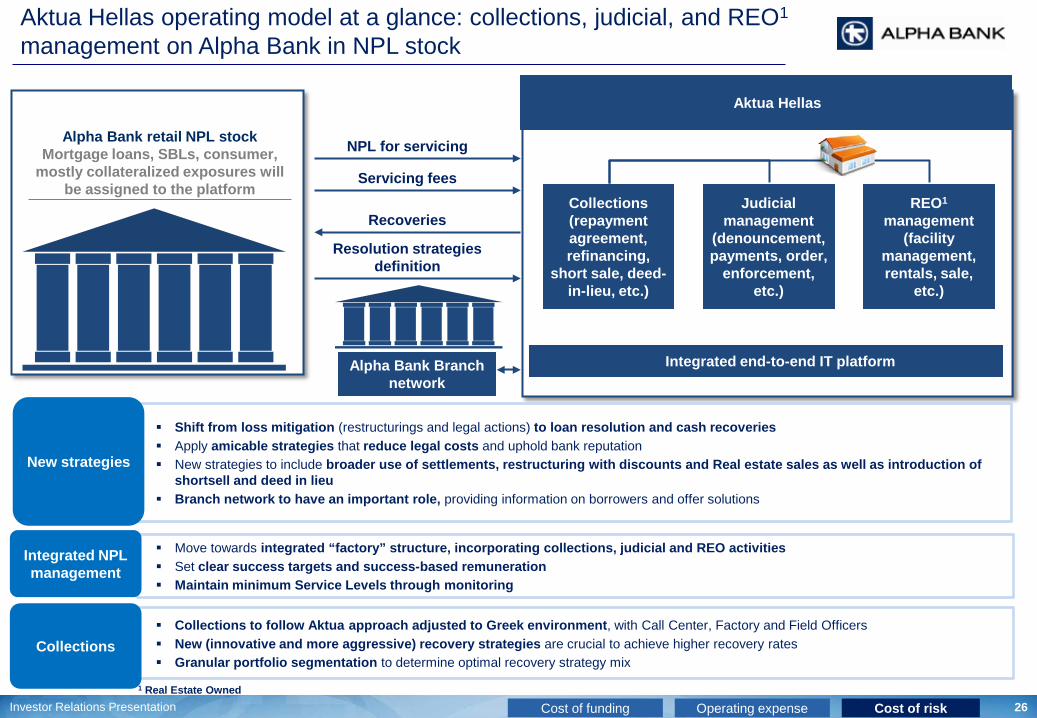
Aktua Hellas operating model at a glance: collections, judicial, and REO1 management on Alpha Bank in NPL stock
Cost of funding Operating expense Cost of risk
Collections (repayment agreement, refinancing,
short sale, deed-in-lieu, etc.)
Judicial management
(denouncement, payments, order,
enforcement, etc.)
REO1 management
(facility management, rentals, sale,
etc.)
Aktua Hellas
Integrated end-to-end IT platform
Alpha Bank retail NPL stock Mortgage loans, SBLs, consumer,
mostly collateralized exposures will be assigned to the platform
NPL for servicing
Servicing fees
Recoveries
Resolution strategies definition
Alpha Bank Branch
network
1 Real Estate Owned
Shift from loss mitigation (restructurings and legal actions) to loan resolution and cash recoveries Apply amicable strategies that reduce legal costs and uphold bank reputation New strategies to include broader use of settlements, restructuring with discounts and Real estate sales as well as introduction of
shortsell and deed in lieu Branch network to have an important role, providing information on borrowers and offer solutions
New strategies
Move towards integrated “factory” structure, incorporating collections, judicial and REO activities Set clear success targets and success-based remuneration Maintain minimum Service Levels through monitoring
Integrated NPL management
Collections to follow Aktua approach adjusted to Greek environment, with Call Center, Factory and Field Officers New (innovative and more aggressive) recovery strategies are crucial to achieve higher recovery rates Granular portfolio segmentation to determine optimal recovery strategy mix
Collections

9M 2013 Results FY 2013 Results 27 Investor Relations Presentation
Aktua Hellas will deploy innovative loss mitigation strategies to achieve higher recovery rates supporting current Alpha Bank practice
Recovery strategy
► Standard collections operations
Description Offered by Aktua Hellas Currently offered by Alpha
► Client agrees to let Alpha Bank sell the property on its behalf
► Write-off of remaining debt (if any)
► Loan terms modification at neutral (reperformance) or positive NPV
► Cash settlement (lump sum or repayment plan) with partial debt write-off
► Loan terms modification at negative NPV due to discounts/partial write-offs
► Client hands the deeds over to the Bank ► Write-off of remaining debt (if any)
► Sales of real estate from existing portfolio, deed-in-lieu, or REO foreclosures
Amicable solution on Real Estate
Offered to all clients unable to pay and with no collateral
Offered to all clients with partial payment ability
Amicable solution on Real Estate
Fully integrated with collections operations
Only for consumer written-off
Only for selected legal cases
Through AAA1 although not industrialized
Cash recovery
Shortsell
Re-performance
Settlement
Restructuring with discounts
Deed in lieu
RE sales
1 Alpha Astika Akinita, Alpha Bank Real Estate dedicated company
Cost of funding Operating expense Cost of risk

9M 2013 Results FY 2013 Results 28 Investor Relations Presentation
Key strategy objectives and rationale for adopted Corporate NPL workout strategy
Key Objectives and Rationale Going forward plan for corporate NPLs
• Market liquidity and overall current lack of investor interest have not allowed for substantial recoveries up to now therefore the main aim was to minimise Expected Loss through collateral enhancement
• Corporate NPLs have been split in 2 categories:
• Going concern clients (clients with operating cash flows that allow for the repayment of a substantial part of the debt)
• Gone concern clients (clients where recovery will come mainly through collateral liquidation)
• Specific NPL Centres have been set up to deal with different portfolios
• For Going concern clients, focus is on conditionally viable entities, so that debt restructuring allows both future asset disposals and sustainability through proper syndication
• Method for treating these involves splitting debt down into various tranches to structure loss and mezzanine tranches into non cash pay facilities
• High provisioning levels established dependent on portfolio segmentation
• Litigation cases; main focus is collateral and claims perfection so that disposals through auctions will be easier when liquidity conditions improve
• Focus on going concern customers to restructure their debt facilities (possibly at a loss), with the loss budget project currently under way assisting the process
• SME restructurings - higher percentage of outright write-offs
• Corporate restructurings - higher portion of NPV losses
• Expedite collateral liquidation for permanent arrears clients
• Enforceable titles for 70% of the permanent arrears portfolio with another 15% on the way and the introduction of the new civil procedure code are expected to decrease liquidation period
• The REO project will also indicate “liquid” collateral at liquidation portfolios and an REO Strategy which will make the Bank more active going forward on auctions
• Examine possible portfolio sales at the already segmented liquidation portfolios
• Targeted sectoral restructuring offerings to gone concern SMEs that are still operating to assist them in going back to business
• Based on a “sectoral macro balance sheet analysis” and a specific scorecard already in place
• Fully compliant with BoG guidelines
• Initially planned campaigns in 1H 2015 were postponed due to market turmoil
Cost of funding Operating expense Cost of risk
9M 2013 Results FY 2013 Results 29 Investor Relations Presentation
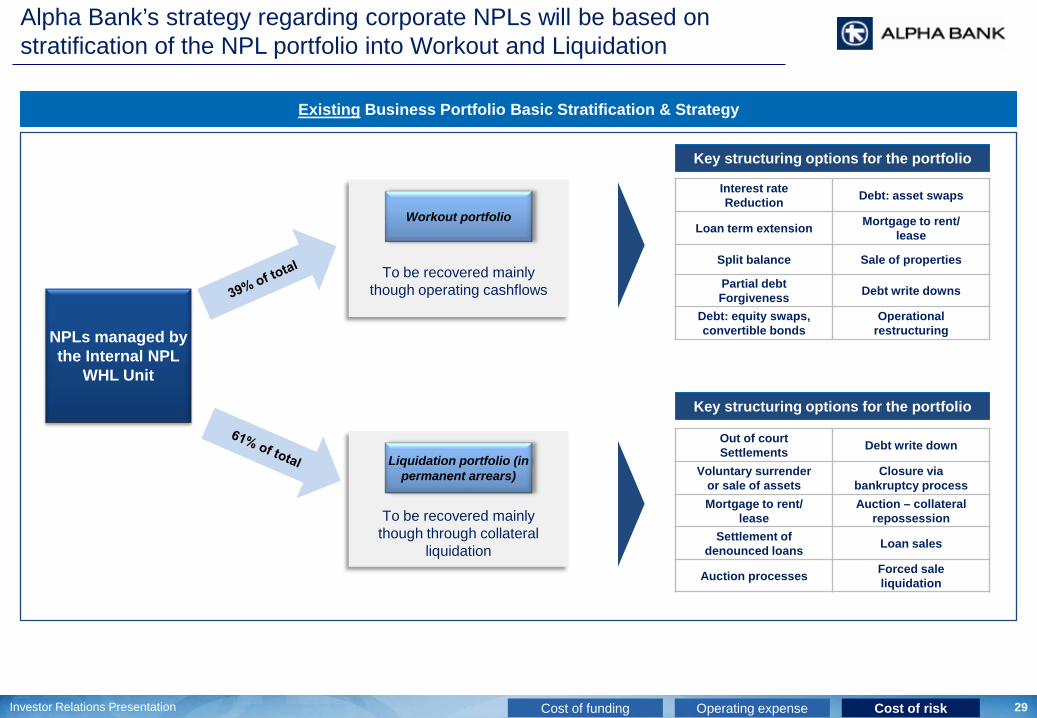
Alpha Bank’s strategy regarding corporate NPLs will be based on stratification of the NPL portfolio into Workout and Liquidation
To be recovered mainly though operating cashflows
NPLs managed by the Internal NPL
WHL Unit
Workout portfolio
To be recovered mainly though through collateral
liquidation
Liquidation portfolio (in permanent arrears)
Existing Business Portfolio Basic Stratification & Strategy
Interest rate Reduction Debt: asset swaps
Loan term extension Mortgage to rent/ lease
Split balance Sale of properties
Partial debt Forgiveness Debt write downs
Debt: equity swaps, convertible bonds
Operational restructuring
Key structuring options for the portfolio
Out of court Settlements Debt write down
Voluntary surrender or sale of assets
Closure via bankruptcy process
Mortgage to rent/ lease
Auction – collateral repossession
Settlement of denounced loans Loan sales
Auction processes Forced sale liquidation
Key structuring options for the portfolio
Cost of funding Operating expense Cost of risk

9M 2013 Results FY 2013 Results 30 Investor Relations Presentation
Conservative actual provisioning compared to stress test projections despite milder GDP evolution than assumed by historical stress tests
4,863
7,760
5,443
Blackrock I Base Blackrock I Adverse Actual
2011 Blackrock I estimated losses vs. actual results (€mm)
(6.1%) (7.0%) (6.6%)
(4.2%) (5.2%)
(3.9%)
(1.3%) (2.3%)
0.7%
Base Adverse Actual
2012 2013 2014
Real GDP growth forecast per Blackrock I vs. actual GDP growth
First Blackrock exercise in 2011 took significantly harsher GDP contraction assumptions than actually realised in 2012 – 2014 Alpha Bank provisioned conservatively in 2012 – 2014 compared to BlackRock I base case despite milder GDP evolution than assumed in the stress
test Conservative provisions taken in 2014 vs. baseline case AQR + 2014 LLPs in October 2014 Comprehensive Assessment taking into account much
stronger GDP growth than assumed by the stress test
(1.8%) (0.9%)
2.5%
Base
2015 2016 2017
New real GDP growth forecast
2012 – 2014 credit losses
Cost of funding Operating expense Cost of risk
1,994 1,853
2014 Base Comprehensive Assessment
AQR+2014 CLP
Actual credit losses
2014 Comprehensive Assessment estimated losses vs. actual (€mm)
2014 GDP growth
(0.6%) 0.7%
9M 2013 Results FY 2013 Results 31 Investor Relations Presentation
Appendix I: Q1 2015 Results
9M 2013 Results FY 2013 Results 32 Investor Relations Presentation
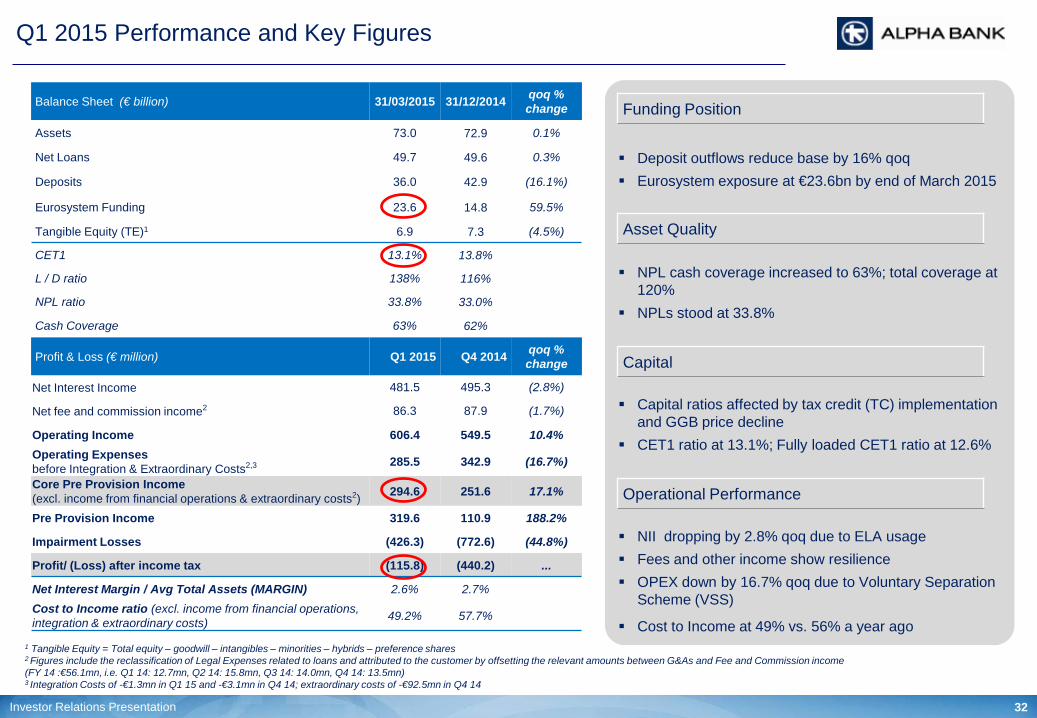
Deposit outflows reduce base by 16% qoq Eurosystem exposure at €23.6bn by end of March 2015
NPL cash coverage increased to 63%; total coverage at 120%
NPLs stood at 33.8%
Capital ratios affected by tax credit (TC) implementation and GGB price decline
CET1 ratio at 13.1%; Fully loaded CET1 ratio at 12.6%
NII dropping by 2.8% qoq due to ELA usage Fees and other income show resilience OPEX down by 16.7% qoq due to Voluntary Separation
Scheme (VSS)
Cost to Income at 49% vs. 56% a year ago
Q1 2015 Performance and Key Figures
1 Tangible Equity = Total equity – goodwill – intangibles – minorities – hybrids – preference shares 2 Figures include the reclassification of Legal Expenses related to loans and attributed to the customer by offsetting the relevant amounts between G&As and Fee and Commission income (FY 14 :€56.1mn, i.e. Q1 14: 12.7mn, Q2 14: 15.8mn, Q3 14: 14.0mn, Q4 14: 13.5mn) 3 Integration Costs of -€1.3mn in Q1 15 and -€3.1mn in Q4 14; extraordinary costs of -€92.5mn in Q4 14
Balance Sheet (€ billion) 31/03/2015 31/12/2014 qoq % change
Assets 73.0 72.9 0.1%
Net Loans 49.7 49.6 0.3%
Deposits 36.0 42.9 (16.1%)
Eurosystem Funding 23.6 14.8 59.5%
Tangible Equity (TE)1 6.9 7.3 (4.5%)
CET1 13.1% 13.8%
L / D ratio 138% 116%
NPL ratio 33.8% 33.0%
Cash Coverage 63% 62%
Profit & Loss (€ million) Q1 2015 Q4 2014 qoq % change
Net Interest Income 481.5 495.3 (2.8%)
Net fee and commission income2 86.3 87.9 (1.7%)
Operating Income 606.4 549.5 10.4% Operating Expenses before Integration & Extraordinary Costs2,3 285.5 342.9 (16.7%)
Core Pre Provision Income (excl. income from financial operations & extraordinary costs2) 294.6 251.6 17.1%
Pre Provision Income 319.6 110.9 188.2%
Impairment Losses (426.3) (772.6) (44.8%)
Profit/ (Loss) after income tax (115.8) (440.2) ...
Net Interest Margin / Avg Total Assets (MARGIN) 2.6% 2.7% Cost to Income ratio (excl. income from financial operations, integration & extraordinary costs) 49.2% 57.7%
Operational Performance
Capital
Asset Quality
Funding Position

9M 2013 Results FY 2013 Results 33 Investor Relations Presentation
Significant Deposit Outflows in the Quarter; Pace Decelerating Thereafter
36.9
(1.3)
(5.3)
30.3
(1.5)
Dec. 14 Core Time Mar. 15 Apr- mid. May 15
(€ billion)
Alpha Bank Deposits in Greece
Δ Q1 2015
Destination of Deposit outflows
25%
75%
Sent abroad
Cash & short-term instruments
1/3 of those deposits that
have not left the country could return within
6months after normalisation
-8,000
-7,000
-6,000
-5,000
-4,000
-3,000
-2,000
-1,000
0
Greek Deposit outflows at a lower pace post Feb.
(€ m
illio
n)
Q1 2015 outflows in Greece stood at €6.6bn
Deposit outflows continued in April and May, albeit at a
reduced pace
Only ¼ of the deposit outflows were transferred abroad with
the rest withdrawn in cash or invested in short-term
instruments
€(6.6) bn €(1.5) bn
Jan. 15 Feb. 15 Mar. 15 Apr. 15 May15

9M 2013 Results FY 2013 Results 34 Investor Relations Presentation
Eurosystem Funding Reliance Increases and Shifts to ELA due to Liquidity Pressures from Deposit Outflows and ECB Rules Change
Alpha Bank’s Eurosystem Funding Evolution
14.8
4.8 4.8
6.6
2.2
23.6 24.6 18.8
1.5 0.3
20.6
23.6 25.4
Dec. 14 Deposit Outflows
Interbank & other
Mar. 15 Deposit Outflows
Interbank & other
mid-May. 15
(€ billion)
0.6
11.2
2.1 2.6
7.6
3.3
4.2
4.8
26.8
ECB Collateral ELA Collateral
EFSF Bonds
Bonds (Pillar III, GGBs, T-bills)
Pillar II
Covered Bonds
Securitisations
Loans
Usage
(€ billion)
4.8
20.6
43 56
39 39
74
68 74
62 107 113
136
Sep. 14 Dec. 14 Mar. 15 Apr. 15 June 2012 (peak post
PSI)
ELA
ECB
Greek System Funding Reliance Evolution
Depositors’ uncertainty, counterparts and investors
shift in Greek risk perception and ECB rules change,
resulted in an abrupt increase of Eurosystem
funding reliance mainly via the ELA mechanism
Focused efforts to maintain liquidity buffers in a
challenging environment
Source: Bank of Greece
(€ billion)
Almost double In 3 months
Eurosystem Collateral Pool (May 2015, cash values)
9M 2013 Results FY 2013 Results 35 Investor Relations Presentation
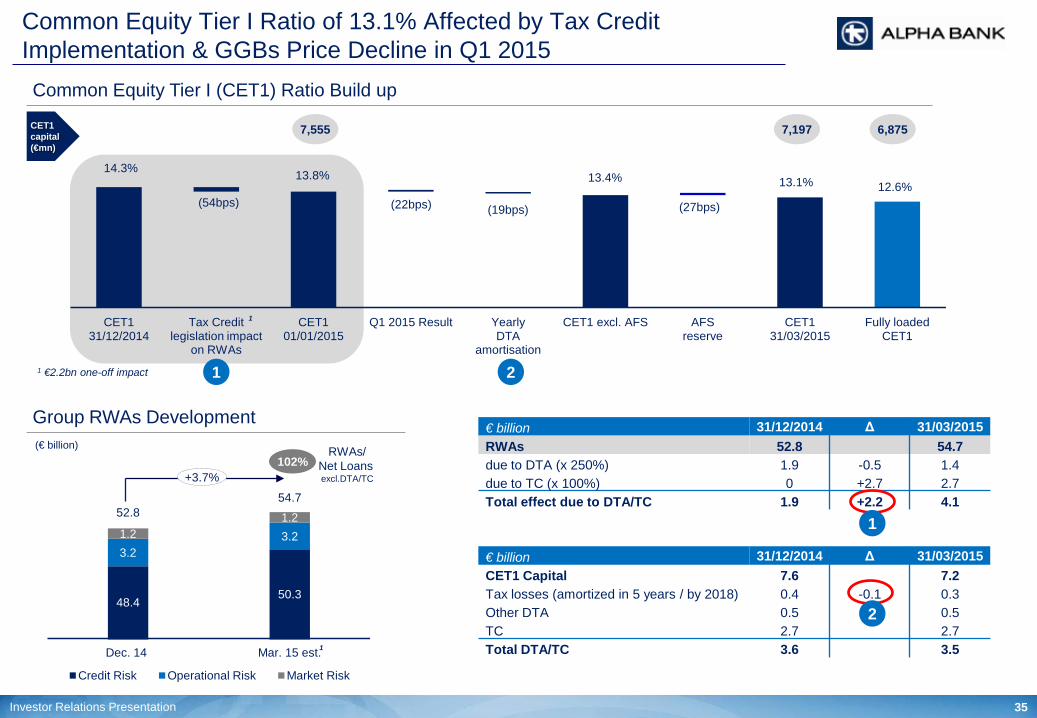
14.3%
(54bps)
13.8%
(22bps) (19bps)
13.4%
(27bps)
13.1% 12.6%
CET1 31/12/2014
Tax Credit legislation impact
on RWAs
CET1 01/01/2015
Q1 2015 Result Yearly DTA
amortisation
CET1 excl. AFS AFS reserve
CET1 31/03/2015
Fully loaded CET1
Common Equity Tier I (CET1) Ratio Build up
CET1 capital (€mn)
1 €2.2bn one-off impact
7,555 7,197
1
6,875
Group RWAs Development
48.4 50.3
3.2 3.2 1.2 1.2 52.8
54.7
Dec. 14 Mar. 15 est.
Credit Risk Operational Risk Market Risk
(€ billion)
+3.7% 102%
RWAs/ Net Loans excl.DTA/TC
1
1 2
€ billion 31/12/2014 Δ 31/03/2015 RWAs 52.8 54.7 due to DTA (x 250%) 1.9 -0.5 1.4 due to TC (x 100%) 0 +2.7 2.7 Total effect due to DTA/TC 1.9 +2.2 4.1
€ billion 31/12/2014 Δ 31/03/2015 CET1 Capital 7.6 7.2 Tax losses (amortized in 5 years / by 2018) 0.4 -0.1 0.3 Other DTA 0.5 0.5 TC 2.7 2.7 Total DTA/TC 3.6 3.5
2
1
Common Equity Tier I Ratio of 13.1% Affected by Tax Credit Implementation & GGBs Price Decline in Q1 2015
9M 2013 Results FY 2013 Results 36 Investor Relations Presentation
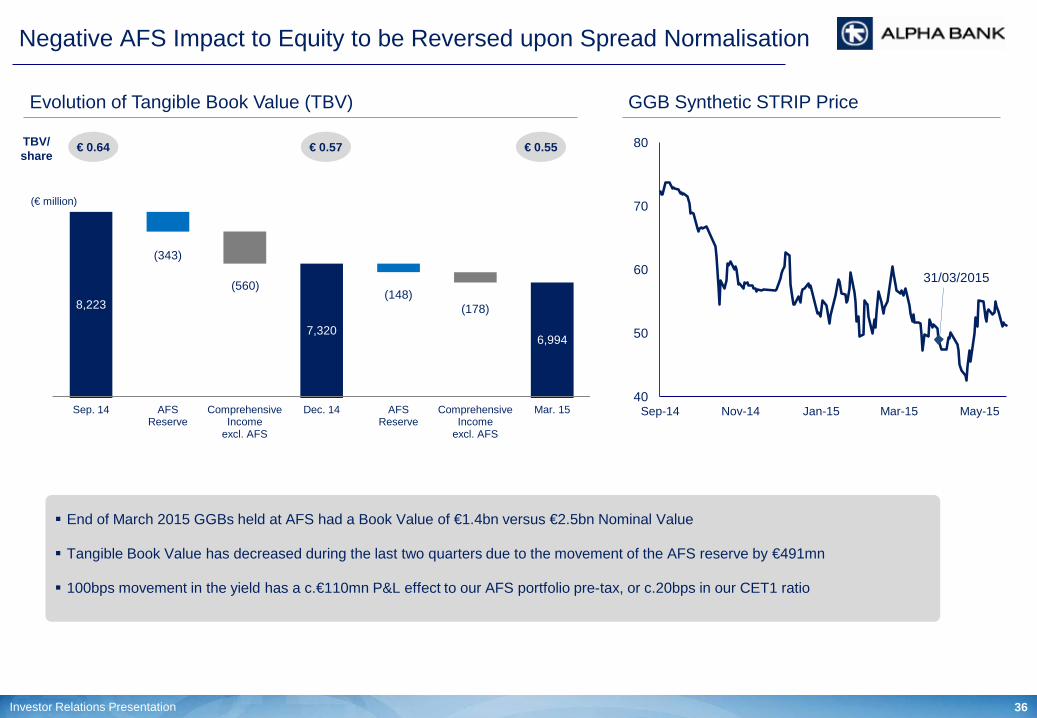
Negative AFS Impact to Equity to be Reversed upon Spread Normalisation
Evolution of Tangible Book Value (TBV)
€ 0.57 TBV/ share
(€ million)
7,880 7,320 7,172 6,994
8,223
7,320 6,994
(343)
(560) (148)
(178)
Sep. 14 AFS Reserve
Comprehensive Income
excl. AFS
Dec. 14 AFS Reserve
Comprehensive Income
excl. AFS
Mar. 15
€ 0.55 € 0.64
GGB Synthetic STRIP Price
31/03/2015
40
50
60
70
80
Sep-14 Nov-14 Jan-15 Mar-15 May-15
End of March 2015 GGBs held at AFS had a Book Value of €1.4bn versus €2.5bn Nominal Value
Tangible Book Value has decreased during the last two quarters due to the movement of the AFS reserve by €491mn
100bps movement in the yield has a c.€110mn P&L effect to our AFS portfolio pre-tax, or c.20bps in our CET1 ratio
9M 2013 Results FY 2013 Results 37 Investor Relations Presentation
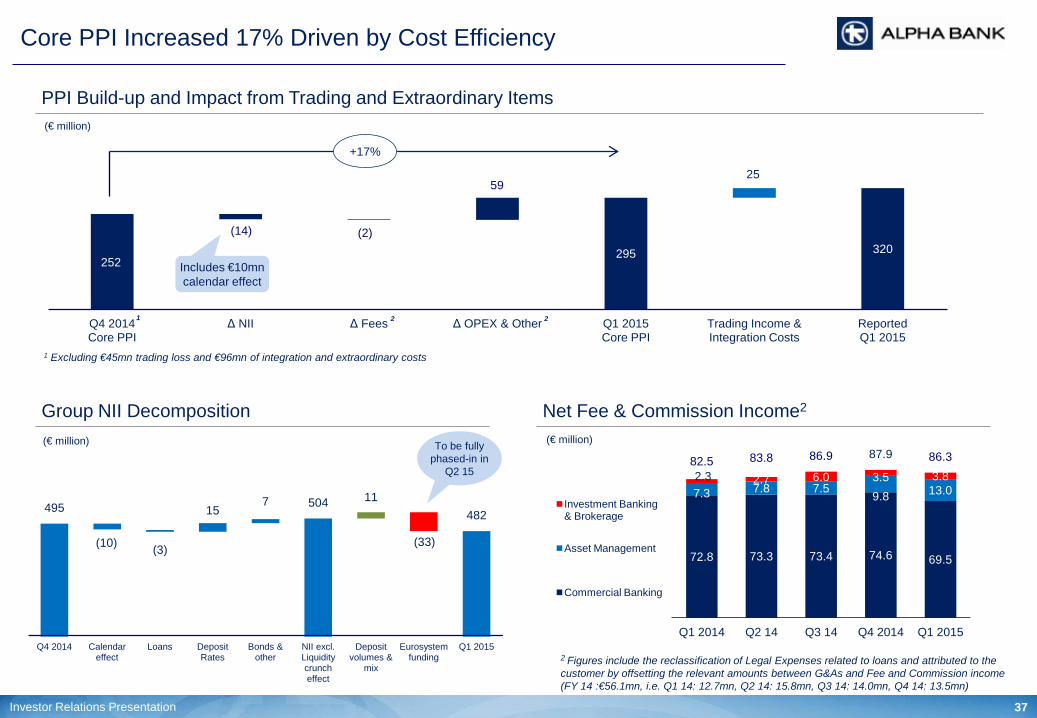
(10) (3)
15 7 11
(33)
495 504 482
Q4 2014 Calendar effect
Loans Deposit Rates
Bonds & other
NII excl. Liquidity crunch effect
Deposit volumes &
mix
Eurosystem funding
Q1 2015
Core PPI Increased 17% Driven by Cost Efficiency
Group NII Decomposition
252
(14) (2)
59
295 320
25
Q4 2014 Core PPI
Δ NII Δ Fees Δ OPEX & Other Q1 2015 Core PPI
Trading Income & Integration Costs
Reported Q1 2015
(€ million)
PPI Build-up and Impact from Trading and Extraordinary Items
+17%
1 Excluding €45mn trading loss and €96mn of integration and extraordinary costs
1
Includes €10mn calendar effect
Net Fee & Commission Income2
72.8 73.3 73.4 74.6 69.5
7.3 7.8 7.5 9.8 13.0
2.3 2.7 6.0 3.5 3.8 82.5 83.8 86.9 87.9 86.3
Q1 2014 Q2 14 Q3 14 Q4 2014 Q1 2015
Investment Banking & Brokerage
Asset Management
Commercial Banking
(€ million)
2 Figures include the reclassification of Legal Expenses related to loans and attributed to the customer by offsetting the relevant amounts between G&As and Fee and Commission income (FY 14 :€56.1mn, i.e. Q1 14: 12.7mn, Q2 14: 15.8mn, Q3 14: 14.0mn, Q4 14: 13.5mn)
2 2
(€ million) To be fully phased-in in
Q2 15

9M 2013 Results FY 2013 Results 38 Investor Relations Presentation
ELA Usage Negatively Affects Funding Cost
Banking Book NII Decomposition3
(137) (128) (119) (112) (83)
597 595 591 586 570
2.6% 2.7% 2.7% 2.7% 2.6%
Q1 14 Q2 14 Q3 14 Q4 14 Q1 15
Loans
Deposits
NIM
(€ million) (€ billion)
1 Including fees related to Government Guaranteed Bank Bonds 2 Excludes fees related to Government Guaranteed Bank Bonds
14.8 13.2 11.9
14.8
4.8
0.9 0.0
18.8
15.7 13.2 11.9
14.8
23.6 0.57%
0.27% 0.13% 0.06%
0.79%
Mar. 14 Jun. 14 Sep. 14 Dec. 14 Mar. 15
ELA
ECB
Funding Cost
Central Bank Funding Balances & Cost
Incl. €4.2bn EFSF bonds
pledged
1.24%1
2
6% 2%
24% 8%
31%
70% 59%
Dec. 14 Mar. 15
Deposits
ELA
ECB
Wholesale Funding
Funding Mix Evolution
Government Guarantees bear a cost of 115bps on
average over Nominal Value
Fully phased-in cost from ELA at 200bps
3 Figures in SEE were reclassified to reflect revision of transfer rates in assets and liabilities
9M 2013 Results FY 2013 Results 39 Investor Relations Presentation
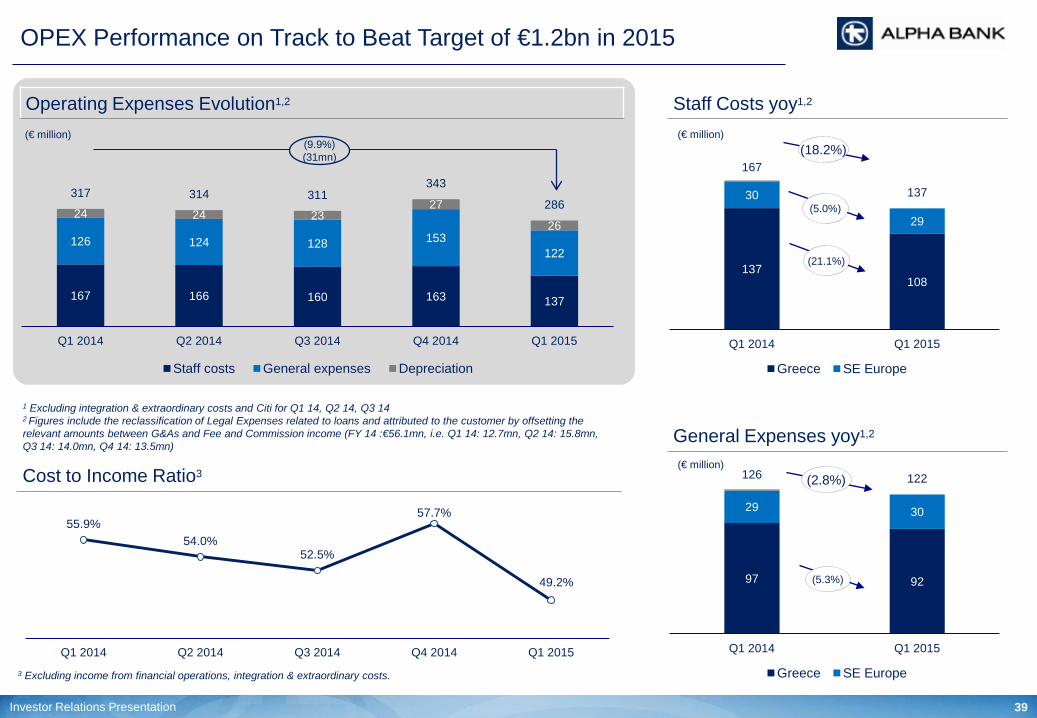
OPEX Performance on Track to Beat Target of €1.2bn in 2015
Operating Expenses Evolution1,2
167 166 160 163 137
126 124 128 153 122
24 24 23 27
26
317 314 311 343
286
Q1 2014 Q2 2014 Q3 2014 Q4 2014 Q1 2015
Staff costs General expenses Depreciation
(€ million)
1 Excluding integration & extraordinary costs and Citi for Q1 14, Q2 14, Q3 14 2 Figures include the reclassification of Legal Expenses related to loans and attributed to the customer by offsetting the relevant amounts between G&As and Fee and Commission income (FY 14 :€56.1mn, i.e. Q1 14: 12.7mn, Q2 14: 15.8mn, Q3 14: 14.0mn, Q4 14: 13.5mn)
(9.9%) (31mn)
Staff Costs yoy1,2
55.9% 54.0%
52.5%
57.7%
49.2%
Q1 2014 Q2 2014 Q3 2014 Q4 2014 Q1 2015
Cost to Income Ratio3
3 Excluding income from financial operations, integration & extraordinary costs.
General Expenses yoy1,2
137 108
30
29
167
137
Q1 2014 Q1 2015
Greece SE Europe
(5.0%)
(18.2%) (€ million)
97 92
29 30
126 122
Q1 2014 Q1 2015
Greece SE Europe
(5.3%)
(2.8%) (€ million)
(21.1%)
9M 2013 Results FY 2013 Results 40 Investor Relations Presentation
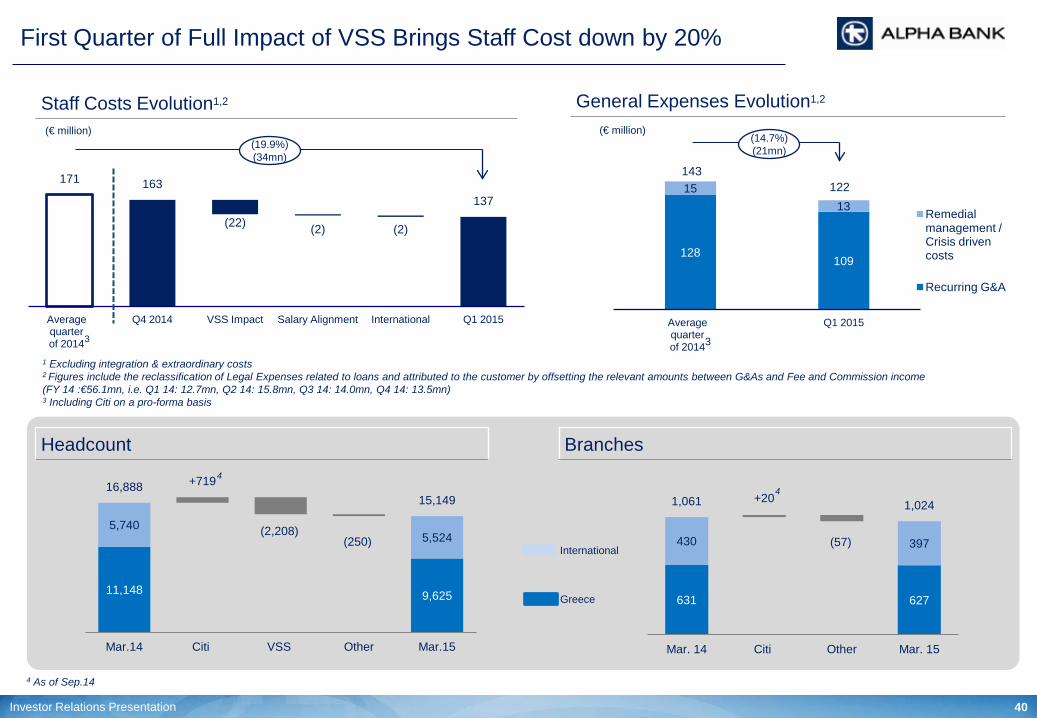
First Quarter of Full Impact of VSS Brings Staff Cost down by 20%
Staff Costs Evolution1,2
(€ million) (19.9%) (34mn)
General Expenses Evolution1,2
(22) (2) (2)
171 163 137
Average quarter of 2014
Q4 2014 VSS Impact Salary Alignment International Q1 2015
(€ million)
4 As of Sep.14
128 109
15 13
143 122
Average quarter of 2014
Q1 2015
Remedial management / Crisis driven costs
Recurring G&A
(14.7%) (21mn)
3 3
11,148 9,625
5,740
+719
(2,208) (250) 5,524
16,888 15,149
Mar.14 Citi VSS Other Mar.15
4
Headcount
Greece
International
631 627
430
+20
(57) 397
1,061 1,024
Mar. 14 Citi Other Mar. 15
Branches
4
1 Excluding integration & extraordinary costs 2 Figures include the reclassification of Legal Expenses related to loans and attributed to the customer by offsetting the relevant amounts between G&As and Fee and Commission income (FY 14 :€56.1mn, i.e. Q1 14: 12.7mn, Q2 14: 15.8mn, Q3 14: 14.0mn, Q4 14: 13.5mn) 3 Including Citi on a pro-forma basis
9M 2013 Results FY 2013 Results 41 Investor Relations Presentation
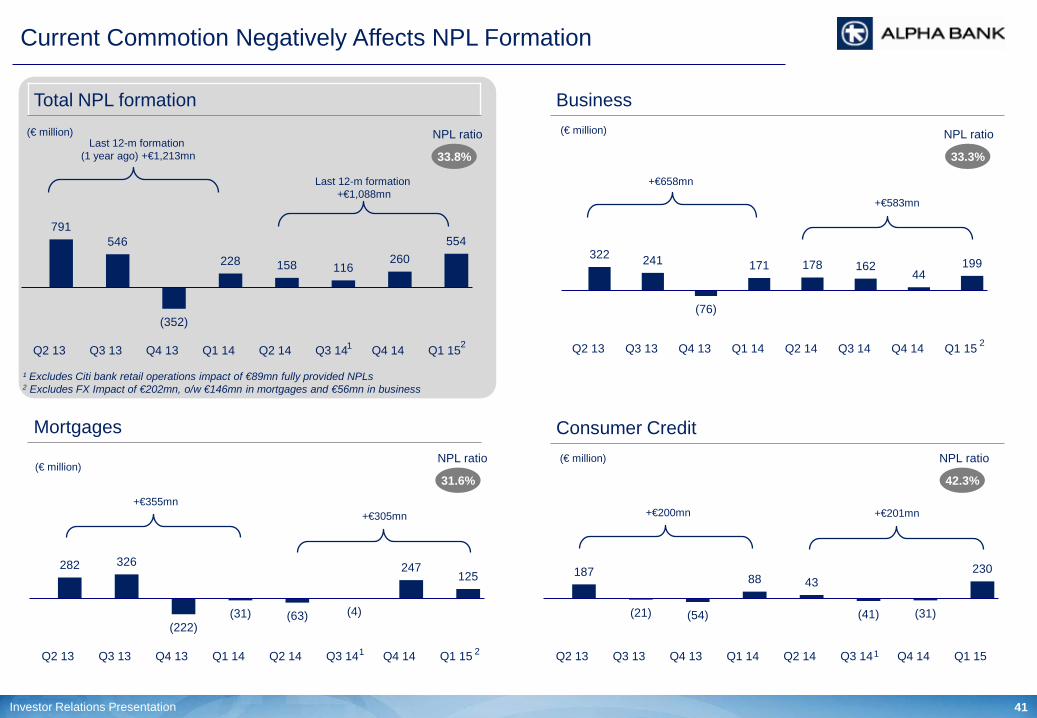
Current Commotion Negatively Affects NPL Formation
791 546
(352)
228 158 116 260
554
Q2 13 Q3 13 Q4 13 Q1 14 Q2 14 Q3 14 Q4 14 Q1 15
Total NPL formation (€ million)
322 241
(76)
171 178 162 44
199
Q2 13 Q3 13 Q4 13 Q1 14 Q2 14 Q3 14 Q4 14 Q1 15
Business (€ million)
282 326
(222) (31) (63) (4)
247 125
Q2 13 Q3 13 Q4 13 Q1 14 Q2 14 Q3 14 Q4 14 Q1 15
Mortgages
(€ million)
187
(21) (54)
88 43
(41) (31)
230
Q2 13 Q3 13 Q4 13 Q1 14 Q2 14 Q3 14 Q4 14 Q1 15
Consumer Credit (€ million)
33.8% 33.3%
31.6% 42.3%
NPL ratio
Last 12-m formation +€1,088mn
NPL ratio
NPL ratio NPL ratio
+€583mn
+€658mn
+€305mn +€355mn
+€201mn +€200mn
¹ Excludes Citi bank retail operations impact of €89mn fully provided NPLs 2 Excludes FX Impact of €202mn, o/w €146mn in mortgages and €56mn in business
1
1 1
Last 12-m formation (1 year ago) +€1,213mn
2 2
2
9M 2013 Results FY 2013 Results 42 Investor Relations Presentation
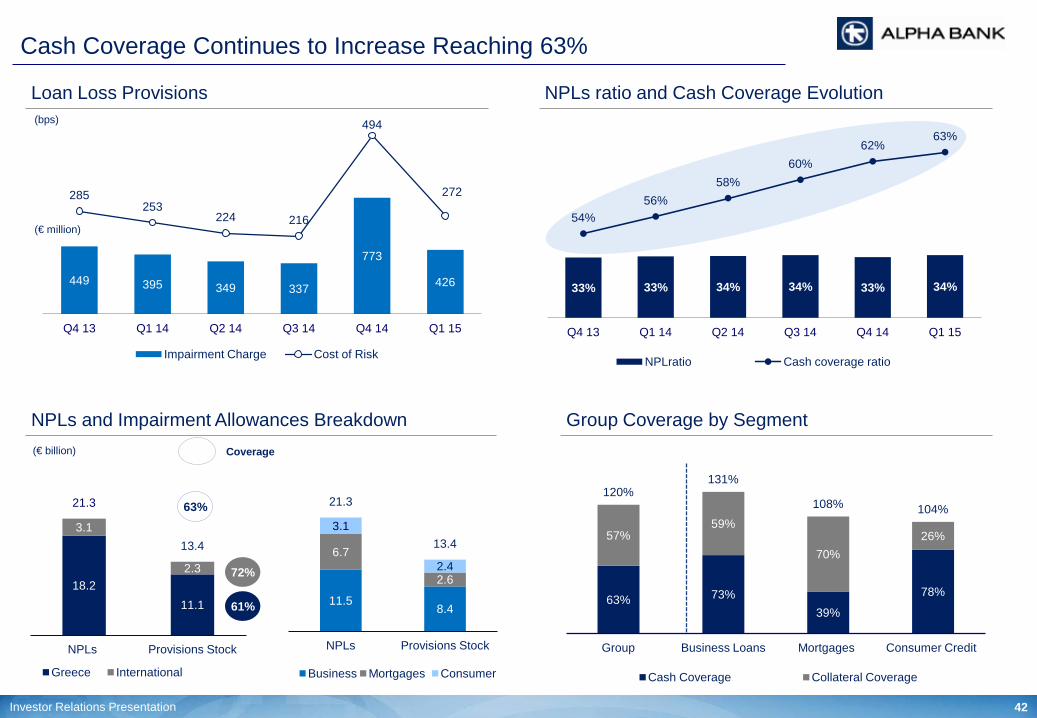
33% 33% 34% 34% 33% 34%
54% 56%
58% 60%
62% 63%
Q4 13 Q1 14 Q2 14 Q3 14 Q4 14 Q1 15
NPLratio Cash coverage ratio
Cash Coverage Continues to Increase Reaching 63%
449 395 349 337
773
426
285 253
224 216
494
272
Q4 13 Q1 14 Q2 14 Q3 14 Q4 14 Q1 15
Impairment Charge Cost of Risk
(bps)
18.2 11.1
3.1
2.3
21.3
13.4
NPLs Provisions Stock
Greece International
(€ billion)
72%
61%
Loan Loss Provisions
NPLs and Impairment Allowances Breakdown
63% 73% 39%
78%
57% 59%
70% 26%
120% 131%
108% 104%
Group Business Loans Mortgages Consumer Credit
Cash Coverage Collateral Coverage
Group Coverage by Segment
NPLs ratio and Cash Coverage Evolution
(€ million)
11.5 8.4
6.7
2.6
3.1
2.4
21.3
13.4
NPLs Provisions Stock
Business Mortgages Consumer
63%
Coverage
9M 2013 Results FY 2013 Results 43 Investor Relations Presentation
Appendix II: Stress Tests Macro Assumptions
9M 2013 Results FY 2013 Results 44 Investor Relations Presentation
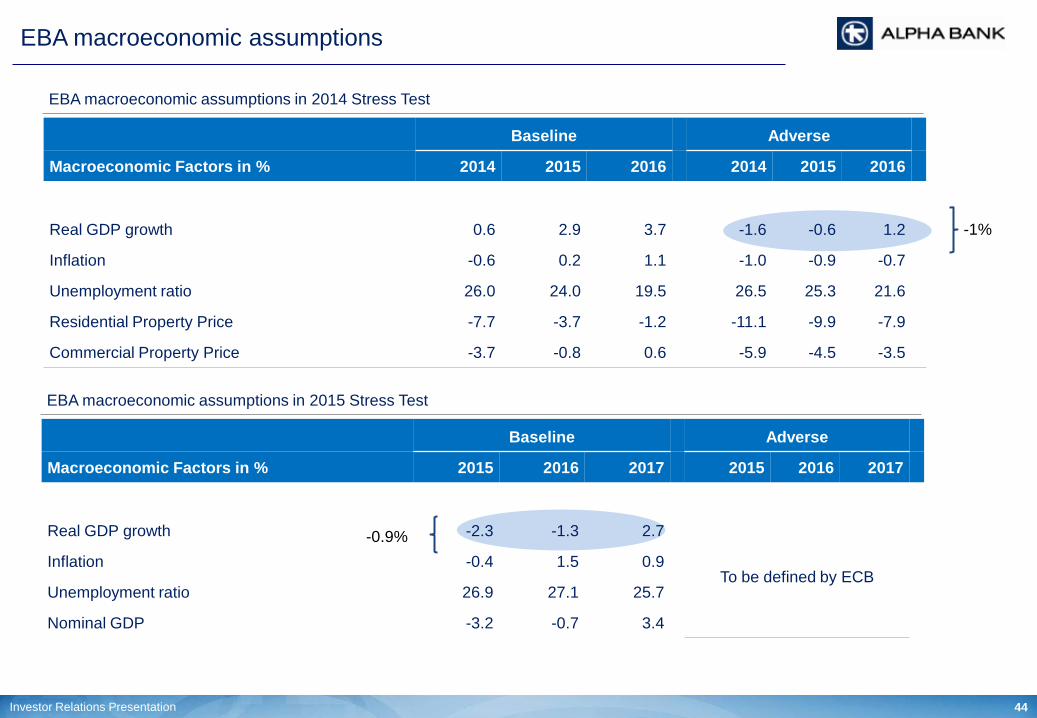
EBA macroeconomic assumptions
EBA macroeconomic assumptions in 2014 Stress Test
Baseline Adverse
Macroeconomic Factors in % 2014 2015 2016 2014 2015 2016
Real GDP growth 0.6 2.9 3.7 -1.6 -0.6 1.2
Inflation -0.6 0.2 1.1 -1.0 -0.9 -0.7
Unemployment ratio 26.0 24.0 19.5 26.5 25.3 21.6
Residential Property Price -7.7 -3.7 -1.2 -11.1 -9.9 -7.9
Commercial Property Price -3.7 -0.8 0.6 -5.9 -4.5 -3.5
-1%
EBA macroeconomic assumptions in 2015 Stress Test
Baseline Adverse
Macroeconomic Factors in % 2015 2016 2017 2015 2016 2017
Real GDP growth -2.3 -1.3 2.7
To be defined by ECB Inflation -0.4 1.5 0.9
Unemployment ratio 26.9 27.1 25.7
Nominal GDP -3.2 -0.7 3.4
-0.9%
9M 2013 Results FY 2013 Results 45 Investor Relations Presentation
Alpha Bank Contacts
ALPHA BANK 40, Stadiou Street, 102 52 Athens, Greece Internet : www.alpha.gr Reuters : ACBr.AT (shares), GRALFAw.AT (warrants) Bloomberg : ALPHA GA (shares), ALPHAW GA (warrants)
Vassilios Psaltis Lazaros Papagaryfallou General Manager – CFO Executive General Manager [email protected] [email protected] +30 210 326 2181 +30 210 326 4017 Dimitrios Kostopoulos Elena Katopodi Manager Assistant Manager Investor Relations Division Investor Relations Division Stella Traka Marios-Ioannis Deportou Senior Investor Relations Officer Senior Investor Relations Officer E-mail : [email protected] Tel : +30 210 326 4082 +30 210 326 4182 +30 210 326 4199 +30 210 326 4165 +30 210 326 4010 +30 210 326 4185