presentation slides abdikarim
TRANSCRIPT

THE EFFECTS OF POLITICAL GOVERNANCE, POLICY THE EFFECTS OF POLITICAL GOVERNANCE, POLICY
MEASURES AND ECONOMIC GROWTH ONMEASURES AND ECONOMIC GROWTH ON
NON-FATAL MVC INJURIES NON-FATAL MVC INJURIES
Presented by:
Abdikarim Omar HusseinGS26029
-May 2011-
1

Background of the studyBackground of the study Road traffic injuries are one of the leading causes of Road traffic injuries are one of the leading causes of
human death and huge economic losses in the worldhuman death and huge economic losses in the world
According to the recent World Health Organization According to the recent World Health Organization (WHO., 2009) data : Between 20 and 50 million people (WHO., 2009) data : Between 20 and 50 million people suffer road traffic injuries each year which about 13% suffer road traffic injuries each year which about 13% had a subsequent disabilityhad a subsequent disability
Hospitals spend around RM1,500 (average) per patient Hospitals spend around RM1,500 (average) per patient for treating road traffic injuries. for treating road traffic injuries.
2
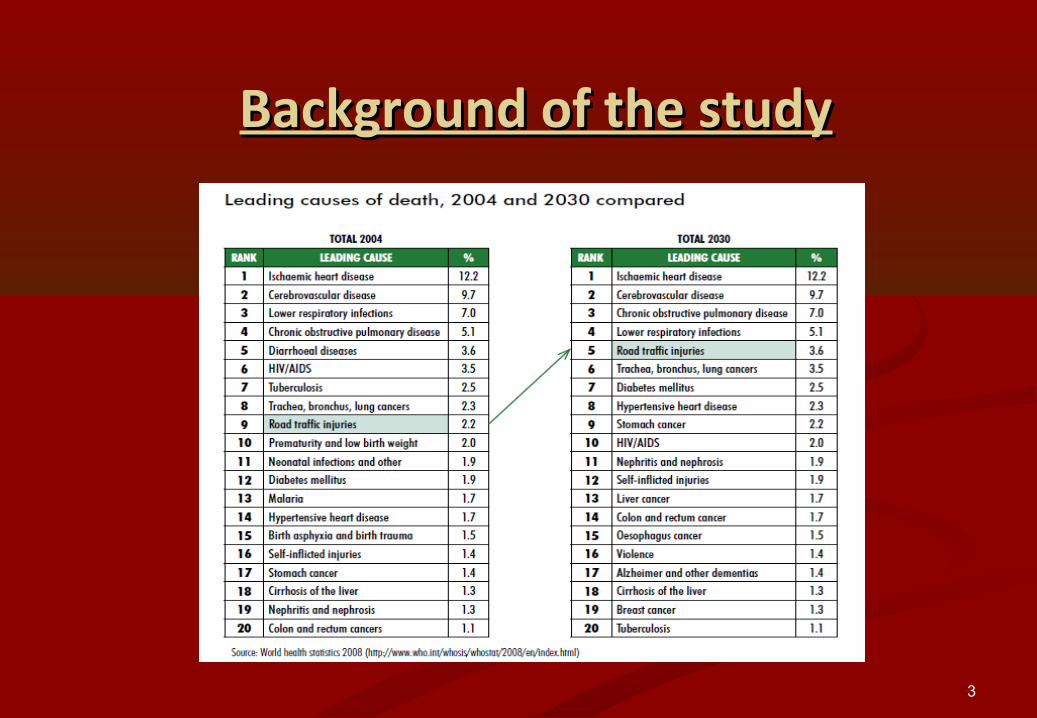
Background of the studyBackground of the study
3

Background of the studyBackground of the study Recent studies have shown an inverted U-shaped Recent studies have shown an inverted U-shaped
relationship between MVC deaths and economic growthrelationship between MVC deaths and economic growth
Per capita IncomePer capita Income
4
Background of the studyBackground of the study
Which means deaths increase as a country develops, Which means deaths increase as a country develops, but decline once per capita income levels have but decline once per capita income levels have exceeded a certain threshold level.exceeded a certain threshold level.
This inverted -U shaped relationship is similar to the This inverted -U shaped relationship is similar to the Kuznets curve(1955) existed between income Kuznets curve(1955) existed between income inequality and per capita income. inequality and per capita income.
5
Background of the studyBackground of the study
However, an important missing aspect of previous However, an important missing aspect of previous researches is that although they describe the inverted U-researches is that although they describe the inverted U-shaped relationship between MVC deaths and economic shaped relationship between MVC deaths and economic growth, there are no much studies done yet to examine growth, there are no much studies done yet to examine the relationship between the economic growth and non-the relationship between the economic growth and non-fatal MVC injuries by using cross-country panel data.fatal MVC injuries by using cross-country panel data.
6
Objectives of the studyObjectives of the study
In this study we examine:In this study we examine:
1.1. The empirical relationship between the MVC non-fatal The empirical relationship between the MVC non-fatal injuries and economic growth while controlling for other injuries and economic growth while controlling for other factors known to affect road traffic safety including total factors known to affect road traffic safety including total population, urban population growth, motorization, population, urban population growth, motorization, medical care and technology etc.medical care and technology etc.
2.2. The effect of political governance and policy measures on The effect of political governance and policy measures on MVC non-fatal injuries. MVC non-fatal injuries.
7

MethodologyMethodology
Since MVC injuries are count data which are limited to non-Since MVC injuries are count data which are limited to non-negative integer values and are positively skewed, the most negative integer values and are positively skewed, the most appropriate method to analysis this type of data are count appropriate method to analysis this type of data are count regression models such as:regression models such as:
The Poisson model and The Poisson model and The negative binomial modelThe negative binomial model
8

MethodologyMethodology Therefore; In this analysis a fixed effect negative binomial Therefore; In this analysis a fixed effect negative binomial
regression technique is used to account for over regression technique is used to account for over dispersion and heterogeneity of the data.dispersion and heterogeneity of the data.
To normalize the effect of risk exposure on MVC non fatal To normalize the effect of risk exposure on MVC non fatal injuries, we specify the log population as an offset injuries, we specify the log population as an offset variable in the regression model.variable in the regression model.
The statistical software used in this analysis is STATA 9.2The statistical software used in this analysis is STATA 9.2
9

Data source and descriptionData source and descriptionThe main sources of data in this study are:The main sources of data in this study are:
United Nations Economic Commissioner for Europe (UNECE). United Nations Economic Commissioner for Europe (UNECE). Royal Malaysian Police. Royal Malaysian Police. India Department of Road Transport and Highways. India Department of Road Transport and Highways. World Road Statistics database. World Road Statistics database. South Africa Department of Transport.South Africa Department of Transport.Penn World Table version 6.2Penn World Table version 6.2World Development IndicatorsWorld Development IndicatorsThe Center for Systemic Peace (CSP)-Polity IV The Center for Systemic Peace (CSP)-Polity IV
10
Data source and descriptionData source and description
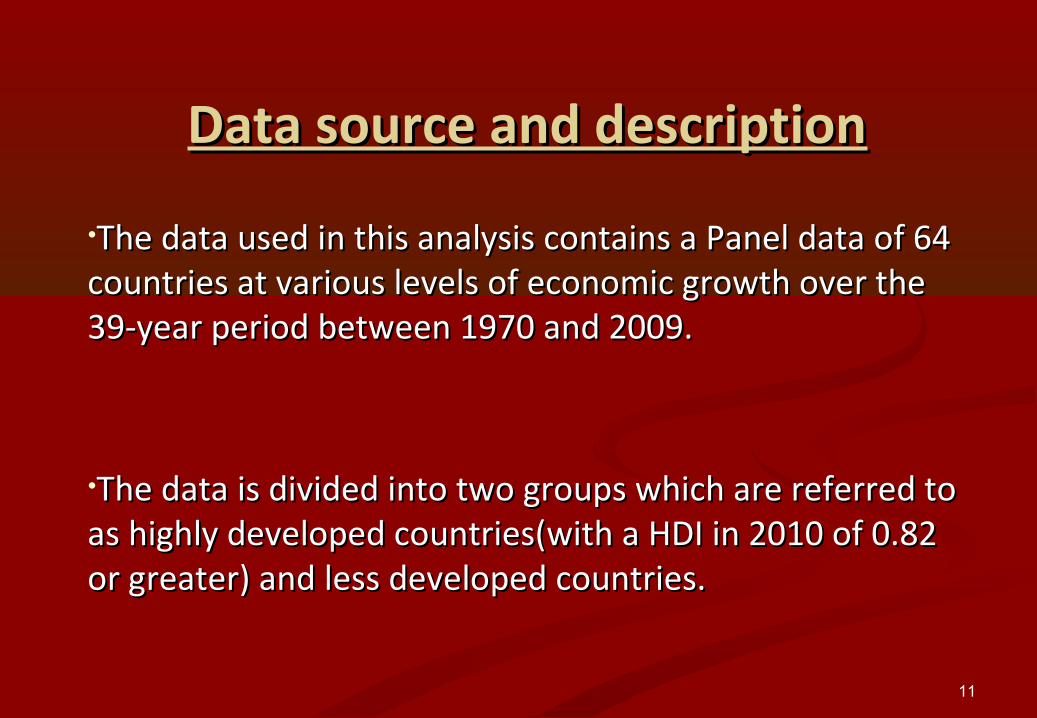
•The data used in this analysis contains a Panel data of 64 The data used in this analysis contains a Panel data of 64 countries at various levels of economic growth over the countries at various levels of economic growth over the 39-year period between 1970 and 2009.39-year period between 1970 and 2009.
•The data is divided into two groups which are referred to The data is divided into two groups which are referred to as highly developed countries(with a HDI in 2010 of 0.82 as highly developed countries(with a HDI in 2010 of 0.82 or greater) and less developed countries.or greater) and less developed countries.
11

Data source and descriptionData source and description
The proxy for per capita income used in this study is real Gross Domestic Product (GDP) per capita (US$ 2000 constant prices: Chain series). obtained from the Penn World Table version 6.2
12
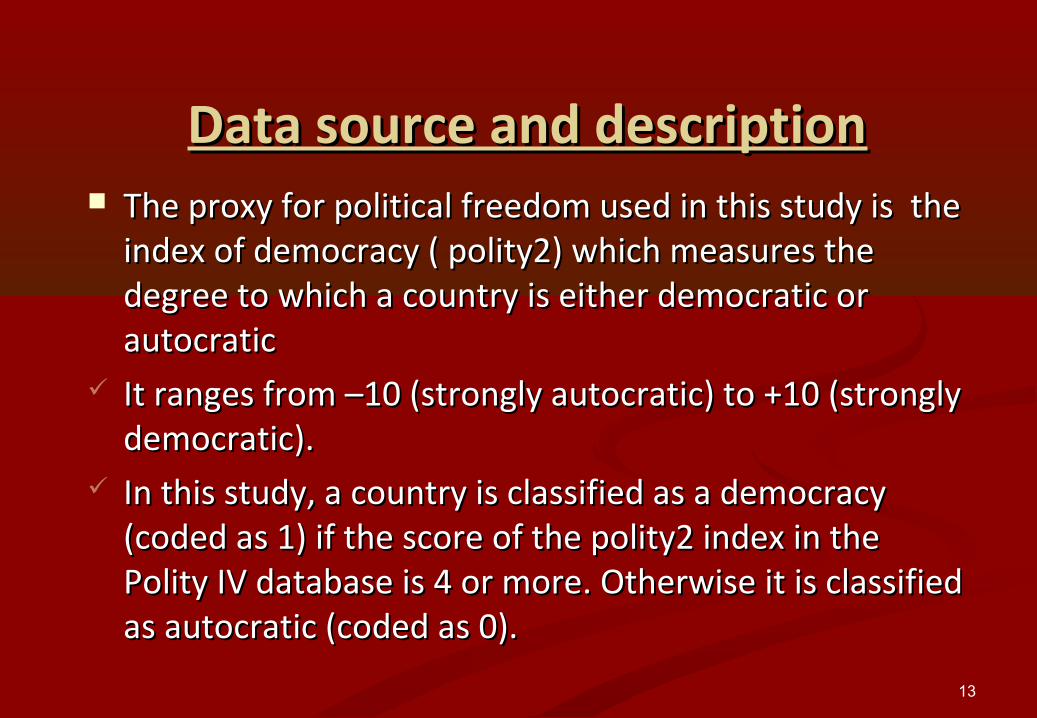
Data source and descriptionData source and description The proxy for political freedom used in this study is the The proxy for political freedom used in this study is the
index of democracy ( polity2) which measures the index of democracy ( polity2) which measures the degree to which a country is either democratic or degree to which a country is either democratic or autocraticautocratic
It ranges from –10 (strongly autocratic) to +10 (strongly It ranges from –10 (strongly autocratic) to +10 (strongly democratic).democratic).
In this study, a country is classified as a democracy In this study, a country is classified as a democracy (coded as 1) if the score of the polity2 index in the (coded as 1) if the score of the polity2 index in the Polity IV database is 4 or more. Otherwise it is classified Polity IV database is 4 or more. Otherwise it is classified as autocratic (coded as 0).as autocratic (coded as 0).
13

Data source and descriptionData source and description The second political variable used is the index of The second political variable used is the index of
Regime durability (Durable) which measures the Regime durability (Durable) which measures the number of years since the most recent regime change.number of years since the most recent regime change.
In calculating the DURABLE value, the first year during In calculating the DURABLE value, the first year during which a new (post-change) polity is established is which a new (post-change) polity is established is coded as the baseline "year zero" (value = 0) and each coded as the baseline "year zero" (value = 0) and each subsequent year adds one to the value of the DURABLE subsequent year adds one to the value of the DURABLE variable. variable.
14
Data source and descriptionData source and description
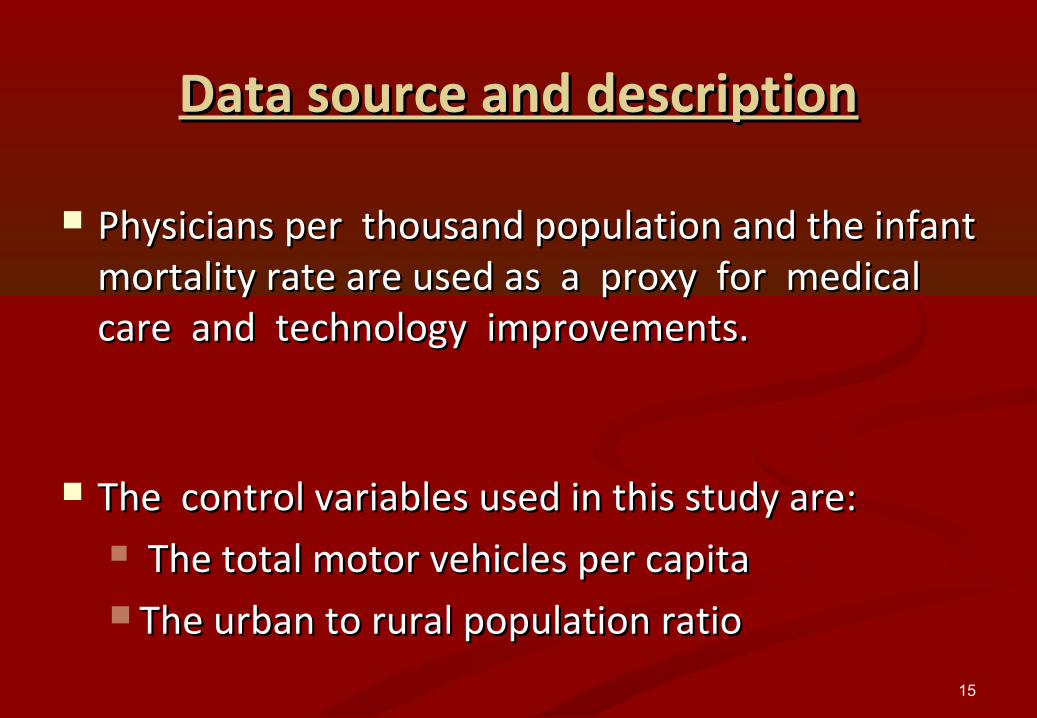
Physicians per thousand population and the infant Physicians per thousand population and the infant mortality rate are used as a proxy for medical mortality rate are used as a proxy for medical care and technology improvements.care and technology improvements.
The control variables used in this study are:The control variables used in this study are: The total motor vehicles per capitaThe total motor vehicles per capita The urban to rural population ratio The urban to rural population ratio
15

Data source and descriptionData source and description
Finally, this study also includes a time trend to capture the Finally, this study also includes a time trend to capture the effect of technological improvements and other effect of technological improvements and other unobserved effects that vary over time and affect the unobserved effects that vary over time and affect the number of MVC non-fatal injuries which are common to all number of MVC non-fatal injuries which are common to all countries.countries.
16

Results:Results:Result shows that the Kuznets curve (inverted U-shaped relationship) is present and statistically significant as shown in this figure for all countries.
50000.0040000.0030000.0020000.0010000.000.00
Income per capita
140.00
120.00
100.00
80.00
60.00
40.00
20.00
0.00
Tra
ffic
in
jury
ra
te
17

Results:Results:
The estimated results indicate that more vehicles per capita are associated with lower MVC injuries.
Because increased vehicle ownership will lead to traffic congestion in road infrastructure facilities and this traffic congestion will encourage people to travel more in public transit instead of private cars.
Traffic congestion will also lead less speeding of vehicles which will reduce accidents.
18
Results:Results:
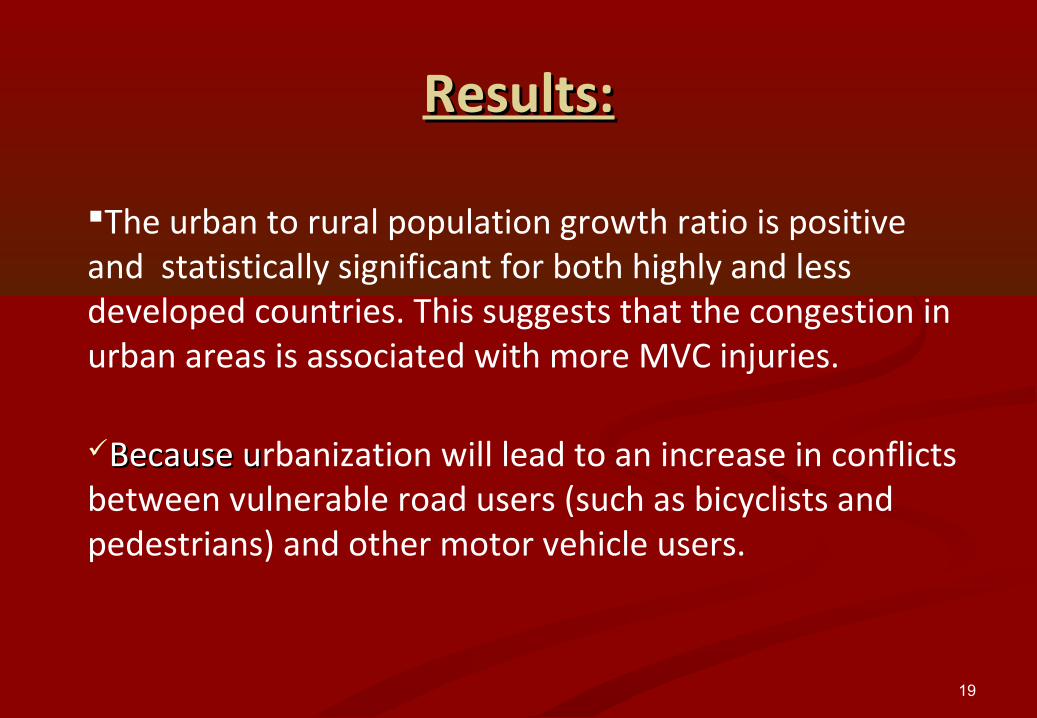
The urban to rural population growth ratio is positive and statistically significant for both highly and less developed countries. This suggests that the congestion in urban areas is associated with more MVC injuries.
Because uBecause urbanization will lead to an increase in conflicts between vulnerable road users (such as bicyclists and pedestrians) and other motor vehicle users.
19
Results:Results:
The coefficient of infant mortality rate, a proxy for medical technology, is positive and statistically significant.The positive sign suggests that a lower infant mortality rate is associated with lower MVC injuries.
The estimated coefficient for physicians per thousand capita is positive and statistically significant, suggesting that an increase in the ratio of per capita physicians is not associated with fewer MVC injuries.
20
Results:Results:
Regarding the democracy variable, it is positive and statistically significant, which suggests that high political democracy is associated with higher MVC injuries.
Because a more democratic type of government tends to have slower growth of highway systems and also their paved road systems are in slightly worse condition.
21
Results:Results:
Also a higher level of political freedom is associated with greater economic growth and that, in turn, would lead to an increase in mobility and a higher demand for transport services
22

Results:Results:
For the regime durability variable, it is positive andstatistically significant, which suggest that high regime durability is associated with higher MVC injuries
Because if a government stays in power for long term, it can be associated with corruption system or misuse of public funds which hampers to implement the necessary road safety measures.
23

Results:Results:
The time trend variable is negatively and significantly associated with MVC injuries, thus indicating that other road safety related variables such as vehicle design, road design, driver behavior etc have changed over time.
24

Results:Results:ln(λit) = α0 + ln(populationit ) +β1ln(rgdpchit) +
β2 (ln(rgdpchit))2 + β3 Iit + β4 Mit + β5 Xit +β6 (Time)+εit
Where:λit : the expected value of the number of MVC injuries for country i in period t, rgdpch: Real GDP (US$ 2000 constant prices: Chain series)Iit : institutional variablesMit : Medical technology and care variablesXit : Other control variables 25
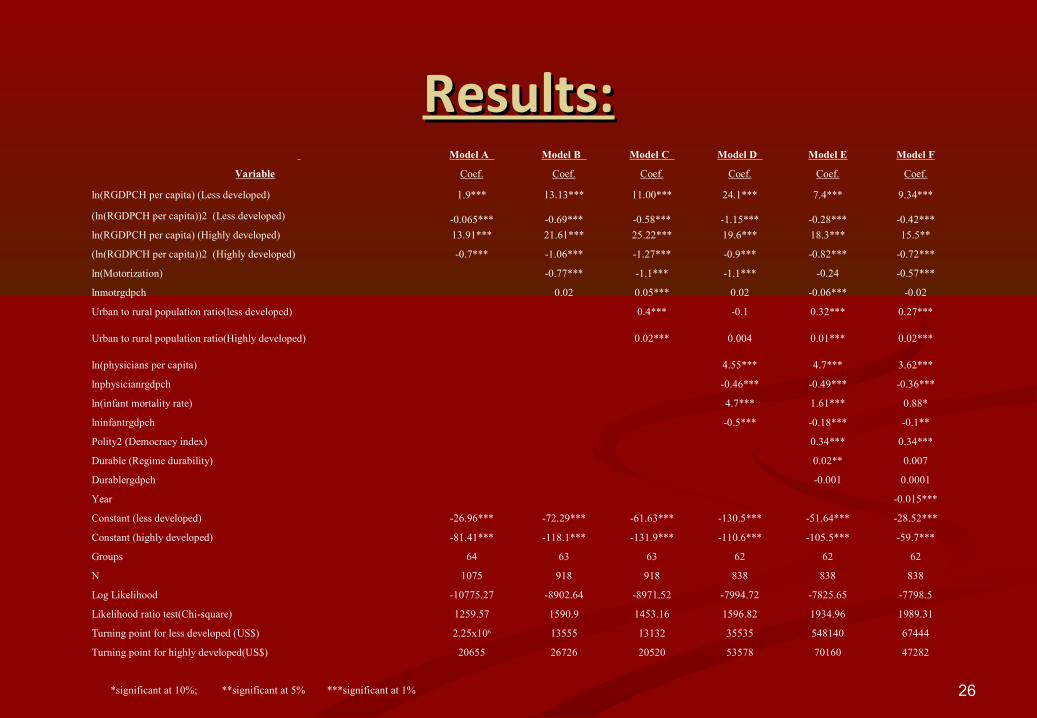
Results:Results: Model A Model B Model C Model D Model E Model F
Variable Coef. Coef. Coef. Coef. Coef. Coef.
ln(RGDPCH per capita) (Less developed) 1.9*** 13.13*** 11.00*** 24.1*** 7.4*** 9.34***
(ln(RGDPCH per capita))2 (Less developed) -0.065*** -0.69*** -0.58*** -1.15*** -0.28*** -0.42***
ln(RGDPCH per capita) (Highly developed) 13.91*** 21.61*** 25.22*** 19.6*** 18.3*** 15.5**
(ln(RGDPCH per capita))2 (Highly developed) -0.7*** -1.06*** -1.27*** -0.9*** -0.82*** -0.72***
ln(Motorization) -0.77*** -1.1*** -1.1*** -0.24 -0.57***
lnmotrgdpch 0.02 0.05*** 0.02 -0.06*** -0.02
Urban to rural population ratio(less developed) 0.4*** -0.1 0.32*** 0.27***
Urban to rural population ratio(Highly developed) 0.02*** 0.004 0.01*** 0.02***
ln(physicians per capita) 4.55*** 4.7*** 3.62***
lnphysicianrgdpch -0.46*** -0.49*** -0.36***
ln(infant mortality rate) 4.7*** 1.61*** 0.88*
lninfantrgdpch -0.5*** -0.18*** -0.1**
Polity2 (Democracy index) 0.34*** 0.34***
Durable (Regime durability) 0.02** 0.007
Durablergdpch -0.001 0.0001
Year -0.015***
Constant (less developed) -26.96*** -72.29*** -61.63*** -130.5*** -51.64*** -28.52***
Constant (highly developed) -81.41*** -118.1*** -131.9*** -110.6*** -105.5*** -59.7***
Groups 64 63 63 62 62 62
N 1075 918 918 838 838 838
Log Likelihood -10775.27 -8902.64 -8971.52 -7994.72 -7825.65 -7798.5
Likelihood ratio test(Chi-square) 1259.57 1590.9 1453.16 1596.82 1934.96 1989.31
Turning point for less developed (US$) 2.25x10⁶ 13555 13132 35535 548140 67444
Turning point for highly developed(US$) 20655 26726 20520 53578 70160 47282
*significant at 10%; **significant at 5% ***significant at 1% 26

ConclusionConclusion
Finally, we hope and expect that the findings of this study will be very useful source of information for the governments and other road safety practitioners to apply for mitigating MVC injuries.
27
RecommendationsRecommendations
The recommendations made by this study are as follows:
The economic growth is a significant factor of reducing MVC injuries. The urban population growth is a potential factor of increasing the MVC injuries. So, it is better to segregate vulnerable road users from motorized traffic.
28

RecommendationsRecommendations
The vehicle population growth is good for mitigating the MVC injuries. The democratic political system is not good for mitigating the MVC injuries.
The long regime durability is not good for mitigating the MVC injuries. .
29

30