présentation olivier biau random forests et conjoncture
TRANSCRIPT

Euro area GDP forecasting using Euro area GDP forecasting using large survey datasetslarge survey datasetsA random forest approachA random forest approach
Olivier Biau – Angela D’EliaOlivier Biau – Angela D’EliaDirectorate General for Economic and Financial AffairsDirectorate General for Economic and Financial Affairs
European CommissionEuropean Commission
Groupe Travail prévisionGroupe Travail prévision
Paris, 12 May 2010Paris, 12 May 2010
Views expressed represent exclusively the positions of the authors and do not necessarily correspond to those of the European Commission

IntroductionIntroduction Increasing interest in forecasting methods that Increasing interest in forecasting methods that
utilise large datasetsutilise large datasets
Not only an issue of academic interest Not only an issue of academic interest Eklund and Kapetanios, 2008Eklund and Kapetanios, 2008
Factor methods in the forefront of Factor methods in the forefront of developmentsdevelopmentsStock and Watson, 2002; Forni Stock and Watson, 2002; Forni et al.et al., 2005; Giannone , 2005; Giannone et al.et al., 2008 , 2008
Factor analysis combined with linear modellingFactor analysis combined with linear modelling

IntroductionIntroduction A new statistical approach to forecasting A new statistical approach to forecasting
macro-economic aggregates, based on the macro-economic aggregates, based on the Random Forests technique Random Forests technique Breiman, 2001, 2002Breiman, 2001, 2002
RF algorithm is widely applied in medical RF algorithm is widely applied in medical research and biological studies, becomes more research and biological studies, becomes more and more popular and appears to be very and more popular and appears to be very powerfulpowerful
Arun and Langmead, 2006; Díaz-Uriarte and Alvarez de Andrés, 2006; Arun and Langmead, 2006; Díaz-Uriarte and Alvarez de Andrés, 2006; Ward Ward et alet al., 2006., 2006
RF is largely unknown in economicsRF is largely unknown in economicsBiau. G, Biau. O and Rouvière, 2007Biau. G, Biau. O and Rouvière, 2007

IntroductionIntroduction RF enjoys good prediction properties, is robust RF enjoys good prediction properties, is robust
to noise and can handle a very large number of to noise and can handle a very large number of input variables input variables
RF is considered to be one of the most accurate RF is considered to be one of the most accurate general-purpose learning techniques available, general-purpose learning techniques available, independent of any functional and independent of any functional and distributional assumptionsdistributional assumptions
However, from a mathematical point of view, However, from a mathematical point of view, the mechanism of RF algorithms remains the mechanism of RF algorithms remains largely unknown and is not clearly explainedlargely unknown and is not clearly explained Breiman, 2002; Lin and Jeon, 2006; Biau. G Breiman, 2002; Lin and Jeon, 2006; Biau. G et al.et al., 2008,, 2008, Biau. G and Devroye, 2008; Biau. G, 2010Biau. G and Devroye, 2008; Biau. G, 2010

IntroductionIntroduction A specific application for short-term GDP forecasting A specific application for short-term GDP forecasting
in the euro area is shown using (in the euro area is shown using (onlyonly) the harmonized ) the harmonized European Union Business and Consumer surveys European Union Business and Consumer surveys datasetdataset
A typical high-dimensional regression problem (A typical high-dimensional regression problem (n n << << pp))
The RF technique is explored with two aims in mind:The RF technique is explored with two aims in mind:1.1. to obtain a non-parametric forecast of GDPto obtain a non-parametric forecast of GDP2. 2. to obtain a ranking of the explanatory variables, to obtain a ranking of the explanatory variables,
and then select those variables to build a linear model to and then select those variables to build a linear model to forecast GDPforecast GDP
The forecast performance is assessed through an out-The forecast performance is assessed through an out-of-sample exerciseof-sample exercise

OutlineOutline
DG ECFINDG ECFIN
Data: Joint Harmonised EU Programme of Data: Joint Harmonised EU Programme of BCSBCS
RF algorithmRF algorithm
BenchmarkBenchmark
ResultsResults

DG ECFIN: mission DG ECFIN: mission statementstatementThe mission of the Directorate-General for Economic and
Financial Affairs is to contribute to raising the economic welfare of the citizens in the European Union and beyond, notably by developing and promoting policies that ensure sustainable economic growth, a high level of employment, stable public finances and financial stability.
At the present juncture, this means working to ensure that the
European economy emerges quickly and strongly from the present
deep economic and financial crisis. We do this by helping to find the right policy-mix for overcoming the economic and financial crisis and for the EU economy to significantly reduce unemployment and to attain a sustainable growth and convergence in living standards in a stable
financial and social environment.

DataData Based on the Joint Harmonized EU Programme of Based on the Joint Harmonized EU Programme of
Business and Consumer Surveys (manufacturing Business and Consumer Surveys (manufacturing industry, services, retail trade, construction, industry, services, retail trade, construction, and consumers)and consumers)
Qualitative surveys Qualitative surveys
It covers all the 27 Members States, Croatia, the It covers all the 27 Members States, Croatia, the FYROM and TurkeyFYROM and Turkey
More than 125 000 firms and over 40 000 More than 125 000 firms and over 40 000 consumers surveyed every monthconsumers surveyed every month
Data dowloadable from DG ECFIN website Data dowloadable from DG ECFIN website

DataData The dataset mainly consists of the euro area balances The dataset mainly consists of the euro area balances
of opinion (%positive - %negative)of opinion (%positive - %negative)
The time series used in the analysis are those available The time series used in the analysis are those available at the end of the third month of each quarter:at the end of the third month of each quarter: the level series: monthly the level series: monthly St St or quarterlyor quarterly Sq Sq, , the difference series: (the difference series: (St St - - St-1St-1), (), (St St - - St-2St-2), (), (St St - - St-3St-3)) and (and (Sq Sq - -
Sq-1Sq-1))
The dataset is composed of The dataset is composed of pp = 172 ‘soft’ series: = 172 ‘soft’ series: XXii
The only ‘hard’ variable is the euro area GDP qoq The only ‘hard’ variable is the euro area GDP qoq growth series: growth series: YYii
Finally, we have a « learning set » Finally, we have a « learning set » LL={(={(XX11,,YY11) … () … (XXnn,,YYnn)} )} n=57 (1995Q3 - 2009Q3) n=57 (1995Q3 - 2009Q3)

From binary trees From binary trees to Random Forestto Random Forest What is a binary tree?What is a binary tree?
How to grow a tree?How to grow a tree?
What is the tree predictor (or tree What is the tree predictor (or tree regressor)?regressor)?

How to grow a tree? with How to grow a tree? with CARTCARTHow to predict the income of a newcomer (entering the room) How to predict the income of a newcomer (entering the room)
based on observed characteristics based on observed characteristics XXii (gender, size, weight, age, (gender, size, weight, age, …) and income …) and income YYii of people attending the conference? of people attending the conference?
For the first node, we seek the first splitting variable For the first node, we seek the first splitting variable X X j j and the first split and the first split point point s s which discriminate the most, by solving:which discriminate the most, by solving:
For any choice For any choice jj and and ss, the inner minimization is solved by:, the inner minimization is solved by:
Having found the best split, we partition the data into the two resulting Having found the best split, we partition the data into the two resulting regions and repeat the splitting process regions and repeat the splitting process until each node reaches a user-until each node reaches a user-specified minimum specified minimum nodesize nodesize and becomes a terminal nodeand becomes a terminal node
][][ 21 sXNandsXNwhere jj
)/( iii NiYaveragec

What is the tree What is the tree predictor?predictor?
Once the tree is built, a new Once the tree is built, a new X X arrives…arrives…
… … it ‘falls’ into a terminal node N(X),it ‘falls’ into a terminal node N(X),
… … the tree regressor the tree regressor h(X) h(X) is computed by averaging is computed by averaging the observed the observed YYi i over the observations over the observations i i ‘falling’ in ‘falling’ in that node:that node:
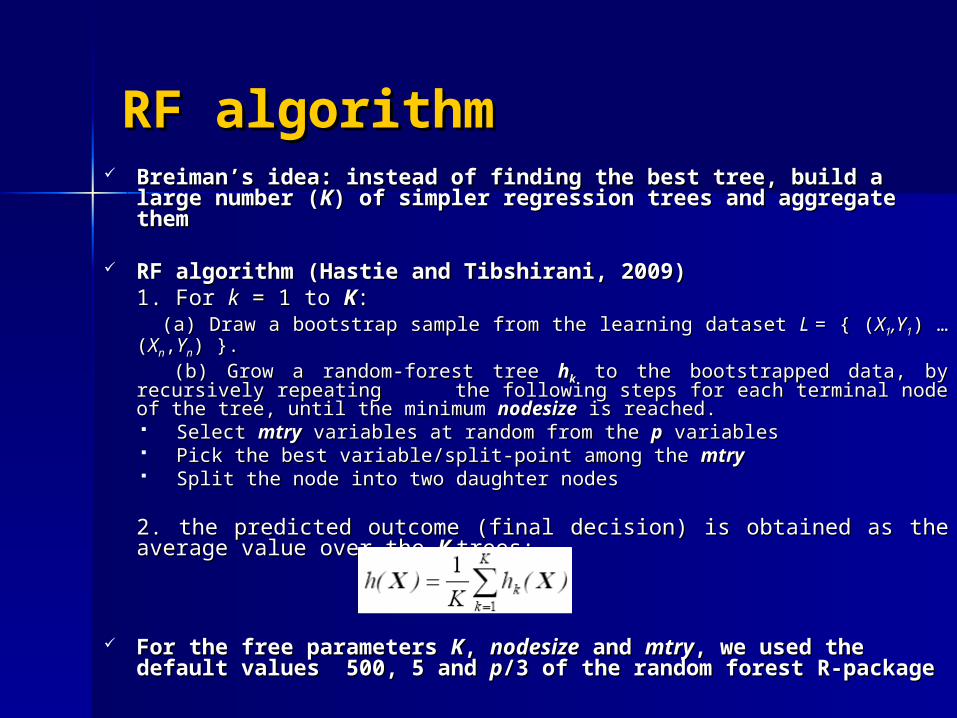
RF algorithmRF algorithm Breiman’s idea: instead of finding the best tree, build a large Breiman’s idea: instead of finding the best tree, build a large
number (number (KK) of simpler regression trees and aggregate them) of simpler regression trees and aggregate them
RF algorithm (Hastie and Tibshirani, 2009) RF algorithm (Hastie and Tibshirani, 2009) 1. For 1. For kk = 1 to = 1 to KK:: (a) Draw a bootstrap sample from the learning dataset (a) Draw a bootstrap sample from the learning dataset L L = { (= { (XX11,Y,Y11) … () … (XXnn,,YYnn) ) }.}. (b) Grow a random-forest tree (b) Grow a random-forest tree hhkk to the bootstrapped data, by recursively to the bootstrapped data, by recursively repeating the following steps for each terminal node of the tree, until the repeating the following steps for each terminal node of the tree, until the minimum minimum nodesizenodesize is reached. is reached. Select Select mtrymtry variables at random from the variables at random from the pp variables variables Pick the best variable/split-point among the Pick the best variable/split-point among the mtrymtry Split the node into two daughter nodesSplit the node into two daughter nodes
2. the predicted outcome (final decision) is obtained as the average 2. the predicted outcome (final decision) is obtained as the average value over the value over the KK trees:trees:
For the free parameters For the free parameters KK, , nodesizenodesize and and mtrymtry, we used the , we used the default values 500, 5 and default values 500, 5 and pp/3 of the random forest R-package/3 of the random forest R-package

RF algorithmRF algorithm
RF posses one important feature to reduce RF posses one important feature to reduce data dimensionalitydata dimensionality
Breiman (2001) suggests a measure called Breiman (2001) suggests a measure called ‘variable importance’ to discriminate between ‘variable importance’ to discriminate between informative and noninformative variablesinformative and noninformative variables
For each variable, the idea is to compare the For each variable, the idea is to compare the prediction error with the prediction error prediction error with the prediction error where the variable is randomly permutedwhere the variable is randomly permuted Large positive values for a variable indicate that this Large positive values for a variable indicate that this
variable is predictivevariable is predictive zero or negative importance values indicate non-predictive zero or negative importance values indicate non-predictive
variablesvariables

BenchmarkBenchmark We predict GDP growth for quarter Q (nowcast), based We predict GDP growth for quarter Q (nowcast), based
on data available at the end on quarter Qon data available at the end on quarter Q
Out-of-sample analysis: Out-of-sample analysis: 2004Q1-2009Q3, using GDP vintage data2004Q1-2009Q3, using GDP vintage data Criterion: Mean Square Error (MSE)Criterion: Mean Square Error (MSE)
Two competitors:Two competitors: AR modelAR model euro zone economic outlookeuro zone economic outlook
Quarterly publication, published in the first days of quarter Q+1Quarterly publication, published in the first days of quarter Q+1 Nowcast (Q), 2-steps-ahead projections (Q+1 and Q+2) for GDP, IP, Nowcast (Q), 2-steps-ahead projections (Q+1 and Q+2) for GDP, IP,
Cons., Inflation Cons., Inflation But also economic links explaining these forecastsBut also economic links explaining these forecasts
How does a data-driven model like the RF perform How does a data-driven model like the RF perform relative to competitors for GDP nowcasting?relative to competitors for GDP nowcasting?


Results (1)Results (1)RF: pure Random ForestRF: pure Random Forest
RF outperforms the AR but not the RF outperforms the AR but not the euro zone economic outlookeuro zone economic outlook Good performance of RF before the crisisGood performance of RF before the crisis Poor performance during the crisis… however, by construction!Poor performance during the crisis… however, by construction!

Results (2)Results (2)
To square the problem of non negative To square the problem of non negative values in the learning set, a two steps values in the learning set, a two steps procedure:procedure:
Step 1: Select the 25 most Step 1: Select the 25 most important variablesimportant variables (RF (RF feature)feature)

Results (2)Results (2)
Step 2: Choose the « best » linear model to Step 2: Choose the « best » linear model to explain GDP (Gets algorithm)explain GDP (Gets algorithm)
RF_LINMOD: model retainedRF_LINMOD: model retained
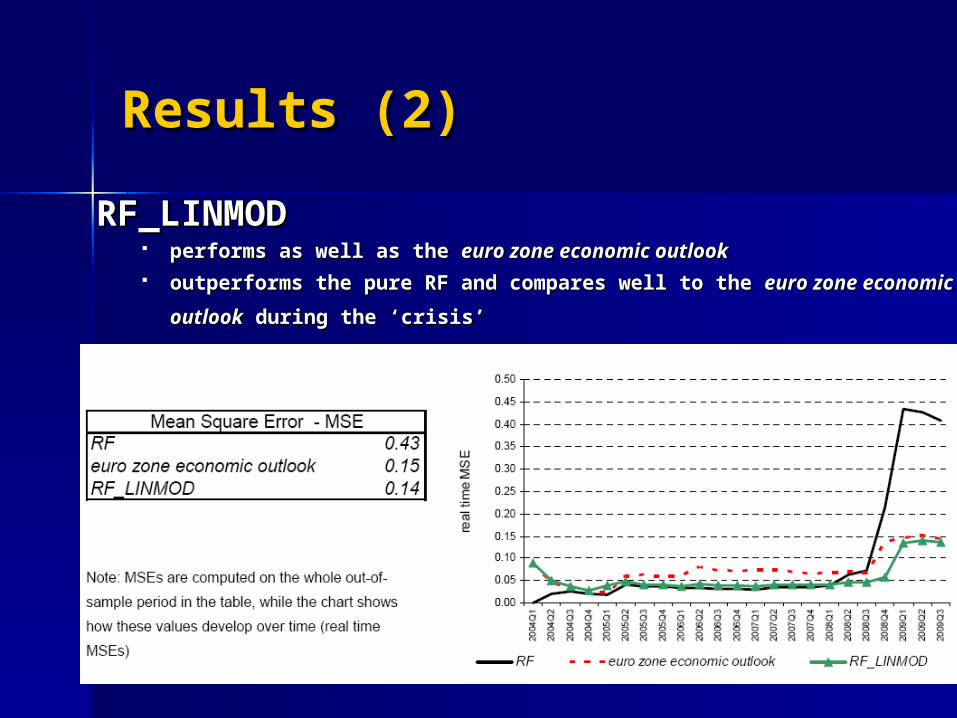
Results (2)Results (2)RF_LINMODRF_LINMOD
performs as well as the performs as well as the euro zone economic outlookeuro zone economic outlook outperforms the pure RF and compares well to the outperforms the pure RF and compares well to the euro zone euro zone
economic outlookeconomic outlook during the ‘crisis during the ‘crisis’’

ConclusionConclusion RF: a new approach for short-term analysisRF: a new approach for short-term analysis
to forecast macroeconomic variablesto forecast macroeconomic variables to reduce data dimensionalityto reduce data dimensionality
RF is fast and easy to implementRF is fast and easy to implement
RF outperforms AR and compares well with RF outperforms AR and compares well with reliable forecastsreliable forecasts
RF is worth adding to the economists’ toolboxRF is worth adding to the economists’ toolbox