presentation of site investigation results …afisher/post/kt/conepenetrationreport-kelly... ·...
TRANSCRIPT
PRESENTATION OF SITE INVESTIGATION RESULTS
UCSC
Prepared for:
Kelly Thompson Ranch
CPT Inc. Job No: 15-56021 --
Project Start Date: 12-Nov-2015 Project End Date: 12-Nov-2015
Report Date: 19-Nov-2015
Prepared by:
California Push Technologies Inc. 820 Aladdin Avenue
San Leandro, CA 94577 -
Tel: (510) 357-3677
Email: [email protected] www.cptinc.com
Kelly Thompson Ranch
Introduction The enclosed report presents the results of the site investigation program conducted by CPT Inc. for UCSC at the Kelly Thompson Ranch. The program consisted of 6 cone penetration tests (CPT). Project Information
Project
Client UCSC
Project Kelly Thompson Ranch
CPT Inc. project number 15-56021
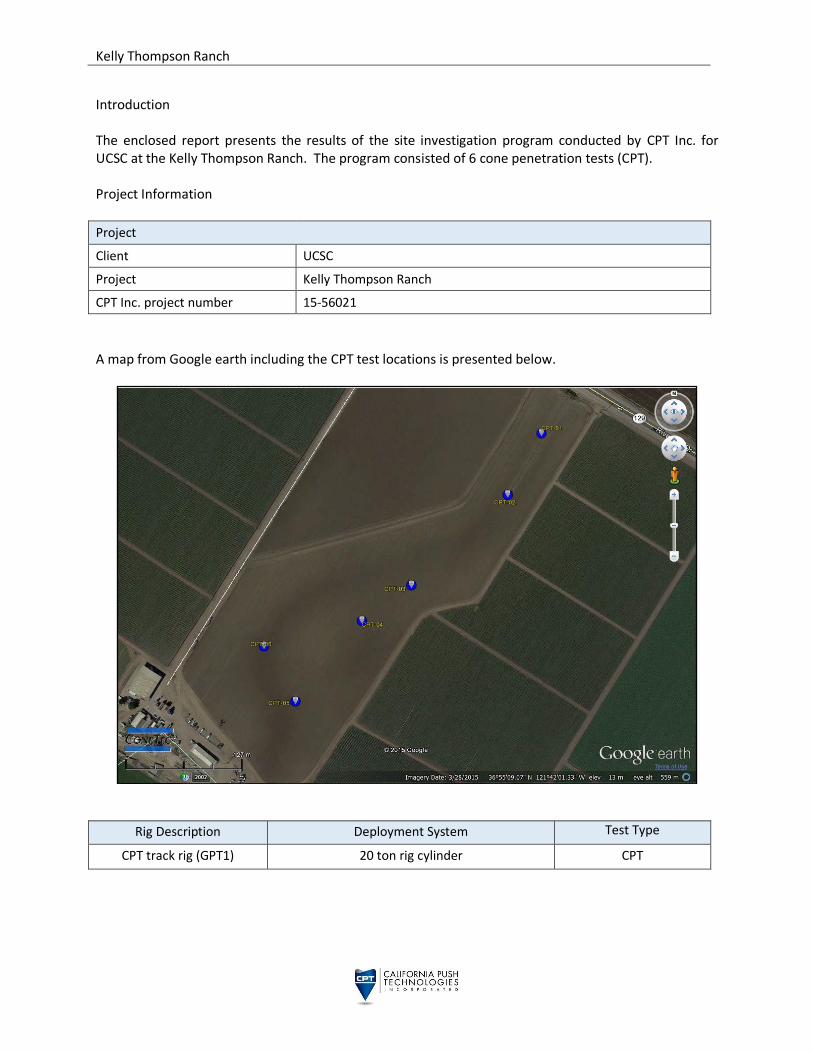
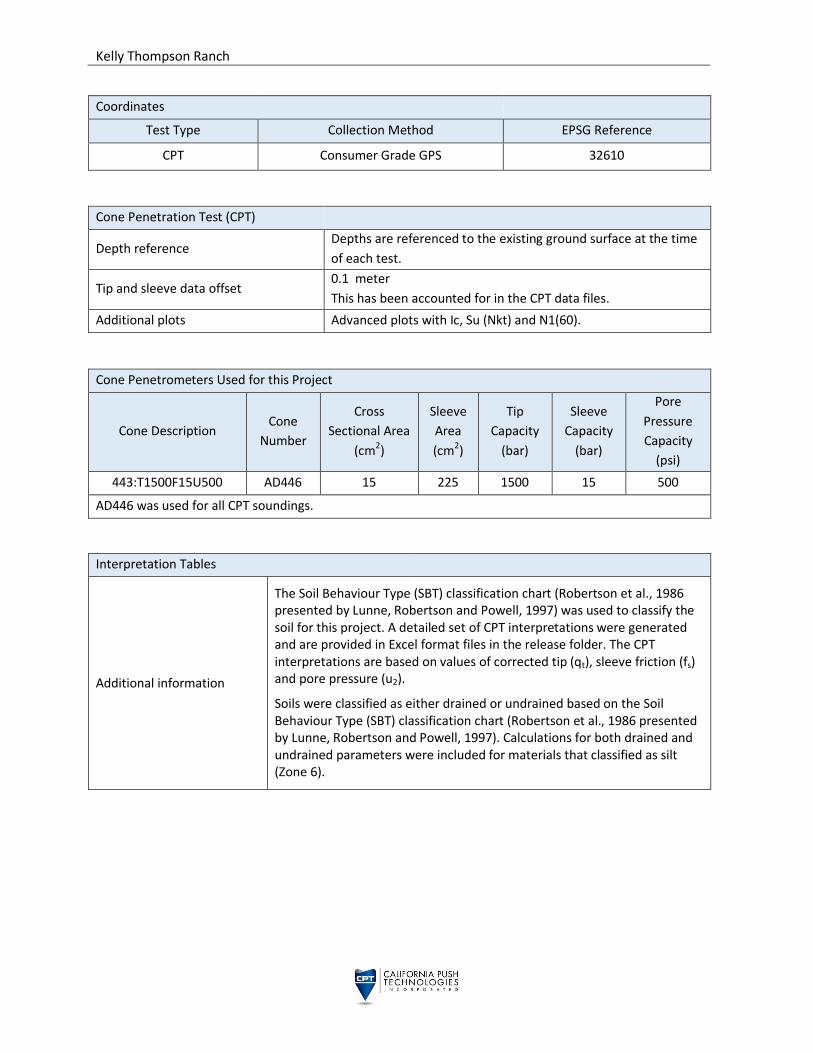
A map from Google earth including the CPT test locations is presented below.
Rig Description Deployment System Test Type
CPT track rig (GPT1) 20 ton rig cylinder CPT
Kelly Thompson Ranch
Coordinates
Test Type Collection Method EPSG Reference
CPT Consumer Grade GPS 32610
Cone Penetration Test (CPT)
Depth reference Depths are referenced to the existing ground surface at the time
of each test.
Tip and sleeve data offset 0.1 meter
This has been accounted for in the CPT data files.
Additional plots Advanced plots with Ic, Su (Nkt) and N1(60).
Cone Penetrometers Used for this Project
Cone Description Cone
Number
Cross
Sectional Area
(cm2)
Sleeve
Area
(cm2)
Tip
Capacity
(bar)
Sleeve
Capacity
(bar)
Pore
Pressure
Capacity
(psi)
443:T1500F15U500 AD446 15 225 1500 15 500
AD446 was used for all CPT soundings.
Interpretation Tables
Additional information
The Soil Behaviour Type (SBT) classification chart (Robertson et al., 1986 presented by Lunne, Robertson and Powell, 1997) was used to classify the soil for this project. A detailed set of CPT interpretations were generated and are provided in Excel format files in the release folder. The CPT interpretations are based on values of corrected tip (qt), sleeve friction (fs) and pore pressure (u2).
Soils were classified as either drained or undrained based on the Soil Behaviour Type (SBT) classification chart (Robertson et al., 1986 presented by Lunne, Robertson and Powell, 1997). Calculations for both drained and undrained parameters were included for materials that classified as silt (Zone 6).

Kelly Thompson Ranch
Limitations This report has been prepared for the exclusive use of UCSC (Client) for the project titled “Kelly Thompson Ranch”. The report’s contents may not be relied upon by any other party without the express written permission of CPT Inc. CPT Inc. has provided site investigation services, prepared the factual data reporting, and provided geotechnical parameter calculations consistent with current best practices. No other warranty, expressed or implied, is made. The information presented in the report document and the accompanying data set pertain to the specific project, site conditions and objectives described to CPT Inc. by the Client. In order to properly understand the factual data, assumptions and calculations, reference must be made to the documents provided and their accompanying data sets, in their entirety.
CONE PENETRATION TEST
The cone penetration tests (CPTu) are conducted using an integrated electronic piezocone penetrometer and data acquisition system manufactured by Adara Systems Ltd. of Richmond, British Columbia, Canada. CPT Inc.’s piezocone penetrometers are compression type designs in which the tip and friction sleeve load cells are independent and have separate load capacities. The piezocones use strain gauged load cells for tip and sleeve friction and a strain gauged diaphragm type transducer for recording pore pressure. The piezocones also have a platinum resistive temperature device (RTD) for monitoring the temperature of the sensors, an accelerometer type dual axis inclinometer and a geophone sensor for recording seismic signals. All signals are amplified down hole within the cone body and the analog signals are sent to the surface through a shielded cable. The penetrometers are manufactured with various tip, friction and pore pressure capacities in both 10 cm2 and 15 cm2 tip base area configurations in order to maximize signal resolution for various soil conditions. The specific piezocone used for each test is described in the CPT summary table presented in the first appendix. The 15 cm2 penetrometers do not require friction reducers as they have a diameter larger than the deployment rods. The 10 cm2 piezocones use a friction reducer consisting of a rod adapter extension behind the main cone body with an enlarged cross sectional area (typically 44 mm diameter over a length of 32 mm with tapered leading and trailing edges) located at a distance of 585 mm above the cone tip. The penetrometers are designed with equal end area friction sleeves, a net end area ratio of 0.8 and cone tips with a 60 degree apex angle. All piezocones can record pore pressure at various locations. Unless otherwise noted, the pore pressure filter is located directly behind the cone tip in the “u2” position (ASTM Type 2). The filter is 6 mm thick, made of porous plastic (polyethylene) having an average pore size of 125 microns (90-160 microns). The function of the filter is to allow rapid movements of extremely small volumes of water needed to activate the pressure transducer while preventing soil ingress or blockage. The piezocone penetrometers are manufactured with dimensions, tolerances and sensor characteristics that are in general accordance with the current ASTM D5778 standard. Our calibration criteria also meet or exceed those of the current ASTM D5778 standard. An illustration of the piezocone penetrometer is presented in Figure CPTu.

CONE PENETRATION TEST
Figure CPTu. Piezocone Penetrometer (15 cm2)
The data acquisition systems consist of a Windows based computer and a signal conditioner and power supply interface box with a 16 bit (or greater) analog to digital (A/D) converter. The data is recorded at fixed depth increments using a depth wheel attached to the push cylinders or by using a spring loaded rubber depth wheel that is held against the cone rods. The typical recording intervals are either 2.5 cm or 5.0 cm depending on project requirements; custom recording intervals are possible. The system displays the CPTu data in real time and records the following parameters to a storage media during penetration:
Depth
Uncorrected tip resistance (qc)
Sleeve friction (fs)
Dynamic pore pressure (u)
Additional sensors such as resistivity, passive gamma, ultra violet induced fluorescence, if applicable
All testing is performed in accordance to CPT Inc.’s CPT operating procedures which are in general accordance with the current ASTM D5778 standard.

CONE PENETRATION TEST
Prior to the start of a CPTu sounding a suitable cone is selected, the cone and data acquisition system are powered on, the pore pressure system is saturated with either glycerin or silicone oil and the baseline readings are recorded with the cone hanging freely in a vertical position. The CPTu is conducted at a steady rate of 2 cm/s, within acceptable tolerances. Typically one meter length rods with an outer diameter of 1.5 inches are added to advance the cone to the sounding termination depth. After cone retraction final baselines are recorded. Additional information pertaining to CPT Inc.’s cone penetration testing procedures:
Each filter is saturated in silicone oil or glycerin under vacuum pressure prior to use
Recorded baselines are checked with an independent multi-meter
Baseline readings are compared to previous readings
Soundings are terminated at the client’s target depth or at a depth where an obstruction is encountered, excessive rod flex occurs, excessive inclination occurs, equipment damage is likely to take place, or a dangerous working environment arises
Differences between initial and final baselines are calculated to ensure zero load offsets have not occurred and to ensure compliance with ASTM standards
The interpretation of the piezocone data and associated calculated parameters for this report are based on the corrected tip resistance (qt), sleeve friction (fs) and pore water pressure (u). The interpretation of soil type is based on the correlations developed by Robertson (1990) and Robertson (2009). It should be noted that it is not always possible to accurately identify a soil type based on these parameters. In these situations, experience, judgment and an assessment of other parameters may be used to infer soil behavior type. The recorded tip resistance (qc) is the total force acting on the piezocone tip divided by its base area. The tip resistance is corrected for pore pressure effects and termed corrected tip resistance (qt) according to the following expression presented in Robertson et al, 1986:
qt = qc + (1-a) • u2
where: qt is the corrected tip resistance qc is the recorded tip resistance u2 is the recorded dynamic pore pressure behind the tip (u2 position) a is the Net Area Ratio for the piezocone (0.8 for CPT Inc. probes)
The sleeve friction (fs) is the frictional force on the sleeve divided by its surface area. As all CPT Inc. piezocones have equal end area friction sleeves, pore pressure corrections to the sleeve data are not required. The dynamic pore pressure (u) is a measure of the pore pressures generated during cone penetration. To record equilibrium pore pressure, the penetration must be stopped to allow the dynamic pore pressures to stabilize. The rate at which this occurs is predominantly a function of the permeability of the soil and the diameter of the cone.

CONE PENETRATION TEST
The friction ratio (Rf) is a calculated parameter. It is defined as the ratio of sleeve friction to the tip resistance expressed as a percentage. Generally, saturated cohesive soils have low tip resistance, high friction ratios and generate large excess pore water pressures. Cohesionless soils have higher tip resistances, lower friction ratios and do not generate significant excess pore water pressure. A summary of the CPTu soundings along with test details and individual plots are provided in the appendices. A set of files with calculated geotechnical parameters were generated for each sounding based on published correlations and are provided in Excel format in the data release folder. Information regarding the methods used is also included in the data release folder. For additional information on CPTu interpretations and calculated geotechnical parameters, refer to Robertson et al. (1986), Lunne et al. (1997), Robertson (2009), Mayne (2013, 2014) and Mayne and Peuchen (2012).

PORE PRESSURE DISSIPATION TEST
The cone penetration test is halted at specific depths to carry out pore pressure dissipation (PPD) tests, shown in Figure PPD-1. For each dissipation test the cone and rods are decoupled from the rig and the data acquisition system measures and records the variation of the pore pressure (u) with time (t).
Figure PPD-1. Pore pressure dissipation test setup
Pore pressure dissipation data can be interpreted to provide estimates of ground water conditions, permeability, consolidation characteristics and soil behavior.
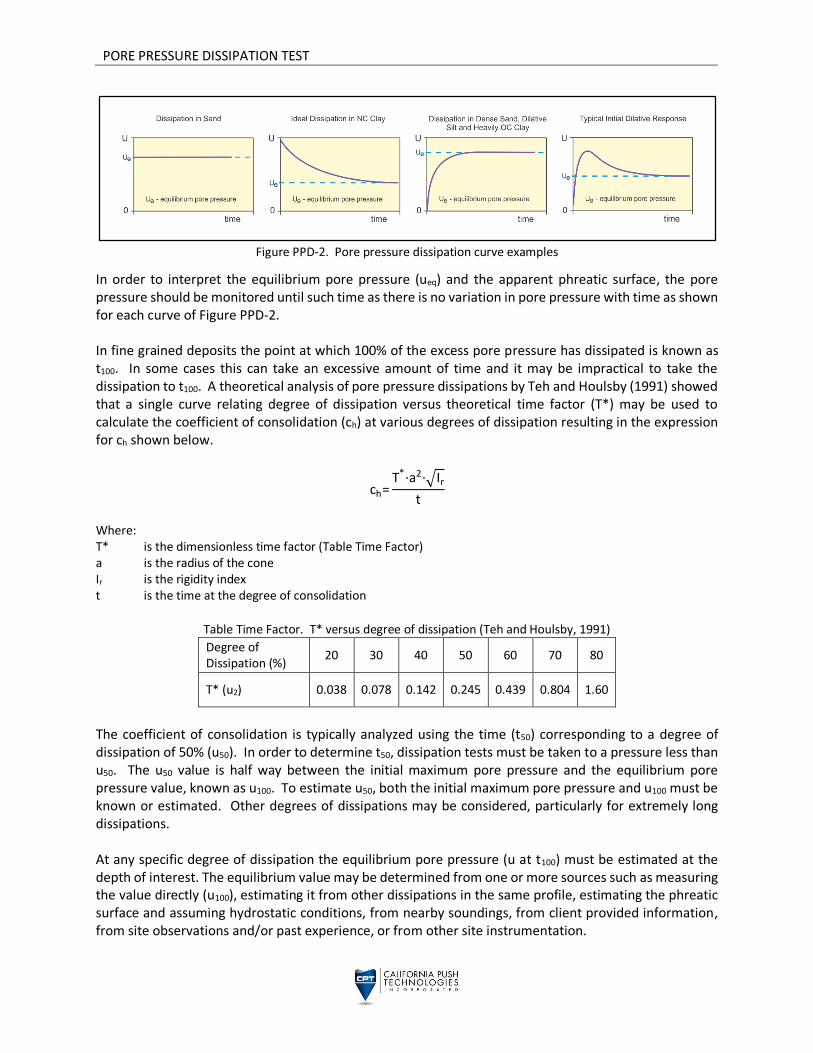
The typical shapes of dissipation curves shown in Figure PPD-2 are very useful in assessing soil type, drainage, in situ pore pressure and soil properties. A flat curve that stabilizes quickly is typical of a freely draining sand. Undrained soils such as clays will typically show positive excess pore pressure and have long dissipation times. Dilative soils will often exhibit dynamic pore pressures below equilibrium that then rise over time. Overconsolidated fine-grained soils will often exhibit an initial dilatory response where there is an initial rise in pore pressure before reaching a peak and dissipating.
PORE PRESSURE DISSIPATION TEST
Figure PPD-2. Pore pressure dissipation curve examples
In order to interpret the equilibrium pore pressure (ueq) and the apparent phreatic surface, the pore pressure should be monitored until such time as there is no variation in pore pressure with time as shown for each curve of Figure PPD-2. In fine grained deposits the point at which 100% of the excess pore pressure has dissipated is known as t100. In some cases this can take an excessive amount of time and it may be impractical to take the dissipation to t100. A theoretical analysis of pore pressure dissipations by Teh and Houlsby (1991) showed that a single curve relating degree of dissipation versus theoretical time factor (T*) may be used to calculate the coefficient of consolidation (ch) at various degrees of dissipation resulting in the expression for ch shown below.
ch=T*∙a2∙√Ir
t
Where: T* is the dimensionless time factor (Table Time Factor) a is the radius of the cone Ir is the rigidity index t is the time at the degree of consolidation
Table Time Factor. T* versus degree of dissipation (Teh and Houlsby, 1991)
Degree of Dissipation (%)
20 30 40 50 60 70 80
T* (u2) 0.038 0.078 0.142 0.245 0.439 0.804 1.60
The coefficient of consolidation is typically analyzed using the time (t50) corresponding to a degree of dissipation of 50% (u50). In order to determine t50, dissipation tests must be taken to a pressure less than u50. The u50 value is half way between the initial maximum pore pressure and the equilibrium pore pressure value, known as u100. To estimate u50, both the initial maximum pore pressure and u100 must be known or estimated. Other degrees of dissipations may be considered, particularly for extremely long dissipations. At any specific degree of dissipation the equilibrium pore pressure (u at t100) must be estimated at the depth of interest. The equilibrium value may be determined from one or more sources such as measuring the value directly (u100), estimating it from other dissipations in the same profile, estimating the phreatic surface and assuming hydrostatic conditions, from nearby soundings, from client provided information, from site observations and/or past experience, or from other site instrumentation.

PORE PRESSURE DISSIPATION TEST
For calculations of ch (Teh and Houlsby, 1991), t50 values are estimated from the corresponding pore pressure dissipation curve and a rigidity index (Ir) is assumed. For curves having an initial dilatory response in which an initial rise in pore pressure occurs before reaching a peak, the relative time from the peak value is used in determining t50. In cases where the time to peak is excessive, t50 values are not calculated. Due to possible inherent uncertainties in estimating Ir, the equilibrium pore pressure and the effect of an initial dilatory response on calculating t50, other methods should be applied to confirm the results for ch. Additional published methods for estimating the coefficient of consolidation from a piezocone test are described in Burns and Mayne (1998, 2002), Jones and Van Zyl (1981), Robertson et al. (1992) and Sully et al. (1999). A summary of the pore pressure dissipation tests and dissipation plots are presented in the relevant appendix.
REFERENCES
ASTM D5778-12, 2012, "Standard Test Method for Performing Electronic Friction Cone and Piezocone Penetration Testing of Soils", ASTM, West Conshohocken, US. Burns, S.E. and Mayne, P.W., 1998, “Monotonic and dilatory pore pressure decay during piezocone tests”, Canadian Geotechnical Journal 26 (4): 1063-1073. Burns, S.E. and Mayne, P.W., 2002, “Analytical cavity expansion-critical state model cone dissipation in fine-grained soils”, Soils & Foundations, Vol. 42(2): 131-137. Jones, G.A. and Van Zyl, D.J.A., 1981, “The piezometer probe: a useful investigation tool”, Proceedings, 10th International Conference on Soil Mechanics and Foundation Engineering, Vol. 3, Stockholm: 489-495. Lunne, T., Robertson, P.K. and Powell, J. J. M., 1997, “Cone Penetration Testing in Geotechnical Practice”, Blackie Academic and Professional. Mayne, P.W., 2013, “Evaluating yield stress of soils from laboratory consolidation and in-situ cone penetration tests”, Sound Geotechnical Research to Practice (Holtz Volume) GSP 230, ASCE, Reston/VA: 406-420. Mayne, P.W., 2014, “Interpretation of geotechnical parameters from seismic piezocone tests”, CPT’14 Keynote Address, Las Vegas, NV, May 2014. Mayne, P.W. and Peuchen, J., 2012, “Unit weight trends with cone resistance in soft to firm clays”, Geotechnical and Geophysical Site Characterization 4, Vol. 1 (Proc. ISC-4, Pernambuco), CRC Press, London: 903-910. Robertson, P.K., 1990, “Soil Classification Using the Cone Penetration Test”, Canadian Geotechnical Journal, Volume 27: 151-158. Robertson, P.K., 2009, “Interpretation of cone penetration tests – a unified approach”, Canadian Geotechnical Journal, Volume 46: 1337-1355. Robertson, P.K., Campanella, R.G., Gillespie, D. and Greig, J., 1986, “Use of Piezometer Cone Data”, Proceedings of InSitu 86, ASCE Specialty Conference, Blacksburg, Virginia. Robertson, P.K., Sully, J.P., Woeller, D.J., Lunne, T., Powell, J.J.M. and Gillespie, D.G., 1992, “Estimating coefficient of consolidation from piezocone tests”, Canadian Geotechnical Journal, 29(4): 551-557. Sully, J.P., Robertson, P.K., Campanella, R.G. and Woeller, D.J., 1999, “An approach to evaluation of field CPTU dissipation data in overconsolidated fine-grained soils”, Canadian Geotechnical Journal, 36(2): 369-381. Teh, C.I., and Houlsby, G.T., 1991, “An analytical study of the cone penetration test in clay”, Geotechnique, 41(1): 17-34.
APPENDICES
The appendices listed below are included in the report:
Cone Penetration Test Summary and Standard Cone Penetration Test Plots
Advanced Cone Penetration Test Plots with Ic, Su(Nkt) and N1(60)
Pore Pressure Dissipation Summary and Pore Pressure Dissipation Plots

Cone Penetration Test Summary and
Standard Cone Penetration Test Plots
Job No: 15-56021
Client: UCSC
Project: Kelly Thompson Ranch
Start Date: 12-Nov-2015
End Date: 12-Nov-2015
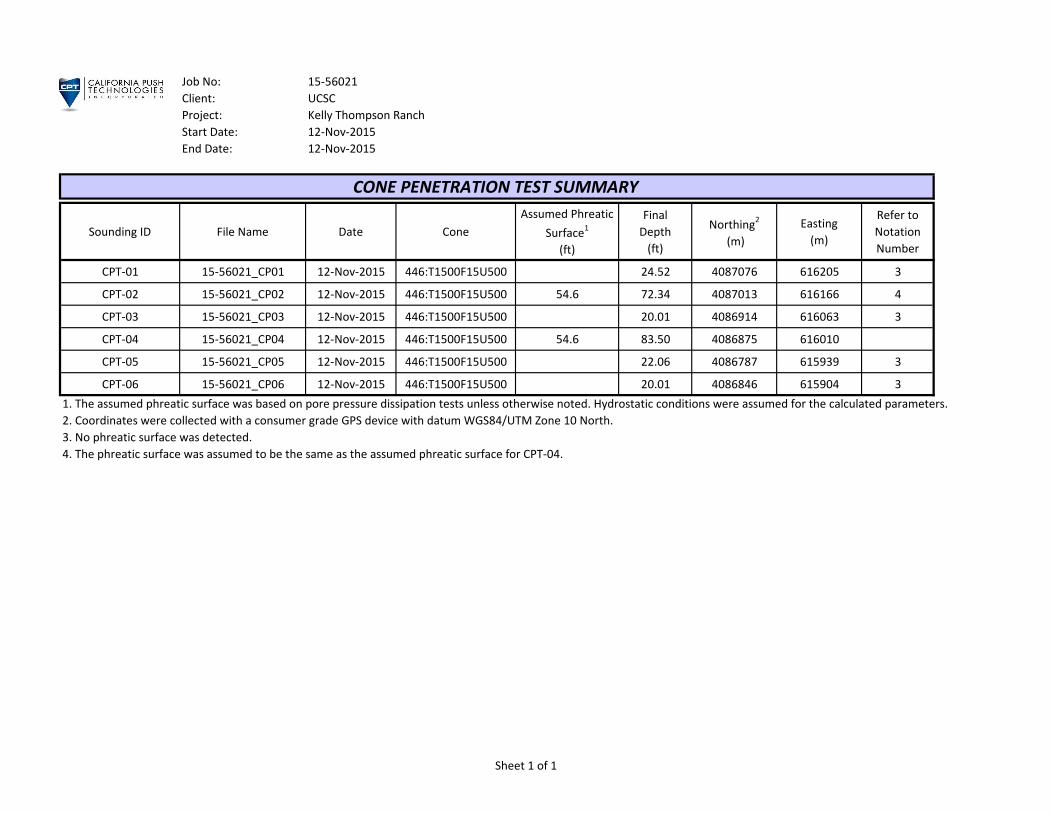
CONE PENETRATION TEST SUMMARY
Sounding ID File Name Date Cone
Assumed Phreatic
Surface1
(ft)
Final
Depth
(ft)
Northing2
(m)
Easting
(m)
Refer to
Notation
Number
CPT-01 15-56021_CP01 12-Nov-2015 446:T1500F15U500 24.52 4087076 616205 3
CPT-02 15-56021_CP02 12-Nov-2015 446:T1500F15U500 54.6 72.34 4087013 616166 4
CPT-03 15-56021_CP03 12-Nov-2015 446:T1500F15U500 20.01 4086914 616063 3
CPT-04 15-56021_CP04 12-Nov-2015 446:T1500F15U500 54.6 83.50 4086875 616010
CPT-05 15-56021_CP05 12-Nov-2015 446:T1500F15U500 22.06 4086787 615939 3
CPT-06 15-56021_CP06 12-Nov-2015 446:T1500F15U500 20.01 4086846 615904 3
1. The assumed phreatic surface was based on pore pressure dissipation tests unless otherwise noted. Hydrostatic conditions were assumed for the calculated parameters.
2. Coordinates were collected with a consumer grade GPS device with datum WGS84/UTM Zone 10 North.
3. No phreatic surface was detected.
4. The phreatic surface was assumed to be the same as the assumed phreatic surface for CPT-04.
Sheet 1 of 1
The reported coordinates were acquired from consumer grade GPS equipment and are only approximate locations. The coordinates should not be used for design purposes.
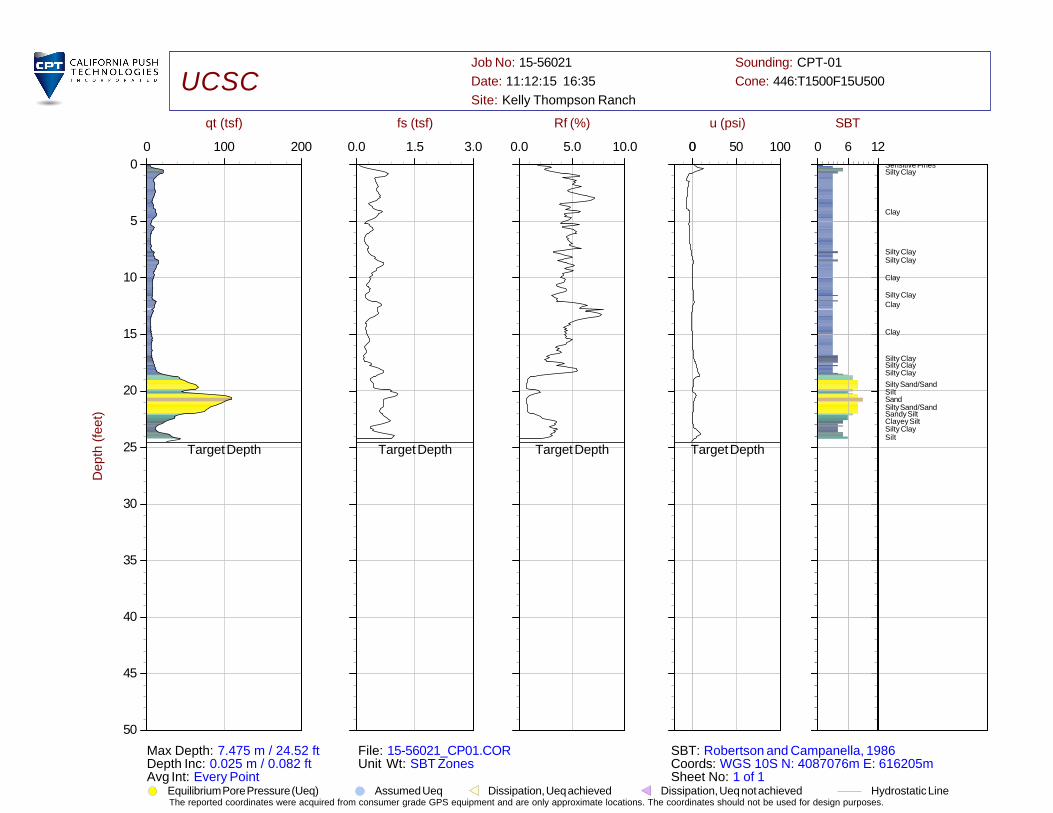
0 100 200
0
5
10
15
20
25
30
35
40
45
50
qt (tsf)
De
pth
(fe
et)
0.0 1.5 3.0
fs (tsf)
0.0 5.0 10.0
Rf (%)
0 50 1000
u (psi)
0 6 12
SBT
UCSCJob No: 15-56021
Date: 11:12:15 16:35
Site: Kelly Thompson Ranch
Sounding: CPT-01
Cone: 446:T1500F15U500
Max Depth: 7.475 m / 24.52 ftDepth Inc: 0.025 m / 0.082 ftAvg Int: Every Point
File: 15-56021_CP01.CORUnit Wt: SBT Zones
SBT: Robertson and Campanella, 1986Coords: WGS 10S N: 4087076m E: 616205m Sheet No: 1 of 1
Sensitive FinesSilty Clay
Clay
Silty ClaySilty Clay
Clay
Silty ClayClay
Clay
Silty ClaySilty ClaySilty Clay
Silty Sand/SandSiltSandSilty Sand/SandSandy SiltClayey SiltSilty ClaySilt
Target Depth Target Depth Target Depth Target Depth
Equilibrium Pore Pressure (Ueq) Assumed Ueq Hydrostatic LineDissipation, Ueq not achievedDissipation, Ueq achieved
The reported coordinates were acquired from consumer grade GPS equipment and are only approximate locations. The coordinates should not be used for design purposes.
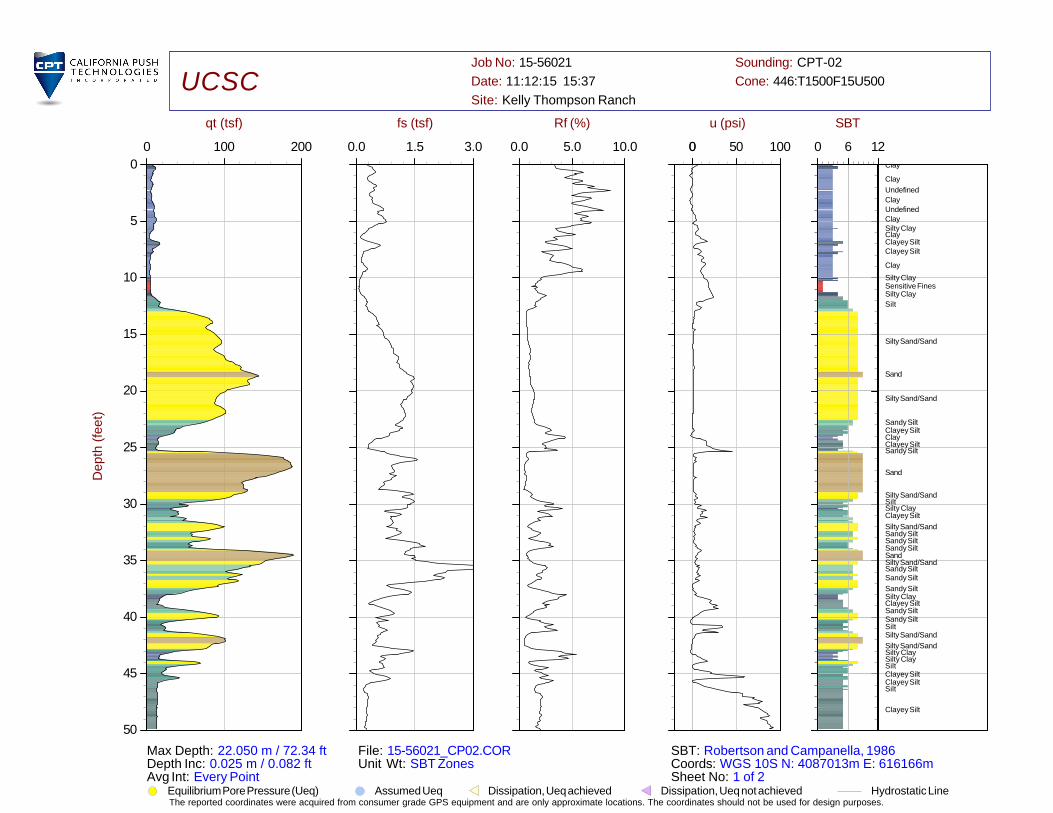
0 100 200
0
5
10
15
20
25
30
35
40
45
50
qt (tsf)
De
pth
(fe
et)
0.0 1.5 3.0
fs (tsf)
0.0 5.0 10.0
Rf (%)
0 50 1000
u (psi)
0 6 12
SBT
UCSCJob No: 15-56021
Date: 11:12:15 15:37
Site: Kelly Thompson Ranch
Sounding: CPT-02
Cone: 446:T1500F15U500
Max Depth: 22.050 m / 72.34 ftDepth Inc: 0.025 m / 0.082 ftAvg Int: Every Point
File: 15-56021_CP02.CORUnit Wt: SBT Zones
SBT: Robertson and Campanella, 1986Coords: WGS 10S N: 4087013m E: 616166m Sheet No: 1 of 2
Clay
Clay
Undefined
Clay
UndefinedClaySilty ClayClayClayey SiltClayey Silt
Clay
Silty ClaySensitive FinesSilty Clay
Silt
Silty Sand/Sand
Sand
Silty Sand/Sand
Sandy SiltClayey SiltClayClayey SiltSandy Silt
Sand
Silty Sand/SandSiltSilty ClayClayey Silt
Silty Sand/SandSandy SiltSandy SiltSandy SiltSandSilty Sand/SandSandy SiltSandy Silt
Sandy SiltSilty ClayClayey SiltSandy SiltSandy SiltSiltSilty Sand/Sand
Silty Sand/SandSilty ClaySilty ClaySiltClayey SiltClayey SiltSilt
Clayey Silt
Refusal Refusal Refusal Refusal
Equilibrium Pore Pressure (Ueq) Assumed Ueq Hydrostatic LineDissipation, Ueq not achievedDissipation, Ueq achieved

The reported coordinates were acquired from consumer grade GPS equipment and are only approximate locations. The coordinates should not be used for design purposes.
0 100 200
50
55
60
65
70
75
80
85
90
95
100
qt (tsf)
De
pth
(fe
et)
0.0 1.5 3.0
fs (tsf)
0.0 5.0 10.0
Rf (%)
0 50 1000
u (psi)
0 6 12
SBT
UCSCJob No: 15-56021
Date: 11:12:15 15:37
Site: Kelly Thompson Ranch
Sounding: CPT-02
Cone: 446:T1500F15U500
Max Depth: 22.050 m / 72.34 ftDepth Inc: 0.025 m / 0.082 ftAvg Int: Every Point
File: 15-56021_CP02.CORUnit Wt: SBT Zones
SBT: Robertson and Campanella, 1986Coords: WGS 10S N: 4087013m E: 616166m Sheet No: 2 of 2
Clayey SiltClayey Silt
Silty Clay
Clayey Silt
SiltClayey SiltClayey SiltClayey Silt
Clayey Silt
SiltClayey SiltSilt
Clay
Silty ClaySilty Clay
Silty ClaySilty Clay
Clayey Silt
SiltSilty ClaySandy SiltSandy Silt
Refusal Refusal Refusal Refusal
Equilibrium Pore Pressure (Ueq) Assumed Ueq Hydrostatic LineDissipation, Ueq not achievedDissipation, Ueq achieved

The reported coordinates were acquired from consumer grade GPS equipment and are only approximate locations. The coordinates should not be used for design purposes.
0 100 200
0
5
10
15
20
25
30
35
40
45
50
qt (tsf)
De
pth
(fe
et)
0.0 1.5 3.0
fs (tsf)
0.0 5.0 10.0
Rf (%)
0 50 1000
u (psi)
0 6 12
SBT
UCSCJob No: 15-56021
Date: 11:12:15 15:00
Site: Kelly Thompson Ranch
Sounding: CPT-03
Cone: 446:T1500F15U500
Max Depth: 6.100 m / 20.01 ftDepth Inc: 0.025 m / 0.082 ftAvg Int: Every Point
File: 15-56021_CP03.CORUnit Wt: SBT Zones
SBT: Robertson and Campanella, 1986Coords: WGS 10S N: 4086914m E: 616063m Sheet No: 1 of 1
Sensitive FinesSensitive FinesClayey Silt
Silt
Clayey SiltClayey SiltSilty Clay
Silty ClayClayClayey SiltSilty ClaySiltSiltSandy Silt
Silty Sand/Sand
Sandy Silt
Silty Sand/Sand
Undefined
Target Depth Target Depth Target Depth Target Depth
Equilibrium Pore Pressure (Ueq) Assumed Ueq Hydrostatic LineDissipation, Ueq not achievedDissipation, Ueq achieved
The reported coordinates were acquired from consumer grade GPS equipment and are only approximate locations. The coordinates should not be used for design purposes.
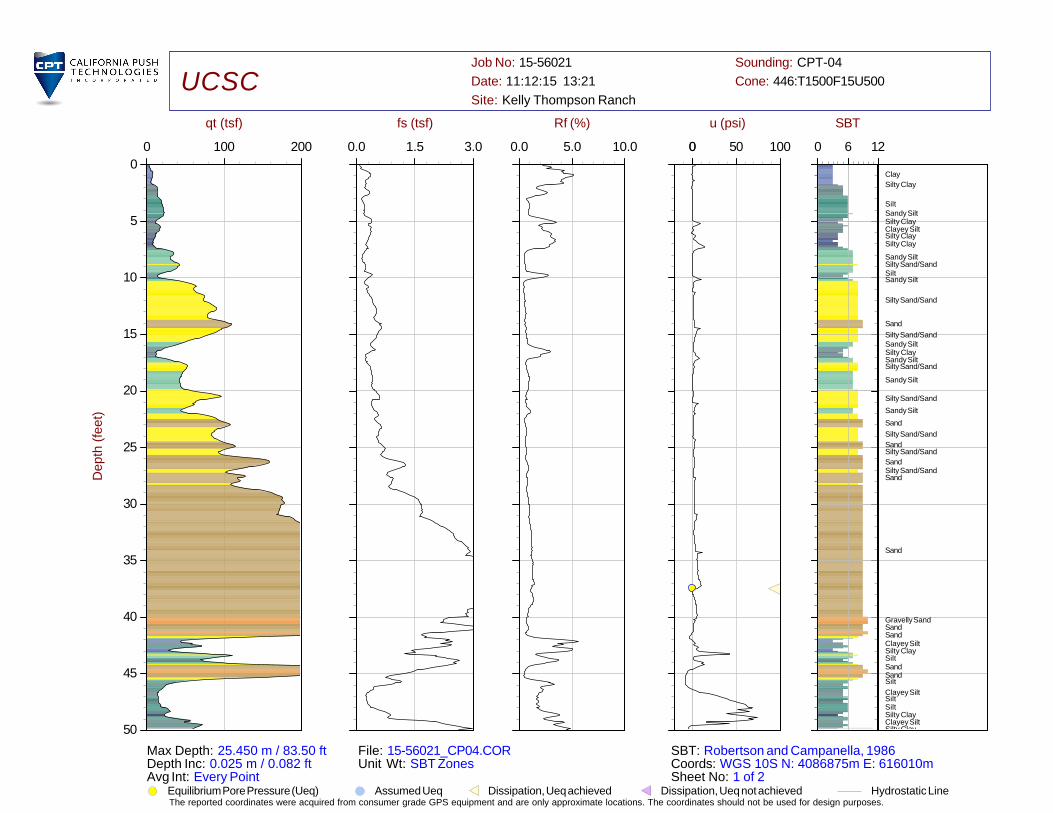
0 100 200
0
5
10
15
20
25
30
35
40
45
50
qt (tsf)
De
pth
(fe
et)
0.0 1.5 3.0
fs (tsf)
0.0 5.0 10.0
Rf (%)
0 50 1000
u (psi)
0 6 12
SBT
UCSCJob No: 15-56021
Date: 11:12:15 13:21
Site: Kelly Thompson Ranch
Sounding: CPT-04
Cone: 446:T1500F15U500
Max Depth: 25.450 m / 83.50 ftDepth Inc: 0.025 m / 0.082 ftAvg Int: Every Point
File: 15-56021_CP04.CORUnit Wt: SBT Zones
SBT: Robertson and Campanella, 1986Coords: WGS 10S N: 4086875m E: 616010m Sheet No: 1 of 2
Clay
Silty Clay
SiltSandy SiltSilty ClayClayey SiltSilty ClaySilty Clay
Sandy SiltSilty Sand/SandSiltSandy Silt
Silty Sand/Sand
Sand
Silty Sand/SandSandy SiltSilty ClaySandy SiltSilty Sand/Sand
Sandy Silt
Silty Sand/Sand
Sandy Silt
Sand
Silty Sand/Sand
SandSilty Sand/Sand
SandSilty Sand/SandSand
Sand
Gravelly SandSandSandClayey SiltSilty ClaySiltSandSandSilt
Clayey SiltSiltSiltSilty ClayClayey SiltSilty Clay
Target Depth Target Depth Target Depth Target Depth
Equilibrium Pore Pressure (Ueq) Assumed Ueq Hydrostatic LineDissipation, Ueq not achievedDissipation, Ueq achieved

The reported coordinates were acquired from consumer grade GPS equipment and are only approximate locations. The coordinates should not be used for design purposes.
0 100 200
50
55
60
65
70
75
80
85
90
95
100
qt (tsf)
De
pth
(fe
et)
0.0 1.5 3.0
fs (tsf)
0.0 5.0 10.0
Rf (%)
0 50 1000
u (psi)
0 6 12
SBT
UCSCJob No: 15-56021
Date: 11:12:15 13:21
Site: Kelly Thompson Ranch
Sounding: CPT-04
Cone: 446:T1500F15U500
Max Depth: 25.450 m / 83.50 ftDepth Inc: 0.025 m / 0.082 ftAvg Int: Every Point
File: 15-56021_CP04.CORUnit Wt: SBT Zones
SBT: Robertson and Campanella, 1986Coords: WGS 10S N: 4086875m E: 616010m Sheet No: 2 of 2
Silty ClaySiltSiltClayey Silt
Clayey SiltSiltSiltClayey SiltSilty ClayClayey SiltClayey SiltSiltClay
Clayey Silt
Silt
Clayey Silt
Clayey SiltSilty ClayClay
Silty Clay
ClaySilty Clay
Silty ClaySilty ClayClayey SiltStiff Fine GrainedSiltSandy SiltSand
Sand
SandStiff Fine GrainedClayey Silt
Clayey SiltClayey Silt
Clayey SiltClayey SiltClayClayey Silt
Silt
Target Depth Target Depth Target Depth Target Depth
Equilibrium Pore Pressure (Ueq) Assumed Ueq Hydrostatic LineDissipation, Ueq not achievedDissipation, Ueq achieved
The reported coordinates were acquired from consumer grade GPS equipment and are only approximate locations. The coordinates should not be used for design purposes.
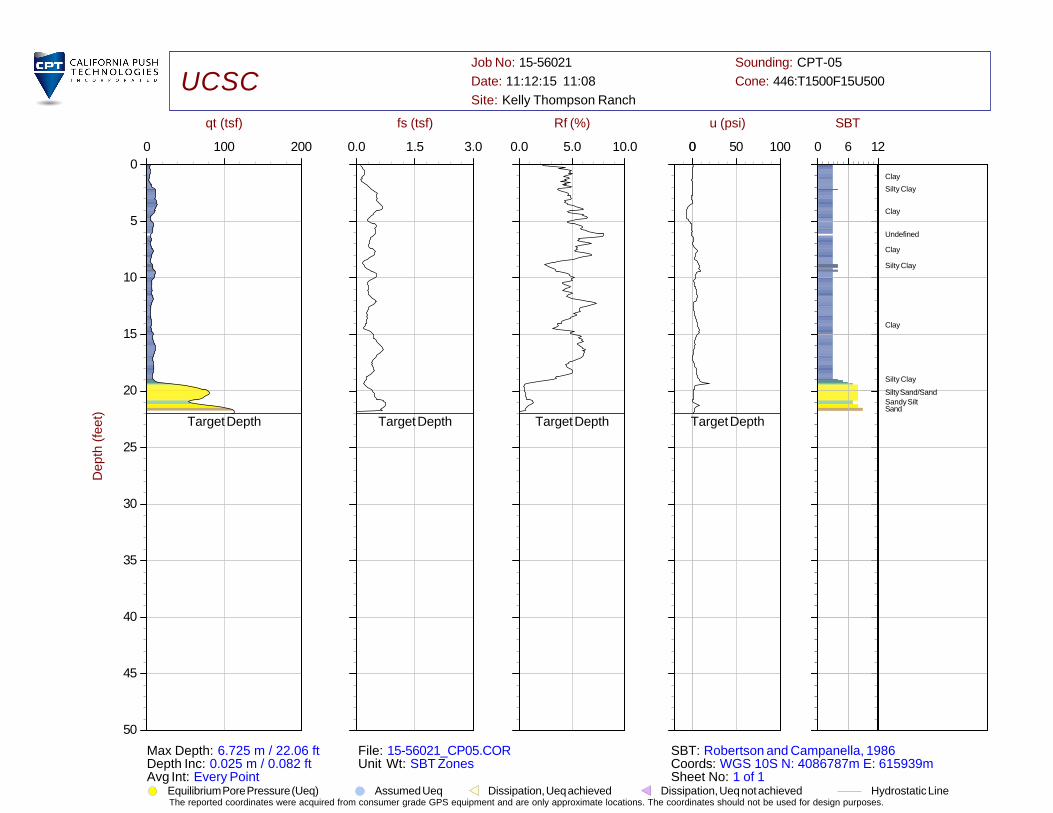
0 100 200
0
5
10
15
20
25
30
35
40
45
50
qt (tsf)
De
pth
(fe
et)
0.0 1.5 3.0
fs (tsf)
0.0 5.0 10.0
Rf (%)
0 50 1000
u (psi)
0 6 12
SBT
UCSCJob No: 15-56021
Date: 11:12:15 11:08
Site: Kelly Thompson Ranch
Sounding: CPT-05
Cone: 446:T1500F15U500
Max Depth: 6.725 m / 22.06 ftDepth Inc: 0.025 m / 0.082 ftAvg Int: Every Point
File: 15-56021_CP05.CORUnit Wt: SBT Zones
SBT: Robertson and Campanella, 1986Coords: WGS 10S N: 4086787m E: 615939m Sheet No: 1 of 1
Clay
Silty Clay
Clay
Undefined
Clay
Silty Clay
Clay
Silty Clay
Silty Sand/SandSandy SiltSand
Target Depth Target Depth Target Depth Target Depth
Equilibrium Pore Pressure (Ueq) Assumed Ueq Hydrostatic LineDissipation, Ueq not achievedDissipation, Ueq achieved

The reported coordinates were acquired from consumer grade GPS equipment and are only approximate locations. The coordinates should not be used for design purposes.
0 100 200
0
5
10
15
20
25
30
35
40
45
50
qt (tsf)
De
pth
(fe
et)
0.0 1.5 3.0
fs (tsf)
0.0 5.0 10.0
Rf (%)
0 50 1000
u (psi)
0 6 12
SBT
UCSCJob No: 15-56021
Date: 11:12:15 10:31
Site: Kelly Thompson Ranch
Sounding: CPT-06
Cone: 446:T1500F15U500
Max Depth: 6.100 m / 20.01 ftDepth Inc: 0.025 m / 0.082 ftAvg Int: Every Point
File: 15-56021_CP06.CORUnit Wt: SBT Zones
SBT: Robertson and Campanella, 1986Coords: WGS 10S N: 4086846m E: 615904m Sheet No: 1 of 1
Clay
Undefined
UndefinedUndefined
Clay
Undefined
Clay
Silty ClaySandy Silt
SandSandSand
Target Depth Target Depth Target Depth Target Depth
Equilibrium Pore Pressure (Ueq) Assumed Ueq Hydrostatic LineDissipation, Ueq not achievedDissipation, Ueq achieved

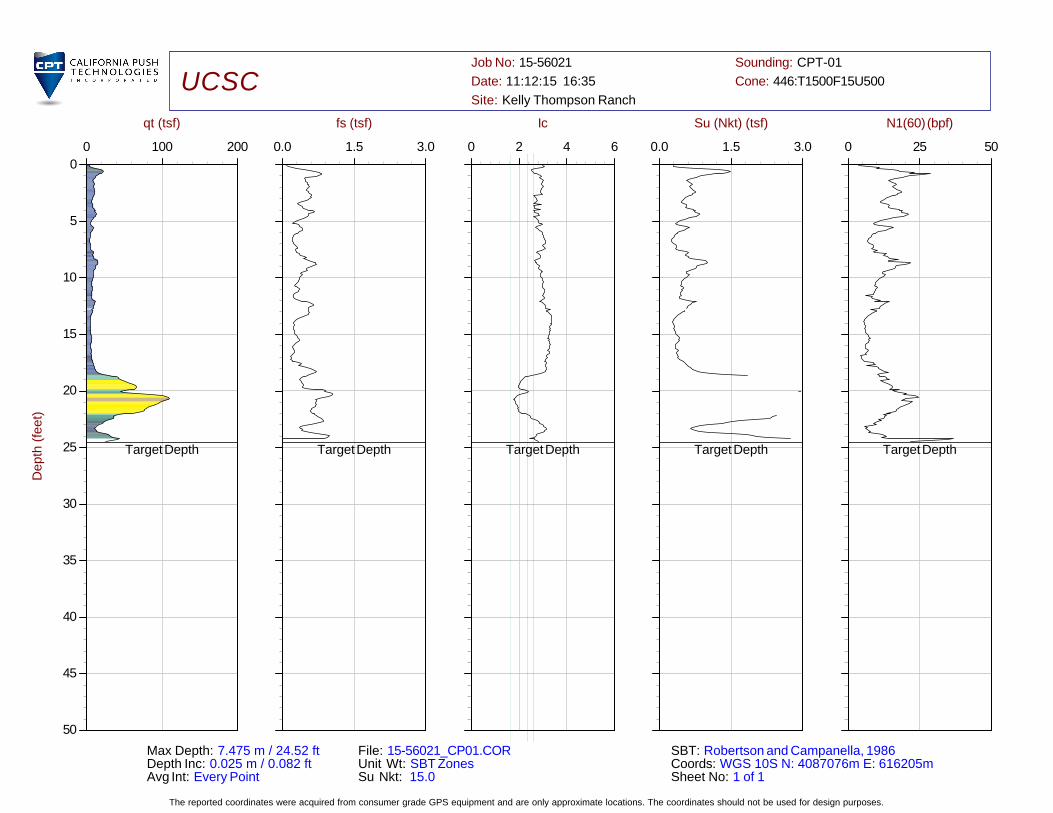
Advanced Cone Penetration Test Plots with Ic, Su(Nkt) and N1(60)
The reported coordinates were acquired from consumer grade GPS equipment and are only approximate locations. The coordinates should not be used for design purposes.
0 100 200
0
5
10
15
20
25
30
35
40
45
50
qt (tsf)
De
pth
(fe
et)
0.0 1.5 3.0
fs (tsf)
0 2 4 6
Ic
0.0 1.5 3.0
Su (Nkt) (tsf)
0 25 50
N1(60) (bpf)
UCSCJob No: 15-56021
Date: 11:12:15 16:35
Site: Kelly Thompson Ranch
Sounding: CPT-01
Cone: 446:T1500F15U500
Max Depth: 7.475 m / 24.52 ftDepth Inc: 0.025 m / 0.082 ftAvg Int: Every Point
File: 15-56021_CP01.CORUnit Wt: SBT ZonesSu Nkt: 15.0
SBT: Robertson and Campanella, 1986Coords: WGS 10S N: 4087076m E: 616205m Sheet No: 1 of 1
Target Depth Target Depth Target Depth Target Depth Target Depth
The reported coordinates were acquired from consumer grade GPS equipment and are only approximate locations. The coordinates should not be used for design purposes.
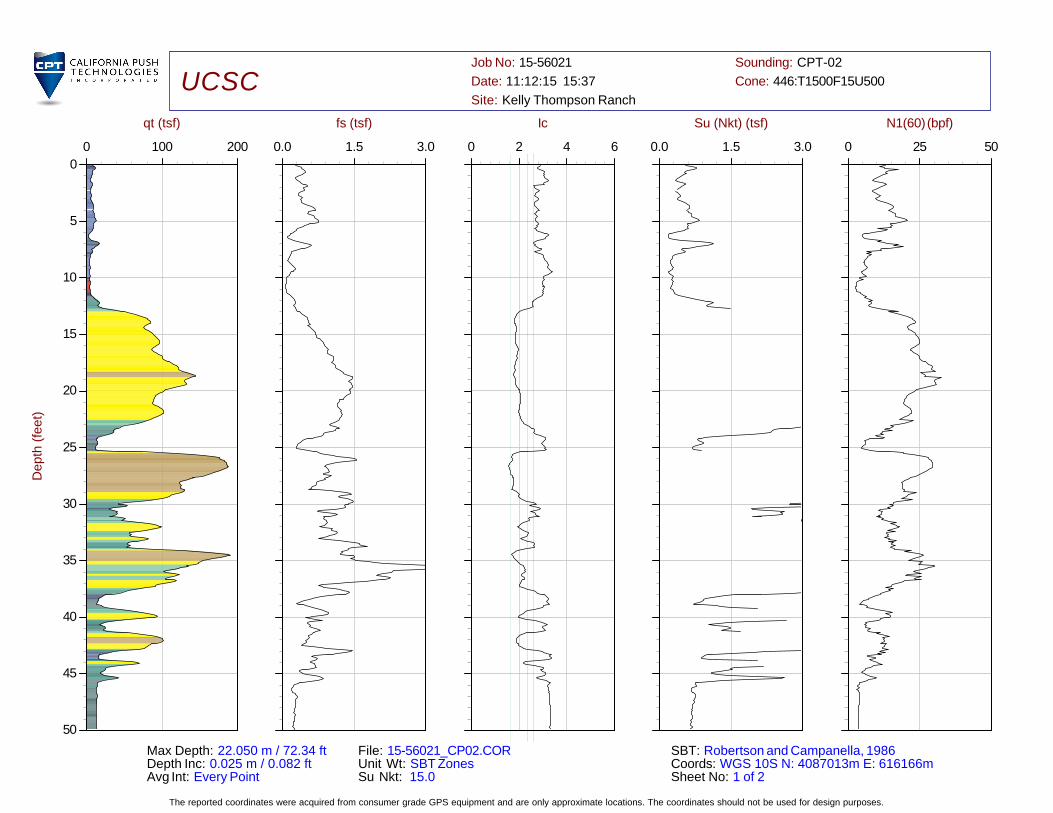
0 100 200
0
5
10
15
20
25
30
35
40
45
50
qt (tsf)
De
pth
(fe
et)
0.0 1.5 3.0
fs (tsf)
0 2 4 6
Ic
0.0 1.5 3.0
Su (Nkt) (tsf)
0 25 50
N1(60) (bpf)
UCSCJob No: 15-56021
Date: 11:12:15 15:37
Site: Kelly Thompson Ranch
Sounding: CPT-02
Cone: 446:T1500F15U500
Max Depth: 22.050 m / 72.34 ftDepth Inc: 0.025 m / 0.082 ftAvg Int: Every Point
File: 15-56021_CP02.CORUnit Wt: SBT ZonesSu Nkt: 15.0
SBT: Robertson and Campanella, 1986Coords: WGS 10S N: 4087013m E: 616166m Sheet No: 1 of 2
Refusal Refusal Refusal Refusal Refusal

The reported coordinates were acquired from consumer grade GPS equipment and are only approximate locations. The coordinates should not be used for design purposes.
0 100 200
50
55
60
65
70
75
80
85
90
95
100
qt (tsf)
De
pth
(fe
et)
0.0 1.5 3.0
fs (tsf)
0 2 4 6
Ic
0.0 1.5 3.0
Su (Nkt) (tsf)
0 25 50
N1(60) (bpf)
UCSCJob No: 15-56021
Date: 11:12:15 15:37
Site: Kelly Thompson Ranch
Sounding: CPT-02
Cone: 446:T1500F15U500
Max Depth: 22.050 m / 72.34 ftDepth Inc: 0.025 m / 0.082 ftAvg Int: Every Point
File: 15-56021_CP02.CORUnit Wt: SBT ZonesSu Nkt: 15.0
SBT: Robertson and Campanella, 1986Coords: WGS 10S N: 4087013m E: 616166m Sheet No: 2 of 2
Refusal Refusal Refusal Refusal Refusal
The reported coordinates were acquired from consumer grade GPS equipment and are only approximate locations. The coordinates should not be used for design purposes.
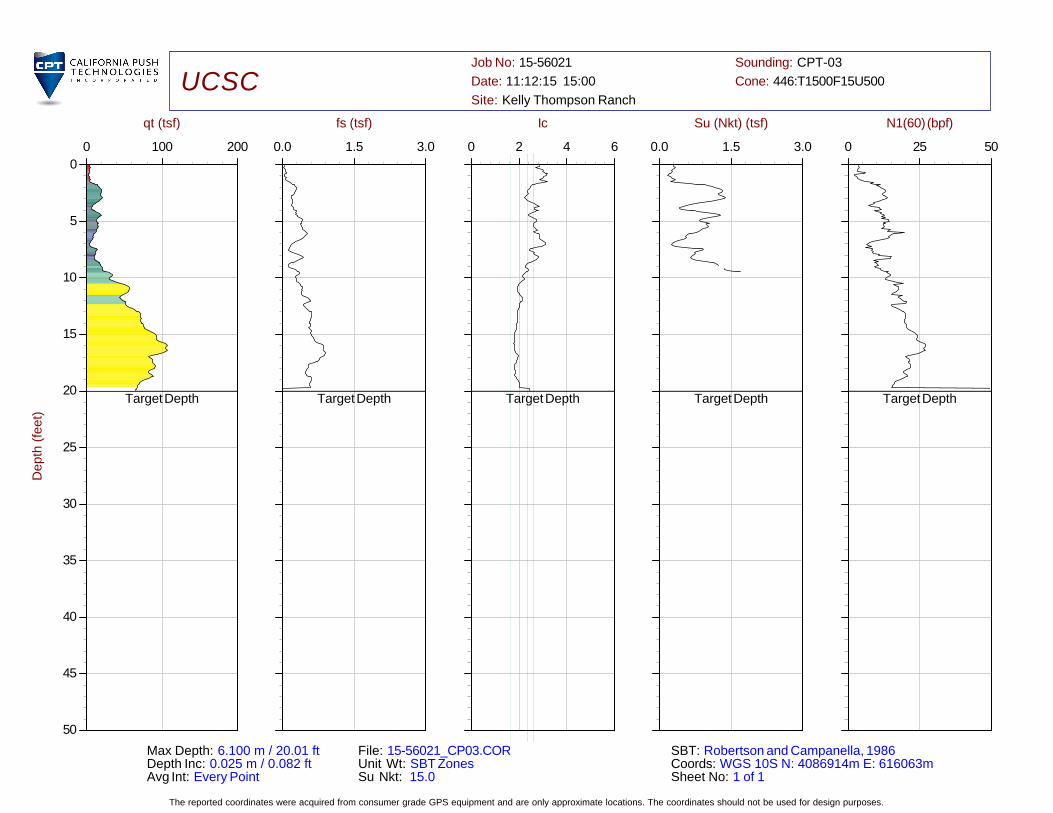
0 100 200
0
5
10
15
20
25
30
35
40
45
50
qt (tsf)
De
pth
(fe
et)
0.0 1.5 3.0
fs (tsf)
0 2 4 6
Ic
0.0 1.5 3.0
Su (Nkt) (tsf)
0 25 50
N1(60) (bpf)
UCSCJob No: 15-56021
Date: 11:12:15 15:00
Site: Kelly Thompson Ranch
Sounding: CPT-03
Cone: 446:T1500F15U500
Max Depth: 6.100 m / 20.01 ftDepth Inc: 0.025 m / 0.082 ftAvg Int: Every Point
File: 15-56021_CP03.CORUnit Wt: SBT ZonesSu Nkt: 15.0
SBT: Robertson and Campanella, 1986Coords: WGS 10S N: 4086914m E: 616063m Sheet No: 1 of 1
Target Depth Target Depth Target Depth Target Depth Target Depth
The reported coordinates were acquired from consumer grade GPS equipment and are only approximate locations. The coordinates should not be used for design purposes.
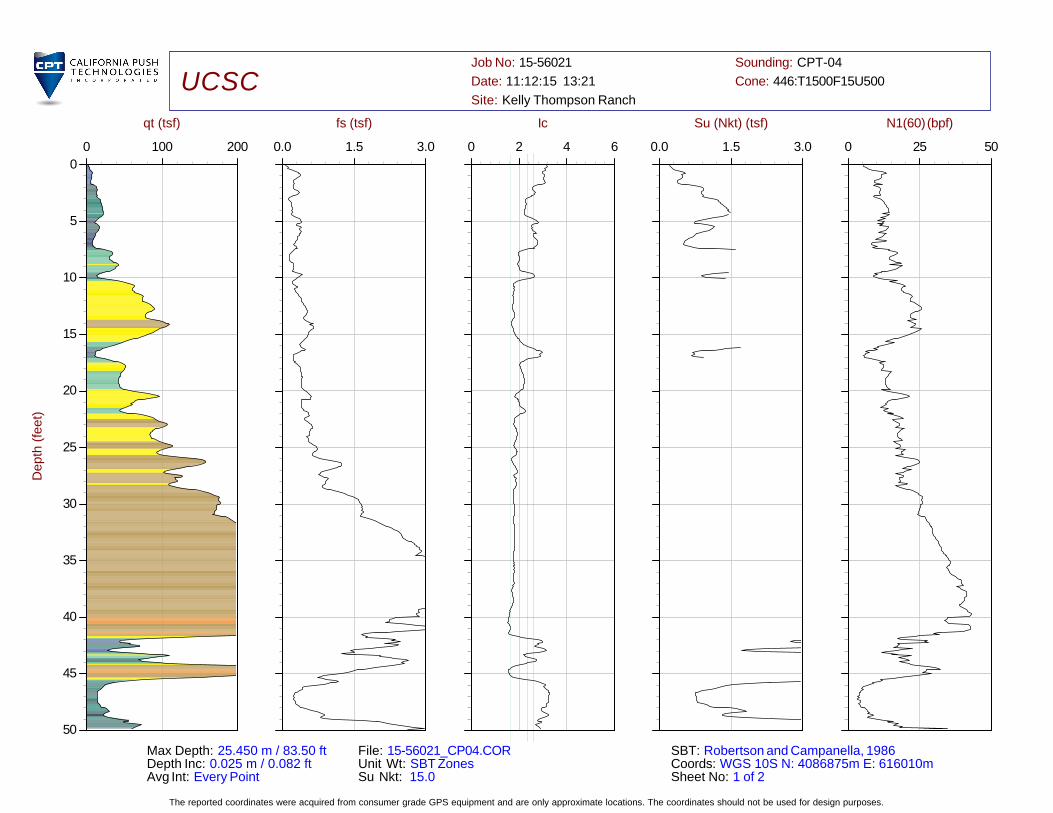
0 100 200
0
5
10
15
20
25
30
35
40
45
50
qt (tsf)
De
pth
(fe
et)
0.0 1.5 3.0
fs (tsf)
0 2 4 6
Ic
0.0 1.5 3.0
Su (Nkt) (tsf)
0 25 50
N1(60) (bpf)
UCSCJob No: 15-56021
Date: 11:12:15 13:21
Site: Kelly Thompson Ranch
Sounding: CPT-04
Cone: 446:T1500F15U500
Max Depth: 25.450 m / 83.50 ftDepth Inc: 0.025 m / 0.082 ftAvg Int: Every Point
File: 15-56021_CP04.CORUnit Wt: SBT ZonesSu Nkt: 15.0
SBT: Robertson and Campanella, 1986Coords: WGS 10S N: 4086875m E: 616010m Sheet No: 1 of 2
Target Depth Target Depth Target Depth Target Depth Target Depth
The reported coordinates were acquired from consumer grade GPS equipment and are only approximate locations. The coordinates should not be used for design purposes.
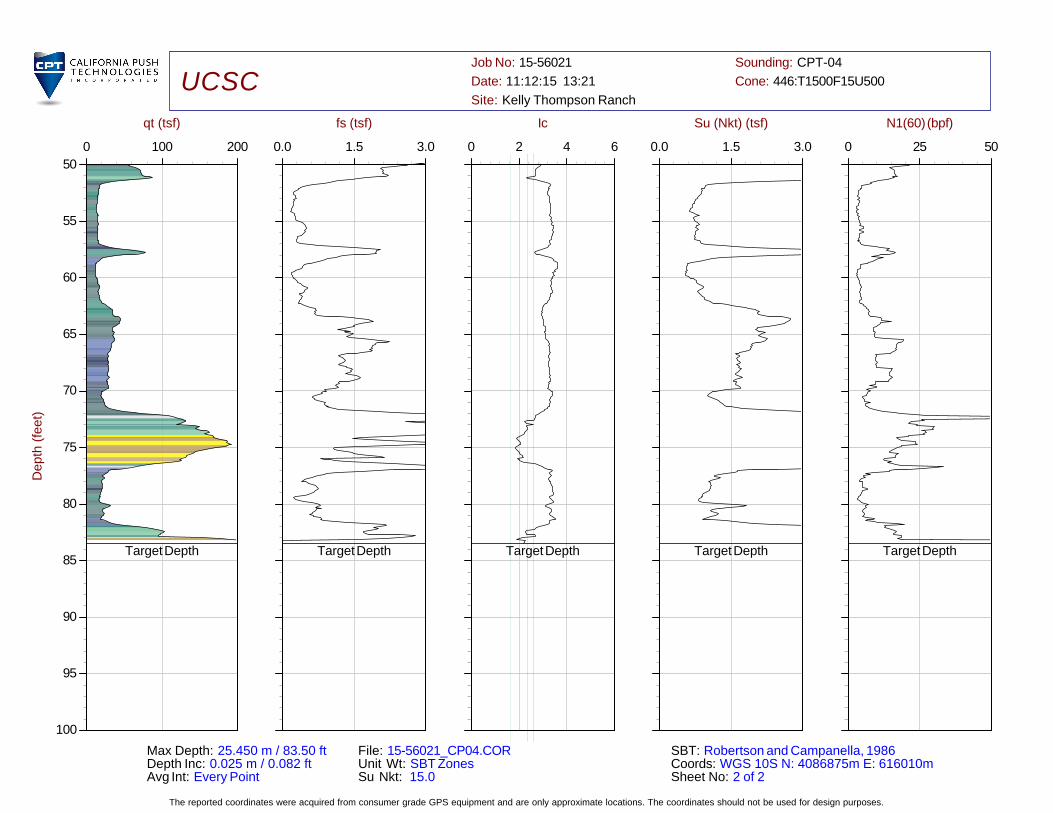
0 100 200
50
55
60
65
70
75
80
85
90
95
100
qt (tsf)
De
pth
(fe
et)
0.0 1.5 3.0
fs (tsf)
0 2 4 6
Ic
0.0 1.5 3.0
Su (Nkt) (tsf)
0 25 50
N1(60) (bpf)
UCSCJob No: 15-56021
Date: 11:12:15 13:21
Site: Kelly Thompson Ranch
Sounding: CPT-04
Cone: 446:T1500F15U500
Max Depth: 25.450 m / 83.50 ftDepth Inc: 0.025 m / 0.082 ftAvg Int: Every Point
File: 15-56021_CP04.CORUnit Wt: SBT ZonesSu Nkt: 15.0
SBT: Robertson and Campanella, 1986Coords: WGS 10S N: 4086875m E: 616010m Sheet No: 2 of 2
Target Depth Target Depth Target Depth Target Depth Target Depth

The reported coordinates were acquired from consumer grade GPS equipment and are only approximate locations. The coordinates should not be used for design purposes.
0 100 200
0
5
10
15
20
25
30
35
40
45
50
qt (tsf)
De
pth
(fe
et)
0.0 1.5 3.0
fs (tsf)
0 2 4 6
Ic
0.0 1.5 3.0
Su (Nkt) (tsf)
0 25 50
N1(60) (bpf)
UCSCJob No: 15-56021
Date: 11:12:15 11:08
Site: Kelly Thompson Ranch
Sounding: CPT-05
Cone: 446:T1500F15U500
Max Depth: 6.725 m / 22.06 ftDepth Inc: 0.025 m / 0.082 ftAvg Int: Every Point
File: 15-56021_CP05.CORUnit Wt: SBT ZonesSu Nkt: 15.0
SBT: Robertson and Campanella, 1986Coords: WGS 10S N: 4086787m E: 615939m Sheet No: 1 of 1
Target Depth Target Depth Target Depth Target Depth Target Depth

The reported coordinates were acquired from consumer grade GPS equipment and are only approximate locations. The coordinates should not be used for design purposes.
0 100 200
0
5
10
15
20
25
30
35
40
45
50
qt (tsf)
De
pth
(fe
et)
0.0 1.5 3.0
fs (tsf)
0 2 4 6
Ic
0.0 1.5 3.0
Su (Nkt) (tsf)
0 25 50
N1(60) (bpf)
UCSCJob No: 15-56021
Date: 11:12:15 10:31
Site: Kelly Thompson Ranch
Sounding: CPT-06
Cone: 446:T1500F15U500
Max Depth: 6.100 m / 20.01 ftDepth Inc: 0.025 m / 0.082 ftAvg Int: Every Point
File: 15-56021_CP06.CORUnit Wt: SBT ZonesSu Nkt: 15.0
SBT: Robertson and Campanella, 1986Coords: WGS 10S N: 4086846m E: 615904m Sheet No: 1 of 1
Target Depth Target Depth Target Depth Target Depth Target Depth