presentation of half year results - commbank · presentation of half year results ... speaker’s...
TRANSCRIPT

Presentation of Half Year Results
13 February 2002
www.commbank.com.au

Half Year Results 13
February 2002
2
The material that follows is a presentation of general
background information about the Bank’s activities
current at the date of the presentation,13 February
2002. It is information given in summary form and
does not purport to be complete. It is not intended to
be relied upon as advice to investors or potential
investors and does not take into account the
investment objectives, financial situation or needs of
any particular investor. These should be considered,
with or without professional advice when deciding if
an investment is appropriate.
Disclaimer

Half Year Results 13
February 2002
3
Speaker’s Notes
Speaker’s notes for this presentation are
attached below each slide.
To access them, you may need to save
the slides in PowerPoint and view/print
in “notes view.”

Half Year Results 13
February 2002
4
Overview
Underlying Group performance up 14%
Reflects a strong banking result up 16% (before bad debts) driven by a
steady net interest margin and growth in other banking income
Funds under management result is up 23% with strong momentum
in funds inflow maintained through September 11
Australian life insurance operating margin up 22% offset by a weak offshore
life insurance result
Increase in bad and doubtful debt expense, driven by two large impaired
corporate exposures
Organisational restructure announced in December 2001 complementing
the Bank’s strategic focus on wealth management

Half Year Results 13
February 2002
5
Agenda
Performance Highlights
Income and Expenditure
Segment Results
Balance Sheet
Integration of Colonial
Funding and Capital
Performance Highlights
Set out in this presentation are unaudited proforma graphs and tables which
include the profit and loss, balance sheet and life insurance and funds
management statistics for the Commonwealth Bank and Colonial Limited for
the half year ending June 2000. These have been prepared to illustrate the
proforma consolidated position of Commonwealth Bank and Colonial as if
Colonial had been merged with Commonwealth Bank from 1 January 2000 to
30 June 2000 for profit and loss purposes.
The proformas do not include goodwill amortisation or life insurance
appraisal value uplift. The results included within the profit and loss have
been adjusted for abnormal items and other items not considered part of the
ongoing operations, such as the effect of Colonial’s UK life insurance
business which was sold during the period and specific payments made by
Colonial in relation to the merger with Commonwealth Bank. [No
adjustments have been made for inconsistencies in accounting policies
between Colonial and Commonwealth].
Half Year Results 13
February 2002
7
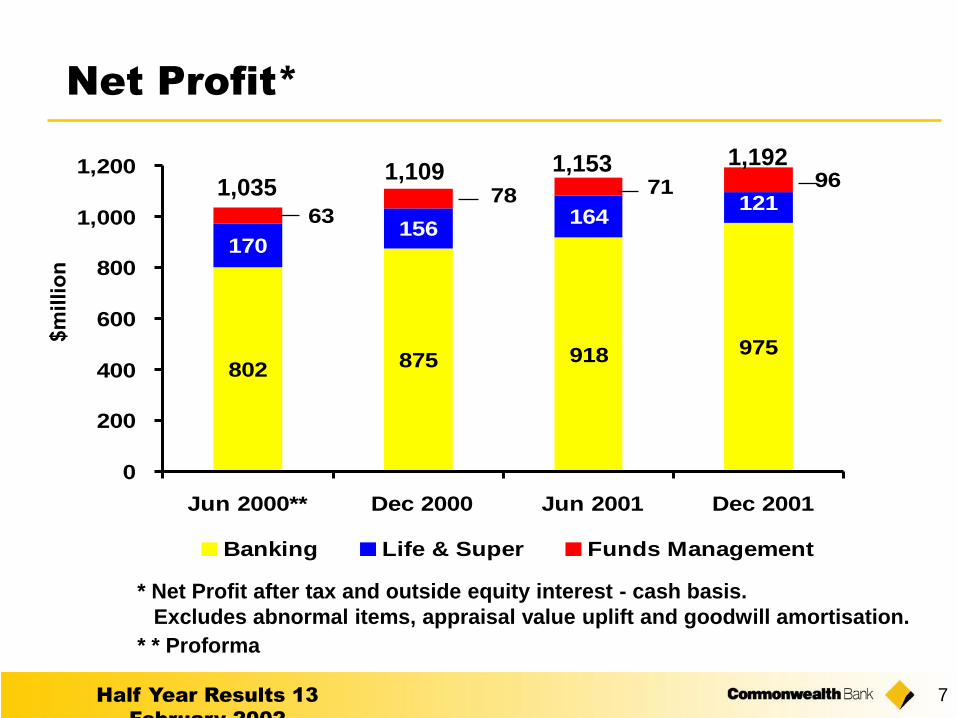
Net Profit*
802 875 918 975
170156
164121
6378 71 96
0
200
400
600
800
1,000
1,200
Jun 2000** Dec 2000 Jun 2001 Dec 2001
Banking Life & Super Funds Management
* Net Profit after tax and outside equity interest - cash basis.
Excludes abnormal items, appraisal value uplift and goodwill amortisation.
1,109 1,1531,035
* * Proforma
1,192

Half Year Results 13
February 2002
8
Lending Assets and
Funds under Management
71 72 74 80
41 41 43 45
888932 32 32 3122 24 24 24
11 12121224 29 34
35
2323 24 26
0
50
100
150
200
250
300
Jun 2000* Dec 2000 Jun 2001 Dec 2001
Lending Assets**:
** Excludes securitised housing loan balances $5.7b (Dec 01)$6.8b (Jun 01), $4.7b (Dec 00), $3b (Jun 00).
241251
Housing Personal Business Corporate
Life & SuperFunds Management: Retail Wholesale
$80 billion
$155 billion
* Proforma
233
261
Bank Acceptances
Half Year Results 13
February 2002
9
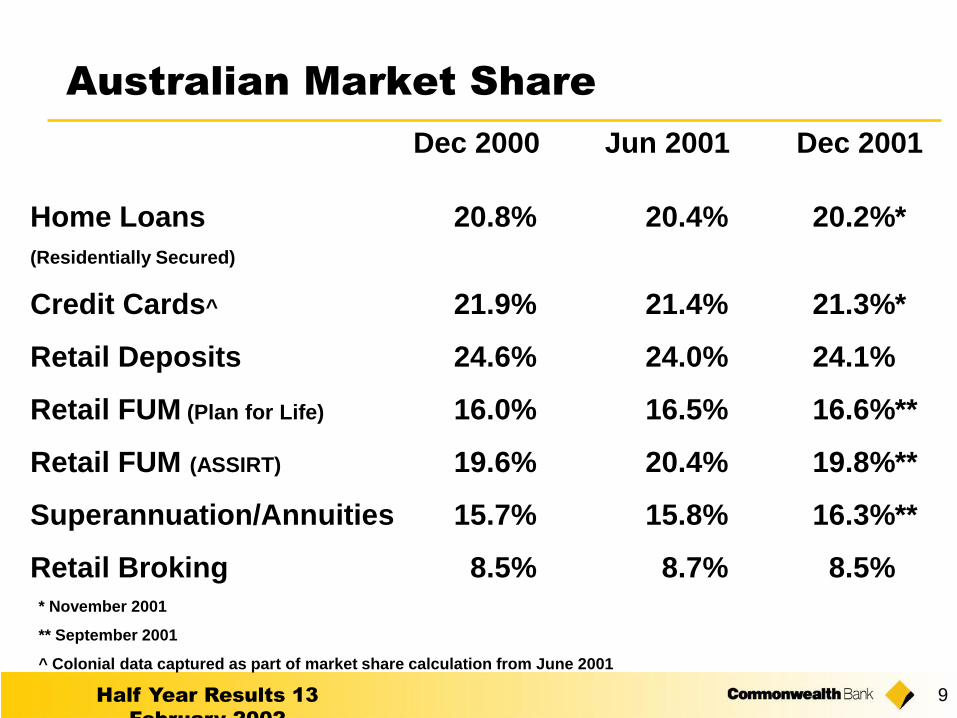
Australian Market Share
Dec 2000 Jun 2001 Dec 2001
Home Loans 20.8% 20.4% 20.2%*
(Residentially Secured)
Credit Cards^ 21.9% 21.4% 21.3%*
Retail Deposits 24.6% 24.0% 24.1%
Retail FUM (Plan for Life) 16.0% 16.5% 16.6%**
Retail FUM (ASSIRT) 19.6% 20.4% 19.8%**
Superannuation/Annuities 15.7% 15.8% 16.3%**
Retail Broking 8.5% 8.7% 8.5%
* November 2001
** September 2001
^ Colonial data captured as part of market share calculation from June 2001
Half Year Results 13
February 2002
10
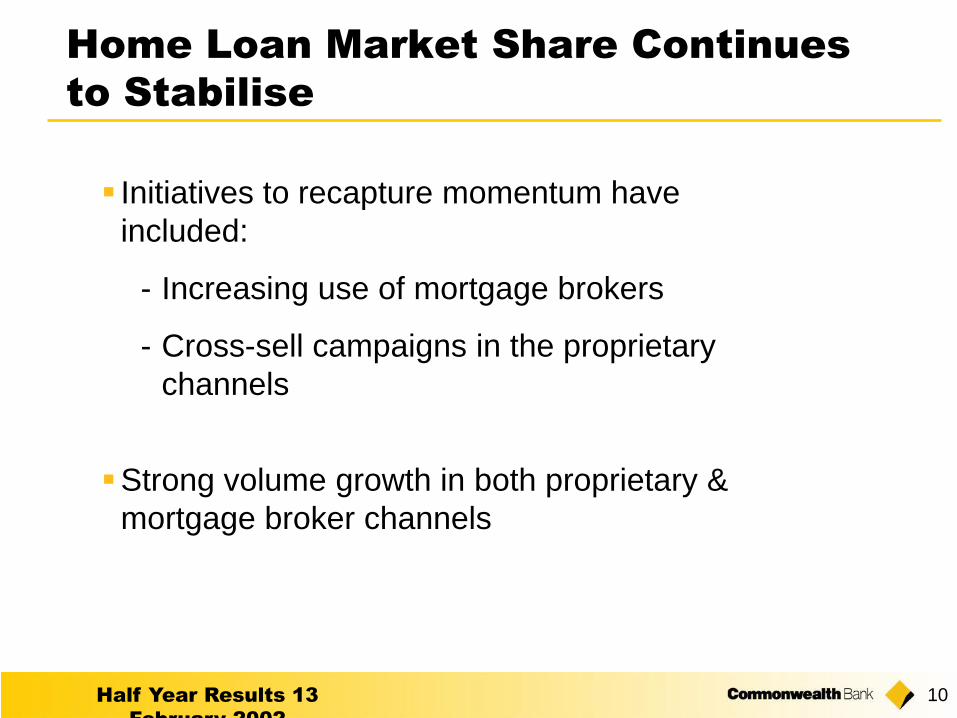
Home Loan Market Share Continues
to Stabilise
Initiatives to recapture momentum have
included:
- Increasing use of mortgage brokers
- Cross-sell campaigns in the proprietary
channels
Strong volume growth in both proprietary &
mortgage broker channels

Half Year Results 13
February 2002
11
Home Loan Market Share
* Includes owner occupied loans, home equity and similar facilities and investment home loans.
Market Share (all lenders)
Jan 2001 - Nov 2001
15.00%
17.00%
19.00%
21.00%
23.00%
25.00%
27.00%
Jan-
01
Feb-0
1
Mar
-01
Apr-
01
May
-01
Jun-0
1
Jul-0
1
Aug-
01
Sep-0
1
Oct
-01
Nov-
01
Residentially
Secured
Approvals
Residentially
Secured
Balances
Owner
Occupied
Approvals
Owner
Occupied
Balances
*

Half Year Results 13
February 2002
12
Home Loan Market Share
*
Third Party Brokers Funded Approvals Market Share
0.0%
2.0%
4.0%
6.0%
8.0%
10.0%
12.0%
Dec
00
Mar
01
Jun 0
1
Sep
01
CBA Share $ Value %Source: Market Intelligence Strategy Centre

Half Year Results 13
February 2002
13
New Zealand Market Share
ASB Group
Dec 2000 Jun 2001 Dec 2001
Retail Lending 14.9% 15.3% 15.1%
Retail Deposits 14.5% 14.5% 14.7%
Credit Cards 13.8% 14.1% 13.5%
Retail Funds Management 4.6% 5.9% 6.1%
Main Bank Share 16.4% 16.4% 16.2%

Performance Highlights
Domestic Net Interest Margins
2.75
3.00
3.25
3.50
Mar
-99
Jun-9
9
Sep
-99
Dec
-99
Mar
-00
Jun-0
0
Sep
-00
Dec
-00
Mar
-01
Jun-0
1
Sep
-01
Dec
-01
NAB WBC ANZ Commonwealth Bank Group
3.08
2.95
3.00
2.81
Net interest margin for Commonwealth Bank refers to half-yearly reporting periods ending June
and December. The ANZ, NAB and WBC net interest margin refers to the half-yearly reporting
periods ending March and September.
*Proforma
%
*
Half Year Results 13
February 2002
15
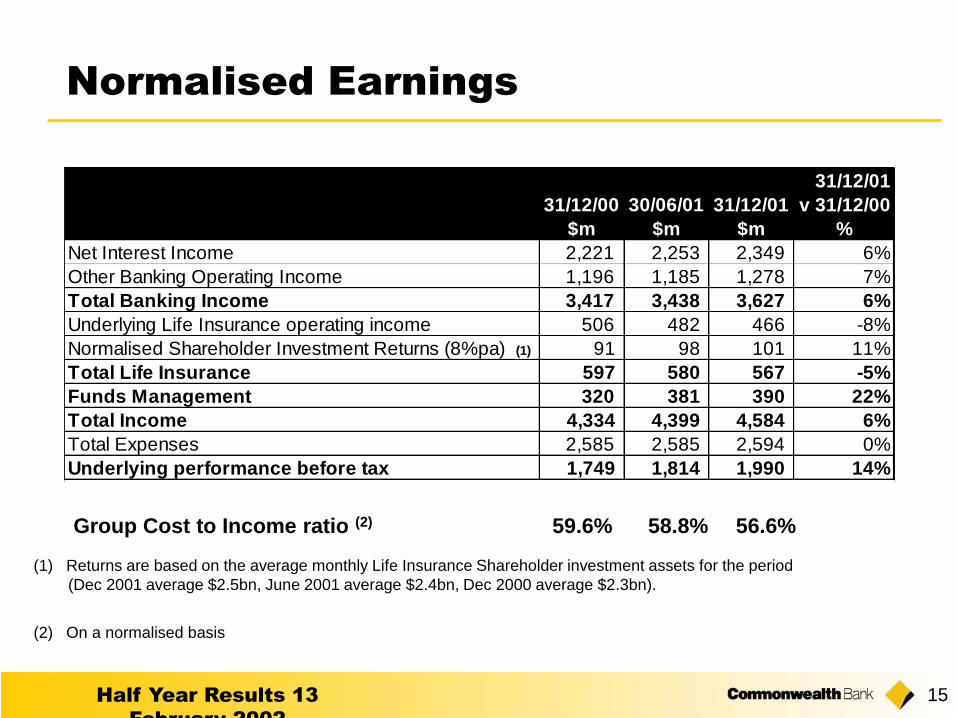
Normalised Earnings
Group Cost to Income ratio (2) 59.6% 58.8% 56.6%
(1) Returns are based on the average monthly Life Insurance Shareholder investment assets for the period
(Dec 2001 average $2.5bn, June 2001 average $2.4bn, Dec 2000 average $2.3bn).
31/12/01
31/12/00 30/06/01 31/12/01 v 31/12/00
$m $m $m %
Net Interest Income 2,221 2,253 2,349 6%
Other Banking Operating Income 1,196 1,185 1,278 7%
Total Banking Income 3,417 3,438 3,627 6%
Underlying Life Insurance operating income 506 482 466 -8%
Normalised Shareholder Investment Returns (8%pa) (1) 91 98 101 11%
Total Life Insurance 597 580 567 -5%
Funds Management 320 381 390 22%
Total Income 4,334 4,399 4,584 6%
Total Expenses 2,585 2,585 2,594 0%
Underlying performance before tax 1,749 1,814 1,990 14%
(2) On a normalised basis
Income and Expenditure

Half Year Results 13
February 2002
17
Operating Income
0
500
1,000
1,500
2,000
2,500
3,000
3,500
4,000
4,500
5,000
Jun 2000* Dec 2000 Jun 2001 Dec 2001
$m
illio
ns
Net Interest Income Other Banking Operating Income
Funds Management Income Life & Super Income
51%
27%
15%7%
14%
8%
27%
51%
4,381 4,443
49%
26%
18%7%
4,231
* Proforma
4,546
11%9%
28%
52%
Half Year Results 13
February 2002
18
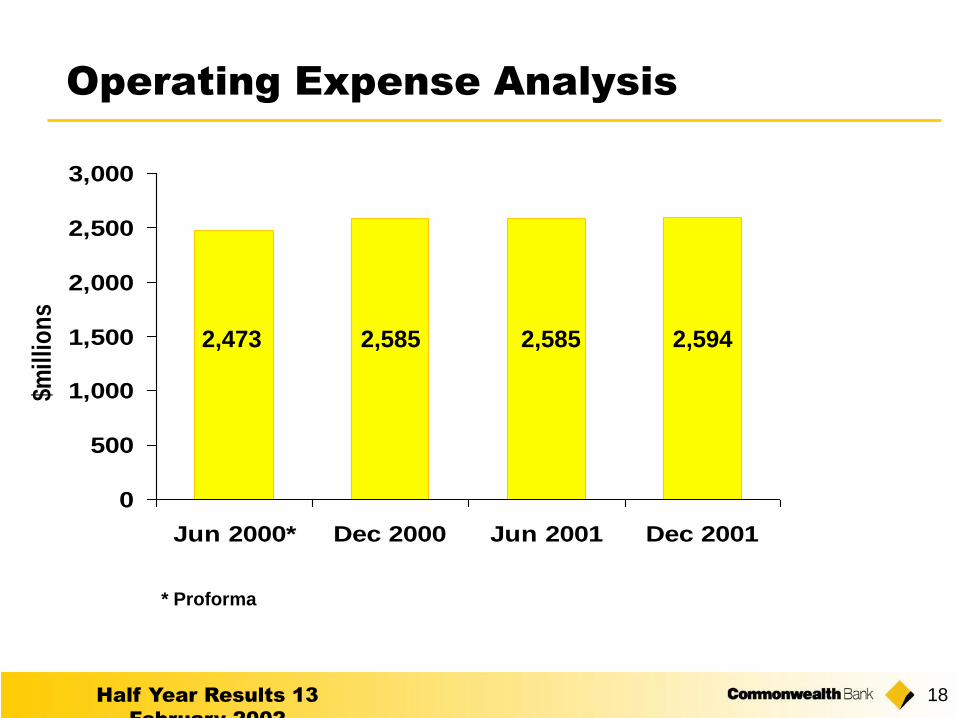
Operating Expense Analysis
0
500
1,000
1,500
2,000
2,500
3,000
Jun 2000* Dec 2000 Jun 2001 Dec 2001
$mil
lio
ns
2,585 2,585
* Proforma
2,473 2,594
Half Year Results 13
February 2002
19
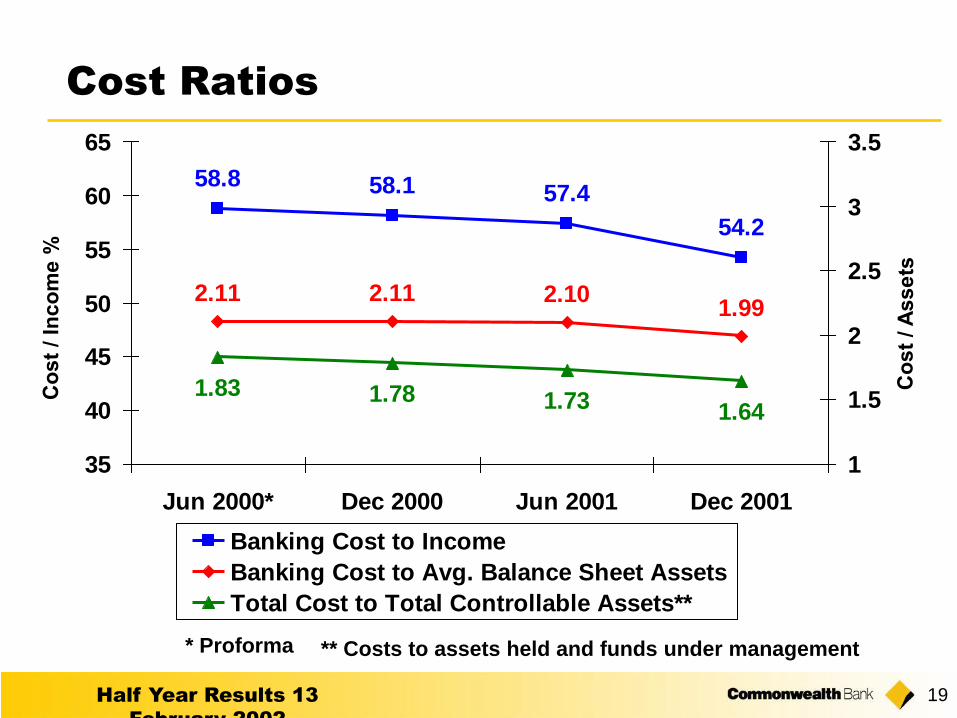
Cost Ratios
58.8 58.1 57.4
54.2
2.11 2.11 2.101.99
1.83 1.78 1.73 1.64
35
40
45
50
55
60
65
Jun 2000* Dec 2000 Jun 2001 Dec 2001
1
1.5
2
2.5
3
3.5
Banking Cost to Income
Banking Cost to Avg. Balance Sheet Assets
Total Cost to Total Controllable Assets**
** Costs to assets held and funds under management* Proforma

Segment Results
Half Year Results 13
February 2002
21
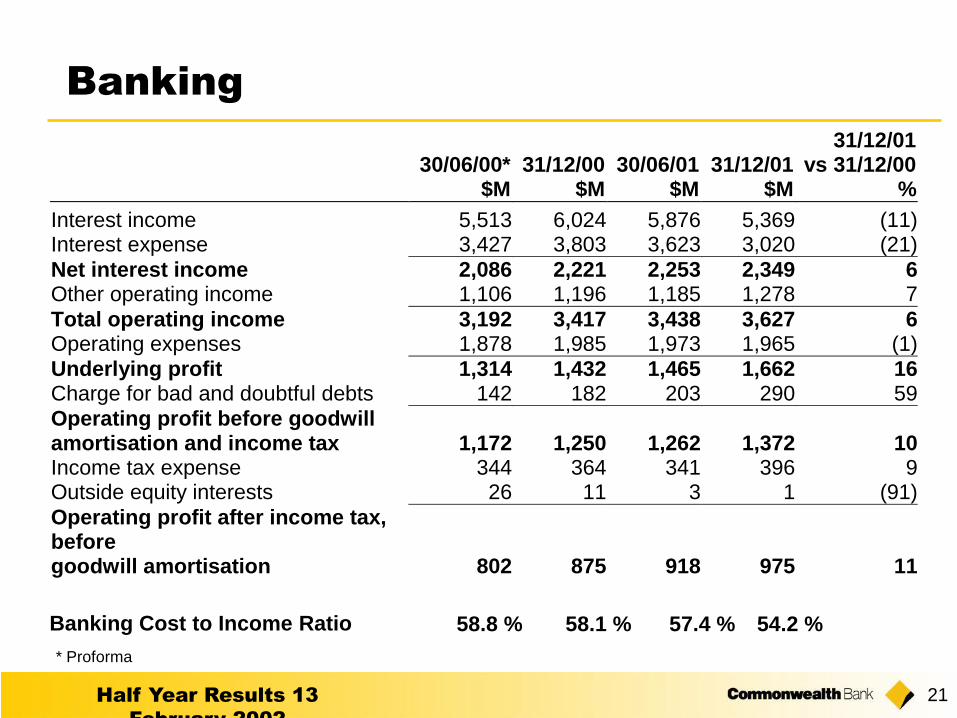
Banking
31/12/0130/06/00* 31/12/00 30/06/01 31/12/01 vs 31/12/00
$M $M $M $M %
Interest income 5,513 6,024 5,876 5,369 (11)Interest expense 3,427 3,803 3,623 3,020 (21)
Net interest income 2,086 2,221 2,253 2,349 6Other operating income 1,106 1,196 1,185 1,278 7
Total operating income 3,192 3,417 3,438 3,627 6Operating expenses 1,878 1,985 1,973 1,965 (1)
Underlying profit 1,314 1,432 1,465 1,662 16Charge for bad and doubtful debts 142 182 203 290 59
Operating profit before goodwillamortisation and income tax 1,172 1,250 1,262 1,372 10Income tax expense 344 364 341 396 9Outside equity interests 26 11 3 1 (91)
Operating profit after income tax,beforegoodwill amortisation 802 875 918 975 11
Banking Cost to Income Ratio 58.8 % 57.4 % 54.2 %58.1 %
* Proforma

Half Year Results 13
February 2002
22
Funds Management
31/12/0130/06/00* 31/12/00 30/06/01 31/12/01 vs
31/12/00$M $M $M $M %
Operating income 318 340 399 404 19Operating expenses 224 224 272 276 23
Operating profit before tax 94 116 127 128 10Income tax expense 31 38 56 32 (16)
Operating profit after tax 63 78 71 96 23
Funds Management
Cost to Income Ratio 70.4 % 68.2% 68.3 %65.9 %
* Proforma

Half Year Results 13
February 2002
23
Funds Under Management
27 29
24 2731 33
1822 23
24 26
20 22
22 2119
0
20
40
60
80
100
120
Jun 2000* Dec 2000 Jun 2001 Dec 2001
$b
illi
on
s
Australian Retail Funds** Australian Wholesale Funds
International Funds Australian Life Assets
93101
88
* Proforma ** Includes listed property trusts
106
Half Year Results 13
February 2002
24
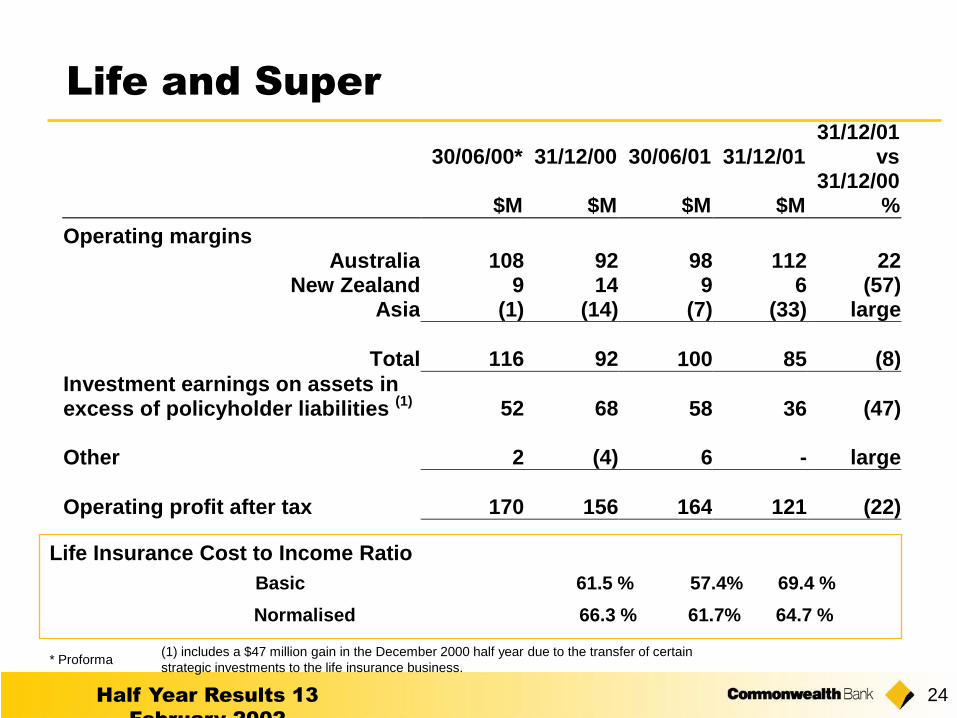
Life and Super
* Proforma
31/12/0130/06/00* 31/12/00 30/06/01 31/12/01 vs
31/12/00$M $M $M $M %
Operating marginsAustralia 108 92 98 112 22
New Zealand 9 14 9 6 (57)Asia (1) (14) (7) (33) large
Total 116 92 100 85 (8)
Investment earnings on assets inexcess of policyholder liabilities
(1) 52 68 58 36 (47)
Other 2 (4) 6 - large
Operating profit after tax 170 156 164 121 (22)
Life Insurance Cost to Income Ratio
57.4% 69.4 %61.5 %
61.7% 64.7 %66.3 %
Basic
Normalised
(1) includes a $47 million gain in the December 2000 half year due to the transfer of certain
strategic investments to the life insurance business.

Half Year Results 13
February 2002
25
Life and Super
Investment Earnings
Group Exposure & Market Returns (%):
Market Exposure* Key Market Index
at 31/12/01 Movement YTD
Australia 52% (1.9)%
US 22% (5.8)%
UK/Europe 13% (9.7)%
Other 3% (7.5)%
* % of total Group equity exposure
Net Earnings on Shareholders Assets
($m):
For period: 01/07/01- 31/12/01
Australia 15
New Zealand 3
Asia 18
Total 36

Half Year Results 13
February 2002
26
Business Value : Movement analysis
$m
Business Value as at 30 June 2001 8,003
Analysis of Movement since 30 June 2001
MoS / Cash Profits 217
Net Capital Movements 295
Disposals of Business (46)
Change in Shareholders NTA 466
Disposals of Business (15)
Net Appraisal Value Uplift 174
Increase to 31 December 2001 625
Business Value as at 31 December 2001 8,628

Balance Sheet
Asset Quality
Half Year Results 13
February 2002
29
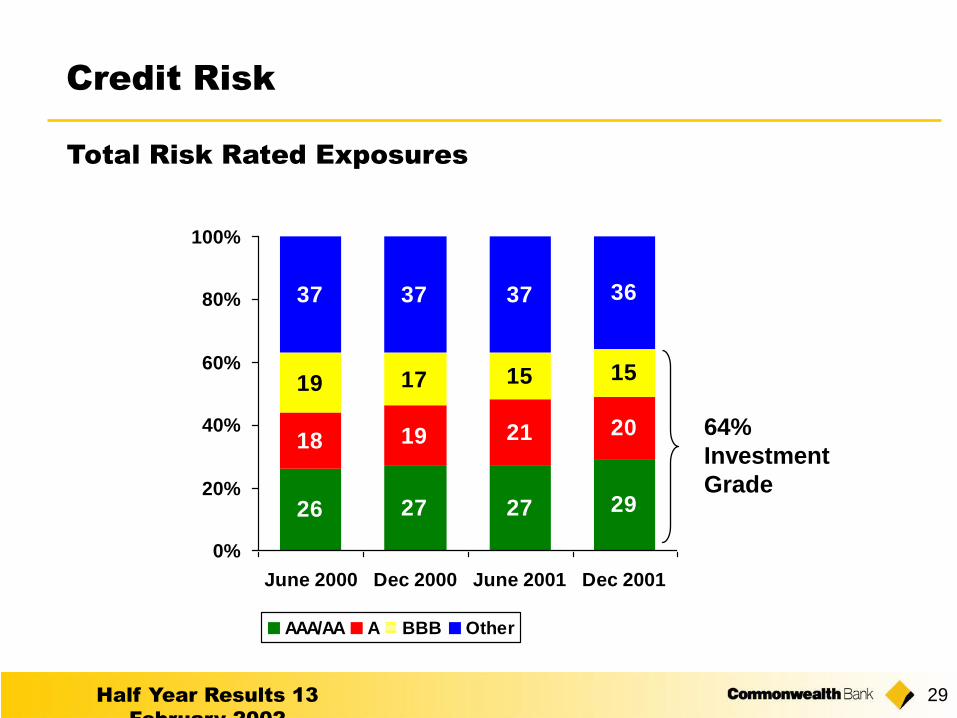
Total Risk Rated Exposures
Credit Risk
26 27 27 29
18 19 21 20
19 17 15 15
37 37 37 36
0%
20%
40%
60%
80%
100%
June 2000 Dec 2000 June 2001 Dec 2001
AAA/AA A BBB Other
64%
Investment
Grade

Half Year Results 13
February 2002
30
0
100
200
300
400
500
600
700
800
900
Dec 1999* Jun 2000 Dec 2000 Jun 2001 Dec 2001
0
0.5
1
1.5
2
%
Commowealth Bank Group (Other Countries)
Commonwealth Bank Group (Australia)
Net Impaired assets as % of Risk Weighted Assets (axis on right)
Net Impaired Assets
* Commonwealth Bank Group excluding Colonial
$ million %

Half Year Results 13
February 2002
31
0
500
1000
1500
2000
2500
Dec
1993
Dec
1994
Dec
1995
Dec
1996
Dec
1997
Dec
1998
Dec
1999
Dec
2000
Dec
2001
0
6
12
18
24
30
36
%
Commowealth Bank Group (Other Countries)*
Commonwealth Bank Group (Australia)*
Net Impaired assets as % of Total Shareholder Equity* (axis on right)
Net Impaired Assets
* Excluding Colonial prior to 30 June 2000
Asian Crisis
Acquisition
of Colonial
Two Accounts
%
Half Year Results 13
February 2002
32
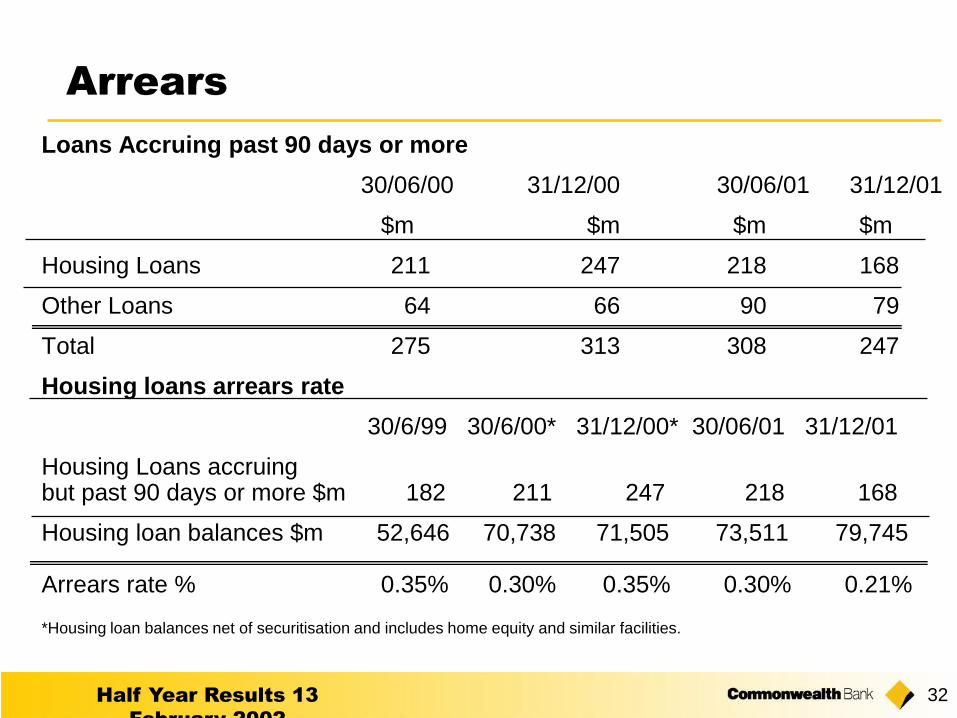
Arrears
Loans Accruing past 90 days or more
30/06/00 31/12/00 30/06/01 31/12/01
$m $m $m $m
Housing Loans 211 247 218 168
Other Loans 64 66 90 79
Total 275 313 308 247
Housing loans arrears rate
30/6/99 30/6/00* 31/12/00* 30/06/01 31/12/01
Housing Loans accruingbut past 90 days or more $m 182 211 247 218 168
Housing loan balances $m 52,646 70,738 71,505 73,511 79,745
Arrears rate % 0.35% 0.30% 0.35% 0.30% 0.21%
*Housing loan balances net of securitisation and includes home equity and similar facilities.

Half Year Results 13
February 2002
33
Credit Risk: Historical P&L Charge
0.00%
0.05%
0.10%
0.15%
0.20%
0.25%
Dec-98* Jun-99* Dec-99 Jun-00 Dec-00 Jun-01 Dec-01
Bad Debt Expense / RWA
* Excludes Colonial
% C
harg
e P
er
Half

Half Year Results 13
February 2002
34
0
200
400
600
800
1,000
1,200
1,400
1,600
1,800
2,000
Jun
94
Dec
94
Jun
95
Dec
95
Jun
96
Dec
96
Jun
97
Dec
97
Jun
98
Dec
98
Jun
99
Dec
99
Jun
00*
Dec
00*
Jun
01*
Dec
01
0
50
100
150
200
250
300
%
General Provision
Specific Provision
Total Provisions/Gross Impaired Assets (axis on right)
Aggregate Provisions
* Includes Colonial
$m
illio
ns

Half Year Results 13
February 2002
35
General Provision
500
700
900
1100
1300
1500
1700
1900
2100
Jun 01
1,399
Charged
to P&L
+290
Used for
Specific
Provisions
-356
Other
+1
Dec 01
$m
APRA
Requirement
1,334
974
Surplus 360
(37% above
APRA
requirement)
Half Year Results 13
February 2002
36
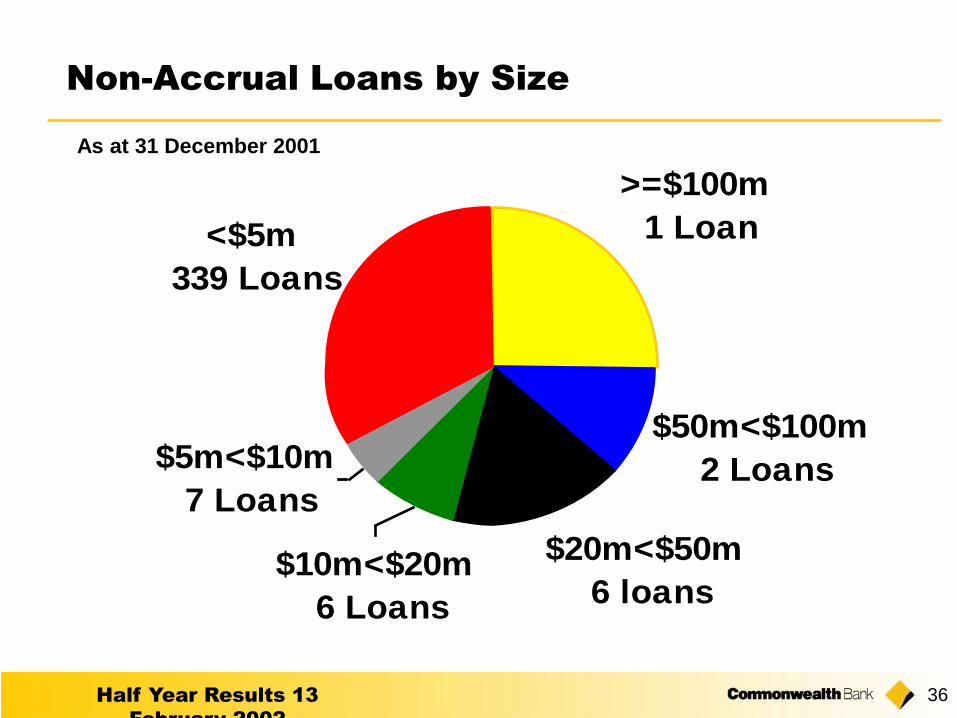
Non-Accrual Loans by Size
<$5m
339 Loans
>=$100m
1 Loan
$50m<$100m
2 Loans
$20m<$50m
6 loans$10m<$20m
6 Loans
$5m<$10m
7 Loans
As at 31 December 2001

Half Year Results 13
February 2002
37
Specific Provisions by Size
$50m<$100m
1 Loan
$20m<$50m
2 Loans
$10m<$20m
3 Loans$5m<$10m
3 Loans
<$5m
141 Loans
As at 31 December 2001
Half Year Results 13
February 2002
38
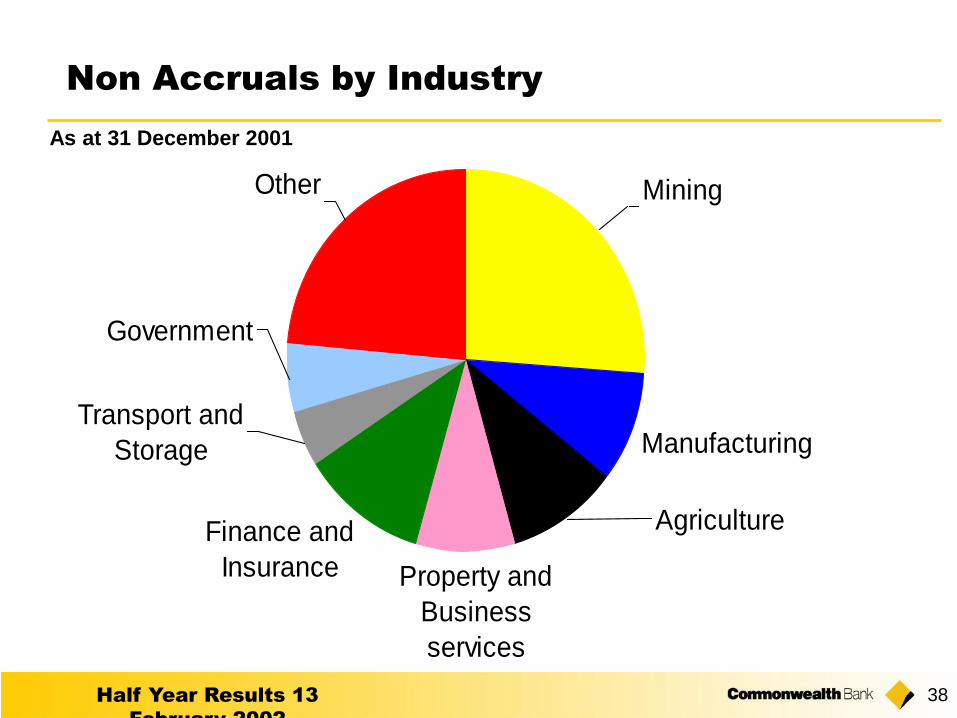
Non Accruals by Industry
Other Mining
Manufacturing
Agriculture
Property and
Business
services
Finance and
Insurance
Government
Transport and
Storage
As at 31 December 2001

Half Year Results 13
February 2002
39
Specific Provisions by Industry
Other
Manufacturing
Mining
Agriculture
Property and
Business
ServicesFinance and
Insurance
Government
Transport
and Storage
As at 31 December 2001
Half Year Results 13
February 2002
40
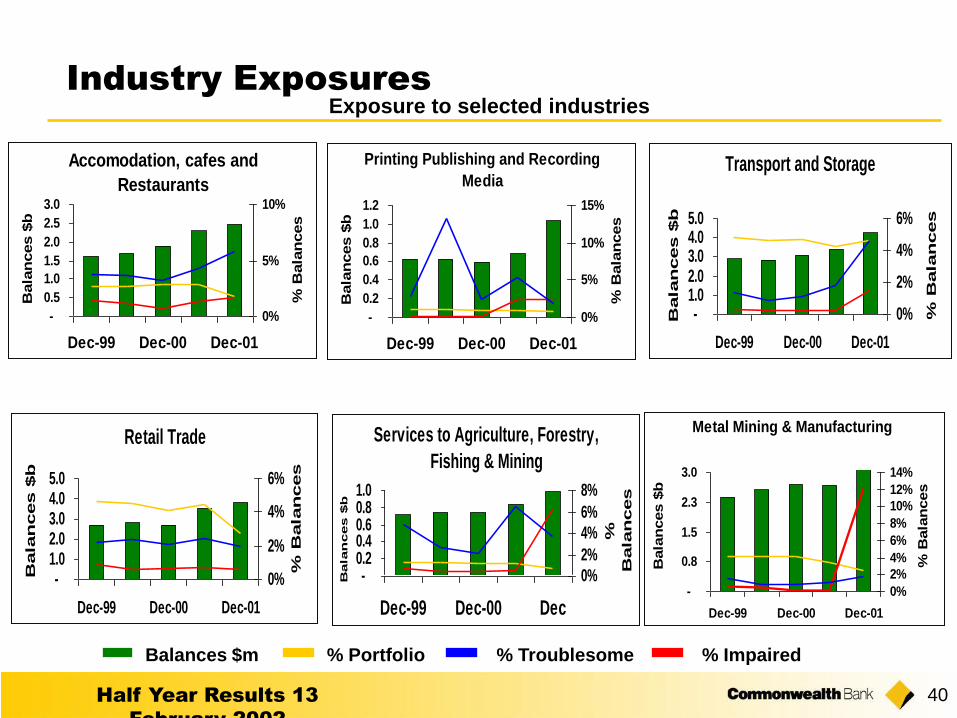
Industry Exposures
Printing Publishing and Recording
Media
-
0.2
0.4
0.6
0.8
1.0
1.2
Dec-99 Dec-00 Dec-01B
ala
nces $
b
0%
5%
10%
15%
% B
ala
nces
Services to Agriculture, Forestry,
Fishing & Mining
-0.20.40.60.81.0
Dec-99 Dec-00 Dec
Bala
nces $
b
0%
2%
4%
6%
8%
%
Bala
nces
Retail Trade
-1.02.03.04.05.0
Dec-99 Dec-00 Dec-01
Bala
nces $
b
0%
2%
4%
6%
% B
ala
nces
Transport and Storage
-1.02.03.04.05.0
Dec-99 Dec-00 Dec-01
Bala
nces $
b
0%
2%
4%
6%
% B
ala
nces
Metal Mining & Manufacturing
-
0.8
1.5
2.3
3.0
Dec-99 Dec-00 Dec-01
Bala
nces $
b
0%
2%
4%
6%
8%
10%
12%
14%
% B
ala
nces
Balances $m % Portfolio % Troublesome % Impaired
Exposure to selected industries
Accomodation, cafes and
Restaurants
-
0.5
1.0
1.5
2.0
2.5
3.0
Dec-99 Dec-00 Dec-01
Bala
nces $
b
0%
5%
10%
% B
ala
nces

Integration of Colonial

Half Year Results 13
February 2002
42
Integration Synergies
June2003
Forecast
31/12/00$M
30/06/01$M
31/12/01$M
Recognised Synergies
Cost 20 100 150
Revenue 5 17 20
Annualised Synergies
Cost 380 80 275 320
Revenue 70 10 40 45
Total 450 90 315 365
Half Year Results 13
February 2002
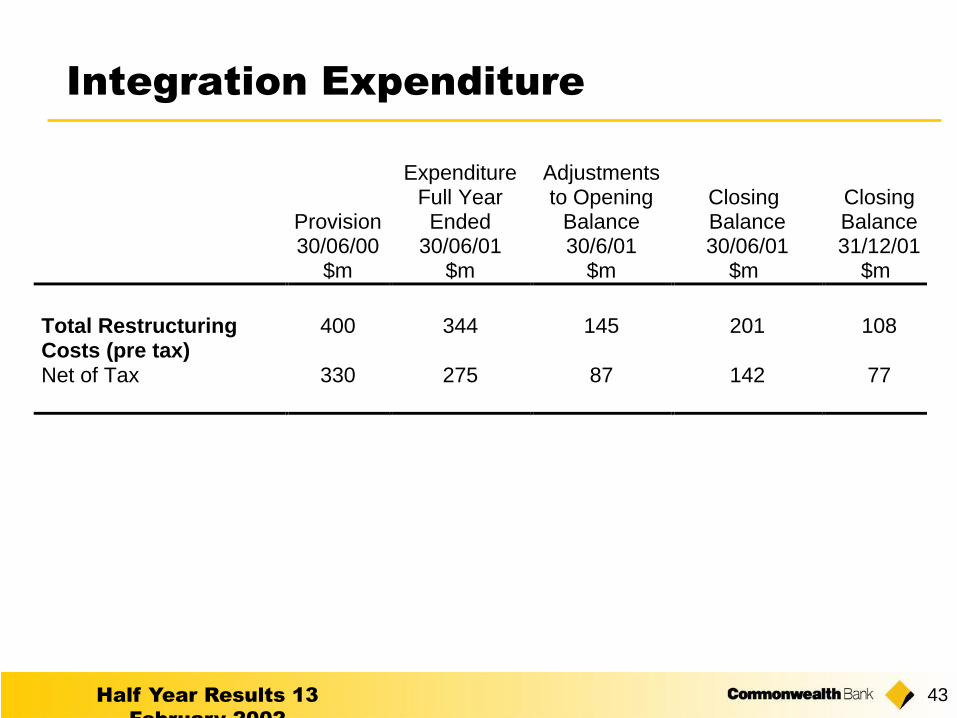
43
Integration Expenditure
Provision30/06/00
$m
ExpenditureFull YearEnded
30/06/01$m
Adjustmentsto Opening
Balance30/6/01
$m
ClosingBalance30/06/01
$m
ClosingBalance31/12/01
$m
Total RestructuringCosts (pre tax)
400 344 145 201 108
Net of Tax 330 275 87 142 77

Funding and Capital

Half Year Results 13
February 2002
45
Funding Sources
0
20
40
60
80
100
Jun 2000* Dec 2000 Jun 2001 Nov 2001
0
25
50
75
100
Total Retail Deposits (LHS)
Market Share of Retail Deposits (RHS)
Retail Funding % (RHS)
A$b Retail %
*Proforma
Half Year Results 13
February 2002
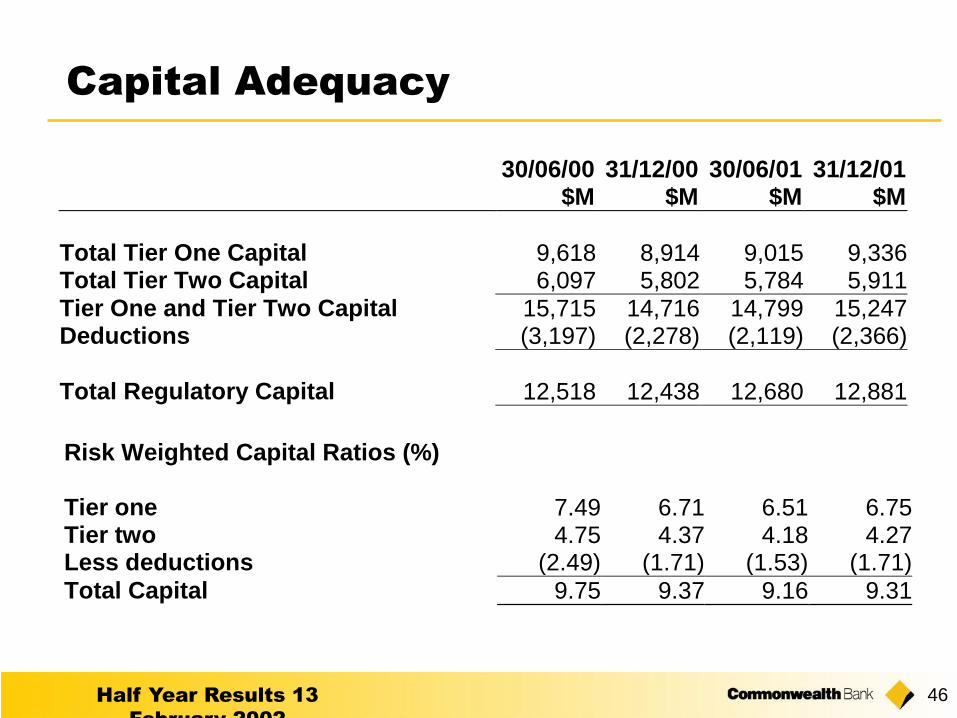
46
Capital Adequacy
30/06/00 31/12/00 30/06/01 31/12/01$M $M $M $M
Total Tier One Capital 9,618 8,914 9,015 9,336Total Tier Two Capital 6,097 5,802 5,784 5,911Tier One and Tier Two Capital 15,715 14,716 14,799 15,247Deductions (3,197) (2,278) (2,119) (2,366)
Total Regulatory Capital 12,518 12,438 12,680 12,881
Risk Weighted Capital Ratios (%)
Tier one 7.49 6.71 6.51 6.75Tier two 4.75 4.37 4.18 4.27Less deductions (2.49) (1.71) (1.53) (1.71)
Total Capital 9.75 9.37 9.16 9.31

Half Year Results 13
February 2002
47
Capital Management
Hybrid capital
On-market buy-back of the dividend reinvestment plan
shares in respect of the interim dividend payable in March 2002
BIS II
Half Year Results 13
February 2002
48
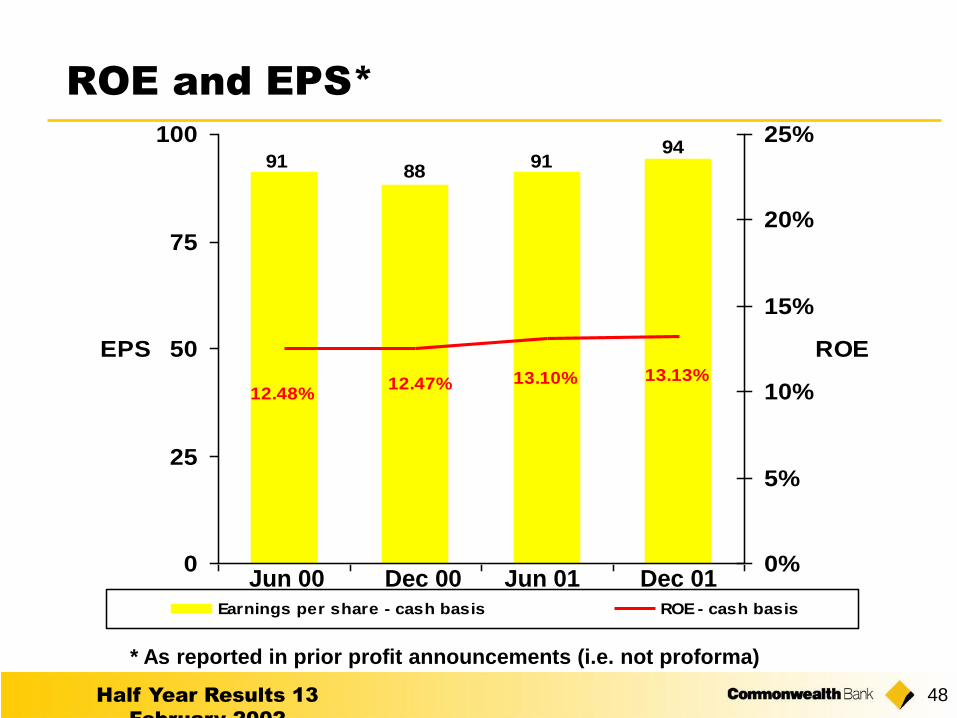
ROE and EPS*
* As reported in prior profit announcements (i.e. not proforma)
919188
94
12.48%12.47% 13.10% 13.13%
0
25
50
75
100
EPS
0%
5%
10%
15%
20%
25%
ROE
Earnings per share - cash basis ROE - cash basis
Jun 00 Dec 00 Jun 01 Dec 01

Half Year Results 13
February 2002
49
Annual Dividends
20 2024
36 3845 46 49
58 6168
20 22
36
4652
57 58
66
7572
0
25
50
75
100
125
150
1992 1993 1994 1995 1996 1997 1998 1999 2000 2001 2002
Ce
nts
0
10
20
30
40
50
60
70
80
90
100
%
First Half Second Half Payout Ratio

Overview
Half Year Results 13
February 2002
51
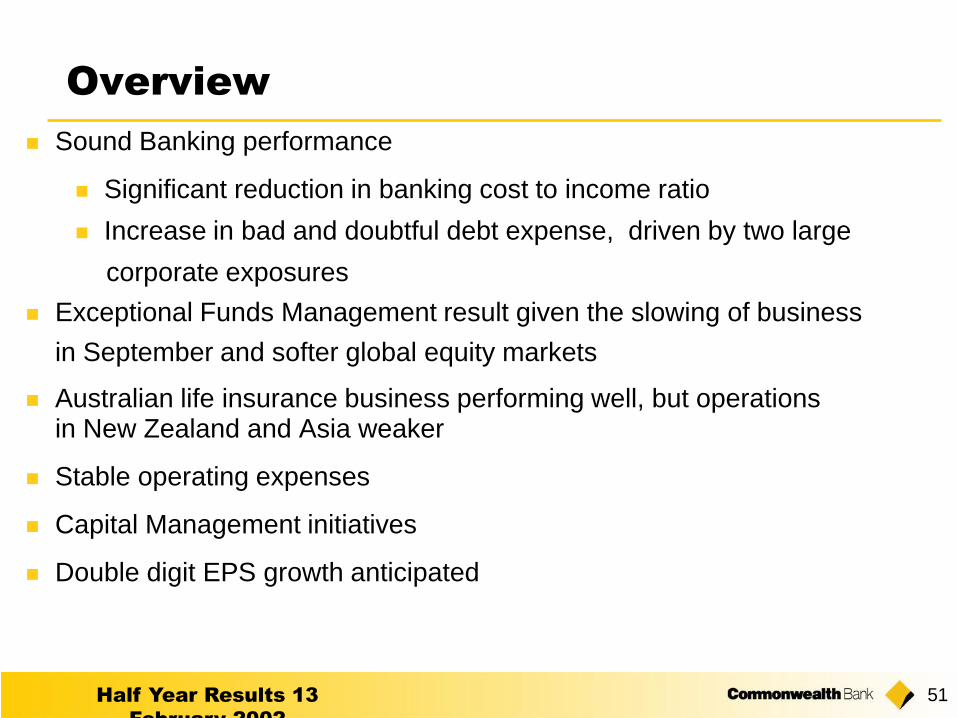
Overview
Sound Banking performance
Significant reduction in banking cost to income ratio
Increase in bad and doubtful debt expense, driven by two large
corporate exposures
Exceptional Funds Management result given the slowing of business
in September and softer global equity markets
Australian life insurance business performing well, but operationsin New Zealand and Asia weaker
Stable operating expenses
Capital Management initiatives
Double digit EPS growth anticipated

Presentation of Half Year Results
13 February 2002
www.commbank.com.au