presentation materials re: third quarter 2016 results of operations
TRANSCRIPT
14 November 2016 Philippine Dealing & Exchange Corp. 37th Floor, Tower 1, The Enterprise Center 6766 Ayala Avenue corner Paseo de Roxas Makati City Attention: Ms. Vina Vanessa S. Salonga Head – Issuer Compliance and Disclosure Department Gentlemen: We refer to the Issuer Disclosures Operating Guidelines which requires 8990 Holdings, Inc (the “Company”), as issuer of the fixed rate bonds listed with PDEx to submit a disclosure on the Presidents report for the 3rd Quarter of 2016.
Thank you!
Sincerely,
Tani S. Basman Investor Relations Officer

THIRD QUARTER 2016RESULTS OF OPERATIONS FOR 9M16
ANALYST’S BRIEFING

Approval Date November 7, 2016
Record Date November 21, 2016
Pay out Date November 28, 2016
Policy P 0.05 / share
Amount 275,899,536.00
8990 Board of Directors approved onNovember 7, 2016 a P0.05 per sharedividend for HOUSE shareholders.Record date will be on November 21,2016. dividend pay out is on November28, 2016.
Dividend Declaration
In million pesos 3Q16 3Q15 GrowthRate
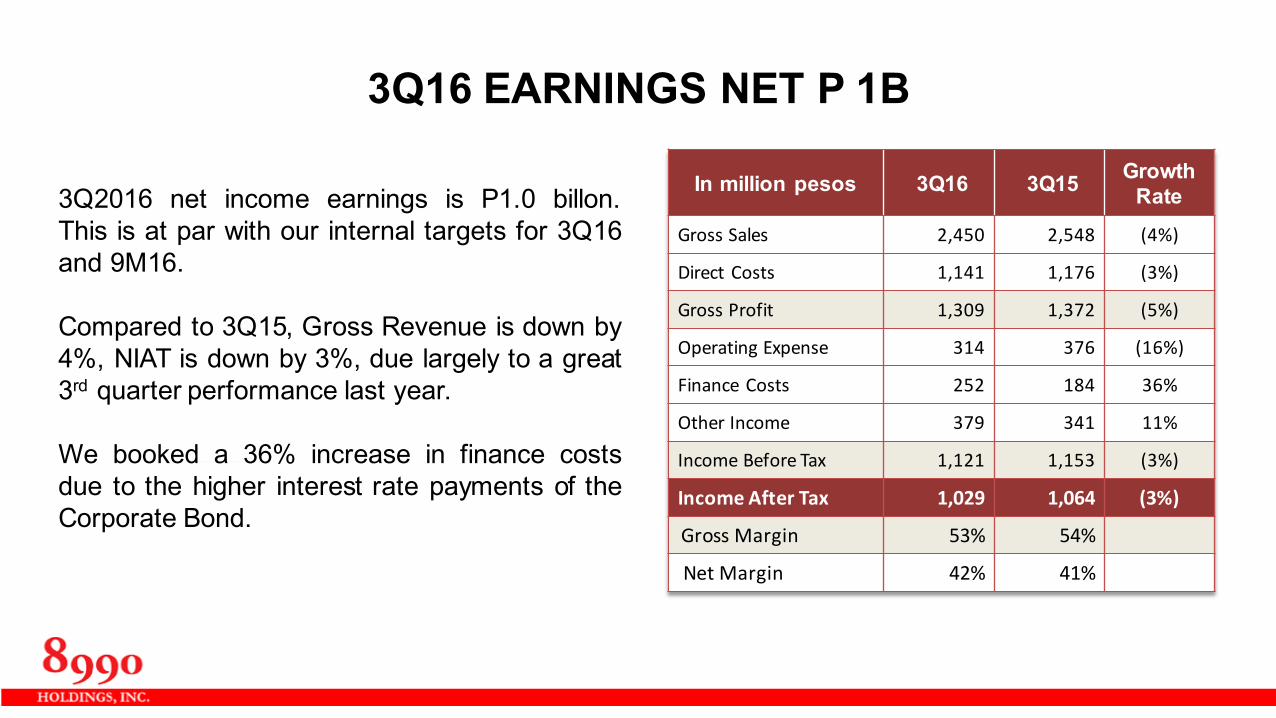
Gross Sales 2,450 2,548 (4%)
Direct Costs 1,141 1,176 (3%)
Gross Profit 1,309 1,372 (5%)
Operating Expense 314 376 (16%)
Finance Costs 252 184 36%
Other Income 379 341 11%
Income Before Tax 1,121 1,153 (3%)
Income After Tax 1,029 1,064 (3%)
Gross Margin 53% 54%
Net Margin 42% 41%
3Q2016 net income earnings is P1.0 billon.This is at par with our internal targets for 3Q16and 9M16.
Compared to 3Q15, Gross Revenue is down by4%, NIAT is down by 3%, due largely to a great3rd quarter performance last year.
We booked a 36% increase in finance costsdue to the higher interest rate payments of theCorporate Bond.
3Q16 EARNINGS NET P 1B

FACTORS THAT AFFECTED 3Q16 PERFORMANCE
WEATHER
Only 50% Sunny buildable days, which slowed the rampup of ongoing and recently launched projects, specially inLuzon.
DELAYED PERMITS
We experienced delays in permits for six projects:DHPRR2, UDH Tisa2, DH Mactan Prime, DH Bacolod,Davao’s DH Mulig and DH Lorenzo that should havecontributed 926 units. There were new LGUrequirements in Davao City, as well as stricterenvironmental regulations for the Bacolod and Iloiloprojects.
Sunny49%
Overcast / Wet25%
Rainy26%
LUZON
MINDANAO
VISAYAS
OPERATIONAL ISSUES
The building boom around our locations has resulted inlabor availability pressures, as well as delays in thedelivery of materials due to supplier’s allocations andtraffic.
WEATHER CHART NATIONWIDE

FACTORS THAT AFFECTED 3Q16 PERFORMANCE
LUZON
DH MARILAO - 2 months delayed. Weatheraffected backfilling works, compaction and theset-up of tempo facilities and casting area.
UDH HAMPTON – 2 months delayed. Newlyhired sub-contractors, a new 2-bedroommodel requiring a steeper learning curve, afast turnover of workers, and a limited pool ofskilled workers to choose from.
VISAYAS
DH PAVIA RR – 2 months delayed. Replacementof the general contractor, Stricter qualityimplementation, rain and scarcity of aggregates.
UDH CORTEZ– 2 months delayed. Same issuesas UDH Hampton, and the availability of pre-mixsuppliers.
DH TALISAY – 3 months delayed. Generalcontractor execution issues, scarcity of labor,and limited access to equipment due to roadaccess repair which slowed pre-mix deliveries.

In million pesos 9M16 9M15 GrowthRate
Gross Sales 7,186 6,997 3%
Direct Costs 3,151 2,997 5%
Gross Profit 4,035 4,000 1%
Operating Expense 1,115 1,110 0%
Finance Costs 663 403 64%
Other Income 1,120 954 17%
Income Before Tax 3,377 3,441 (2%)
Income After Tax 3,189 3,166 1%
Gross Margin 56% 57%
Net Margin 44% 45%
9M2016 net income earnings reached over P3Billion, representing a 1% increase year-on-year.Gross sales grew by 3% for the same period.Net margin is stable at 44%.
The 17% increase in “Other Income” was due tothe growth in interest income from the CTS, andthe portfolio reclassification of non-core revenuefrom the top line of Azalea Hotel.
The 5% increase in direct costs was due to thebooking of re-sale accounts based on netrealizable value. The 64% growth in financecosts was due higher interest payment of thecorporate bonds.
8990 EARNINGS GROW 1% IN 9M16

8990 CORE OPERATIONS EXCEED 9M16 TARGETS BY 17%
In 9M16, Visayas and Mindanao over-performed to provide our housingoperations delivery of 6,566 units, andP7.1 Billion performance, exceedingthe 9M16 target by 17%.
9M16 performance target was set at6,548 housing units and P6.1 Billion inhousing value, representing 50% oftotal committed performance of P12Billion in 2016.
AreaHousing Delivered in 9M16 Value
PerformanceRatio
Units ValueTarget Actual Target Actual
NCR 312 229 P 405 M P 321 M 79%
Luzon 2,014 1,340 1,805 1,336 74%
Visayas 2,295 2,760 2,298 3,318 144%
Mindanao 1,927 2,237 1,582 2,154 136%
Total HousingDelivered
6,548 6,566 P 6,090 M P 7,129 M 117%

CAVITE, ILOILO AND DAVAO EXCEED TARGETS
No. of Units TargetHousing Delivered in 9M16 Performance
RatioFresh Resale TotalNorth Luzon 1,350 400 170 570 42%NCR 312 184 45 229 73%South Luzon 664 532 238 770 116%Iloilo/Bacolod 1,050 1,479 103 1,582 151%Cebu 1,245 1,066 112 1,178 95%Gen San 720 614 0 614 85%Davao 1,207 1,401 222 1,623 134%Total Deliveries 6,548 5,676 890 6,566 100%
Peso Value TargetHousing Revenue in 9M16 Performance
RatioFresh Resale TotalNorth Luzon P 1,225M P 412 M P 167 M P 579 M 47%NCR 405 261 60 321 79%South Luzon 580 488 269 757 131%Iloilo/Bacolod 993 1,830 123 1,953 197%Cebu 1,305 1,225 140 1,365 105%Gen San 332 343 0 343 103%Davao 1,250 1,561 250 1,811 145%Total Deliveries P 6,090 M P 6,120 M P 1,009 M P 7,129 M 117%
Against 9M16 targets, 8990 wason target deliveries of completedhousing units to individual buyers.
Iloilo, Davao and SouthernLuzon, outperformed in 9M16,bringing in 197%, 145% and131% in value performance,respectively.
As of 9M16, average price perunit is P 1.09M compared toP1.08M of 9M15.
8990 CORE INCOME RISES BY 5% in 9M16
In units / Million pesos 9M16 9M15 Growth Rate
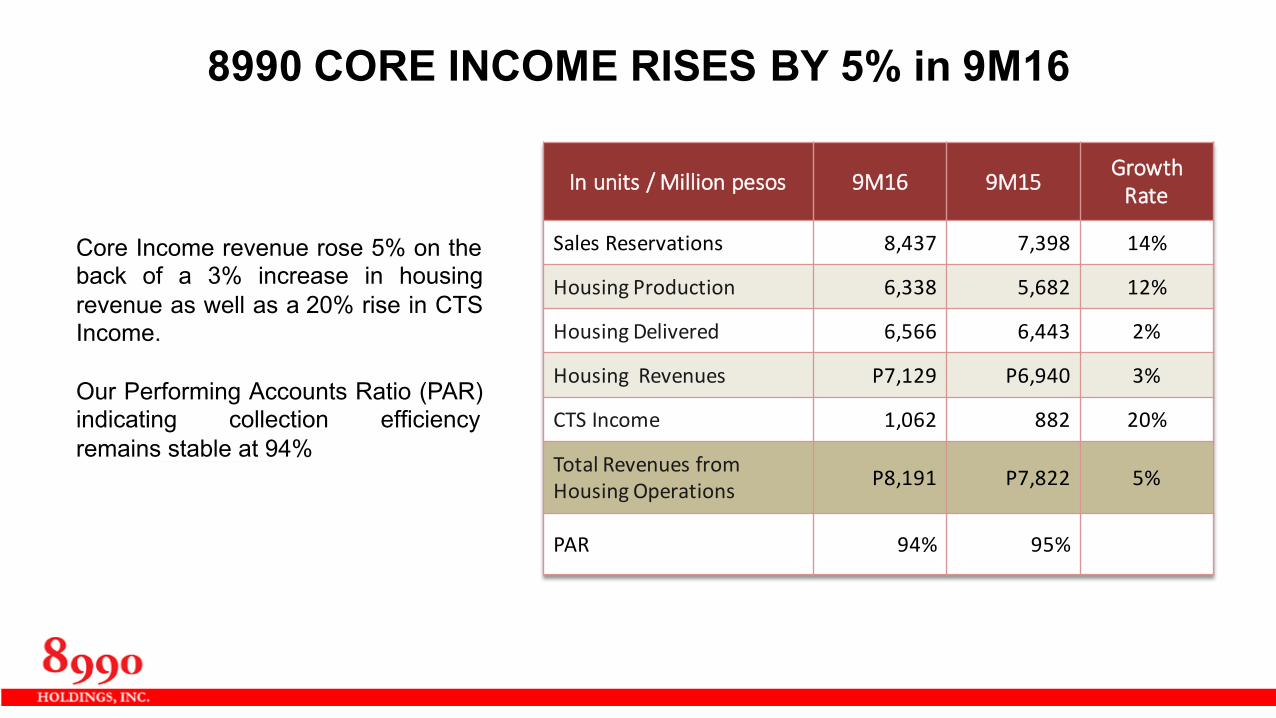
Sales Reservations 8,437 7,398 14%
Housing Production 6,338 5,682 12%
Housing Delivered 6,566 6,443 2%
Housing Revenues P7,129 P6,940 3%
CTS Income 1,062 882 20%
Total Revenues from Housing Operations P8,191 P7,822 5%
PAR 94% 95%
Core Income revenue rose 5% on theback of a 3% increase in housingrevenue as well as a 20% rise in CTSIncome.
Our Performing Accounts Ratio (PAR)indicating collection efficiencyremains stable at 94%

In million pesos Fresh Resale
Gross Sales 6,120 1,009
Direct Costs 2,249 811
Gross Profit 3,871 198
Operating Expense* 959 156
Finance Costs* 570 93
Other Income* 963 157
Income Before Tax 3,305 106
Income After Tax 3,144 80
Gross Margin 63% 20%
Net Margin 51% 8%
New sales accounted for nearly 86% of grossincome in 9M16, with gross and net marginsway above the 8990 benchmarks of 60% and40%, respectively.
14% of gross sales came from cancelledaccounts, which under the present AuditStandards, require the booking of direct costsbased on Net Realizable Value. This has aneffect of lowering of margins for the resaleaccounts, and also impacts on the overallmargins of the Income Statement.
FRESH SALES IS 86% OF GROSS INCOME IN 9M16
*Allocated based on percentage of sales

North Luzon, 7%
South Luzon, 9%
Cebu, 19%
Davao , 25%NCR, 3%
Gen San, 11%
Iloilo, 26%
DELIVERED HOUSING UNITS
Mass Housing, 86%
MRB, 14%
TOP LINE REVENUE BREAKDOWN
In 9M16, 8990 delivered a total of 5,676 freshunits to homeowners nationwide.
Visayas projects in iloilo and Cebu delivered2,545 completed units or 45% of 9M16 housingdeliveries. Mindanao delivered 2,015 units or36% while Luzon contributed 1,116 units or19% of housing deliveries.
In terms of housing value, Visayas contributed50% while Mindanao and Luzon contributed31% and 19% of total revenue, respectively.
86% of Revenue or P6.13B came from housingsubdivision projects, while 14% or P995.7million came from the medium-rise building(MRB) projects in Cebu and Muntinglupa.
VISAYAS DELIVERS MORE HOMES IN 9M16

Demographic Subdivision Condominium
Young: 86% 81%
20 to 35 Years Old 57% 53%
36 to 45 Years Old 29% 28%
College Educated andLicensed Professionals 85% 94%
Gainfully Employed: 100% 100%
Office Workers 46% 44%
OFW 26% 14%
BPO 4% 18%
Minimum P26,000 Gross Family Income 76% 84%
Primary Residence Purpose 88% 67%
DECA HOMES MARKET YOUNG, EDUCATED, EMPLOYED, LOOKING FOR PRIMARY RESIDENCES
The market for DECA Homes buyersremain consistent with pastdemographics: aged 20 to 45 yearsold, more than half are millennial,college graduates, gainfully employedwith a minimum monthly gross familyincome of at least P26,000.00.
About 20% of our buyers are OFWsand 10% are BPO employees.Majority of our buyers purchase forprimary residential purposes.

UNREALIZED SALES REACH 1,937 UNITS ENDING 3Q16
Unrealized sales as of 3Q16 reached1,937 units worth P2.45 Billion.
Of the total, 479 units from NCR willnot be taken out this year as theschedule of delivery would be on the1H17.
Thus, the remaining 1,458 unrealizedsales, valued at P1.8 Billion, represent24% of our 4Q16 target of 6,161 units.
Branch TotalUnits
ValueMillions
North Luzon 286 371.8
NCR 1,030 1,339.0
South Luzon 180 158.4
Cebu 409 552.5
Iloilo 0 0.0
GenSan 2 0.9
Davao 30 30.0
Total 1,937 2,452.6

RFO INVENTORY EQUALS 1,113 UNITS IN 3Q16
RFO inventory in 3Q16 ended at 1,113 units,20% higher than 2Q16’s 926 units.
We continue to tweak North Luzon’s DCRR salespolicies, specially on the proof of informalincome, and introduce an upgraded completemodel in the 4th quarter.
While sales performance for General Santos washighest in 3Q16 at 290 units, housing productionalso registered its highest ever at 444 units. Asthe project gain more momentum, we can expectbetter matching of both sales and construction.
We are carrying an inventory of 451 resale units,18% lower than last quarter’s figure of 535 units.
Branch Fresh Resale Total
North Luzon 367 0 367
NCR 103 27 130
South Luzon 5 56 61
Iloilo 0 0 0
Cebu 6 0 6
Gen San 181 92 273
Davao 0 276 276
Total 662 451 1,113

(In Php M) 1Q16 2Q16 3Q16
Revenue 2,173.88 2,562.47 2,392.18
Total Receipts from Operations 1,210.86 1,383.39 1,897.07
Total Disbursement for Operations 1,736.85 1,264.58 1,470.99
Cash flow from Operations (525.99) 118.81 426.08
Total Capital Expenditure 267.26 4,251.66 434.49
Total Finance Cost 185.49 225.38 236.47
Loan Availment(net of payment) 2,168.37 4,267.67 278.63
Net Cash before Dividend 1,189.63 (90.56) 33.75
Dividend 1,379.50 -‐ -‐
Add: Cash, beginning 600.23 410.36 319.80
Cash balance, ending 410.36 319.80 353.55
8990 OPERATING CASH FLOW REMAINS POSITIVE IN 3Q16
8990’s cashflows from operationsremained positive in 3Q16, due toincreased levels of HDMF take-outs,monthly amortization collections on aP21.2 Billion CTS Portfolio and saleof CTS to banks.
This translates to 259% increase inoperating cashflow from 2Q16 level.Because of the P426 Million cash inflow from operations, 8990 Grouponly increased net borrowing byP279 Million in 3Q16.

Balance Sheet Highlights(in PhP M)
As of Sept 30, 2016
As of Sept 30 2015
GrowthRate
Current Assets P 10,752 P 7,892 36%
Non-current Assets 34,166 26,566 29%
Total Assets 44,918 34,458 30%
Current Liabilities 7,886 4,669 69%
Non-current Liabilities 17,880 13,003 38%
Total Liabilities 25,766 17,672 46%
Equity 19,152 16,786 14%
36% INCREASE IN ASSETS STRENGTHENS 8990 BALANCE SHEET
8990’s current assets grew by 36% mainlydue to the increased work in progressinventories brought about by the on-goingconstruction of EDSA Tower and UDHManila.
The 69% growth in current liabilities is dueto the increased trade payables broughtabout by more favorable longer termsnegotiated with suppliers.

Key Performance Indicators As of Sept 30, 2016
As of Sept 30, 2015
Current Ratio 1.36 1.69
Book Value per Share 3.47 3.04
Net Debt to Equity Ratio 1.14 0.84
Asset to Equity Ratio 2.35 2.05
Asset to Debt Ratio 1.74 1.95
Debt Service Ratio 1.54 6.13
Interest Coverage Ratio 19.02 14.69
EPS 0.58 0.57
8990 BOOK VALUE PER SHARE POSTS 14% GAIN IN 9M16
The increase in book value by 14% indicates theincreasing value of the company over time.
8990’s Current Ratio remains stable in 9M16mainly due to increased work in progressinventory from UDT EDSA and UDH Manila. Stillhigher than the covenant ratio of 1:1, we expectthe current ratio to remain stable as we begintake-outs for the condominium projects by the endof the year.
Net debt to equity ratio increased, but still wellwithin acceptable limit of 1.5 times based on theCorporate Bond Covenant. Increased interestcoverage ratio is due to higher interest EBITDAresulting from favorable performance in 9M16.

Status9M16 9M15 Growth Rate
Unit Value Unit Value Unit Value
Total HDMF Folders 5,304 5,157 2,601 2,358 104% 119%
BreakdownPre-‐Evaluation with HDMF 955 1,056 702 638
For Compliance by 8990 Branches 2,290 2,158 400 364
For Take-‐Out 263 214 0 0
9M TAKE-‐OUT 1,796 1,729 1,499 1,356 20% 28%
9M16 HDMF TAKE-OUT VALUE INCREASES BY 28%
HDMF take out in 9M16 increasedby 28% in value, or almost P400Million year on year.
The 104% increase in foldersubmission to HDMF was mainlythe driver to the increase in HDMFtake out. P214 million is beingprocessed for take-out as of today.
For 1H16, 8990 was awarded byHDMF as the No. 1 developer inMindanao, and will receive thesame distinction for Visayas thismonth. We are also No. 4 in NorthLuzon and 7th in South Luzon.

8990 CTS INCOME GROWS BY 20% IN 9M16
Our CTS receivables portfolio grew16% in value from P18.3 Billion toP21.2 Billion at the end of 9M16.
Its interest income yield of P1.06Billion is 20% higher than last year’sP882 Million.
Performing accounts ratio remainsstable at 94%.
9M16 9M15 GrowthRate
Value (in millions) P 21,190 P 18,302 16%
Units 25,048 20,874 20%
Interest Income from CTS P 1,062 P 882 20%
Performing Accounts Ratio 94% 96% -2%

Mix According to Interest Rate
Up to 5 yrs2% 6 to 10 yrs
8% 11 to 15 yrs10%
16 to 20 yrs8%21 to 25 yrs
72%
Mix According to Terms
2 to 3 years19%
1 to 2 years23%
Mix According to Seasoning
8990 CTS RECEIVABLES REACH P21 B AS OF 9M16
80% of 8990’s In-‐House Receivablescarry an interest rate of 11% perannum, but with a rebate of 1.5%for the first 5 years as long as buyerspay on time. The other 20% are oldaccounts signed under earlier CTSPrograms.
72% of 8990 buyers choose 21 to 25years payment term which offersthem the lowest monthlyamortization possible, and thereforea lower risk of default.
56% of the portfolio are seasoned forat least one year, which is eligible forCTS purchase and securitization bythe banks. We target to migrate toHDMF P4.0 Billion of the remaining44% below 1-‐year seasoning,estimated to be about P9.1 billion.
11% CTS80%
8.5% CTS13%
11.5% CTS6%
>11.5% CTS1%
Less than 1 year44%
3 years and above16%

8990 LANDBANK IS NOW 548 HECTARES
Location Hectares No. of Units
Value(Billion P)
North Luzon 0 0 0
NCR 72.3 50,603 77,361
South Luzon 0 0 0
Visayas 301.6 45,580 38,061
Mindanao 173.6 13,635 13,422
Total 547.5 109,818 128,844
8990’s landbank as of 3Q16 is now548 hectares with an expected yield ofabout 109,818 units worth P129Billion.
Additional land in 3Q16 is a 5-hectarelot in Brgy. Old Balara, Quezon City,which will host another 13-storeycondominium complex in NCR with anestimated 7,500 units in 7 buildings.
North Luzon’s DH Marilao landbankhas now been moved to inventory as itwas launched in 3Q16.

STATUS OF 14 NEW PROJECTS
Project Type Total Units Location
Units to be Delivered for 2016
Value (in M Php)
LaunchDate
DH Pavia RR 2 Horizontal 2,967 Iloilo 500 490 Nov. 19, 2016
DH Sta. Barbara Horizontal 10,189 Iloilo (280) (126) Nov. 19, 2016
DH Mactan Prime Horizontal 8,537 Cebu (280) (274) Dec. 17, 2016
Urban DH Tisa 2 MRB 2,867 Cebu (80) (88) Dec. 22, 2016
DH South of Bacolod Horizontal 9,044 Bacolod (160) (136) Dec. 22, 2016
DH Toril Horizontal 6,800 Davao 0 0 May 31, 2017
DH Mulig 1 Horizontal 7,005 Davao 0 0 May 31, 2017
DH San Lorenzo Horizontal 3,749 Davao 0 0 May 31, 2017
Total 75,608 500 490
To date, we have launched sixprojects: UDH Hampton, UDHManila, DH Baywalk Talisay 3,UDH H. Cortes, DH Marilao andUDH Mahogany.
For the 4th Quarter, we are setto launch five projects: DHPavia RR2, DH Sta. Barbara,DH Mactan Prime, UDH Tisa 2,DH South of Bacolod. Theseare at least one quarterdelayed, and or a deficit of 800units or P624 million in value.
Operationally Launched 4th Quarter launching
Deficit (800) (624)