presentation materials 03.07 - pds group cojuangco building, makati avenue, makati city ... gain...
TRANSCRIPT

PLOT
March 7, 2017
Philippine Dealing and Exchange Corp.37/F Tower 1, The Enterprise Center6766 Ayala Avenue corner Paseo de RoxasMakati City
Attention: Ms. Vina Vanessa S. SalongaHead - Issuer Compliance and Disclosure Department
Gentlemen:
We enclose the materials in connection with the briefing and teleconference to discuss theCompany's Full Year 2016 Financial and Operating Results, on Tuesday, March 7, 2017 at3:00 p.m., at Makati A & B, Makati Shangri-La Hotel, Makati City.
Thank you.
Very truly yours,
NC-"-"iMA.LOURDESC.RA~S~HANCorporatesecretary/"
PLOT General Office P.O. Bo)( 2148 Makali City. Philippines
PLD 1

~PLDT
March 7,2017
Philippine Stock Exchange3/F Philippine Stock Exchange PlazaAyala Triangle, Ayala AvenueMakati City
Attention: Mr. Jose Valeriano B. Zuria IIIOIG - Head, Disclosure Department
Gentlemen:
We enclose the materials in connection with the briefing and teleconference to discuss theCompany's Full Year 2016 Financial and Operating Results, on Tuesday, March 7, 2017 at3:00 p.m., at Makati A & S, Makati Shangri-La Hotel, Makati City.
Thank you.
Very truly yours,
~---1'(MA. LOURDESC. RA~S~ANCorporate Secretary y
PLOTGeneral Office p.o Box 2148 Makati City. Philippines
PlD 1

~PLDT
March 7, 2017
Securities & Exchange CommissionSecretariat Building, Pice ComplexRoxas Boulevard, Pasay City
Attention: Mr. Vicente Graciano P. Felizmenio, Jr.Director - Markets and Securities Regulation Dept
Gentlemen:
We enclose the materials in connection with the briefing and teleconference to discuss theCompany's Full Year 2016 Financial and Operating Results, on Tuesday, March 7, 2017 at3:00 p.m., at Makati A & B, Makati Shangri-La Hotel, Makati City.
Thank you.
Very truly yours,
~C----1"lMA.LOURDESC. RA~~HANCorporate Secretary ./
PLOTGeneral Office p.o, Box 2148 Makati City, Philippines
PLO 1

COVER SHEET
SEC Registration Number
TEL E P H
R MER L YSTANCE
P H L
Company Name
P P N E
Principal Office (No.lSlreetiBarangayfCilyrr ownfProvince)
R A M 0 N C 0 J U A N alclol IslulilL DIN aM A K A T I A V E N U E IM A K A T I C I T Y I
I I I I I IForm Type Department requiring the report Secondary license Type, If
Applicable
ITIDCOMPANY INFORMATION
Mobile NumberCompany's Email Address Company's Telephone Numberls
______ 11 8168534 1 I~ _No, of Stockholders
11,774As of January 31, 2017
Annual MeetingMonthlDay
Every 2nd Tuesday of June
Fiscal YearMonth/Day
December 31
CONTACT PERSON INFORMATIONThe designated contact person MUST be an Officer of the Corporation
Nameof ContactPerson EmailAddress TelephoneNumberls
Mobile Number
__ J_u_n_'_C_h_''Y_1C_"_R_'_';_II'__ I 1 [email protected] I 1_8_168_53_4_I I~ _Contact Person's Address
MGO Building, Legaspi St. corner Dela Rosa St., Makati City
Note: In case of death, resignation or cessation of office of lhe offieer designated as contact person. such incident shall be reportell to the Commission withinthirty (30) calendar days /fom the occurrence thereof with inform<!Uon and complete cootact details of the new contact person designated.

SECURITIES AND EXCHANGE COMMISSION
CURRENT REPORT UNDER SECTION 17OF THE SECURITIES REGULATION CODE
AND SRC RULE 17.1
1. March7,2017Date of Report (Date of earliest event reported)
2. SEC IdentificationNumber PW-55
3. SIR Tax Identification No. 000-488-793
4. PLOT Inc.Exact name of issuer as specified in its charter
5. PHILIPPINESProvince, country or other jurisdictionof Incorporation
6. (SEC Use Only)Industry Classification Code
7. Ramon Cojuangco Building, Makati Avenue, Makati CityAddress of principal office
1200Postal Code
8. (632) 816-8405Issuer's telephone number, including area code
9. Not ApplicableFormer name or former address, if changed since last report
10. Securities registered pursuant to Sections 8 and 12 of the Securities Regulation Codeand Sections 4 and 8 of the Revised Securities Act
Title of Each Class Number of Shares of Common StockOutstanding and Amount of Debt Outstanding

1
PLDT Inc.
2016 Full Year Financial and Operating Results7th March 2017

2
Individual*Home*Conso Service RevenuesConso Service Revenues
P66.4bn -9%
(P6.3bn)
P29.3bn
+10%+P2.6bn
Enterprise*Conso Service Revenues
P30.6bn
+9%+P2.6bn
International*Conso Service Revenues
P20.5bn -15%
(P3.5bn)
Voyager*Conso Service Revenues
P1.2bn** +16%
+P164mn
PLDT Group: FY2016 vs FY2015 Financial Highlights
Conso Service Revenues (net of interconnection costs: P9.6bn)
Wireless Fixed Line
P147.6bn
Service Revenues* Service Revenues*P92.5bn
-9%(P9.7bn)
P63.1bn
+7%+P4.3bn
-3%(P5.0bn)
* Net of interconnection costs
** Includes P503mn from Feb – July 2016 when eInnovations (PayMaya) was deconsolidated
EBITDA EBITDA Margin
P61.2bn-13%
(P9.1bn)39%
(FY15: 43%)
Core EBITDA Core EBITDA Margin
P65.8bn-6%
(P4.4bn)42%
Core Income
P27.9bn -21%(P7.4bn)
Core Income (recurring**)
P20.2bn -26%(P7.0bn)

3
38.0 38.0 38.4 38.2 38.2 37.6 36.1 35.8
1Q15 2Q15 3Q15 4Q15 1Q16 2Q16 3Q16 4Q16
14.3 14.514.9 15.2 15.4 15.5
15.916.3
1Q15 2Q15 3Q15 4Q15 1Q16 2Q16 3Q16 4Q16
(Php in billions)
-0.1--
+0.3
+0.4
Fixed Line
Consolidated
4Q16 vs 4Q15:
-6% or -P2.4bn
+1%
+0.2
+2% +2%+0.3
+2%+0.3
+2%
Service Revenue Mix:
Data/broadband 30% 32% 34% 35% 38% 40% 41% 43%
Service Revenues Mix:
Data/broadband
56% 57% 57% 59% 59% 59% 60% 61%
25.8 25.6 25.6 25.3 24.7 24.022.3 21.6
1Q15 2Q15 3Q15 4Q15 1Q16 2Q16 3Q16 4Q16
-0.2
-1%
-0.3
Wireless
-1%
Service Revenue Mix:
Data/broadband
19% 21% 25% 25% 28% 30% 32% 33%
-0.6
-0.6
-1%
-2%
+0.1
--
-1.5
-4%--
---0.6
-2%
+0.4
+2%
PLDT Group: Service Revenues*
-0.1--
-0.3
-1%
FY16: P147.6bn -P5.0bn or -3%FY15: P152.6bn
* Net of interconnection costs
-1.8-7%
-0.7-3%
-9% or
-P9.7bn
vs 4Q15:
-15% or
-P3.7bn
+0.4
+2%
vs 4Q15:
+7% or
+P1.1bn
FY15: P102.2bn FY16: P92.5bn +7% or
+P4.3bn FY15: P58.8bn FY16: P63.1bn
By Business Segment

4
By Business Units
66.4
147.6
29.3
30.6
20.5 0.9
Home Enterprise International
& Carrier
Voyager
And
Others
FY16
-6.3-9%
+2.6+10%
+2.6+9%
-3.5-15%
-0.3-27%
PLDT Group: Consolidated Service Revenues*
* Net of interconnection costs
(Php in billions)
Individual
-5.0-3%
Service Revenues (Php in millions) FY15 FY16
Individual 72,673 66,370
Home 26,664 29,304
Enterprise 28,029 30,590
International and Carrier 23,981 20,452
Voyager and Others 1,266 921
Total 152,613 147,637
Service Revenues (Php in millions) FY15 FY16
Individual 48% 45%
Home 17% 20%
Enterprise 18% 20%
International and Carrier 16% 14%
Voyager and Others 1% 1%
Total 100% 100%
Home and Enterprise business units defending leadership position and grew at about 10% year-
on-year
Represent 40% of our Service Revenues
Home data and broadband revenues grew 14% to P17.6bn and now account for 60% of Home
revenues

5
(Php in billions)
By Product type
FY15 FY16
Lower by P5.0n or 3%
152.6 147.6
+9.2+18%
-4.7-14% -3.2
-19%
Data, broadband
and digital
platformsSMS
International
voice and fixed
line domestic
voice
PLDT Group: Consolidated Service Revenues*
* Net of interconnection costs
-6.1-12%
LEC, mobile
domestic
voice and
others
Service Revenue Mix FY15 FY16
Data/Broadband/Digital Platforms 33% 41%
SMS 22% 19%
LEC/Mobile Domestic Voice/Others 34% 31%
International Voice/Fixed Line Domestic Voice 11% 9%
Service Revenues (Php in millions) FY15 FY16
Data/Broadband/Digital Platforms 51,089 60,245
SMS 32,883 28,136
LEC/Mobile Domestic Voice/Others 51,296 45,154
International Voice/Fixed Line Domestic Voice 17,345 14,102
Total 152,613 147,637
Data/broadband account for 41% of consolidated service revenues
Data/broadband make up 60% of Fixed Line service revenues and 30% of Wireless service
revenues
Mobile data grew by 26% year-on-year, underpinned by a 42% improvement in mobile internet
revenues

6
70.2 65.8
(Php in billions)
Margins 43% 42% 39%
* Net of interconnection costs
PLDT Group: Consolidated EBITDA
Lower
svc
rev*
Lower
sub-
sidies
Lower
cash
opex*Higher
provns
-3.3-5.0 +1.4+2.8
FY15 FY16 (Core)
Higher
cost of
content
-0.3
16.6
14.2 15.0 15.4
1Q2016 2Q2016 3Q2016 4Q2016
Margins
41% 35% 39% 40%
-15%-2.5
lower by P4.4bn or 6%
+6%+0.8
+3%+0.5
Consolidated EBITDA of P61.2bn for 2016 higher than guidance of P60.0bn
Includes subsidies and provisions of approx. P4.6bn related to aggressive initiatives to increase smartphone ownership and the
migration of the Sun customers which are not expected to repeat in 2017
Cash opex decreased by P2.8bn year-on-year mainly due to reductions in:
Selling and promotions (P2.1bn)
Compensation and benefits (P1.7bn) as 2015 included MRP expenses of P1.8bn
Fixed line EBITDA grew by 9% year-on-year
Excluding the one-time provisions and subsidies, EBITDA would have been P65.8bn and margin at 42%
Two consecutive quarter-on-quarter improvements in consolidated EBITDA amounting to P1.2bn from P14.2bn in 2Q16 to
P15.4bn in 4Q16
Mainly due to an aggregate decline in subsidies (P1.8bn), provisions (P0.9bn) and cash opex (P0.5bn) fully absorbing the P1.7bn
decrease in service revenues
Consolidated EBITDA margin for 2016 at 39%, with 4Q16 EBITDA margin higher at 40% from 39% in 3Q16 and in 4Q15
Wireless: 32% at FY16, 35% at 4Q16 (vs FY15: 40%; 4Q15: 33%; 3Q16: 31%)
Fixed Line: 39% at FY16, 37% at 4Q16 (vs FY15: 38%; 4Q15: 40%; 3Q16: 42%)
FY16
Product
sub-
sidies
-1.9
Provi-
sions
-1.4
Provi-
sions
(Sun migra-
tion)
-1.3 61.2
lower by P4.6bn or 7%

7
Core income for 2016 of P27.9bn is in line with guidance and lower by P7.4bn or 21% year-on-year due to:
Lower EBITDA
Costs resulting from higher capex
Rise in depreciation expense by P2.8bn
Increase in financing costs by P1.0bn
Gain from sale of Beacon of P7.4bn in 2016 vs P3.2bn from sale of Meralco shares by Beacon in 2015
Lower equity in earnings due to:
Reduced ownership in Beacon/Meralco
Share in losses and purchase price amortization of P1.0bn relating to the acquisition of Vega Tel
Recurring core income for FY16 at P20.2bn
Excludes asset sales, accelerated depreciation, one-time provisions and subsidies, and lower taxes arising from
deferred tax asset recognition (P5.0bn) and the tax impact of adjustments to core income
Reported income for 2016 lower by P2.1bn or 9% at P20.0bn mainly due to a P5.4bn impairment of the
investment in Rocket Internet
FY15 FY16
Lower by P7.4bn or 21%
35.2 +4.1
-1.0
Fin
Costs -
Net
-9.1
EBITDA
+4.6
EBITDA
Adj’mts*
Acc’d
Depn
-2.8
Net
equity in
earnings
-2.3
Non-
cash
expenses
27.9
(Php in billions)
PLDT Group: Core income
-0.4
Gain on
sale
of SPI
Gain from
sale of
assets
-8.8 Lower
taxes
-7.2
20.2
Recurring
FY16
+2.8+5.0
Misc
Income
Provn for
Inc Taxs
* consisting of subsidies and provisions

8
Capital Management
In line with PLDT’s dividend policy, P77 or 60% of 2016 core earnings were declared as regular dividends
At PLDT’s 2016 closing share price of P1,365, dividend yield is 5.6%
No special dividends are to be paid for 2016 earnings as available cash is prioritized to support:
Capex requirements
Deleveraging and management of gearing levels
Intent to bring net debt to EBITDA back to 2.0x
From 2005, when PLDT resumed payment of dividends and including P16.6bn of dividends for 2016 earnings,
total dividends paid to common shareholders amounted to P386.6bn over twelve (12) years or an average P32.2bn return per year
Declaration Date 7 March 2017
Record Date 21 March 2017
Payment Date 6 April 2017
Core EPS P129
Dividends per share for 2016 P77
Interim regular dividend (August 2016) P49
Final regular dividend (March 2017) P28

9
Debt Maturities
Debt Balance
2.92.4
2.93.4 3.7
0.9 0.7 0.6 1.0 0.8
1.9 1.62.3 2.4
2.9
2012 2013 2014 2015 2016
Debt Balance Cash & Short-term Investments Net Debt
673
297 398 381440
375
1,166
2017 2018 2019 2020 2022 2021
Total: US$3,730mn
* Total debt based on nominal debt amount
*
2023
to 2026
Net debt and net debt to EBITDA as of end December 2016 stood
at US$2.9bn and 2.35x
Additional debt for acquisition of Vega Tel raised gearing by 0.14x;
with bulk of purchase price funded by proceeds from sale of Beacon
Balance of P6.6bn due in May 2017
At end December 2016, gross debt amounted to US$3.7bn
32% of gross debt is US$ denominated
Taking into account our available US$ cash and hedges, only
US$0.3bn or 9% of total debt is unhedged
72% are fixed-rate loans, while 28% are floating-rate loans; post-
interest rate swaps: 92% fixed, 8% floating
Average interest cost (pre-tax) of 4.5% (FY15: 4.2%)
Refinancing facilities for 2017 maturities, including US$228mn
bond, in place
Other than US$25m, 2017 maturities refinanced in pesos
Refinancing facilities at lower interest rates compared with maturing
loans which include the 8.35% US$ bond fully paid on 6 March 2017
Continued focus on managing leverage/debt levels which have
increased due to higher capex and the acquisition of Vega Tel
Reduced regular dividend payout to 60% (from 75%)
Acquisition of Vega Tel partly funded from sale of assets
Evaluating options for additional asset sales
As of end December 2016, PLDT’s investment grade ratings
remained unchanged from YE15
Net Debt/EBITDA:
1.05x 0.9x 1.35x 1.62x 2.36x
Debt maturities to total debt:
18% 8% 11% 10% 12% 10% 31%
Ratings AgenciesLong-Term Foreign
Issuer Rating
Long-term Local
Issuer RatingOutlook
Fitch BBB BBB+stable (FC IDR);
negative (LC IDR)
Moody's Baa2 Baa2 stable
Standard and Poor's /
S&P NationalBBB+ axA+ stable
*
* On 23 October 2016, Fitch revised the outlook for the Philippine telecom sector
to “negative” from “stable”, with a similar “negative” outlook for PLDT’s Long-
Term Local-Currency Issuer Default Rating (LC IDR)
(US$ in billions)
(US$ in millions)
PLDT Group: Debt Profile

10
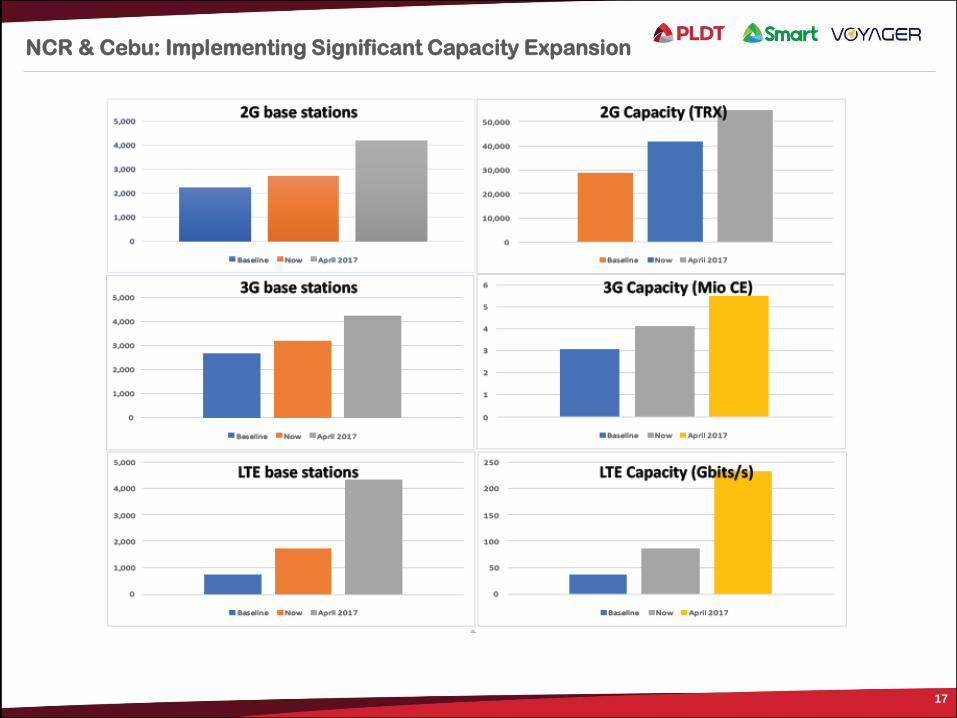
2016 Key Accomplishments
Spectrum refarming (Boracay, Davao, Rizal)
Completed integration of Sun/Smart
networks in MM and Cebu
Shut down of Sun network improved
coverage for Sun and Smart subs + cost
savings
Upgraded transport/backhaul network
Expanded NGN ports, FTTH rollout 2.5mn
homes
+1.53Tbps DFON capacity, additional
resiliency/redundancy
Deployed Vega Tel spectrum to more than
2,000 sites
Wi-fi rollout (LRT2, 20 airports, 4 seaports)
Closed gaps in 3G and LTE coverage
Leadership in overall LTE download speeds
PLDT Network: Making great strides
2017 Capex
Deployment of G.fast technology to achieve
fiber-like speeds over copper
Fiber homes to pass target of 4.4mn homes
by YE17
LTE superiority:
Complete refarming in MM and Cebu by
2Q17
Blanket LTE coverage of 12 more cities by
YE17 to achieve approx. 70% population
coverage in LTE
Rollout of latest LTE capabilities to enable
higher data speeds
Pursue 5G-readiness, including transport
network transformation and design of a
simple and highly scalable architecture
IT/SDP transformation to boost customer
digital experience, time to market and
efficiencies

11
PLDT Group’s overarching objective is to deliver to the customer a superior overall data experience
Network dominance and reliability are the key enablers in the delivery of a superior digital customer experience
Capex for 2016 of P42.8bn lower than P48.0bn guidance pending completion/acceptance of some projects
started during the year
Capex for 2017 projected at P46.0bn (inclusive of 2016 carry-overs), with an anticipated increase in fixed line
network spend
PLDT’s total capex investments from 2006-16 at P344.7bn or US$7.6bn
(Php in billions)
Note: BPO capex up to 2012 only
17.222.1
17.123.0 30.3 32.1 28.8
13.713.7
11.711.7
12.9 10.7 17.2
Fixed Line Wireless
31.2
2011 2012
36.4
2013
28.8
2014
34.8
43.2
2015
42.8
2016
% of Capex to total service revenues:
21% 23% 18% 21% 26% 27% < 30%
PLDT Group: Capex
46.0
2017F

12

13
Open Signal: Smart leads in NCR Download Speeds

14
Smart Network Improvements for LTE (Data)
NCR Region

15
Smart Network Improvements for 3G (Voice)
NCR Region

16
Example Rizal: Refarming Delivering Improvements
Customer Experience testing after 80% Completion
17
NCR & Cebu: Implementing Significant Capacity Expansion

18

19
Wireline Network Objectives for 2017
In 2017 we will increase our fixed network rollout to enable the Filipino
Gigabit society.
560,000 additional FTTH lines bringing the total installed capacity to 1.1M
lines.
Modernization of 1.7M copper ports for speeds up to 100 Mbps using VDSL.
We will enable speeds up to 400 Mbps using G.fast in more than 100
buildings.
By YE 2018, our network will have 5M ports that can support fiber like speeds
(at least 100 Mbps).

20
Wireless Objectives for 2017
In line with our commitment to the NTC we will grow the number of
municipalities with LTE coverage to 785 (of 1551).
By YE 2017 about 70% of the population will have access to Smart LTE
Target for 2017 is to rollout:
2,165 sites with LTE in low spectrum bands (LTE 700 and 850);
3,568 sites with LTE in high spectrum bands (LTE 1800 and 2100).
Continue to invest in our 2G and 3G networks where required to meet
customer demand and ensure best customer experience.

21

22

23
INTERNATIONAL
HOME
WIRELESS 66.4 B
29.3 B
30.6 B
20.5 B
146.7 B
ENTERPRISE
TOTAL
HOME AND ENTERPRISE, OUR FASTEST GROWING
SEGMENTS, COMPRISE 47% OF BUSINESS AS OF
YE2016 (Net of International), WILL CROSS OVER TO
51% IN 2017, AND FORECASTED TO GROW TO
APPROXIMATELY 56% BY 2019.
PLDT Group Service Revenue YE December 2016

24
01 02
STRONG MARKET LEADERSHIP IN
THE HOME SUPPORTED BY
LEADING EDGE TECHNOLOGIES
HIGH DEMAND FOR HOME
BROADBAND OPENING UP VAST
OPPORTUNITIES TO UPSELL
DIGITAL CONTENT AND SERVICES
Strong demand for
broadband in the home, with
growth of 15% in wired
subscriptions, led by Fibr
Content and Digital Services
will supplement data growth,
create stickiness, and
improve yields
Over 3,500 areas nationwide now on
Fiber. Widest fiber optic network
spanning over 150K kms
2.8M HOMES PASSED YE 2016,
and a target of
6M HOMES PASSED in 2020
All fixed broadband subscribers shall
enjoy Fibr and Fibr-fast speeds in 2
years, which can deliver internet
speeds of up to 1 Gbps
Sustained Double Digit Growth in Home(FORECAST 27% CONTRIBUTION TO TOTAL GROUP REVENUE BY 2019)

25
STRENGTHEN OUR
POSITION AS THE TRUSTED
ICT EXPERT PARTNER AND
ENABLER OF THE
ENTERPRISE MARKET
INDISPUTABLE MARKET LEADERSHIP IN
THE ENTERPRISE SPACE ENABLED BY
UNPARALLELED INVESTMENTS IN ICT AND
DIGITAL INFRASTRUCTURE
Enabling global data connectivity in 4
continents: United States, UK, Singapore,
Hong Kong, and Australia.
Total of 9 Data Centers with capacity
of 9K racks
Continued investment and growth in the
group’s data center, cloud, and other ICT
managed service capabilities via ePLDT
01 02
High Revenue Growth Rates in Enterprise(FORECAST 29% CONTRIBUTION TO TOTAL GROUP REVENUE BY 2019)

26
STABILIZE AND ARREST
NEGATIVE MOMENTUM, AND
QUICKLY ESTABLISH A BASE
BY WHICH TO BUILD A NEW
GROWTH FOUNDATION
A
B
Create a Pivotal
Strategy
Streamline
Operations
Achieve Revenue Maximization
and Cost Rationalization
REORGANIZATION
NETWORK IMPROVEMENTS
(LTE,WIFI)
CLEVERAGE ON ANALYTICS, INSIGHTS
AND DIGITAL MARKETINGBetter bundle propositioning (based on ability to pay, geographic
location and affinity to our 3 distinct brands)
2017 Wireless Consumer Imperatives

27
In 2016, the PLDT Group recognized the need to undertake a “digital pivot” to re-establish
undisputed market leadership amidst rapid consumer and technological changes
Consequently, PLDT embarked on a 3-year journey that involved:
Development and execution of a roadmap to revitalize the Group’s Network and IT platforms to achieve
superiority
Determination to fortify and defend leadership in the HOME and Enterprise businesses
Exhaustive assessment and re-vamp of the Individual business to stem deterioration in market leadership and
profitability
Organizational changes involving structure/design and new appointments at senior and executive levels,
including new areas such as customer experience and data analytics
Business transformation initiatives that aim to reshape the organization’s culture, people and processes to align
with the ‘digital pivot’
A reset in profitability in 2016 to a lower level, reflects the impact of the changes in the
business, the customer base, and the organization
PLDT is setting out to achieve a sequential recovery in profitability starting with an increase
in recurring core income to P21.5bn in 2017 from P20bn in 2016
Data to continue to power growth engines in HOME and Enterprise businesses
Stabilize/arrest negative momentum in mobile by leveraging on better network and sharper operational execution
Aim to increase data contribution to total revenue mix and improve data yields
Operate from a more efficient cost base
Grow our capability to leverage on analytics and business insights to allow more granular and cost effective
brand marketing and product positioning
PLDT: Road to recovery

28
PLDT Group: Guidance for 2017
EBITDA: P70bn Capex: P46bn
Dividend Payout: 60%
To grow by P8.8bn from P61.2bn in 2016 impact of P4.6bn in subsidies and provisions in 2016
which will not recur in 2017
Low-single digit growth in consolidated service
revenues
Double-digit growth in data/broadband to continue
Continuing declines in toll, cellular voice and SMS
revenues
Reduction in cash opex to result from tighter
management of costs
Recurring core income from telco operations to rise to
P21.5bn P1.5bn increase due to the combined effect of:
Higher EBITDA partly offset by increases in depreciation
and financing costs resulting from the higher capex
Lower equity in earnings due to reduced ownership in
Beacon, and losses and amortization of purchase price
acquisition related to the Vega Tel transaction
Including asset sales, core income anticipated at P25bn
or higher Anticipated gain from asset sales to be offset by expected MRP
expense
* Normalized to exclude asset sales and impact of higher provisions
Higher by P3.2bn from P42.8bn in 2016 Includes carry-over of capex started in 2016 to be completed/accepted
in 2017
Anticipated increase in fixed line capex to support push to further grow
the Home and Enterprise businesses
Dividend policy: Regular dividend payout of 60% of core
income
Takes into consideration: Technology roadmap/capex requirements
Management of cash and gearing levels
Plans to invest (on opportunistic basis) in new adjacent
businesses that will complement the current business and provide
future sources of profits and dividends
Recurring Core Income: P21.5bn

29
Other Details

30
(Php in billions)
Fixed Line*
Wireless*
Increases in data revenues able to fully
absorb declines in ILD and NLDFY15 FY16
Higher by P4.3bn or 7%
58.863.1+4.0
+12%
+0.9+5%
-0.6-9%
DataLEC and
Others
International and
domestic voice
FY15 FY16
Lower by P9.7bn or 9%
102.292.5
+4.7+19%
-7.1-21% -2.5
-23%
Data, broadband,
digital platforms
Domestic
voice and
othersInternational
voice
Revenues from data/broadband and digital
platforms now the largest contributor to
total service revenues at 31%
* Net of interconnection costs
(Php in billions)
Consolidated service revenues* declined by P5.0bn or 3% year-on-year to P147.6bn in FY16
40% or P59.5bn from home broadband and data, up by 19% from FY15
PLDT Group: Service Revenues*
-4.8-14%
SMS
Service Revenue Mix FY15 FY16
Data/Broadband/Digital Platforms 24% 31%
SMS 32% 30%
Domestic Voice/Others 34% 30%
International Voice 10% 9%
Service Revenues (Php in mi l l ions) FY15 FY16
Data 33,683 37,659
LEC/Others 18,548 19,453
International Voice/Domestic Voice 6,578 5,954
Total 58,809 63,066
Service Revenue Mix FY15 FY16
Data 57% 60%
LEC/Others 32% 31%
International Voice/Domestic Voice 11% 9%
Service Revenues (Php in millions) FY15 FY16
Data/Broadband/Digital Platforms 24,231 28,884
SMS 32,895 28,145
Domestic Voice/Others 34,385 27,312
International Voice 10,692 8,206
Total 102,203 92,547

31
72.766.4
26.729.3
(Php in billions)
LEC
+7%+0.7
Home
FY16FY15
Home
broadband
+14%+2.1
Fixed line
domestic voice
-17%-0.2
Corp data
+40%--
Others
-74%--
higher by P2.6bn or 10%
Individual
Mobile
domestic
voice
-19%-5.0
Mobile data
+20%+3.8
Others
-17%-0.1
Lower by P6.3bn or 9%
FY16FY15
SMS
-19%-5.0
Data and broadband up
by P2.2bn or 14%
PLDT Group: Consolidated Service Revenues*
* Net of interconnection costs
Voice higher by
P0.5bn or 5%
(Php in billions)
Service Revenue Mix FY15 FY16
Data/Broadband 58% 60%
Voice 42% 40%
Others 0% 0%
Service Revenues (Php in mi l l ions) FY15 FY16
Mobile Data 18,486 22,274
Mobile Domestic Voice 26,760 21,752
SMS 27,016 22,003
Others 411 341
Total 72,673 66,370
Service Revenue Mix FY15 FY16
Mobile Data 25% 34%
Mobile Domestic Voice 37% 33%
SMS 37% 33%
Others 1% 0%
Service Revenues (Php in millions) FY15 FY16
Data/Broadband 15,447 17,631
Voice 11,151 11,656
Others 66 17
Total 26,664 29,304

32
28.030.6
(Php in billions)
Enterprise*
ILD/fixed
line
domestic
voice
-9%-0.2
Corp. data
+14%+2.0
Mobile
domestic
voice
-65%-1.1
Mobile
data
+119%+1.5
LEC
+1%+0.1
Higher by P2.5bn or 9%
FY16FY15
SMS
+47%+0.3
Data and
broadband up by
P3.5bn or 22%
Voice lower by
P1.3bn or 12%
Others
+16%+0.1
Mobile
int’l
voice
-10%
PLDT Group: Consolidated Service Revenues*
* Net of interconnection costs
Service Revenue Mix FY15 FY16
Data/Broadband 56% 63%
Voice 40% 32%
SMS 2% 3%
Others 2% 2%
Service Revenues (Php in millions) FY15 FY16
Data/Broadband 15,735 19,218
Voice 11,104 9,799
SMS 622 912
Others 568 661
Total 28,029 30,590

33
25.1
59.5
17.5
17.0
6.3 6.2
4.1 4.5
4.5 4.6
3Q16 4Q16
Mobile Data Corp. Data and Data Center Home Broadband
5.6
3.9
4.0
4Q15
% to total Data and Broadband Consolidated Revenues*:
42% 29% 29%
(Php in billions)
Mobile Internet
Mobile data, including revenues from mobile Internet and
mobile broadband, grew by P5.2bn or 26% to P25.1bn
Mobile Internet revenues or 29% of total data and broadband
revenues were up by P5.0bn or 42% to P17.1bn
Data usage improved by 49% to 147,994 terabytes in FY16
• Usage in 4Q16 increased by 63% year-on-year and 15%
quarter-on-quarter
Smartphone penetration: approximately 50% of subs base,
about half of whom pay for data
Focus: Enable and accelerate data adoption to drive usage
• Recent launch of O+ Presto 700 LTE at P2,188 bundled
with P300 load (includes 100mb of data per month for 1
year)
• Giga Surf 50 and data sharing plan
• Expansion of content portfolio to increase relevance to
customers (e. g., partnership with ABS-CBN’s iWant TV,
Fox+, iflix, Netflix, Cignal)
Mobile broadband revenues rose by P0.2bn or 2% to P8.0bn
and account for 13% of total data and broadband revenues
Corporate Data and Data Centers
Corporate data and data center revenues of P17.0bn were
higher by P2.2bn or 15%
PLDT has the nation’s largest rack capacity with over 8,300
racks in 7 data centers, with 3 additional data centers
coming on-stream by YE17
Home broadband revenues grew by P2.1bn or 14% to P17.5bn
Broadband subscriber base, including Home Broadband and Corporate
Fixed Broadband subscribers, stood at over 1.7mn, with net adds of
over 206,000 or 14% from YE16
Value proposition: to enable ‘the HOME of the future’
Via devices: Telpad, TVolution, FamCam, Fam Zone, Smart Watch
Triple-play (fixed line, broadband, IPTV) and quad-play (including
mobile) plans available, including data sharing plans
Range of speeds, including high-speed fiber services
Home Broadband
Mobile
Data
Home
Broadband
Corp. Data and
Data Center
FY16
+5.2+26%
+2.1+14%
+2.2+15%
+9.5+19%
-2%
+9%
+3%
+11%
+15%
+16%
Y-o-Y
+1.9
+14%
13.414.9 15.3
PLDT Group: Consolidated Data and Broadband*
* Net of interconnection costs
+0.4
+3%

34
Appendix*
*Unaudited FY 2016 Financial Statements; Audited FY 2015 Financial Statements

35
Mobile Subscribers (1) by Category:
Mobile Subscribers (1) by Brand:
(1) Includes Mobile Broadband subscribers
Subscriber Base: Mobile
Mobile Subscriber Base (1)
Prepaid 59,952,941 62,259,067 64,701,367 64,651,175 65,063,860 67,024,637 68,654,608 69,256,011
Smart Prepaid 21,643,963 23,560,542 24,185,165 24,836,433 25,418,533 25,771,703 26,510,036 26,929,933
Sun Prepaid 8,463,469 8,846,953 9,652,756 10,495,342 11,591,167 13,544,103 14,242,408 14,270,854
TNT 29,845,509 29,851,572 30,863,446 29,319,400 28,054,160 27,708,831 27,902,164 28,055,224
Postpaid 2,810,268 3,117,035 3,556,485 3,539,055 3,548,258 3,496,365 3,595,902 3,454,273
Smart Postpaid 1,383,830 1,482,672 1,573,147 1,610,670 1,502,678 1,427,871 1,358,845 1,289,055
Sun Postpaid 1,426,438 1,634,363 1,983,338 1,928,385 2,045,580 2,068,494 2,237,057 2,165,218
Total Mobile Subscribers 62,763,209 65,376,102 68,257,852 68,190,230 68,612,118 70,521,002 72,250,510 72,710,284
Sept-16 Mar-16Dec-16 Dec-15Jun-16 Mar-15Sept-15 Jun-15
Mobile Subscriber Base (1)
Smart 23,027,793 25,043,214 25,758,312 26,447,103 26,921,211 27,199,574 27,868,881 28,218,988
Smart Prepaid 21,643,963 23,560,542 24,185,165 24,836,433 25,418,533 25,771,703 26,510,036 26,929,933
Smart Postpaid 1,383,830 1,482,672 1,573,147 1,610,670 1,502,678 1,427,871 1,358,845 1,289,055
TNT 29,845,509 29,851,572 30,863,446 29,319,400 28,054,160 27,708,831 27,902,164 28,055,224
Sun Cellular 9,889,907 10,481,316 11,636,094 12,423,727 13,636,747 15,612,597 16,479,465 16,436,072
Sun Prepaid 8,463,469 8,846,953 9,652,756 10,495,342 11,591,167 13,544,103 14,242,408 14,270,854
Sun Postpaid 1,426,438 1,634,363 1,983,338 1,928,385 2,045,580 2,068,494 2,237,057 2,165,218
Total Mobile Subscribers 62,763,209 65,376,102 68,257,852 68,190,230 68,612,118 70,521,002 72,250,510 72,710,284
Sept-16 Mar-16Dec-16 Dec-15Jun-16 Mar-15Sept-15 Jun-15

36
Broadband Subscribers
Fixed Line Subscribers
Subscriber Base: Broadband and Fixed Line
Fixed Line Subscribers 2,438,473 2,404,893 2,380,390 2,339,001 2,303,454 2,285,952 2,257,266 2,234,115
Sept-16Dec-16 Jun-15 Mar-15Jun-16 Mar-16 Dec-15 Sept-15
BROADBAND
Home Broadband (Wireless) 270,203 271,572 265,473 248,675 258,776 271,495 287,918 303,303
Fixed Line Broadband 1,450,550 1,407,122 1,347,422 1,296,402 1,255,864 1,224,735 1,185,319 1,138,598
Total Broadband Subscribers 1,720,753 1,678,694 1,612,895 1,545,077 1,514,640 1,496,230 1,473,237 1,441,901
Jun-16Sept-16 Mar-16 Jun-15Dec-15 Mar-15Dec-16 Sept-15

37
(1) EBITDA margin calculated as EBITDA divided by service revenues (gross of interconnection costs)
FY 2016: Consolidated Financial Highlights
FY2015
(Php in millions) Fixed Line Others Consolidated Consolidated
Total Revenues 104,914 72,728 20 165,262 171,103 (3%)
Service Revenues 100,582 69,006 20 157,210 162,930 (4%)
Cash Operating Expenses 49,578 41,152 42 76,804 80,369 (4%)
Depreciation and Amortization 18,984 15,471 - 34,455 31,519 9%
Financing Costs, Net (2,487) (4,917) (187) (7,354) (6,259) 17%
Income before Income Tax 8,193 11,152 2,726 22,071 26,638 (17%)
Provision for Income Tax (1,270) 3,018 161 1,909 4,563 (58%)
EBITDA 32,661 26,950 (22) 61,161 70,218 (13%)
EBITDA Margin(1) 32% 39% -110% 39% 43%
Net Income Attributable to Equity
Holders of PLDT9,457 7,985 2,564 20,006 22,065 (9%)
Core income 11,402 7,746 8,709 27,857 35,212 (21%)
% ChangeFY2016
Wireless

38
Underlying Core Income
Core Income 7,211 10,489 4,036 6,121 27,857 9,280 9,648 8,149 8,135 35,212
Core Income Adjustments
One-Time Provisions and Subsidies (EBITDA Adjustments) 1,011 2,034 1,605 - 4,650 - - - - -
Asset Sales (970) (7,365) (396) (438) (9,169) - (3,175) - - (3,175)
Accelerated Depreciation - - - 4,084 4,084 - - - - -
Deferred Tax Asset Recognition - - - (5,027) (5,027) - - (821) (3,978) (4,799)
Net Tax Effect of Adjustments (12) (611) (481) (1,094) (2,198) - - - - -
Underlying Core Income 7,240 4,547 4,764 3,646 20,197 9,280 6,473 7,328 4,157 27,238
1Q 2Q 3Q 4Q FY2015(Php in millions)
1Q 2Q 3Q 4Q FY2016

39
Reconciliation of Core and Reported net income
FY2015
Wireless Fixed Line Others Consolidated Consolidated
Net Income Attributable to Equity Holders of PLDT 9,457 7,985 2,564 20,006 22,065 (9%)
Add (Deduct):
Foreign Exchange Losses, Net 1,702 486 597 2,785 3,036 (8%)
Gains on Derivative Financial Instruments, Net (593) (946) - (1,539) (762) 102%
Asset Impairment 1,172 36 5,381 6,589 10,954 (40%)
Others - 47 48 95 179 (47%)
Tax Effect (336) 138 119 (79) (260) (70%)
Core Income 11,402 7,746 8,709 27,857 35,212 (21%)
(Php in millions)% Change
FY2016

40
Consolidated Service Revenues*
*Gross of Interconnection costs
(Php in millions) 1Q 2Q 3Q 4Q FY 1Q 2Q 3Q 4Q FY
Fixed Line 14,287 14,320 14,446 15,033 58,086 13,034 13,302 13,589 13,817 53,742
LEC 4,333 4,384 4,479 4,499 17,695 4,172 4,226 4,280 4,301 16,979
Fixed Line Voice - International 1,240 1,092 1,015 1,111 4,458 1,311 1,323 1,273 1,336 5,243
Fixed Line Voice - Domestic (NLD) 844 845 863 797 3,349 923 906 915 833 3,577
Home Broadband 3,413 3,615 3,781 3,920 14,729 2,871 3,019 3,161 3,277 12,328
Corporate Data and Data Center 4,237 4,189 4,098 4,474 16,998 3,565 3,625 3,784 3,868 14,842
Miscellaneous 220 195 210 232 857 192 203 176 202 773
Wireless 26,311 25,686 23,882 23,236 99,115 27,514 27,309 27,253 27,112 109,188
Mobile Services 25,305 24,806 22,826 22,129 95,066 26,227 25,985 25,954 26,009 104,175
Mobile Voice 10,240 9,458 8,272 8,011 35,981 11,849 11,519 10,778 10,749 44,895
SMS 8,688 8,644 7,872 7,533 32,737 9,927 9,548 9,381 9,115 37,971
Mobile Data 6,063 6,443 6,376 6,333 25,215 4,150 4,649 5,534 5,613 19,946
Inbound Roaming and Others 314 261 306 252 1,133 301 269 261 532 1,363
Home Broadband 679 670 696 713 2,758 806 772 738 701 3,017
Digital Platforms and Mobile Financial Services 133 57 219 300 709 264 244 350 190 1,048
MVNO and Others 194 153 141 94 582 217 308 211 212 948
Others - - - 9 9 - - - - -
Total 40,598 40,006 38,328 38,278 157,210 40,548 40,611 40,842 40,929 162,930
FY2015FY2016

41
(1) EBITDA margin calculated as EBITDA divided by service revenues (gross of interconnection costs)
Consolidated Service Revenues* and EBITDA
*Gross of Interconnection costs
(Php in millions) 1Q 2Q 3Q 4Q FY 1Q 2Q 3Q 4Q FY
Data/Broadband/Digital Platforms 14,525 14,974 15,170 15,749 60,418 11,656 12,309 13,567 13,649 51,181
Mobile Data 6,063 6,443 6,376 6,333 25,215 4,150 4,649 5,534 5,613 19,946
Mobile Internet 3,811 4,257 4,471 4,628 17,167 2,450 2,765 3,451 3,389 12,055
Mobile Broadband 2,252 2,186 1,904 1,704 8,046 1,700 1,883 2,083 2,224 7,890
Other Data - - 1 1 2 - 1 - - 1
Home Broadband 4,092 4,285 4,477 4,633 17,487 3,677 3,791 3,899 3,978 15,345
Fixed 3,413 3,615 3,781 3,920 14,729 2,871 3,019 3,161 3,277 12,328
Wireless 679 670 696 713 2,758 806 772 738 701 3,017
Corp. Data and Data Center 4,237 4,189 4,098 4,474 16,998 3,565 3,625 3,784 3,868 14,842
Digital Platforms and Others 133 57 219 309 718 264 244 350 190 1,048
SMS/Mobile Voice - Domestic/LEC/Others 21,697 20,913 19,333 18,645 80,588 23,678 23,276 22,483 22,576 92,013
SMS 8,688 8,644 7,872 7,533 32,737 9,927 9,548 9,381 9,115 37,971
Mobile Voice - Domestic 7,948 7,276 6,325 6,035 27,584 8,869 8,722 8,174 8,214 33,979
LEC 4,333 4,384 4,479 4,499 17,695 4,172 4,226 4,280 4,301 16,979
Others 728 609 657 578 2,572 710 780 648 946 3,084
Inbound Roaming and Others 314 261 306 252 1,133 301 269 261 532 1,363
MVNO and Others 194 153 141 94 582 217 308 211 212 948
Miscellaneous - Fixed Line 220 195 210 232 857 192 203 176 202 773
ILD/Fixed Line - Domestic (NLD) 4,376 4,119 3,825 3,884 16,204 5,214 5,026 4,792 4,704 19,736
Fixed Line Voice - Domestic (NLD) 844 845 863 797 3,349 923 906 915 833 3,577
Fixed Line Voice - International 1,240 1,092 1,015 1,111 4,458 1,311 1,323 1,273 1,336 5,243
Mobile Voice - International 2,292 2,182 1,947 1,976 8,397 2,980 2,797 2,604 2,535 10,916
Total Consolidated Gross Service Revenues 40,598 40,006 38,328 38,278 157,210 40,548 40,611 40,842 40,929 162,930
Non-Service Revenues 2,181 2,499 1,774 1,598 8,052 2,005 2,027 1,838 2,303 8,173
Total Consolidated Gross Revenues 42,779 42,505 40,102 39,876 165,262 42,553 42,638 42,680 43,232 171,103
Deduct:
Cash Operating Expenses (19,295) (19,434) (19,128) (18,947) (76,804) (18,701) (21,575) (19,158) (20,935) (80,369)
Cost of Sales (5,126) (5,519) (3,337) (2,771) (16,753) (3,704) (3,984) (3,972) (4,729) (16,389)
Cost of Content (107) (83) (107) (279) (576) - - (49) (176) (225)
Writedown of Inventory and Provision for Doubtful AR (1,645) (3,317) (2,571) (2,435) (9,968) (866) (841) (955) (1,240) (3,902)
EBITDA 16,606 14,152 14,959 15,444 61,161 19,282 16,238 18,546 16,152 70,218
EBITDA Margin(1)
41% 35% 39% 40% 39% 48% 40% 45% 39% 43%
20152016

42
(1) EBITDA margin calculated as EBITDA divided by service revenues (gross of interconnection costs)
Wireless Service Revenues* and EBITDA
*Gross of Interconnection costs
(Php in millions) 1Q 2Q 3Q 4Q FY 1Q 2Q 3Q 4Q FY
Data/Broadband/Digital Platforms 6,944 7,269 7,375 7,429 29,017 5,281 5,725 6,702 6,562 24,270
Mobile Data 6,127 6,535 6,445 6,410 25,517 4,203 4,702 5,608 5,666 20,179
Mobile Internet 3,811 4,257 4,471 4,628 17,167 2,450 2,765 3,451 3,389 12,055
Mobile Broadband 2,276 2,209 1,926 1,736 8,147 1,715 1,899 2,098 2,239 7,951
Other Data 40 69 48 46 203 38 38 59 38 173
Home Broadband 683 674 700 715 2,772 813 778 743 706 3,040
Digital Plarforms 134 60 230 304 728 265 245 351 190 1,051
SMS/Mobile Voice - Domestic/Others 17,422 16,613 14,917 14,185 63,137 19,610 19,169 18,322 18,368 75,469
SMS 8,690 8,646 7,876 7,533 32,745 9,930 9,551 9,384 9,117 37,982
Mobile Voice - Domestic 8,221 7,552 6,592 6,301 28,666 9,162 9,022 8,464 8,504 35,152
Others 511 415 449 351 1,726 518 596 474 747 2,335
Mobile Voice - International 2,304 2,189 1,953 1,982 8,428 2,995 2,813 2,617 2,552 10,977
Total Wireless Gross Service Revenues 26,670 26,071 24,245 23,596 100,582 27,886 27,707 27,641 27,482 110,716
Non-Service Revenues 1,261 1,472 838 761 4,332 1,290 1,204 1,027 1,276 4,797
Total Wireless Gross Revenues 27,931 27,543 25,083 24,357 104,914 29,176 28,911 28,668 28,758 115,513
Deduct:
Cash Operating Expenses (12,515) (12,576) (12,640) (11,847) (49,578) (12,775) (13,941) (13,202) (14,827) (54,745)
Cost of Sales (4,421) (4,748) (2,748) (2,223) (14,140) (3,217) (3,270) (3,362) (3,962) (13,811)
Cost of Content (31) (15) (35) (208) (289) - - (33) (29) (62)
Writedown of Inventory and Provision for Doubtful AR (1,335) (2,947) (2,237) (1,727) (8,246) (581) (539) (639) (899) (2,658)
EBITDA 9,629 7,257 7,423 8,352 32,661 12,603 11,161 11,432 9,041 44,237
EBITDA Margin(1)
36% 28% 31% 35% 32% 45% 40% 41% 33% 40%
20152016

43
Fixed line revenues - net of interconnection costs
(1) Non-service revenues include sale of PLP units, FabTAB, Tvolution, managed ICT equipment, Telpad, UNO equipment and managed PABX(2) EBITDA margin calculated as EBITDA divided by service revenues (gross of interconnection costs)
Fixed Line Service Revenues and EBITDA
1Q 2Q 3Q 4Q FY 1Q 2Q 3Q 4Q FY
Fixed Line Service Revenues, Net
LEC 4,357 4,406 4,502 4,523 17,788 4,196 4,249 4,303 4,326 17,074
Fixed Line Voice - International 830 735 716 660 2,941 853 873 895 866 3,487
Fixed Line Voice - Domestic (NLD) 747 759 790 717 3,013 786 782 804 719 3,091
Home Broadband 3,434 3,655 3,835 3,972 14,896 2,871 3,019 3,161 3,287 12,338
Corp. Data and Other Network Services 4,925 4,779 4,957 5,267 19,928 4,583 4,607 4,672 4,879 18,741
Data Center and ICT 738 768 652 677 2,835 602 619 677 706 2,604
Miscellaneous 404 398 419 444 1,665 393 362 343 376 1,474
Total 15,435 15,500 15,871 16,260 63,066 14,284 14,511 14,855 15,159 58,809
2016
(Php in millions)
2015
1Q 2Q 3Q 4Q FY 1Q 2Q 3Q 4Q FY
Data/Broadband 9,110 9,216 9,457 9,928 37,711 8,074 8,261 8,537 8,876 33,748
Home Broadband 3,434 3,655 3,835 3,972 14,896 2,871 3,019 3,161 3,287 12,338
Corp. Data and Other Network Services 4,938 4,793 4,970 5,279 19,980 4,601 4,623 4,699 4,883 18,806
Data Center and ICT 738 768 652 677 2,835 602 619 677 706 2,604
LEC/Others 4,761 4,806 4,922 4,968 19,457 4,589 4,612 4,647 4,702 18,550
LEC 4,357 4,408 4,503 4,524 17,792 4,196 4,250 4,304 4,326 17,076
Miscellaneous 404 398 419 444 1,665 393 362 343 376 1,474
Fixed Line Voice - International/Domestic 3,144 2,952 2,819 2,923 11,838 3,273 3,335 3,243 3,326 13,177
Fixed Line Voice - International 2,203 1,998 1,842 2,013 8,056 2,255 2,335 2,233 2,396 9,219
Fixed Line Voice - Domestic (NLD) 941 954 977 910 3,782 1,018 1,000 1,010 930 3,958
Total Fixed Line Service Revenues 17,015 16,974 17,198 17,819 69,006 15,936 16,208 16,427 16,904 65,475
Non-Service Revenues (1)
920 1,028 936 838 3,722 715 824 812 1,039 3,390
Total Fixed Line Gross Revenues 17,935 18,002 18,134 18,657 72,728 16,651 17,032 17,239 17,943 68,865
Deduct:
Cash Operating Expenses (10,213) (10,255) (9,995) (10,689) (41,152) (9,590) (11,197) (9,473) (9,853) (40,113)
Cost of Sales (705) (772) (589) (551) (2,617) (491) (714) (610) (781) (2,596)
Cost of Content (76) (68) (72) (71) (287) - - (16) (147) (163)
Writedown of Inventory and Provision for Doubtful AR (310) (370) (334) (708) (1,722) (285) (302) (316) (341) (1,244)
EBITDA 6,631 6,537 7,144 6,638 26,950 6,285 4,819 6,824 6,821 24,749
EBITDA Margin(2)
39% 39% 42% 37% 39% 39% 30% 42% 40% 38%
2016
(Php in millions)
2015

44
Expenses
FY2015
(Php in millions) Wireless Fixed Line Others Consolidated Consolidated
Operating Expenses
Compensation and Employee Benefits 6,706 13,238 - 19,928 21,606 (8%)
Repairs and Maintenance 8,367 7,480 - 15,212 15,035 1%
Selling and Promotions 5,570 2,133 - 7,687 9,747 (21%)
Rent 9,805 3,373 - 6,912 6,376 8%
Insurance and Security Services 1,149 697 - 1,739 1,797 (3%)
Taxes and Licenses 2,675 1,131 2 3,782 4,592 (18%)
Professional and Other Contracted Services 6,119 5,641 39 9,474 8,234 15%
Communication, Training and Travel 809 612 - 1,253 1,349 (7%)
Interconnection Costs 8,035 5,940 - 9,573 10,317 (7%)
Other Expenses 343 907 1 1,244 1,316 (5%)
Cash Operating Expenses 49,578 41,152 42 76,804 80,369 (4%)
Depreciation and Amortization 18,984 15,471 - 34,455 31,519 9%
Asset Impairment 9,284 1,758 - 11,042 9,690 14%
Amortization of Intangible Assets 929 - - 929 1,076 (14%)
Non-Cash Operating Expenses 29,197 17,229 - 46,426 42,285 10%
Cost of Sales 14,140 2,617 - 16,753 16,389 2%
Cost of Content 289 287 - 576 225 156%
Total Expenses 93,204 61,285 42 140,559 139,268 1%
% ChangeFY2016

45
Other Income (expenses)
FY2015
Wireless Fixed Line Others Consolidated Consolidated
Equity Share in Net Earnings (Losses) of Associates and Joint Ventures
Beacon - - 2,089 2,089 3,205 (35%)
Vega - - (1,027) (1,027) - -
Others (237) (40) 396 119 36 231%
Total Equity Share in Net Earnings (Losses) (237) (40) 1,458 1,181 3,241 (64%)
Financing Costs, Net
Loans and Other Related Items (2,663) (4,909) (187) (7,522) (6,289) 20%
Accretion on Financial Liabilities (157) (73) - (230) (231) -
Financing Charges (134) (34) - (168) (109) 54%
Capitalized Interest 467 99 - 566 370 53%
Total Financing Costs (2,487) (4,917) (187) (7,354) (6,259) 17%
Other Income (Expenses), Net
Gain from Sale of Beacon/Meralco Shares - - 7,365 7,362 2,694 173%
Gain on Sale of Properties - 1,408 - 1,408 - -
Investment Impairment (includes Rocket Internet Impairment) (134) - (5,381) (5,515) (5,166) 7%
Others 288 2,526 (216) 1,029 2,110 (51%)
Other Income (Expenses), Net 154 3,934 1,768 4,284 (362) (1283%)
Interest Income 270 707 306 1,046 799 31%
Gains on Derivative Financial Instruments, Net 485 511 - 996 420 137%
Foreign Exchange Losses, Net (1,702) (486) (597) (2,785) (3,036) 8%
Total Other Income (Expenses) (3,517) (291) 2,748 (2,632) (5,197) (49%)
(Php in millions)
FY2016% Change

46
ARPU
(1) Includes Mobile Broadband subscribers
1Q 2Q 3Q 4Q 1Q 2Q 3Q 4Q
Home Broadband (Wireless) 891 875 866 870 839 861 868 875
Fixed Broadband (2)
1,162 1,169 1,171 1,165 1,129 1,137 1,138 1,144
2016 2015
Mobile ARPU, Net(1) :
Broadband ARPU, Net :
(2) Includes Corporate Fixed Broadband
1Q 2Q 3Q 4Q 1Q 2Q 3Q 4Q
Smart Postpaid 938 951 946 970 991 1,012 968 955 Smart Prepaid 112 110 102 104 119 116 119 116 TNT 80 77 71 75 85 83 82 83
Sun Postpaid 475 453 402 418 443 415 434 474
Sun Prepaid 80 81 84 85 66 67 67 73
20152016

47
Earnings Per Share (EPS)
Basic Diluted Basic Diluted
Net Income Attributable to Equity Holders of PLDT 20,006 20,006 22,065 22,065
Dividends on Preferred Shares (59) (59) (59) (59)
Net Income for the Period Attributable to Common Equity Holders of PLDT 19,947 19,947 22,006 22,006
Weighted Average Number of Common Shares, End 216,056 216,056 216,056 216,056
EPS (Based on Reported Net Income) 92.33 92.33 101.85 101.85
Core Income 27,857 27,857 35,212 35,212
Dividends on Preferred Shares (55) (55) (59) (59)
Core Income Applicable to Common Shares 27,802 27,802 35,153 35,153
Weighted Average Number of Common Shares, End 216,056 216,056 216,056 216,056
EPS (Based on Core Income) 128.68 128.68 162.70 162.70
FY2016 FY2015

48
(1) Net Debt calculated based on nominal value of debts less cash and cash equivalents and short-term investments(2) Nominal value of total debt
Balance Sheet
Total Assets 475,119 455,095
Nominal Value of Total Long-Term Debt 185,663 161,568
in US$ $3,730 $3,429
Less: Unamortized Debt Discount 631 676
Total Long-Term Debt 185,032 160,892
Cash and Short-Term Investments 41,460 47,884
Net Debt (1)
144,203 113,684
Equity 108,537 113,898
Total Debt(2)
/Equity 1.71x 1.42x
Net Debt(1)
/Equity 1.33x 1.00x
Total Debt(2)
/EBITDA 3.04x 2.30x
Net Debt (1)
/EBITDA 2.36x 1.62x
Consolidated
(Php in millions)December 31, 2016 December 31, 2015

49
Debt Profile
Interest-Bearing liabilities
December 31,
2015
Carrying
Value
Unamortized Debt
Discount/Debt
Issuance
Face Value(Audited)
Face Value
Debt
PLDT $2,208 $5 $2,212 $2,003 $209
Smart 1,504 8 1,512 1,322 190
DIGITEL 6 - 6 104 (98)
Total Debt $3,718 $13 $3,730 $3,429 $301
Change
(US$ in millions)
December 31, 2016
(US$ in millions) 2011 2012 2013 2014 2015 2016
Debt Balance 2,719 2,851 2,353 2,920 3,429 3,730
Cash and Short-Term Investments 1,061 919 735 610 1,016 833
Net Debt 1,658 1,932 1,618 2,310 2,413 2,897
50
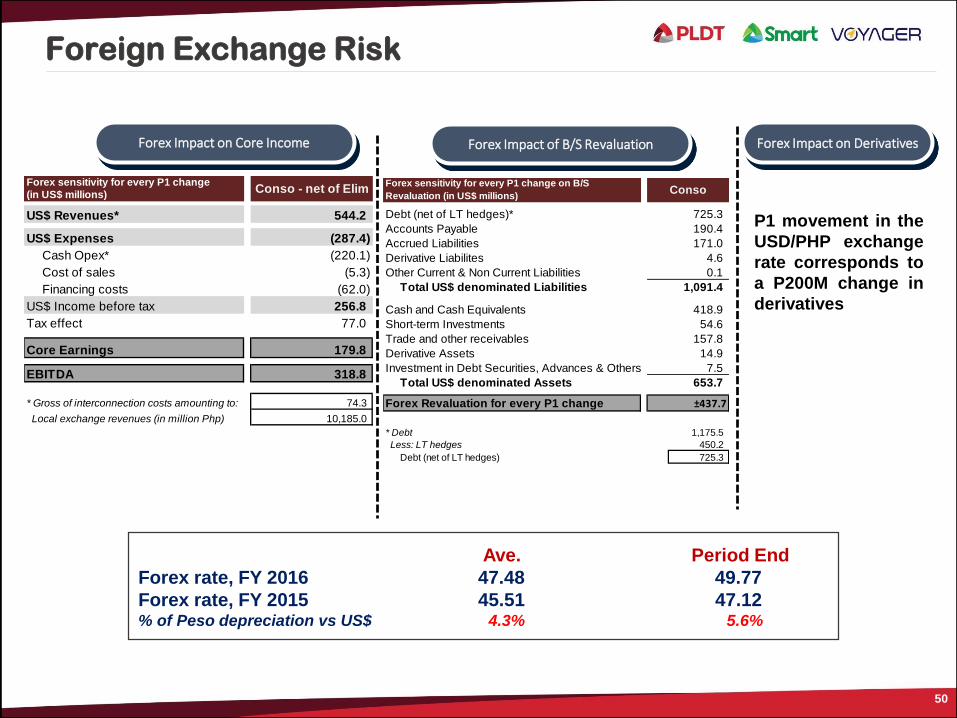
Ave. Period End
Forex rate, FY 2016 47.48 49.77
Forex rate, FY 2015 45.51 47.12% of Peso depreciation vs US$ 4.3% 5.6%
Foreign Exchange Risk
Forex Impact on Core Income Forex Impact of B/S Revaluation Forex Impact on Derivatives
P1 movement in the
USD/PHP exchange
rate corresponds to
a P200M change in
derivatives
Debt (net of LT hedges)*
Accounts Payable 190.4
Accrued Liabilities 171.0
Derivative Liabilites 4.6
Other Current & Non Current Liabilities 0.1
Total US$ denominated Liabilities 1,091.4
Cash and Cash Equivalents 418.9
Short-term Investments 54.6
Trade and other receivables 157.8
Derivative Assets
Investment in Debt Securities, Advances & Others 7.5
Total US$ denominated Assets 653.7
Forex Revaluation for every P1 change
* Debt 1,175.5
Less: LT hedges 450.2
Debt (net of LT hedges) 725.3
Conso
725.3
14.9
±437.7
Forex sensitivity for every P1 change on B/S
Revaluation (in US$ millions)(in US$ millions)
US$ Revenues*
US$ Expenses
Cash Opex* (220.1)
Cost of sales (5.3)
Financing costs (62.0)
US$ Income before tax
Tax effect 77.0
Core Earnings
EBITDA
* Gross of interconnection costs amounting to: 74.3
Local exchange revenues (in million Php) 10,185.0
Forex sensitivity for every P1 change Conso - net of Elim
544.2
(287.4)
256.8
179.8
318.8

51
Except for historical financial and operating data and other information in respect of historical matters,
the statements contained herein are “forward-looking statements” within the meaning of Section 27A of
the U.S. Securities Act of 1933, as amended, and Section 21E of the U.S. Securities Exchange Act of
1934, as amended. The words “believe”, “intend”, “plan”, “anticipate”, “continue”, “estimate”, “expect”,
“may”, “will” or other similar words are frequently used to indicate these forward looking statements.
Any such forward-looking statement is not a guarantee of future performance and involves a number of
known and unknown risks, uncertainties and other factors that could cause the actual performance,
financial condition or results of operation of PLDT to be materially different from any future
performance, financial condition or results of operation implied by such forward-looking statement.
Among the factors that could cause actual results to differ from the implied or expected results are
those factors discussed under “Risk Factors” in Item 3 in PLDT’s annual report on Form 20-F.
For inquiries, please contact: PLDT INVESTOR RELATIONS(632) [email protected]

52