presentation for investors and shareholders for the period...
TRANSCRIPT

1/7
Конфиденциально
Presentation for investors and shareholders for the period I – IX 2010
November 15th, 2010

Конфиденциально
2
Disclaimer
This presentation has been prepared by NIS a.d. Novi Sad (the “Company”), and comprises the slides for a presentation to investors concerning the Company. Presentation does not constitute or form part of any offer or invitation to sell, or any solicitation of any offer to purchase or subscribe for, any shares or other securities representing shares in the Company, nor shall it or any part of it nor the fact of its presentation or distribution form the basis of, or be relied on in connection with, any contract or investment decision.
Any viewer of this presentation considering a purchase of such securities is hereby reminded that any such purchase should be made solely on the basis of the information contained in the prospectus or other offering document prepared in relation thereto and will be subject to the selling restrictions set out therein. No reliance may be placed for any purposes whatsoever on the information contained in this presentation, or any other material discussed at any presentation or on its completeness, accuracy or fairness. The information in this presentation should not be treated as giving investment advice. Care has been taken to ensure that the facts stated in this presentation are accurate, and that the opinions expressed are fair and reasonable. However, the contents of this presentation have not been verified by the Company. Accordingly, no representation or warranty, express or implied, is made or given by or on behalf of the Company or any of its members, directors, officers or employees or any other person as to the accuracy, completeness or fairness of the information or opinions contained in or discussed at this presentation. None of the Company or any of their respective members, directors, officers or employees nor any other person accepts any liability whatsoever for any loss howsoever arising from any use of this presentation or its contents or otherwise arising in connection therewith.
The information in this presentation includes forward-looking statements. These forward-looking statements include all matters that are not historical facts, statements regarding the Company’s intentions, beliefs or current expectations concerning, among other things, the Company’s results of operations, financial condition, liquidity, prospects, growth, strategies, and the industry in which the Company operates. By their nature, forward-looking statements involve risks and uncertainties, including, without limitation, the risks and uncertainties to be set forth in the prospectus, because they relate to events and depend on circumstances that may or may not occur in the future. The Company cautions you that forward looking statements are not guarantees of future performance and that its actual results of operations, financial condition and liquidity and the development of the industry in which the Company operates may differ materially from those made in or suggested by the forward-looking statements contained in this presentation. In addition, even if the Company’s results of operations, financial condition and liquidity and the development of the industry in which the Company operates are consistent with the forward-looking statements contained in this presentation, those results or developments may not be indicative of results or developments in future periods. The information and opinions contained in this presentation are provided as at the date of this presentation and are subject to change without notice.
No person is under any obligation to update or keep current the information contained herein.
By attending the presentation you agree to be bound by the foregoing limitations.
Конфиденциально
3
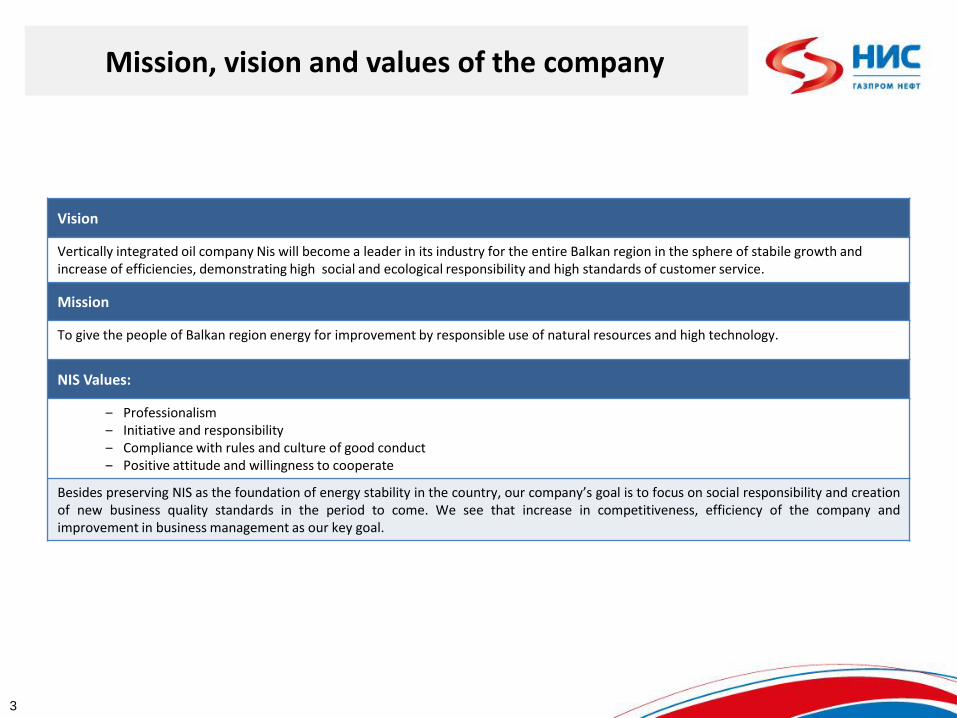
Mission, vision and values of the company
Vision
Vertically integrated oil company Nis will become a leader in its industry for the entire Balkan region in the sphere of stabile growth and increase of efficiencies, demonstrating high social and ecological responsibility and high standards of customer service.
Mission
To give the people of Balkan region energy for improvement by responsible use of natural resources and high technology.
NIS Values:
‒ Professionalism ‒ Initiative and responsibility ‒ Compliance with rules and culture of good conduct ‒ Positive attitude and willingness to cooperate
Besides preserving NIS as the foundation of energy stability in the country, our company’s goal is to focus on social responsibility and creation of new business quality standards in the period to come. We see that increase in competitiveness, efficiency of the company and improvement in business management as our key goal.

Конфиденциально
4
Company information on September 30th, 2010
Business name: NIS a.d. Novi Sad
Company ID number: 20084693
Address: Novi Sad, 12 Narodnog fronta street
Tax ID: 104052135
Web site: www.nis.rs
Activity: 0610 – exploitation of crude oil
Number and date of registration in BRA: BD 92142, September 29th, 2005
Total equity as of September 30th, 2010: 34,857,869,000 RSD
Share capital as of September 30th, 2010: 81,530,200,000 RSD
Number of employees as of September 30th, 2010: 10,160*
Number of shareholders as of September 30th, 2010: 4.723.352
Share information
Number of issued common shares: 163,060,400
Face value: 500.00 RSD
CFI code: ESVUFR
ISIN number: RSNISHE79420
Shareholder structure as of October 4th, 2010
Gasprom neft 51,00%
Republic of Serbia 29,88%
Minority shareholders 19,12%
Shareholder structure as of October 4th, 2010
* without employees from servicing organizations
51,00%
29,88%
19,12%
Gazprom Neft
Republic of Serbia
Minority shareholders

Конфиденциально
5
Corporate Governance
Corporate bodies structure Board of Directors, executive board and Supervisory board members
SHAREHOLDERS ASSEMBLY
BOARD OF DIRECTORS
GENERAL MANAGER
EXECUTIVE BOARD
INVESTMENT COMITEE
FINANCIAL ECONOMIC COMITEE
PROCUREMENT COMITEE
EXTERNAL AUDITOR
SUPERVISORY BOARD
COMPANY’S SECRETARY
REMUNERATION COMITEE
NOMINATION COMITEE
VOTING AND VERIFICATION COMMISSION
Vadim Yakovlev Chairman of Board
of Directors
Kirill Kravchenko BoD member
Igor Antonov BoD member
Anatoly Cherner
BoD member
Alexander Dybal
BoD member Nikola
Martinovic BoD member
Vladislav Barisnikov BoD member
Danica Draskovic
BoD member
Stanislav Seksnja
BoD member
Dusan Petrovic
BoD member
Milivoje Cvetanovic Chairman of
Supervisory Board Bozo Stanisic Supervisory board
member
Maksim Sahov Supervisory
board member
GENERAL MANAGER
Kirill Kravchenko
COMPANY’S SECRETARY Ana Vichugzanjina
Kirill Kravchenko
Chairman of Executive board
Predrag Radenovic
Executive board member
Alexey Urusov Executive board
member
Yurj Masijanski Executive board
member
Roman Kvitko Executive board
member
Nicolas Constantin Petri+ Executive board
member
Igor Tarasov Executive board
member
*as of September 30th, 2010

Конфиденциально
6
Business structure
NIS
Upstream
Crude oil
Natural gas
Elemir facility
Refining
Refinery Pancevo
Refinery Novi Sad
Sales & Distribution
Retail
Wholesale
Logistic
Trading
Oils and lubes
Head office administration
service
Oilfield services
Oil services
Technical services
Hydro probe
Geophysical services
Transport
* Business structure as of October 1st, 2010
Конфиденциально
7
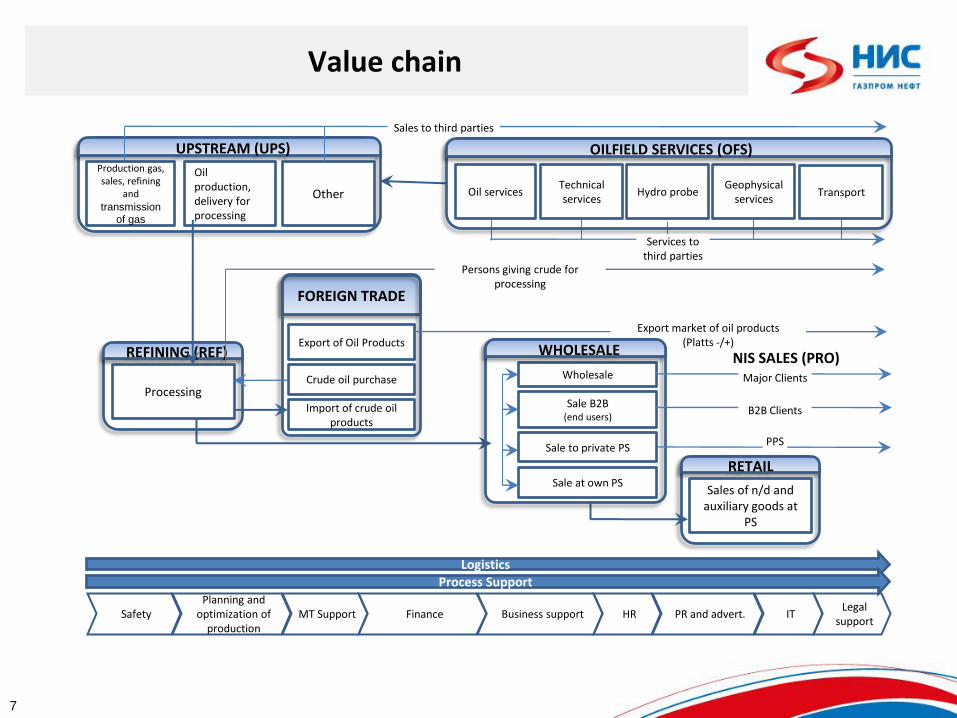
Value chain
UPSTREAM (UPS)
Oil production, delivery for processing
Other
REFINING (REF)
Processing
RETAIL
Sales of n/d and auxiliary goods at
PS
FOREIGN TRADE
Export of Oil Products
Crude oil purchase
Import of crude oil products
Logistics Process Support
HR PR and advert. IT Safety Planning and
optimization of production
МТ Support Finance Business support Legal
support
Sales to third parties
Persons giving crude for processing
Export market of oil products (Platts -/+)
Sale at own PS
Sale B2B (end users)
Wholesale
Sale to private PS
WHOLESALE
Major Clients
B2B Clients
PPS
NIS SALES (PRO)
Production gas, sales, refining
and transmission
of gas
OILFIELD SERVICES (OFS)
Technical services
Hydro probe Geophysical
services Transport Oil services
Services to third parties

Конфиденциально
8
9M 2010: Key indicators
Key indicators Units of measurement 9M ‘09 9M ‘10 Change
Amount %
Urals $/bbl 56.37 75.77 19.40 34%
Net profit (loss) billion RSD -6.80 2.70 9.50 140%
Net profit (loss) before foreign exchange differences billion RSD -5.52 13.28 18.80 341%
Net foreign exchange differences billion RSD -1.28 -10.60 -9.32 -728%
EBITDA billion RSD 2.40 17.20 14.80 617%
Sales (without excise tax) billion RSD 80.90 111.90 31.00 38%
OCF billion RSD 7.50 14.20 6.70 89%
Paid taxes and fiscal obligations** billion RSD 55.40 61.90 6.50 12%
Domestic oil and gas production thousand conditional tons*** 670.10 880.40 210.30 31%
Domestic oil production thousand tons 482.40 621.80 139.40 29%
Oil processing volume including third parties thousand tons 2,172.20 2,202.30 30.10 1%
Oil processing volume excluding third parties thousand tons 1,967.30 2,195.10 227.80 12%
Total sales of oil products thousand tons 1,886.60 1,950.60 64.00 3%
Oil products local market sales thousand tons 1,645.20 1,636.50 -8.70 -1%
Retail thousand tons 446.80 409.90 -36.90 -8%
Light oil products sales thousand tons 1,084.60 1,180.00 95.40 9%
CAPEX from GPN loan**** million EUR 9.70 48.50 38.80 400%
CAPEX from OCF (NIS projects) billion RSD 2.20 2.80 0.60 27%
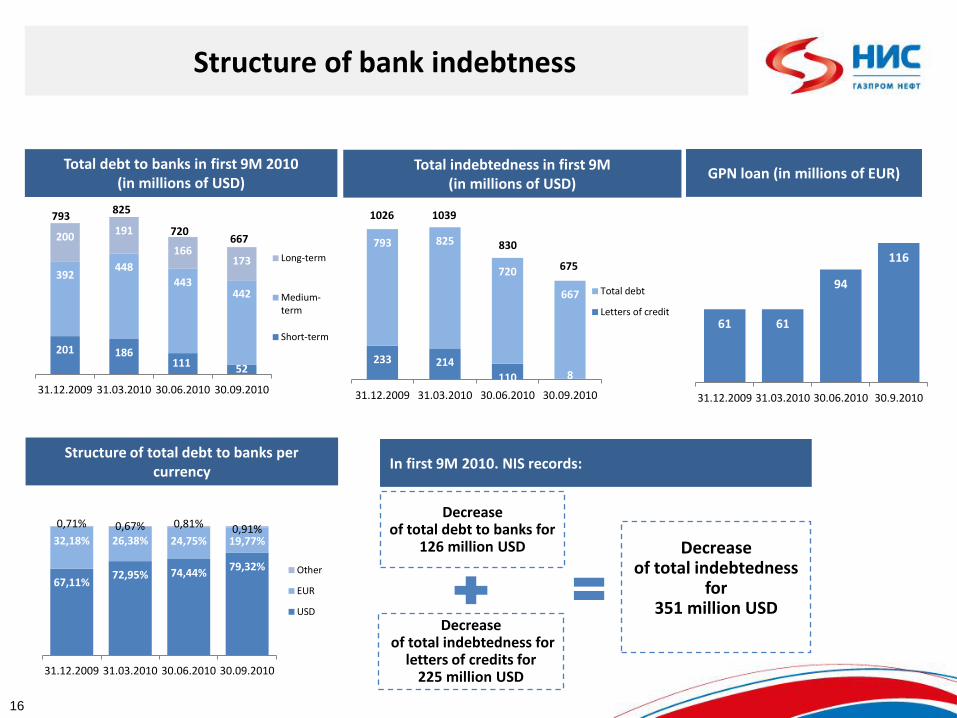
Total debt to banks million USD 830.00 667.00 -163.00 -20%
Total bank indebtedness***** million USD 991.00 675.00 -316.00 -32%
*Before opening balance adjustments on 2nd February and before impairment of the fixed assets (see presentation “General data about NIS on 31 December 2009 page 50 for further detail) ** Taxes paid and fiscal obligations includes taxes, duties, fees and other public revenues *** 1.256 m3 gas = 1 conditional ton of oil **** Under the Agreement of sale and purchase of shares of NIS a.d Novi Sad, clause 8.1.2, JSC Gazprom Neft (GPN) has an obligation to provide EUR 500 million to NIS a.d. Novi Sad by way of special purpose loans in order to implement NIS Novi Sad technological complex reconstruction and modernization program ***** Total bank indebtedness = Total debt to banks + letters of credit

Конфиденциально
9
Macroeconomic indicators
Inflation USD/RSD in the first 9M of 2010 amounted to 17.06% or 11.38 RSD Inflation EUR/RSD in the first 9M of 2010 amounted to 10.73% or 10.29 RSD Inflation USD/RSD in the first 9M of 2009 amounted to 1.11% or 0.70 RSD Inflation EUR/RSD in the first 9M of 2009 amounted to 4.98% or 4.41 RSD There were no significant fluctuations in the crude oil price in the world market
30
40
50
60
70
80
90
I II III IV V VI VII VIII IX
Urals, USD/bbl
Actual 2009 Actual 2010
60
65
70
75
80
85
I II III IV V VI VII VIII IX
USD/RSD
Actual 2009 Actual 2010

Конфиденциально
10
Market share
RS Market volume in thousand of tons
In first 9М 2010. the share of NIS on
Serbian Market was 67%, which indicates to increase of +2% versus the same period 2009.
In the first 9 months of 2010, BMB95 and euro-diesel recorded increasing trend versus last year
After the drop in consumption in the first two quarters, the third quarter had increase in consumption, compared to the same quarter last year and also compared to the previous quarter of 2010.
* According to NIS data and assessments
35% 33%
65% 67%
9M '09 9M '10
NIS
Other marketparticipants inRepublic ofSerbia
-3%
2.521 2.447
Конфиденциально
11
Net profit
(loss)
Net profit (loss) before FX
Net FX costs
Financial indicators
1,7
4,5
7,1
Q1 ‘10 Q2 ‘10 Q3 ‘10
-4,5 -5,1
12,3
Q1 ‘10 Q2 ‘10 Q3 ‘10
13%
-1,3
-10,6
9M ‘09 9M ‘10
728%
-6,2
-9,6
5,2
Q1 ‘10 Q2 ‘10 Q3 ‘10
Increase in USD/RSD exchange rate of 17.1% or +11.4 RSD
Increase in EUR/RSD exchange rate of 10.7% or +10.3 RSD
Increase of net FX costs compared to first 9 months in 2009
Increase of net profit (loss) before FX costs compared to first 9 months in 2009
Increased business efficiency (increase in domestic oil and gas production)
Increase of net profit (loss) compared to first 9 months in 2009
Decrease of FX costs in third quarter
-6,8
2,7
9M ‘09 9M ‘10
+140%
-5,5
13,3
9M ‘09 9M ‘10
+341%
Конфиденциально
12
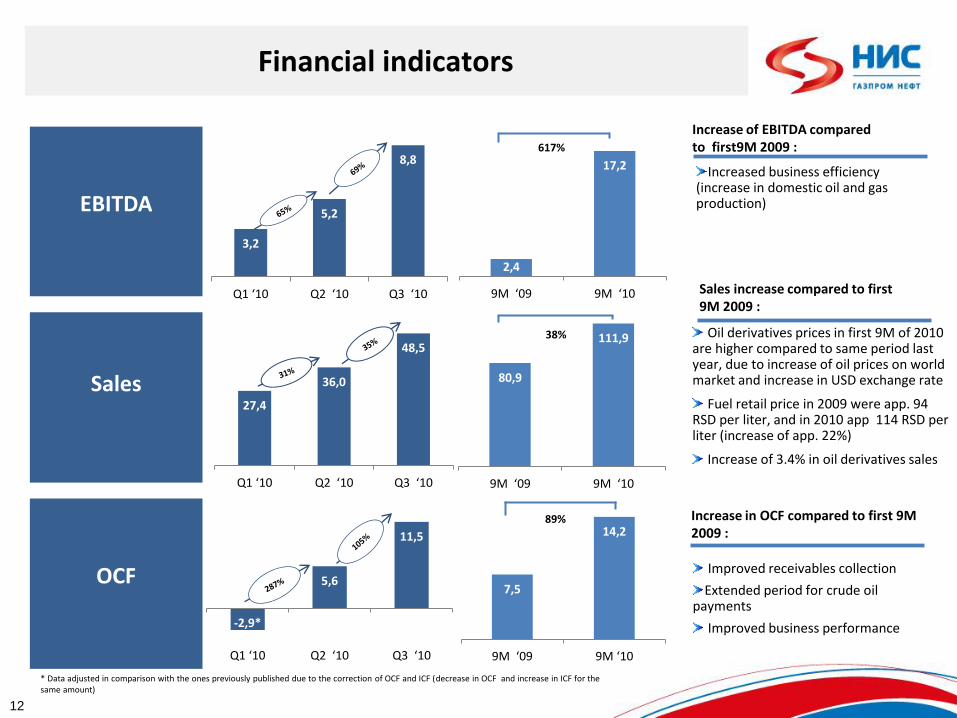
EBITDA
Sales
OCF
Financial indicators
2,4
17,2
9M ‘09 9M ‘10
617%
3,2
5,2
8,8
Q1 ‘10 Q2 ‘10 Q3 ‘10
80,9
111,9
9M ‘09 9M ‘10
38%
7,5
14,2
9M ‘09 9M ‘10
89%
27,4
36,0
48,5
Q1 ‘10 Q2 ‘10 Q3 ‘10
-2,9*
5,6
11,5
Q1 ‘10 Q2 ‘10 Q3 ‘10
* Data adjusted in comparison with the ones previously published due to the correction of OCF and ICF (decrease in OCF and increase in ICF for the same amount)
Increase of EBITDA compared to first9М 2009 :
Increased business efficiency (increase in domestic oil and gas production)
Sales increase compared to first 9М 2009 :
Oil derivatives prices in first 9M of 2010 are higher compared to same period last year, due to increase of oil prices on world market and increase in USD exchange rate
Fuel retail price in 2009 were app. 94 RSD per liter, and in 2010 app 114 RSD per liter (increase of app. 22%)
Increase of 3.4% in oil derivatives sales
Increase in OCF compared to first 9М 2009 :
Improved receivables collection
Extended period for crude oil payments
Improved business performance

Конфиденциально
13
Oil and gas production
Domestic oil production (in thousand tons)
Domestic oil and gas production (in thousand of tons)
482,41
621,77
9M '09 9M '10
+29%
193
205
223
Q1 '10 Q2 '10 Q3 '10
269,5
290,1
320,8
Q1 '10 Q2 '10 Q3 '10
670,12
880,40
9M '09 9M '10
+31%
Domestic oil and gas increase of 31% compared to first 9M 2009:
New system of production using ESP* pumps was implemented on 16 oil wells. Fracturing was preformed on 5 oil wells.
Inactive wells activated
Highly efficient geophysical and technical measurements were made
Gas deposit in the Velebit field was commissioned
Oil well workover at Mokrin-Zapad gas deposit. Medja deposit, that was not in use, has been commissioned
Inactive gas wells in section Central Banat activated

Конфиденциально
14
Refining
Oil processing per refinery (in thousand tons)
Oil processing including third parties
Oil processing in Novi Sad Refinery was decreased for 3,5% compared to last year, and also records a decrease compared to previous quarter
Operation structure of refineries in Novi Sad and pancevo is not significantly changed
Increase of oil processing volume including third parties for 1% compared to first 9M 2009 :
Increase of oil processing in Q3 compared to Q2 2010 (as needed to build up inventories of products for the expected refinery Pancevo overhaul in October-November 2010)
445,87 492,72
620,16 218,35
215,88
202,13
7,17
Q1 '10 Q2 '10 Q3 '10
Crude oil tollservices forthird parties
Own crude
Imported crude
822
671 709
1,512.19 1,558.75
455,07 636,35
204,88 7,17
9M '09 9M '10
Crude oil tollservices for thirdparties
Own crude
Imported crude
1,4%
2.172 2.202
3%
40%
-96%
8% 10% 5%
92% 90% 95%
Q1 '10 Q2 '10 Q3 '10
RNP
RNS
11% 8%
89% 92%
9M '09 9M '10
RNP
RNS
3,5%
-3,5%

Конфиденциально
15
Sales and Distribution
Sales structure per oil derivatives (in thousand tons)
Oil derivatives sales (in thousand tons)
Retail – Sales volume for 2010 record decrease only for January and February. In these two months in 2009 sales was above normal levels due to gas crisis, and after sales volume decreased due to sharp increase of excise tax. Sales volume for period March-September 2010 was in line with the results for 2009.
Wholesale – increase in sales was caused by competitive price policy (diesel, euro-diesel and oil fuel)
Export – increase in delivery of oil fuel, diesel and petrol components in order to optimize stocks
Increase of total sales of oil derivatives of 3% compared to first 9М 2009:
*data for Q1 and Q2 are corrected after the verification
109 143 158
341 331
458
35 27
41
76 126
113
Q1 ‘10 Q2 ‘10 Q3 ‘10
Export
Direct deliveryfrom theRefinery
Wholesale
Retail
770
627
554
447 410
1.104 1.124
94 103
241 314
9M '09 9M '10
Export
Direct deliveryfrom the Refinery
Wholesale
Retail
1,951
3%
-8%
2%
30%
9%
1,887
178 188
271
376
439
499
Q1 '10 Q2 '10 Q3 ‘10
Whiteproducts
Black andother products
627
554
770
6%
17%
14%
44% 681 637
1.205 1.314
9M '09 9M '10
Whiteproducts
Black andotherproducts
3%
1.951
+9%
-7%
1.887
Конфиденциально
16
Structure of bank indebtness
GPN loan (in millions of EUR)
Structure of total debt to banks per currency
Total debt to banks in first 9M 2010 (in millions of USD)
Total indebtedness in first 9M (in millions of USD)
61 61
94
116
31.12.2009 31.03.2010 30.06.2010 30.9.2010
In first 9М 2010. NIS records:
Decrease of total debt to banks for
126 million USD
Decrease of total indebtedness for
letters of credits for 225 million USD
Decrease of total indebtedness
for 351 million USD
201 186 111 52
392 448
443 442
200 191
166 173
31.12.2009 31.03.2010 30.06.2010 30.09.2010
Long-term
Medium-term
Short-term
793 825
720 667
233 214
110 8
793 825
720
667
31.12.2009 31.03.2010 30.06.2010 30.09.2010
Total debt
Letters of credit
1026 1039
830
675
67,11% 72,95% 74,44%
79,32%
32,18% 26,38% 24,75% 19,77%
0,71% 0,67% 0,81% 0,91%
31.12.2009 31.03.2010 30.06.2010 30.09.2010
Other
EUR
USD

Конфиденциально
17
Investments
Project MHC/DHT – realization of MHC/DHT project commenced at the end of 2009
Ecology – most of ecological projects are approved and are in the realization stage
Projects with direct economic effect – transfer of obligations from 2009 and commencement of setup works on the large number of retail-sale facilities
Projects without direct economic effect – in first 9M of 2010 decrease of 10% compared to same period last year was recorded
Angola – operator’s costs in Angola are lower compared with the costs in 2009
Other – decrease due to the fact that smaller portion of obligations for the rest of projects were transferred to 2010
Changes in CAPEX per investment projects in first 9М 2010 compared to same period in 2009:
CAPEX from GPN loan and CAPEX from NIS OCF in first 9 months 2010 (in billions of RSD)
CAPEX per investment projects (in billions of RSD)
*in billions of RSD
5,09
2,82
CAPEX from GPN loan CAPEX from NIS OCF
Sources of investment funding 9М ‘09 9М ’10
CAPEX from GPN loan 0,90 5,09
Ecology 0,87 1,06
MHC/DHT 0,03 4,03
CAPEX from OCF (NIS funds) 2,25 2,82
Ecology 0,00 0,00
Angola 0,69 0,45
Projects with direct economic effect 0,17 1,17
Projects without direct economic
effects 1,05 0,94
Other 0,35 0,25
Total: 3,15 7,91 0,03
4,03
0,87
1,06
0,69
0,45
0,17
1,17
1,05
0,94
0,35
0,25
9M 09 9M 10
Other
Project without directeconomic effectProject with direct economiceffectAngola
Ecology
MHC/DHT
3,15
7,91
+22%
x126
x7
-10%
-35%
-27%
+151%

Конфиденциально
18
Stock exchange trading
Trading on Belgrade Stock Exchange in the period August 30th – September 30th, 2010
Last price 461 RSD
High 550 RSD
Low 442 RSD
Total turnover 359,961,200 RSD
Total volume 761,498 shares
Total number of transactions 122,651
Market cap as of September 30th, 2010 75,170,844,400.00 RSD
EPS 16,42 RSD
P/E 28,08
Book value as of September 30th, 2010 213,77 RSD
P/BV 2,16
18
• August 23rd, 2010 – Belgrade Stock Exchange made the decision on the admission of NIS a.d., Novi Sad shares to listing A - Prime Market
• August 30th, 2010 – First trading day for NIS shares
400
420
440
460
480
500
520
540
560
0
10.000
20.000
30.000
40.000
50.000
60.000
70.000
80.000
90.000
100.000
110.000
120.000
30
.08
.201
0.
31
.08
.201
0.
01
.09
.201
0.
02
.09
.201
0.
03
.09
.201
0.
06
.09
.201
0.
07
.09
.201
0.
08
.09
.201
0.
09
.09
.201
0.
10
.09
.201
0.
13
.09
.201
0.
14
.09
.201
0.
15
.09
.201
0.
16
.09
.201
0.
17
.09
.201
0.
20
.09
.201
0.
21
.09
.201
0.
22
.09
.201
0.
23
.09
.201
0.
24
.09
.201
0.
27
.09
.201
0.
28
.09
.201
0.
29
.09
.201
0.
30
.09
.201
0.
Volume
Price and volume movements – Candlestick chart
Price
Конфиденциально
19
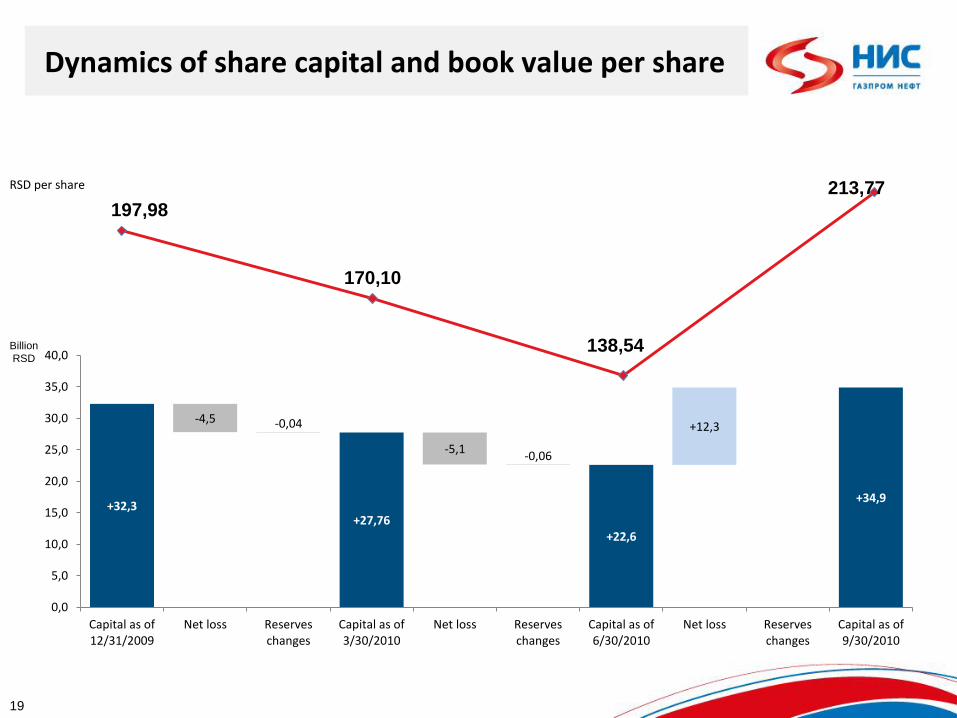
Dynamics of share capital and book value per share
Billion
RSD
RSD per share
+32,3 +27,76
+22,6
+34,9
-4,5 -0,04
-5,1 -0,06
+12,3
0,0
5,0
10,0
15,0
20,0
25,0
30,0
35,0
40,0
Capital as of12/31/2009
Net loss Reserveschanges
Capital as of3/30/2010
Net loss Reserveschanges
Capital as of6/30/2010
Net loss Reserveschanges
Capital as of9/30/2010
197,98
170,10
138,54
213,77

Конфиденциально
20
Naftna Industrija Srbije j.s.c. Novi Sad Investor Relations Sector Narodnog fronta 12 21000 Novi Sad, Serbia e-mail: [email protected]