presentation by: paul d. acquaro marianne demarco an exploratory case study on what makes a good...
Post on 22-Dec-2015
214 views
TRANSCRIPT
Presentation by:Paul D. AcquaroMarianne DeMarco
An Exploratory Case Studyon what makes a good school website: Investigation of Long Island School District Website Homepages across the socioeconomic statuses.
Abstract
The purpose of this exploratory case study was to
examine 50 public school district websites in
Nassau and Suffolk County to identify the
differences in quality and content across the
different socio-economic levels.

Introduction
With the New York State Board of Education
spending 17.2 million dollars during this fiscal year
on Informational Technologies, we believe that
individual school district websites are a good
indicator of how districts are using informational
technologies to reach students, staff and the
community around them.

Literature Review
We conducted a thorough literature review from a
broad range of recent literature across four
disciplines. We identified key characteristics of 44
articles of the more than eighty articles reviewed as
part of this empirical research where items such as
the what and why school districts should have
websites.

The Problem
State of New York’s Department of Education
needs to provide a consistent template for the
distribution of money placed forth for informational
technologies so that all schools can have quality
websites regardless of socio-economic status thus
promoting communication with the community.
The Purpose of the Study
The purpose of this study is to examine
school district websites and identify
differences between website quality based
on two instruments developed to measure
website contents and website quality.

Significance of the Study
“The nation’s continued investment in
school-based technology has resulted in
significant progress toward closing the
digital divide”
(Judge, Pucket & Bell, 2006).
Research Question
Is there a difference between socio-
economic status and school district website
quality and its content?
Sample
Selected from the 127 Long Island public School districts This research examined 50 school websites from the
following distribution:
10 Districts from Lower Class (below 55k), 15 Districts from Lower Middle Class (55k-67.499K), 15 Districts from Upper Middle Class (67.5-79,999k)10 Districts from Upper Class (greater then 80k)
This sample represents 40% of the total school district population in the two counties.

Method
After the 50 sites are randomly selected, they were
reviewed independently by both researchers.
Each of the two researchers reviewed the same 50 school
districts, using the two instruments, and the data was
cross-referenced.
Research was compared and only websites for which
there was a 90% agreement on the criteria between
researchers was included in the analysis.

Instrument One
Developed from the review of previously published literature
on the topic of quality school websites.
The instrument consists of 17 Common Components in
school websites.
Each of the websites was examined for common
components based upon the article’s suggestion which
states an effective school based website should consist of a
minimum of ten of the components.

Instrument Two
Our second instrument is tool developed by two
professional educators whose goal is aligned with our
research. This instrument assesses website quality to
determine if the website provides useful information for
classroom use, or student and parent use at home.
This instrument measure four areas: Stimulating features,
Meaningful contents, Organization and Ease-of -Use

Procedure
The 50 were identified by only a number.
This was done by placing each of the school districts into a
Microsoft Excel Spread sheet by name, socio-economic
status and website URL.
The status column was then removed and the districts
were sorted by alphabetical order.
As the researchers we then at different locations
investigated the 50 websites, upon completion of the
evaluations we caucused to compare our findings.
Data Analysis Policy Information
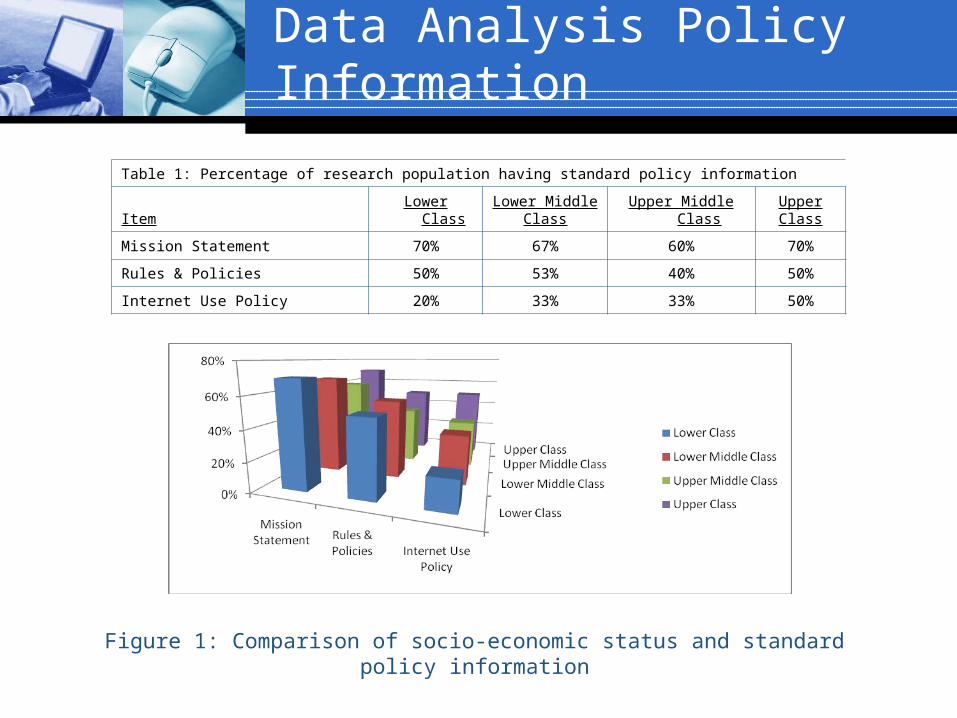
Table 1: Percentage of research population having standard policy information
Item Lower ClassLower Middle
Class Upper Middle ClassUpper Class
Mission Statement 70% 67% 60% 70%
Rules & Policies 50% 53% 40% 50%
Internet Use Policy 20% 33% 33% 50%
Figure 1: Comparison of socio-economic status and standard policy information
Data Analysis Curriculum
TxtText
Te
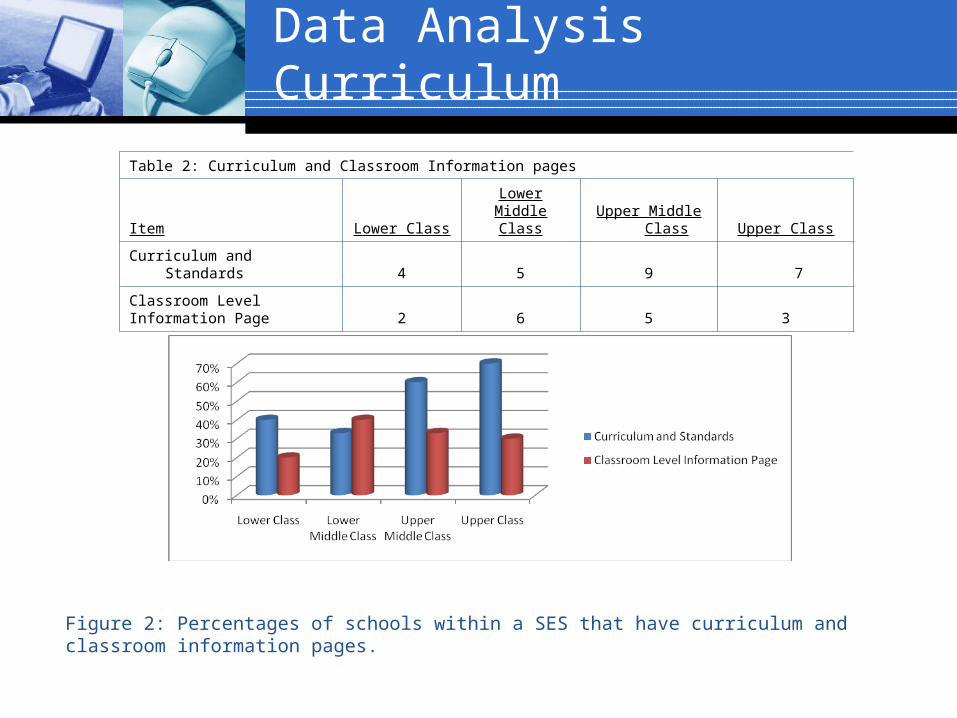
Table 2: Curriculum and Classroom Information pages
Item Lower ClassLower Middle
Class Upper Middle Class Upper Class
Curriculum and Standards 4 5 9 7
Classroom Level Information Page 2 6 5 3
Figure 2: Percentages of schools within a SES that have curriculum and classroom information pages.

Data Analysis General Information
TEXT TEXT TEXT TEXT
Table 3: General information found at school district websites
Item Lower Class Lower Middle Class Upper Middle Class Upper Class
Teacher Information 8 10 9 7
Grade Level Information Page 2 2 4 5
School News 8 14 14 9
Breakfast and Lunch Menus 8 13 11 7
Student Work Samples 3 6 6 1
Physical Location of the School 10 15 15 9
Figure 3: Percentage of schools general information found at school district websites
Data Analysis Resources
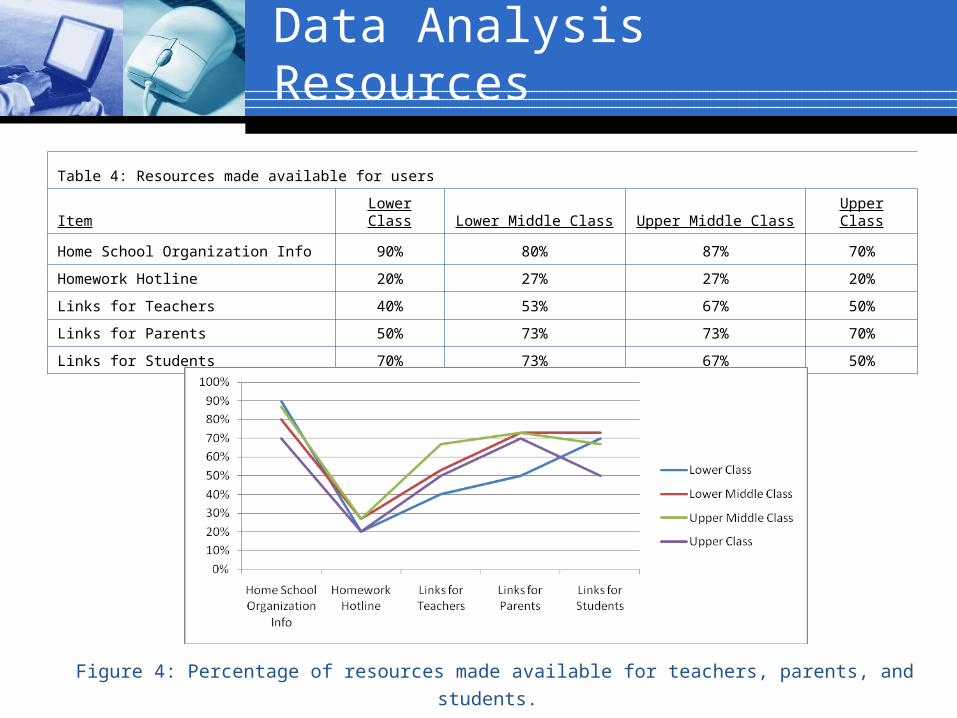
Table 4: Resources made available for users
Item Lower Class Lower Middle Class Upper Middle Class Upper Class
Home School Organization Info 90% 80% 87% 70%
Homework Hotline 20% 27% 27% 20%
Links for Teachers 40% 53% 67% 50%
Links for Parents 50% 73% 73% 70%
Links for Students 70% 73% 67% 50%
Figure 4: Percentage of resources made available for teachers, parents, and students.
Data Analysis
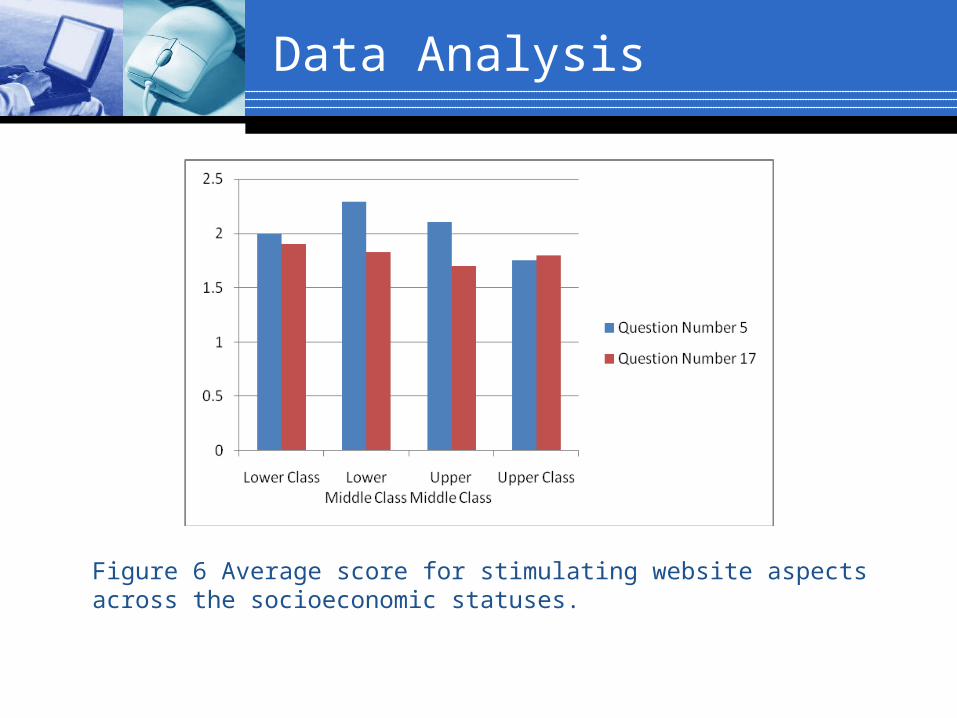
Figure 6 Average score for stimulating website aspects across the socioeconomic statuses.
TEXTTEXT TEXT

Data Analysis
Figure 7 Average score for meaningful website aspects across the socioeconomic statuses.
00.20.40.60.8
11.21.41.61.8
2
Lower Class LowerMiddleClass
UpperMiddleClass
UpperClass
Question Number 6
Question Number 26

Data Anaylsis
0
0.5
1
1.5
2
2.5
3
Lower Class LowerMiddleClass
UpperMiddleClass
UpperClass
Question Number 3
Question Number 19
Figure 8: Average score for organizational aspects of district websites across the socioeconomic statuses.

Data Analysis
0
0.5
1
1.5
2
2.5
3
Lower Class LowerMiddleClass
UpperMiddleClass
UpperClass
Question Number 20
Question Number 28
Figure 9 Ease of use average grades on questions 20 and 28 for lower class districts
Cross Summary Motivation Analysis
Similar to the results on question 17, question 3 resulted in a majority of positive responses but only and hand full of districts receive the maximum score of three points because of the failure to provide audio and visual clarification tools to describe topics.
In table 7 is the chi square comparison of the questions 3 and 17, results are similar with the the lower grades on average going the more in depth question (question 3).

Table 7
Stimulating Organization
17 3
School SES Level
Lower Class 1.9 1.9
Lower Middle Class 1.83 1.93
Upper Middle Class 1.7 1.83
Upper Class 1.8 1.85
Table 7 Cross summary motivation analysis of stimulating and organization questions
Research Findings
The findings suggests the importance of attending to personal, as well as, contextual motivators of parental
engagement in their children’s education as researchers and educators work to understand and enhance the effectiveness of parent-school relationships (Hoover-
Dempsey, Jones, Reed, and Walker, 2000).
Teachers should find ways to extend invitations to parents for participation, and to provide parents information on
course work and materials.
These finding hold implications for parents, teachers, principals, and policy makers interesting in strengthening
family-school partnerships and their influence on children’s educational outcomes (Hoover-Dempsey, Jones, Reed, and
Walker, 2000).

Conclusions
There is a need for the creation of a consistent template for school web site development or at least an agreed upon list of common components for school district web sites.
There is no surprise that across the socioeconomic landscape some schools of greater means provide more valuable resources then others. These resources can include many variables such as technologies, experience and staffing but never the less all school districts at this point need to have a media outlet for communication of events, school happenings and students work.

Recommendations for Future Studies
Among the reasons for development of valuable school/classroom websites this research determined that it as a field educators need to develop meaningful websites where all uses can not only access information but also be directed to additional help and support.
Further research should include investigation of individual school websites. Looking at the current effort at the school levels will help to identify the importance placed on the internet more so websites by school leadership as a tool in communicating with the community at larger.
Individual school development of websites should be viewed as an opportunity for publication of student work and could be a motivating factor in student achievement.
Summary of Study
Review of the data gather from the instruments we used has shown that regardless of socio-economic status websites fail to provide such useful resources as homework hotlines for students, classroom level informational pages, an explanation of the district Internet Safe Usage policy and many district fail to promote student success by displaying the student work.
While reviewing the data we have also identified that the most common component was all but one district identified the physical location of the schools within the district.

References
Judge, S., Puckett, K. & Bell, S. M. (2006) Closing the digital divide: Update from the early childhood longitudinal study. The Journal of Educational Research, 100(1), 52-60.
Hoover-Dempsey, K., Jones, K.P., Reed, R., and Walker, J. (2000, April). Parents motivation for involvement in children’s education: Testing a theoretical model. Paper presented at the annual conference of the American Educational research Association, New Orleans,
LA. Retrieved October 9, 2007, from the ERIC database.