presentation by: arun arya, senior public sector specialist, world...
TRANSCRIPT
Presentation by:
Arun Arya,Senior Public Sector Specialist,
World Bank
December 15, 2009

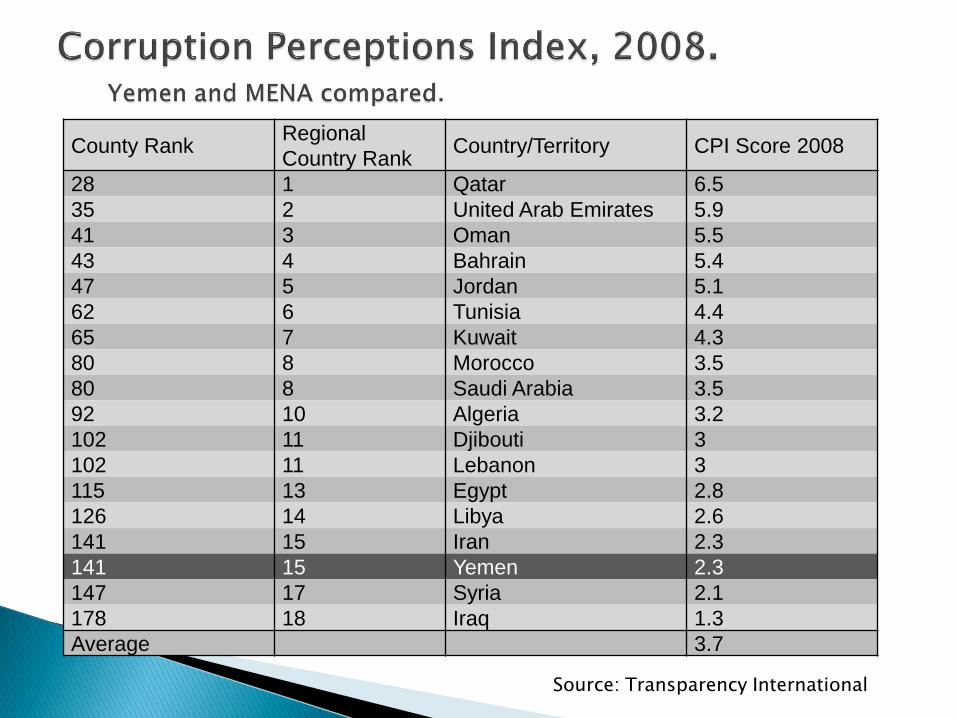
County RankRegional
Country Rank Country/Territory CPI Score 2008
28 1 Qatar 6.5
35 2 United Arab Emirates 5.9
41 3 Oman 5.5
43 4 Bahrain 5.4
47 5 Jordan 5.1
62 6 Tunisia 4.4
65 7 Kuwait 4.3
80 8 Morocco 3.5
80 8 Saudi Arabia 3.5
92 10 Algeria 3.2
102 11 Djibouti 3
102 11 Lebanon 3
115 13 Egypt 2.8
126 14 Libya 2.6
141 15 Iran 2.3
141 15 Yemen 2.3
147 17 Syria 2.1
178 18 Iraq 1.3
Average 3.7
Source: Transparency International

D. Public Sector Management and Institutions
Country
Property
Rights &
Rule-based
Governance
Quality of
Budget. &
Financial
Management
Efficiency of
Revenue
Mobilization
Quality of
Public
Administration
Transparency,
Accountability
& Corruption in
Public Sector
Average
ALGERIA 3.0 3.5 3.0 3.5 3.0 3.2
DJIBOUTI 2.5 3.0 3.5 2.5 2.5 2.8
EGYPT 3.5 3.0 4.0 3.0 2.5 3.2
IRAN 3.0 3.5 3.5 3.0 2.5 3.1
JORDAN 4.0 3.5 4.5 3.5 3.5 3.8
LEBANON 2.5 3.0 3.5 2.5 3.0 2.9
MOROCCO 3.5 4.0 4.0 4.0 3.5 3.8
SYRIA 3.0 3.0 2.0 2.5 1.5 2.4
TUNISIA 3.5 4.0 4.0 4.0 2.0 3.5
YEMEN, REP. 2.5 3.5 3.0 3.0 3.0 3.0
Each criterion assessed on scale 1-6, with 6 being best. Average with all criteria weighed equally.
Source: World Bank

Category Article MarkEvaluation
2008 2006
A Civil society institutions and public
information media
36 Very weak Very weak
A-1 Civil society institutions 47 Very weak
A-2 Public Media 35 Very weak
A-3 People access to information 27 Very weak
B Elections 46 Very weak Very weak
B-1 Voting and citizens participation 62 Weak
B-2 Elections integrity 65 Weak
B-3 Political funding 11 Very weak
C Government accountability 30 Very weak Very weak
C-1 Accountability of the Executives 45 Very weak
C-2 Accountability of the legislatives 22 Very weak
C-3 Accountability of the judiciaries 17 Very weak
C-4 Budget process 35 Very weak
The Index assesses the existence, effectiveness, and citizen access to key anti-corruption mechanisms at the national level in a country.

D Administrative and civil service 44 Very weak Very weak
D-1 Civil service system 28 Very weak
D-2 Freehand whistle measures 21 Very weak
D-3 Procurement 57 Very weak
D-4 Privatization 70 weak
E Control and regulation 52 Very weak Very weak
E-1 National Ombudsman 53 Very weak
E-2 Top Audit Institution 47 Very weak
E-3 Tax and customs 50 Very weak
E-4 State-owned enterprises 48 Very weak
E-5 Licensing and work permission systems 63 Weak
F Rule of law and fighting corruption 66 Very weak Very weak
F-1 Anti-Corruption Law 100 Very strong
F-2 Anti-Corruption Agency 56 Very weak
F-3 Rule of law 54 Very weak
F-4 Law enforcement 54 Very weak
The overall result: 46 - very weak
Source: ‘Global Integrity’ is an independent non-profit information provider tracking governance and anti-corruption world-wide


Nature of Inquiries /Investigations 2005 2006 2007
1- Number of Corruption Related Complaints
Received by the Attorney General Office:
(a) Directly from Public
(b) From Line Ministries
(c) From COCA
(d) From Ministry of Interior
(e) From SNACC
(f) From Others
Total
13
739
81
329
-
129
1281
12
742
50
445
-
167
1416
8
1454
68
121
-
107
1758
2. Number of Complaints in which investigation was
completed by the Attorney General Office
718 658 784
3. Number of Cases in which investigation is still
ongoing by the Attorney General Office
530 539 837
4. Number of Cases in which corruption allegation
was found untrue after investigation
178 166 200
5. Number of Cases in which Attorney General Office
has prosecuted the matter in court
540 415 515
6. Number of Cases in which conviction was ordered
by court and concerned government official was
sentenced.
156 176 186
Source: Attorney General Office

Figure (5.3): Cases of corruption discovered by COCA distributed
by ministries 2005, 2006, 2007
11
20
10
4
1
13
5
3
12
3
0 0 0
2
9
3
12
01
3
10 0 0
3
12
1
67
6
12
4
1
8
32 2
5
1
3
8
4
0
7
1 1 1 1 10 0 0 0 0 0
6
8
11
2
12
43
45
11
4
2
4
0
2
9
7
1 1 10 0 0
3
1 10 0 0
0
5
10
15
20
25
Pu
blic W
ork
s
Ed
uca
tio
n
He
alth
an
d
Civ
il S
erv
ice
s
Ele
ctr
icity
Ala
wka
if
So
cia
l A
ffa
ire
s
Wa
ter
Ag
ricu
ltu
re
Hig
he
r
Tra
de
an
d
So
cia
l W
elfa
re
Pu
blic r
ea
l
Fo
reig
n
Po
lice
Fin
an
ce
Lo
ca
l
Tra
nsp
ort
atio
n
Co
mm
un
ica
ton
Civ
il A
via
tio
n
Info
rma
tio
n
Oil
MP
IC
Public
Public
Fis
hin
g
Yo
uth
& S
po
rt
Le
ga
l A
ffa
irs
Vo
ca
tio
na
l a
nd
Cu
ltu
re
2005 2006 2007

Figure (5.6): Cases of corruption discovered by COCA in 2007 by
Ministry
Electricity; 12; 12%
Alawkaif; 4; 4%
Social Affaires; 3; 3%
Higher Education; 11;
11%
Trade and Industry; 4;
4%
Social Welfare; 2; 2%
Public real estate; 4; 4%
Police; 2; 2%
Finance; 9; 9%
Local Administration; 7;
7%
Transportation; 1; 1%
Communicaton; 1; 1%
Civil Aviation; 1; 1%
PADDR; 3; 3%
Public Works; 6; 6%
Education; 8; 8%
Health and Population;
11; 11%
Youth & Sport; 1; 1%
Fishing; 1; 1%
Agriculture Irrigation; 5;
5% Water; 4; 4%
Civil Services; 2; 2%
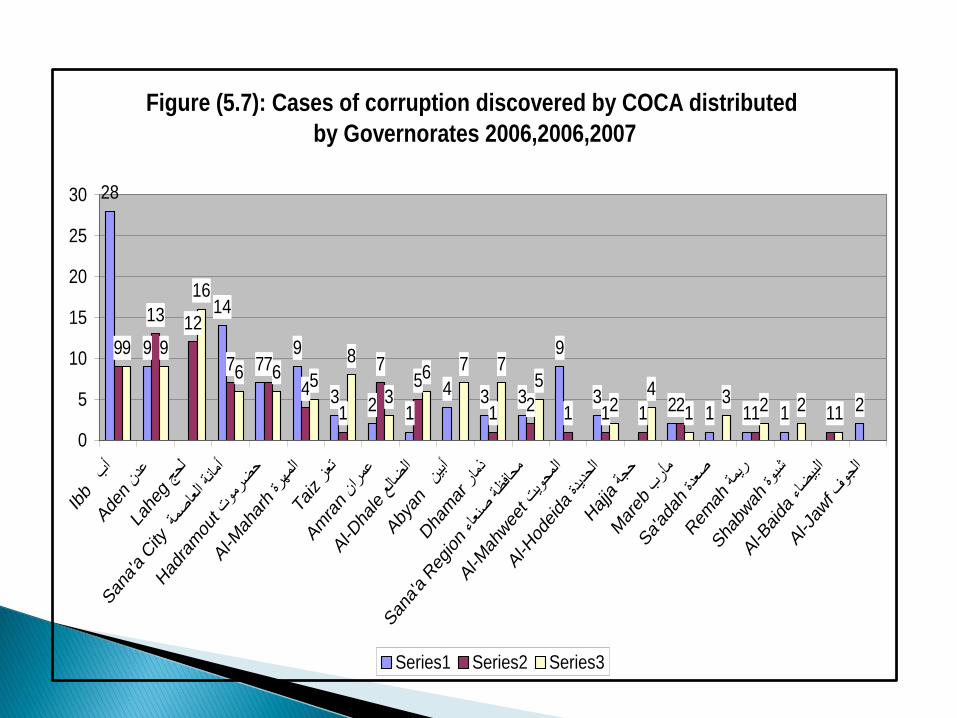
Figure (5.7): Cases of corruption discovered by COCA distributed
by Governorates 2006,2006,2007
28
9
14
79
3 2 1
4 3 3
9
3 2 1 1 1 2
9
13 12
7 7
4
1
75
1 2 1 1 1 2 1 1
9 9
16
6 6 5
8
3
6 7 75
24
13 2 2 1
0
5
10
15
20
25
30
Ibb ب
أ
Ade
n دنع
Lahe
g حج
ل
San
a'a City
ة صم
عا النةماأ
Had
ramou
t تموضر
ح
Al-M
ahar
h رةمهال
Taizز تع
Amra
n انمر
ع
Al-D
haleع ضال
ال
Aby
an ينأب
Dha
mar
ر ذما
San
a'a Reg
ion اءنعصة فظحام
Al-M
ahwee
t تويمح
ال
Al-H
odeida
دة حدي
ال
Hajjaة حج
Mar
ebب
أرم
Sa'ad
ahدة
صع
Rem
ahة يمر
Sha
bwah
وة شب
Al-B
aida
ء ضا
لبيا
Al-J
awf ف
جوال
Series1 Series2 Series3

Figure (5.10): Cases of corruption discovered by COCA distributed
by Governorates 2007.
Al-Baida ; 1; 1%
Taiz ; 8; 8%
Hajja ; 4; 4%
Al-Hodeida; 2; 2%
Hadramout ; 6; 6%
Dhamar ; 7; 7%
Laheg ; 16; 16%
Mareb ; 1; 1%
Al-Maharh ; 5; 5%
Amran ; 3; 3%
Al-Dhale ; 6; 6%
Remah ; 2; 2%
Sana'a City ; 6; 6%
Abyan ; 7; 7%
Ibb ; 9; 9%
Shabwah ; 2; 2%Sa'adah ; 3; 3%
Sana'a Region ; 5; 5%
Aden; 9; 9%

International Indicators are based on perceptions of private sector, and opinions of international experts. However, they do not factor the opinion of citizens of the country.
Corruption Crime Survey gives a good idea about the ministry and sector-wise spread of ‘registered’ corruption crimes. However, all corruption crimes are not registered.
Thus, a need was felt to assess the ‘perceptions’ and ‘experience’ of citizens regarding corruption and service delivery.

To diagnose the form, manifestation and magnitude of corruption and poor service delivery in Yemen that would contribute towards the formulation of the National Anticorruption Strategy.
To develop a baseline and benchmarks against which the performance achieved in the fight against corruption and improving service delivery in future can be measured.

Over to Edouard for sharing the Results of Survey!