presentation: benefits and costs of bank capital - piie · benefits and costs of bank capital...
TRANSCRIPT

Benefits and Costs of Bank Capital
Giovanni Dell’Ariccia
International Monetary Fundwith Jihad Dagher, Luc Laeven, Lev Ratnovski, and Hui Tong
http://www.imf.org/external/pubs/ft/sdn/2016/sdn1604.pdf
The views in this presentation are those of the authors and do not necessarily represent those of the IMF, its Management, or Executive Board

How much bank capital is enough?
How much bank capital would have been enough to…
absorb bank losses
prevent bank recapitalizations
…in past banking crises?

How much bank capital is enough?
1. Capital 15-23 % RWA avoids creditor losses / bank recaps in a majority of past banking crises in AE Further increases have only marginal benefits
CARs could be lower due to buffers, other regulations
2. Losses in crises in EM >> in AE as a share of bank assets, not as a share of GDP 15-23 RWA limits bank losses to 3 percent of GDP
3. Costs of transitioning >> long-term costs of higher capital Impose gradually
Encourage to raise equity rather than reduce assets

Assessing benefits of bank capital

Approach 1: NPLs in Banking Crises
0
10
20
30
40
50
60
70
80
90
Non-OECD Countries OECD Countries
NPL ratio, percent
Source: Laeven and Valencia, 2013 (IMF-ER)

NPL in OECD
0
10
20
30
40
50
60
70
Luxe
mb
ou
rg, 2
008
Swit
zerl
and
, 200
8
Swe
de
n, 2
008
Ne
the
rlan
ds,
200
8
Ge
rma
ny,
20
08
Au
stri
a, 2
008
UK
, 200
7
U.S
., 1
988
Be
lgiu
m, 2
008
Fran
ce, 2
008
U.S
., 2
007
Spai
n, 1
977
De
nm
ark
, 20
08
Spai
n, 2
008
Po
rtu
gal,
2008
Fin
lan
d, 1
991
Swe
de
n, 1
991
Slo
ven
ia, 2
00
8
No
rway
, 199
1
Hu
nga
ry, 2
008
Cze
ch R
ep
., 1
996
Ital
y, 2
008
Ire
lan
d, 2
008
Gre
ece
, 200
8
Jap
an
, 19
97
Ko
rea
, 19
97
Ice
lan
d, 2
008
NPL ratio, percent

Simulations subject to uncertainty
Loss given default (from 25% to 75%)
Conversion to RWA (ratio up to 250%)
Margin of safety (1% to 3%)
Parameters Values
(in percent)
Values
(in percent)
Values
(in percent)
1. NPL during a banking crisis 18.0 18.0 18.0
2. Loss given default 75.0 50.0 50.0
3. Loan losses (1*2) (Mean point) 13.5 9.0 9.0
4. Absorbed by prior provisionning 1.5 1.5 1.5
5. Loan losses net of provisions (3-4) 12.0 7.5 7.5
6. Margin of Safety (Residual capital) 1.0 1.0 3.0
7. Capital to assets ratio (5+6) 13.0 8.5 10.5
8. Total assets/RWA 175.0 250.0 175.0
9. Capital ratio (percent of RWA) (7*8) 22.8 21.3 18.4

Share of banking crises avoided,
based on crisis NPL data, OECD
0
0.1
0.2
0.3
0.4
0.5
0.6
0.7
0.8
0.9
1
0 10 20 30 40 50 60
Loss given default = 50% Loss given default = 75%
Risk-Weighted Bank Capital Ratio, percent
Share of banking crises avoided

Other sources of uncertainty Security portfolios
Security losses comparable to loan losses (US data)
GFC: securities 5.2% vs loans 4.95%
“severely adverse” stress test: securities 3.6% vs loans 4.5%
Bank heterogeneity discuss later
EMs: Losses larger as share of bank assets, not as share GDP
0
10
20
30
40
50
60
70
Non-OECD Countries OECD Countries
Percent

Approach 2:
Fiscal costs of bank recaps
Figure 6. Pre-crisis Bank Capital and Fiscal Recapitalization Expenses in Banking
Crises in 2007-
0
10
20
30
40
50
60
70
Fiscal cost of bank recapitalizations, 2007-
Average bank capital ratio, 2007
Non-OECD countries
Share of risk-weighted assets, percent
OECD countries
Source: Laeven and Valencia, 2013 (IMF-ER)
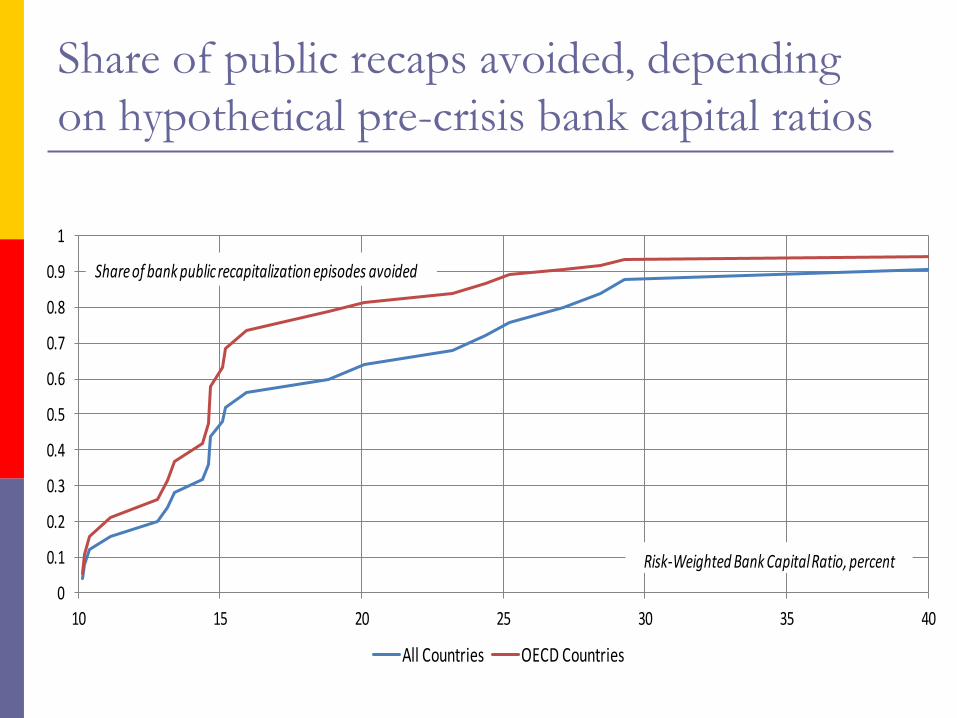
Share of public recaps avoided, depending
on hypothetical pre-crisis bank capital ratios
0
0.1
0.2
0.3
0.4
0.5
0.6
0.7
0.8
0.9
1
10 15 20 25 30 35 40
All Countries OECD Countries
Share of bank public recapitalization episodes avoided
Risk-Weighted Bank Capital Ratio, percent

Capital injections: Bank heterogeneity

Assessing costs of bank capital
Much uncertainty on the cost side
Estimates of steady-state costs (mostly calibrations): extremely small
Estimates of transition costs (relatively well identified, but idiosyncratic): very large
Transition costs >> Steady-state costs
Therefore
Gradually, but market may demand adjustment upfront
Good economic times

Where does this take us?
Much uncertainty on costs
Evidence from the crisis suggests minimal effect of higher capital on credit
Notes: Averages for banks - U.S. and European G-SIBs (U.S.: (Bank of America, Citigroup, JPMorgan Chase, Wells Fargo; Europe: Barclays, HSBC, Royal Bank of Scotland, BNP Paribas, Credit Agricole, Societe Generale, Deutsche Bank, and Credit Suisse). Domestic bank credit/GDP for Europe is weighted average for France, Germany, UK.
0
2
4
6
8
10
12
14
Tier 1 capital ratio Intermediation margin Domestic bank credit/ GDP (right axis)
2004 2014
0
2
4
6
8
10
12
14
Tier 1 capital ratio Intermediation margin Domestic bank credit/ GDP (right axis)
2004 2014
Europe U.S.
0
20
40
60
80
100
120
140
0
20
40
60
80
100
120
140

Summary
1. Capital 15-23 % RWA avoids creditor losses / bank recaps in a majority of past banking crises in AE
2. Costs of transitioning >> long-term costs of higher capital
3. Losses in crises in EM >> in AE as a share of bank assets, not as a share of GDP