presentaon*on*hydraulic*fracturing* and*water*use*
TRANSCRIPT

Presenta(on on Hydraulic Fracturing and Water Use
Mee(ng of the Water and Natural Resources Commi=ee
August 29, 2013
Bruce Baizel Director,
Energy Program and Oil & Gas Accountability Project Earthworks
bruce@earthworksac(on.org 970.259.3353

Who we are: EARTHWORKS is a nonprofit organization dedicated to protecting communities and the environment from the impacts of irresponsible mineral and energy development while seeking sustainable solutions.
EARTHWORKS Oil & Gas Accountability Project - OGAP

Why there is a lack of trust about hydraulic fracturing
• Claim 1: Hydraulic Fracturing is not injec(on. -‐ Rejected by 11th Circuit Court of Appeals in the LEAF decision
• Claim 2: Hydraulic Fracturing has no risk. -‐ 2004 EPA report undertook no scien(fic study -‐ 2014 EPA study will remedy that deficiency
• Claim 3: Hydraulic Fracturing is carried out safely. -‐ 2007 New Mexico sampling showed presence of toxics -‐ Use of diesel in viola(on of the 2003 MOU with EPA -‐ All scien(fic studies have shown impacts from drilling and HF
• Claim 4: Hydraulic Fracturing has been done this way for 50 years. -‐ Horizontal drilling and fracturing technology have changed

The complex and increasingly toxic nature of drilling
“Although pit fluids are not groundwater, 17 cons(tuents were present in the OCD pit fluid samples at concentra(ons that exceed the WQCC Ground Water 3103 Standards.” – from NMOCD tes(mony during the 2007 pit rule hearing
New Mexico OCD'S 2007 PIT SAMPLING PROGRAM – cons<tuents that exceeded the WQCC Ground Water Standards
• Naphthalene • Sulfate • Benzo(a)pyrene • pH • Phenol • Total Dissolved Solids • Benzene • Total Arsenic • Toluene • Total Barium • m,p-‐Xylene • Total Cadmium • Chloride • Total Mercury • Fluoride • Total Lead • Total Chromium

Use of diesel in fracking
• Between 2005 and 2009, oil and gas service companies injected 32.2 million gallons of diesel fuel or hydraulic fracturing fluids containing diesel fuel in wells in 19 states.
• None of the oil and gas service companies could provide data on whether they performed hydraulic fracturing in or near underground sources of drinking water, sta(ng that the well operators, not the service companies, track that informa(on.

The Rat Race: drilling more just to keep up

Shale Oil Produc(on – Short-‐lived Wells

Water Quan(ty Issues
• Accurate assessments of the water quanTty needed are lacking. – Few reliable es(mates statewide or by river basin as to the amount of water needed to drill and fracture the permi=ed or es(mated numbers of wells
– Uncertainty due to: • Absence of coordinated state evalua(on of water needs for shale produc(on;
• Variability in the number of wells that will actually be drilled; • Varia(on in the ability to use recycled fluid instead of fresh water; • Uncertain legal availability of water for this use; and • Geological varia(on by forma(on and water basin
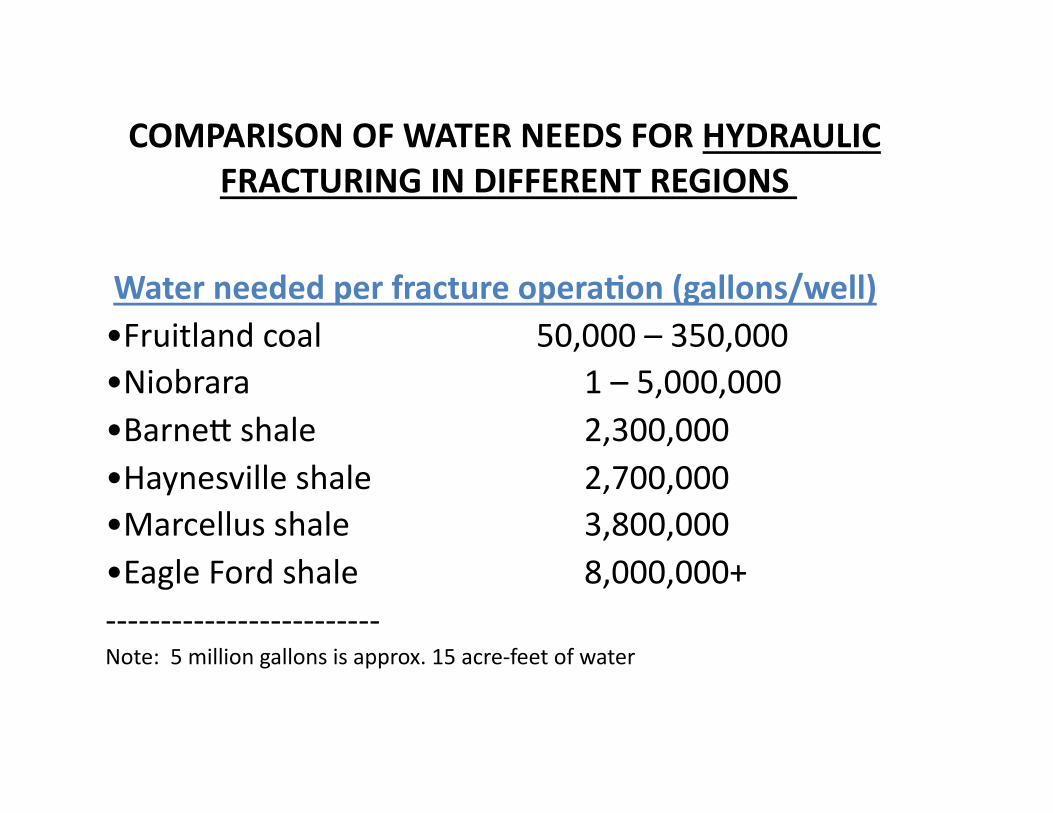
COMPARISON OF WATER NEEDS FOR HYDRAULIC FRACTURING IN DIFFERENT REGIONS
Water needed per fracture operaTon (gallons/well) •Fruitland coal 50,000 – 350,000 •Niobrara 1 – 5,000,000 •Barne= shale 2,300,000 •Haynesville shale 2,700,000 •Marcellus shale 3,800,000 •Eagle Ford shale 8,000,000+ -‐-‐-‐-‐-‐-‐-‐-‐-‐-‐-‐-‐-‐-‐-‐-‐-‐-‐-‐-‐-‐-‐-‐-‐-‐ Note: 5 million gallons is approx. 15 acre-‐feet of water

Marcellus data: source of water used – 2011
Source Type Amount Percent
Ground Water 21.1 million gallons 3
Purchased Water 70.0 million gallons 9
Surface Water 662.2 million gallons 81
Reused Frack Water 60.0 million gallons 7
Total 813.4 million gallons 100

Comparison of HF Disclosure Forms filed with OCD and with FracFocus -‐ 2012
Company OCD (well approved 2012) FracFocus (started in 2012)
Occidental 2 65
Apache Corp 61 151
BP America 8 6
Chesapeake 17 21
The differences between the OCD filings and the filings with FracFocus illustrate the issue of the lack of quality control and uncertainty about the accuracy of what is being filed. And this is only a sample comparison; we did not look at every filing or company.

2012 – New wells in New Mexico: water use voluntarily reported via FracFocus
County
Volume of water (gal.)
Acre-‐feet Number of wells
Average water per well (gal.)
River Basin
Eddy 317,839,615 975 313 1,015,462 Pecos
Lea 201,993,006 620 157 1,286,580 Pecos; Texas Gulf
Rio Arriba 14,108,687 43 83 169,984 Upper Colorado; Rio Grande
San Juan 17,179,215 53 93 184,723 Upper Colorado
All wells/All coun(es
558,257,402 1,713 673 829,506

2012 – loca(ons of new wells in New Mexico


Sources of Water Contamina(on
Transport to Site Well casing
failure/migra(on through fractures
On-‐site spills and leaks
Transport from Site Disposal of waste

Following the fractures
• The Garza case noted that fractures were more art than science, and talked of a 3000 foot out of zone fracture in the trespass context. h=p://www.supreme.courts.state.tx.us/historical/2008/aug/050466.htm
• The Handren study (2011): • Over the course of performing the s(mula(ons in the well communica(on was achieved to wells spread over more than 600 acres. The farthest well that was “hit” by water from one of the s(mula(ons was 1,500’ away. A total of six wells were affected by water from the study well’s s(mula(ons.
• As well density increases the complexity of subsequent fracture s(mula(on interac(on with adjacent wells increases.

New Mexico Groundwater Contamina(on Events by Facility Type -‐ through mid-‐2005
Brine Well Class V Well Pipelines Pits Tank Babery Unknown
7 5 266 398 50 17
Note that all types of facilities are included here. We know of no follow-up analysis done since this review by OCD.

New Mexico data on water contamina(on

Spills and ‘Incidents’
• State data from 1990 through 2008 in Colorado and New Mexico indicated that: – 6% of natural gas wells have spills, and; – there is an average rate of 1.2 to 1.8 incidents per 100 gas wells that impact groundwater.
• State data in West Virginia showed a 1.5 per 100 well incident rate.
• As a consequence of this pa=ern of contamina(on, ten states either require or are considering requiring pre-‐drilling baseline water tes(ng.

State Baseline Water Tes(ng Policies
State Required tesTng before drilling and acer
At least 4 water samples required to test
Distance limitaTons on what types of wells tested
Include sampling protocol
Includes most possible types of contamina-‐Tons
Wyoming X X X X X
Colorado X X X X X
Idaho X X X
Ohio X X
W. Virginia X X
Illinois X X X X X