presentación resultados analistas 2012 inglés def sv …...2.4 2.4 2.3 2.2 2.1 1.2 2010 2011 2012...
TRANSCRIPT

1
Ángel Cano, BBVA’s President & Chief Operating Officer
Madrid, February 1st 2013
2012 Results

2
2012 Results / February 1st, 2013
DisclaimerThis document is only provided for information purposes and does not constitute, nor must it be interpreted as, an offer to sell or exchange or
acquire, or an invitation for offers to buy securities issued by any of the aforementioned companies. Any decision to buy or invest in securities in
relation to a specific issue must be made solely and exclusively on the basis of the information set out in the pertinent prospectus filed by the
company in relation to such specific issue. Nobody who becomes aware of the information contained in this report must regard it as definitive,
because it is subject to changes and modifications.
This document contains or may contain forward looking statements (in the usual meaning and within the meaning of the US Private Securities
Litigation Act of 1995) regarding intentions, expectations or projections of BBVA or of its management on the date thereof, that refer to
miscellaneous aspects, including projections about the future earnings of the business. The statements contained herein are based on our current
projections, although the said earnings may be substantially modified in the future by certain risks, uncertainty and others factors relevant that
may cause the results or final decisions to differ from such intentions, projections or estimates. These factors include, without limitation, (1) the
market situation, macroeconomic factors, regulatory, political or government guidelines, (2) domestic and international stock market movements,
exchange rates and interest rates, (3) competitive pressures, (4) technological changes, (5) alterations in the financial situation, creditworthiness or
solvency of our customers, debtors or counterparts. These factors could condition and result in actual events differing from the information and
intentions stated, projected or forecast in this document and other past or future documents. BBVA does not undertake to publicly revise the
contents of this or any other document, either if the events are not exactly as described herein, or if such events lead to changes in the stated
strategies and estimates.
This document may contain summarised information or information that has not been audited, and its recipients are invited to consult the
documentation and public information filed by BBVA with stock market supervisory bodies, in particular, the prospectuses and periodical
information filed with the Spanish Securities Exchange Commission (CNMV) and the Annual Report on form 20-F and information on form 6-K that
are disclosed to the US Securities and Exchange Commission.
Distribution of this document in other jurisdictions may be prohibited, and recipients into whose possession this document comes shall be solely
responsible for informing themselves about, and observing any such restrictions. By accepting this document you agree to be bound by the
foregoing Restrictions.

3
2012 Results / February 1st, 2013
Risks under controlRevenue generated to absorb provisioning
Continuous improvement in funding structure
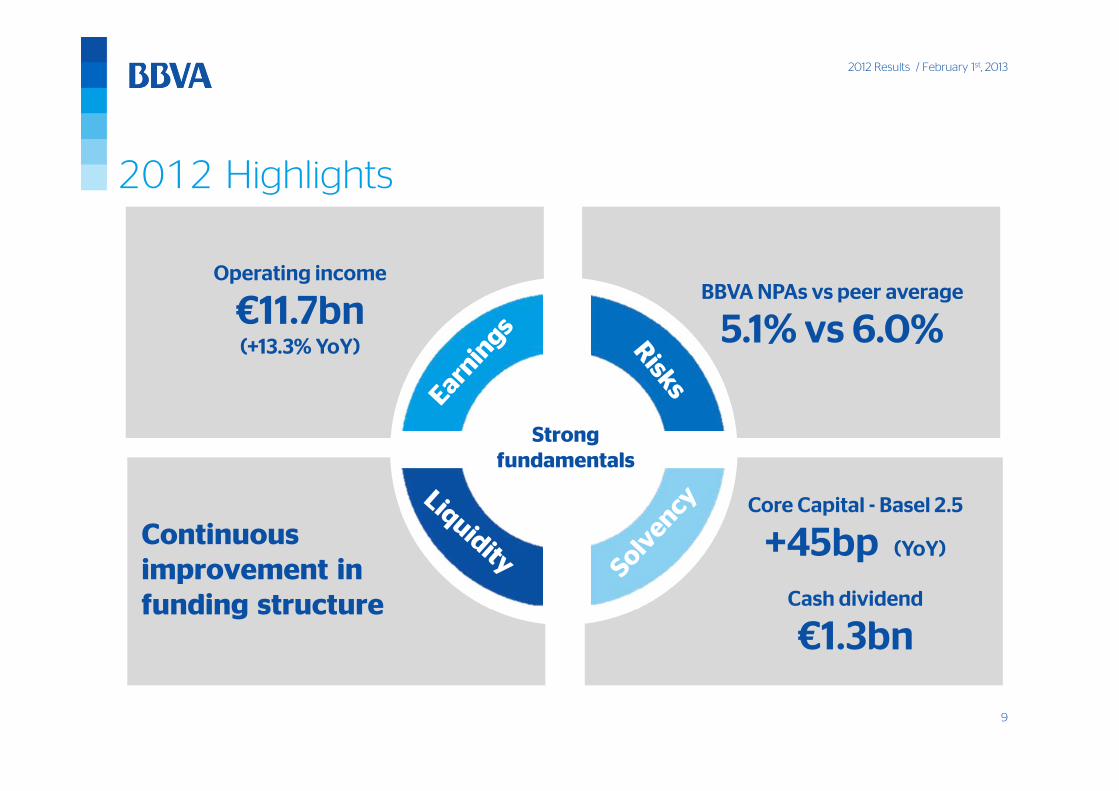
2012 Highlights
Core capital ratios improved
and dividend maintained
Strong fundamentals

4
2012 Results / February 1st, 2013
Risks under control
Continuous improvement in funding structure
2012 Highlights
Core capital ratios improved
and dividend maintained
Operating income
€11.7bn (+13.3% YoY)
Strong fundamentals

5
2012 Results / February 1st, 2013
Risks under control
Continuous improvement in funding structure
2012 Highlights
Core capital ratios improved
and dividend maintained
Strong fundamentals
Operating income
€11.7bn (+13.3% YoY)

6
2012 Results / February 1st, 2013
Continuous improvement in funding structure
2012 Highlights
Core capital ratios improved
and dividend maintained
BBVA NPAs vs peer average
5.1% vs 6.0%
Strong fundamentals
Operating income
€11.7bn (+13.3% YoY)
Note: peer group: includes BARCL, BNPP, CASA, CMZ, CS, DB, HSBC, ISP, LBG, RBS, SAN, SG, UBS, UCIPeer group data last available date

7
2012 Results / February 1st, 2013
Continuous improvement in funding structure
2012 Highlights
Core capital ratios improved
and dividend maintained
BBVA NPAs vs peer average
5.1% vs 6.0%
Strong fundamentals
Operating income
€11.7bn (+13.3% YoY)

8
2012 Results / February 1st, 2013
Continuous improvement in funding structure
2012 Highlights
BBVA NPAs vs peer average
5.1% vs 6.0%
Strong fundamentals
Cash dividend
€1.3bn
Core Capital - Basel 2.5
+45bp (YoY)
Operating income
€11.7bn (+13.3% YoY)
9
2012 Results / February 1st, 2013
Continuous improvement in funding structure
2012 Highlights
Strong fundamentals
BBVA NPAs vs peer average
5.1% vs 6.0%
Cash dividend
€1.3bn
Core Capital - Basel 2.5
+45bp (YoY)
Operating income
€11.7bn (+13.3% YoY)

10
2012 Results / February 1st, 2013
2012 Highlights
Strong fundamentals
BBVA NPAs vs peer average
5.1% vs 6.0%
Liquidity gap narrows
€23bn (euro balance sheet)
Cash dividend
€1.3bn
Core Capital - Basel 2.5
+45bp (YoY)
Operating income
€11.7bn (+13.3% YoY)

11
2012 Results / February 1st, 2013
2012 Highlights
Strong fundamentals
BBVA NPAs vs peer average
5.1% vs 6.0%
Cash dividend
€1.3bn
Core Capital - Basel 2.5
+45bp (YoY)Liquidity gap narrows
€23bn (euro balance sheet)
Implementing our strategy
Operating income
€11.7bn (+13.3% YoY)

12
2012 Results / February 1st, 2013
13,152
15,122
2011 2012
3,4823,594
3,7413,877 3,910
4Q11 1Q12 2Q12 3Q12 4Q12
Net interest income Quarter by quarter€m
+15.0 %
Net interest income €m
+12.3 %
Earnings: highly positive trend of net interest income during the year . . .
Balanced growth in all regions

13
2012 Results / February 1st, 2013
17,984
20,284
2,043 2,157
2011 2012
4,7344,899 5,034 5,157 5,195
633367
772355
663
4Q11 1Q12 2Q12 3Q12 4Q12
. . . reflected in gross income . . .
5,368 5,265 5,806 5,512 5,858Gross income
NTI + div.
Net fee income: +8.0% YoY
Recurring gross incomeQuarter by quarter€m
+9.7% +12.8 %
Gross income: +12.1%(YoY)
Recurring gross income€m

14
2012 Results / February 1st, 2013
Gross incomeBBVA vs peer group; 9M12(YoY, %)
. . . and sets us apart . . .GrowthGrowth ProfitabilityProfitability
-33.4-27.1
-17.3-16.4-16.4-16.3-13.7
-8.5-8.4-8.1-3.1
2.03.76.9
13.6
Peer 14Peer 13Peer 12Peer 11Peer 10Peer 9Peer 8Peer 7Peer 6Peer 5Peer 4Peer 3Peer 2Peer 1BBVA
1.01.31.51.51.6
1.91.92.02.0
2.42.52.72.8
3.53.7
Peer 14Peer 13Peer 12Peer 11Peer 10Peer 9Peer 8Peer 7Peer 6Peer 5Peer 4Peer 3Peer 2Peer 1BBVA
Gross income / ATAsBBVA vs peer group; 9M12(%)
Note: peer group: includes BARCL, BNPP, CASA, CMZ, CS, DB, HSBC, ISP, LBG, RBS, SAN, SG, UBS, UCI
Superior profitable growth

15
2012 Results / February 1st, 2013
30%
3%
11%25%
24%
4% 3%
. . . thanks to adequate diversification across emerging and developed markets . . .
Spain
Rest of Europe
Mexico
South America
TurkeyAsia
USA
Note: excludes corporate activities. YoY variation in constant €
DevelopedDeveloped
44%Chg in year
Weight
+2.8%
EmergingEmerging
56%Chg in year
Weight
+14.4%
Presence in under-banked countries with high growth potential
Gross income breakdown 12M12(%)

16
2012 Results / February 1st, 2013
12.110.8
4.9
2.8
3.0
5.1
-0.1
Gross income Total costs Change inperimeter
FX effect Emerging Developed Inflation
. . . combined with suitable cost management tailored for the needs of each region . . .
Costs are growing slower than gross income
Gross income vs costs Year-on-year change(%) DevelopedDevelopedEmergingEmerging
DevelopedDeveloped
Considerable investment in
expansion plans
Costs contained

17
2012 Results / February 1st, 2013
. . . means we remain one of the top banks in efficiency with high recurring operating income . . .
Cost / IncomeBBVA vs peer group; 9M12(%)
Operating income 10,290 11,655
Recurring operating incomeQuarter by quarter€m
92.689.8
84.879.777.5
69.668.067.866.765.762.159.358.4
49.747.845.4
Peer 14Peer 13Peer 12Peer 11Peer 10Peer 9Peer 8
AveragePeer 7Peer 6Peer 5Peer 4Peer 3Peer 2BBVA
Peer 1
Note: Peer Group: includes BARCL, BNPP, CASA, CMZ, CS, DB, HSBC, ISP, LBG, RBS, SAN, SG, UBS, UCI
+15.2 %
NTI + div.
8,247
9,498
2,043 2,157
2011 2012

18
2012 Results / February 1st, 2013
. . . that can support the year’s provisioning effort without difficulty
2.4 2.4 2.3
2.2 2.1
1.2
2010 2011 2012
Operating income / loan-loss and real-estate provisioning(times)
Including real-estate-related impacts
Loan-loss and real-estate provisioning€m
4,766 4,2425,081
380 700
4,437
5,146 4,942
9,518
2010 2011 2012
Real-estate-related impacts
Provisioning for impairment of the real-estate portfolio meets regulatory requirements

19
2012 Results / February 1st, 2013
R
-9.5
BBVA GroupAccum.
Change
12M12 / 12M11
12M12 Abs. %
Net interest income M 15,122 + 1,970 15.0
22,441 + 2,414 12.1Gross income N
Provisions related to real estate -4,437 - 3,737 n.a.
Operating incomeM A
11,655 + 1,365
TE 1,659 - 1,787 -51.9
Rest of provisions
13.3
-5,559 + 585
Income before tax
Net attributable profit 1,676 - 1,328 -44.2
In summary: a solid income statement€m
Note: pension business included in earnings on discontinued operations

20
2012 Results / February 1st, 2013
61 6066
6972
4.0 4.0 4.0 4.8 5.1
Dec.11 Mar.12 Jun.12 Sep. 12 Dec. 12
NPA ratio
Risk: risk management
NPAs€bn
NPA & coverage ratios(%)
15.9 16.1 16.520.1 20.6
Dec.11 Mar.12 Jun.12 Sep.12 Dec.12
€3.1bn for Unnim with 71% coverage
Coverage ratio
Cost of Risk
(YTD)1.2% 1.2% 1.8% 1.9% 2.2%
In line with expectations

21
2012 Results / February 1st, 2013
Capital: solid position and the ability to generate more
Core capital ratio (Basel 2.5)(%) Generation of capital
Compliance with capital requirements
Without selling strategic assets
Absorption of real-estate-related losses and Unnim’s incorporation
in Spain
All without reducing dividends
10.310.8
Dec. 11 Dec.12
+45 bp

22
2012 Results / February 1st, 2013
Liquidity: excellent balance sheet management in a complex environment
Active in issues in 2012: €14bn1
2 Liquidity gap narrows: €23bn euro balance sheet for year
3 2013 issues: €3bn
LTRO reduced by 2/3 of first auction
Note: total 2012 issues do not include €1.0bn issued by Garanti

23
2012 Results / February 1st, 2013
56% Emerging econ.
Amounting to solid fundamentals . . .
Recurring gross income
Recurring gross income
Strong earnings Solid structure
Diversified revenues
Diversified revenues
Recurring operating income
Recurring operating income
ProvisioningProvisioning
+12.8%YoY
+15.2%YoY
€10bn
CapitalCapital
5.1% 72%
LiquidityLiquidity
Total issues: €14bn€ liquidity gap narrows: €23bn
RiskRisk
>9%EBA ratio
NPA ratio Coverage ratio
10.8%Basel 2.5
Dividend policy maintained
~~

24
Business areas
25
2012 Results / February 1st, 2013
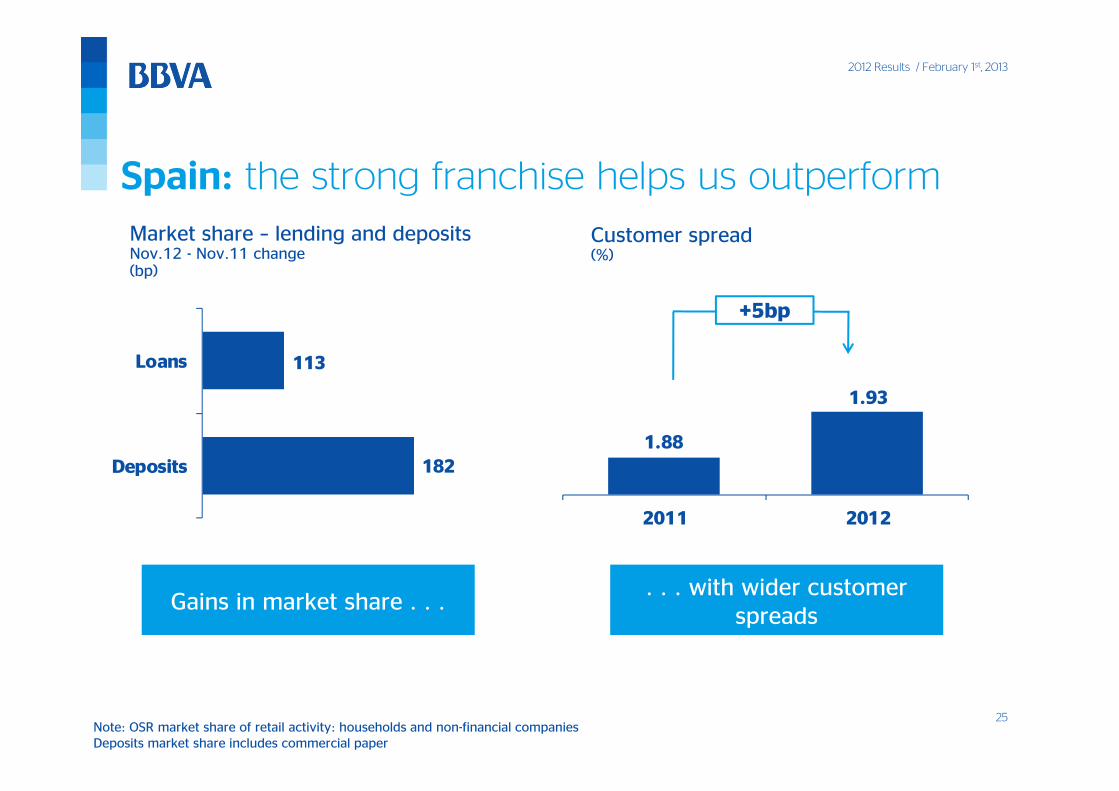
Note: OSR market share of retail activity: households and non-financial companiesDeposits market share includes commercial paper
Spain: the strong franchise helps us outperform Customer spread(%)
Market share – lending and depositsNov.12 - Nov.11 change(bp)
Gains in market share . . .. . . with wider customer
spreads
182
113
Deposits
Loans
1.88
1.93
2011 2012
+5bp
26
2012 Results / February 1st, 2013
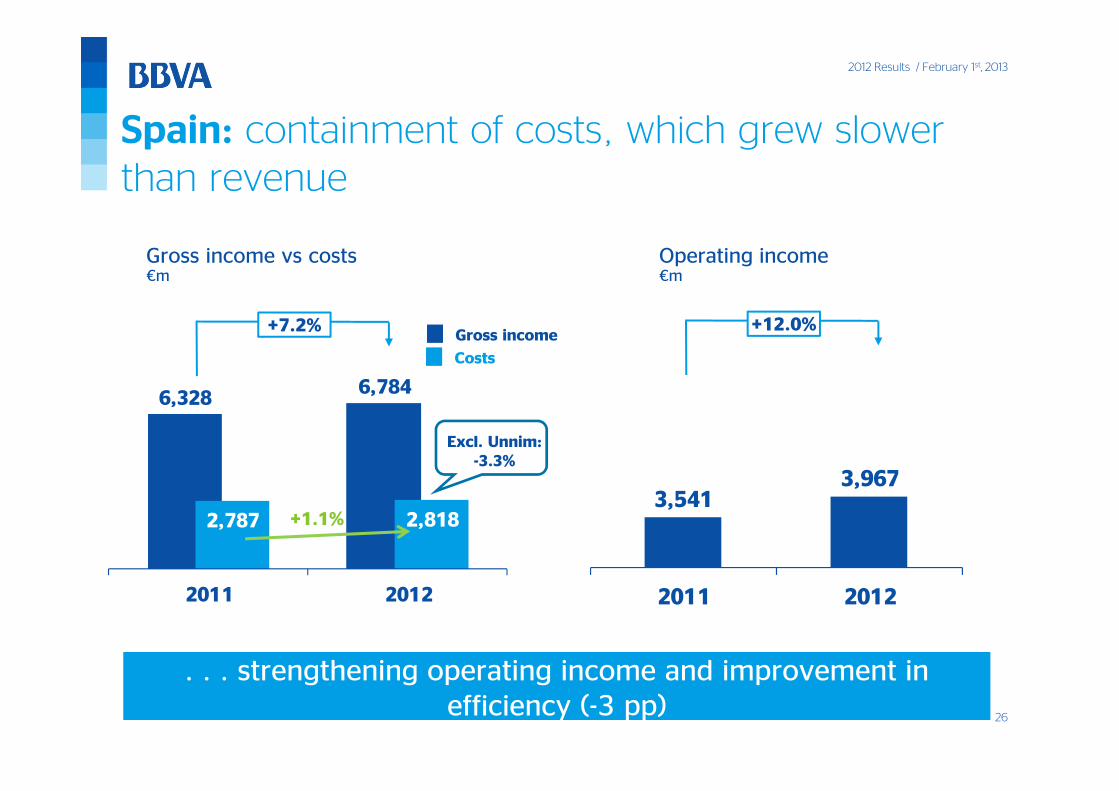
6,328 6,784
2,787 2,818
2011 2012
3,5413,967
2011 2012
Spain: containment of costs, which grew slowerthan revenue
Gross income vs costs€m
Operating income €m
. . . strengthening operating income and improvement in efficiency (-3 pp)
+12.0%
+1.1%
Excl. Unnim: -3.3%
+7.2%
Costs
Gross income

27
2012 Results / February 1st, 2013
44 4350
5967
4.8 4.9 5.1
6.5 6.9
Dec.11 Mar.12 Jun.12 Sep. 12 Dec.12
Spain: NPAs are developing in line with expectations
NPA & coverage ratios(%)
Coverage ratio
NPA ratio
… although better than the system average (difference of -403bp)
4.8
6.9
0.60.7
0.8
Dec.11 Activity NPAs Change inperimeter
Dec.12
NPA ratioBreakdown
(%)
Note: market share vs OSR system as of november 2012

28
2012 Results / February 1st, 2013
SpainAccum.
Change
12M12 / 12M11
12M12 Abs. %
Net interest income 4,836 + 445 10.1
Gross income N 6,784 + 457 7.2
Operating incomeM A
3,967 + 426 12.0
Income before tax ex provisions related to real estateR E
1,699 - 382 -18.4
Net attributable profit ex provisions related to real estateR E
1,211 - 269 -18.2
Net attributable profitR E
-1,267 - 2,619 n.s.
Spain: income statement
€m

29
2012 Results / February 1st, 2013
1,060
1,9612,210
2010 2011 2012
EurAsia: an area of growth and positive contribution
Eurasia’s contribution to Group’s gross income
42% Turkey
Asia
Other Europe
Growing contribution
Buoyant retail business
Deleveraging of wholesale business
Highlights
30%
28%
42%
30%
30%
34%
36%
40%
60%
Turkey as the growth driver of the areaTurkey as the growth driver of the area
+85.0% +12.7%

30
2012 Results / February 1st, 2013
EurAsia 12M12 / 12M11
12M12 Abs. %
ChangeAccum.
Net interest income M 847 + 44 5.5
+ 249 12.7
1,432 + 119 9.0
Gross income
Operating incomeM A
N 2,210
Income before taxR E
1,054
Net attributable profitR E
950 - 81 -7.8
- 122 -10.4
EurAsia: income statement
€m

31
2012 Results / February 1st, 2013
Mexico: leading franchise with solid indicators
Lending +9.7% +8.4% Customer funds
Business activityYoY, average balances
Net interest incomeConstant €m
Operating incomeConstant €m
+7.8% +7.8% +3.6%
Recurring gross incomeConstant €m
Gross income: +5.8%Net fee income: +4.0%
3,8634,164
2011 2012
5,1255,526
2011 2012
3,4633,586
2011 2012

32
2012 Results / February 1st, 2013
3.7 3.8 4.0 4.1 3.8
120 116 111 107114
Dec.11 Mar.12 Jun.12 Sep.12 Dec.12
3.5 3.5 3.4 3.5 3.5
12M11 3M12 6M12 9M12 12M12
Mexico: risk indicators are stable
NPA ratio
Coverage ratio
NPA & coverage ratios(%)
Cost of risk, YTD(%)
33
2012 Results / February 1st, 2013
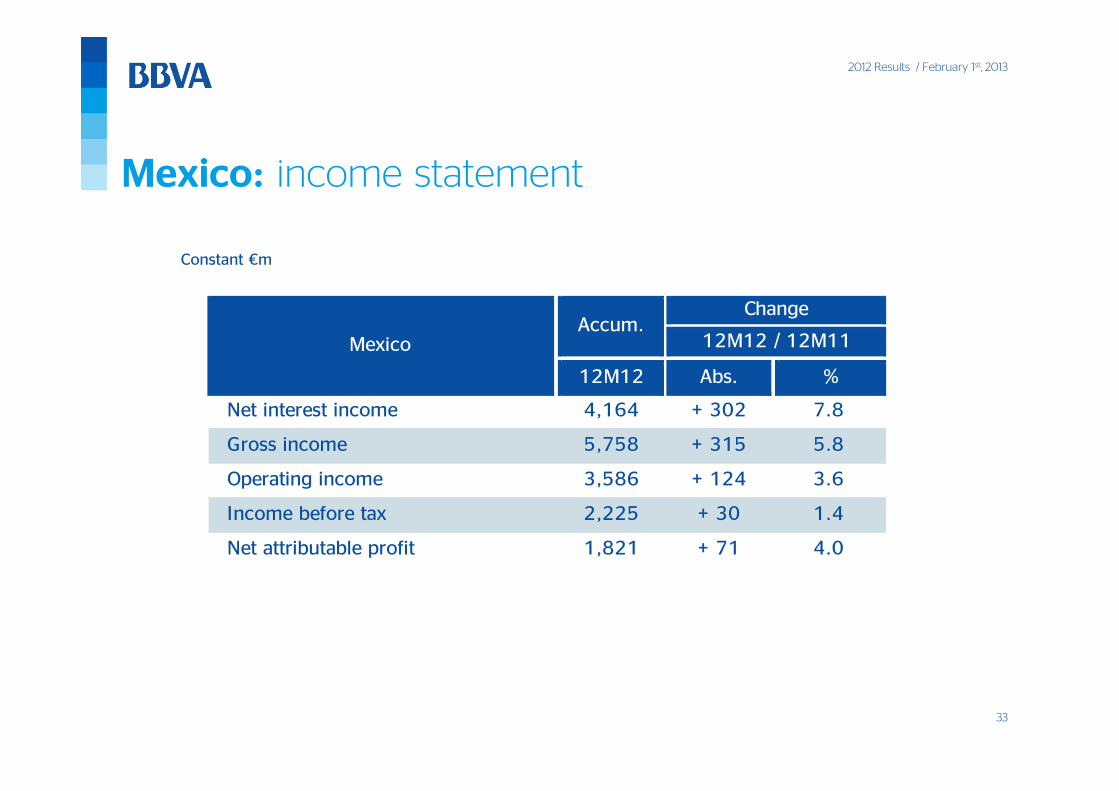
Mexico: income statement
Constant €m
Mexico
Change
12M12 / 12M11
12M12 Abs. %
Accum.
Net interest income M 4,164 + 302 7.8
Gross income N 5,758 + 315
M A
3,586Operating income
1.4
+ 124 3.6
5.8
Income before taxR E
2,225 + 30
+ 71 4.0Net attributable profitR E
1,821

34
2012 Results / February 1st, 2013
4,4115,363
3,4154,291
2011 2012
2,3943,035
2011 2012
South America: buoyant business that is reflected by income
Lending +17.9% +27.0% On-balance-sheet customer funds
Business activityYoY, average balances
NII and gross income Constant €m
+25.6%
+21.6%
Operating incomeConstant €m
+26.8%Net interest income
Gross income

35
2012 Results / February 1st, 2013
45.7 43.4
2011 2012
2.2 2.3 2.3 2.2 2.1
146 141 139 142 146
Dec.11 Mar.12 Jun.12 Sep.12 Dec.12
South America: improvement in efficiency and stable risk indicators
NPA & coverage ratios (%)
Sustainable growth
NPA ratio
Coverage ratio
Cost / incomeConstant €m; (%)
-2.3 pp

36
2012 Results / February 1st, 2013
South America: income statement
Constant €m
South America
Change
12M12 / 12M11
12M12 Abs. %
Accum.
Net interest income M 4,291 + 876 25.6
Gross income N 5,363 + 952
M A
3,035Operating income
23.7
+ 641 26.8
21.6
Income before taxR E
2,240 + 429
+ 257 23.6Net attributable profitR E
1,347

37
2012 Results / February 1st, 2013
1,764 1,682
2011 2012
2,499 2,395
2011 2012
888 812
2011 2012
United States: selective growth of lending and improvement in mix
Lending +10.3% +11.5% Customer funds
Compass business activityYoY, average balances
Net interest income Constant €m
Operating incomeConstant €m
-8.6%
LB: +6.3% LB: 14.1%
-4.7% -4.2%
LB: +6.9%
Gross incomeConstant €m

38
2012 Results / February 1st, 2013
375
92
2011 2012
73 75 82
94 90
3.5 3.2 2.8
2.4 2,4
Dec.11 Mar.12 Jun.12 Sep.12 Dec.12
United States: good asset quality
Loan-loss provisionsConstant €m
-75.4%
NPA & coverage ratios(%)
Coverage ratio
NPA ratio
Cost ofRisk
(YTD)0.9 0.2

39
2012 Results / February 1st, 2013
United States: a business transformation reflected by earnings
Net attributable profitConstant €m
340
475
2011 2012
+39.6%
Note: Dec 2011 excludes goodwill impairment
Selective growth of portfolio
Stable income in low-interest rate environment
Technology projects to improve business
Solid liquidity position
Cost discipline
Highlights

40
2012 Results / February 1st, 2013
United States: income statement
Constant €m
12M12 / 12M11
%
U.S.A.
12M12 Abs.
Accum.Change
Net interest income M 1,682 - 82 -4.7
Gross income N 2,395 - 104 -4.2
M A
812Operating income
n.s.
- 76 -8.6
Income before taxR E
667 + 1,779
+ 1,229 n.s.Net attributable profitR E
475

41
2012 Results / February 1st, 2013
LendingYoY (%)
14
86
2012
CIB: diversified business and a solid customer franchise
Solid customer franchise
Solid customer franchise
Gross income breakdown(%)
Customer franchise
Trading
Selective deleveraging
Selective deleveraging
32%
14%18%
11%
25%
Balanced diversification
Balanced diversification
Gross income by region12M12 (%)
Spain
South America
USA
Mexico Eurasia
Developed
-16.2 %

42
2012 Results / February 1st, 2013
Corporate & Investment BankingAccum.
Change
12M12 / 12M11
12M12 Abs. %
Gross income N 2,767 + 234 9.2
+ 85 5.4
Operating incomeM A
1,878 + 203 12.1
Income before taxR E
1,655
- 1 -0.1 Net attributable profitR E
1,049
CIB: income statement
Constant €m

43
2012 Results / February 1st, 2013
Outlook / priorities 2013
Focus on profitability: new phase of EPS growth
•Maintain dynamism
•Investment to capitalize on growthEmerging
•Decrease in cost of risk
•Main focus on profitabilityDeveloped
•Close sale of Latin-American pension business
•Take advantage of opportunities to strengthen core business
Strategy
44
2012 Results
Ángel Cano, BBVA’s President & Chief Operating Officer
Madrid, February 1st 2013