presentación de powerpoint€¦ · 17 tmluc . cold cuts $ 256 cold cuts 20% biscuits $ 255 20%ice...
TRANSCRIPT

CORPORATE PRESENTATION 2013
REVISED 3Q13

2007 2012 2007 2012
Revenues 12,6% CAGR
EBITDA 8,4% CAGR
KEY HIGHLIGHTS
4th largest food company in Latin
America by market capitalization
Close to 100 year history
Portfolio of 146 brands with more than 17
leading brands in Colombia and neighboring
countries
7 business units: cold cuts, biscuits, chocolates,
coffee, ice cream, pasta and TMLUC
Presence in 16 countries, with manufacturing
plants in 12 of these
Products sold in 70 countries, in 5 continents
37.351 employees (12.726 outside Colombia) (SEPT-2013)
Publicly listed in Colombia, ADR Level I and a
market cap of $6,54 Bn (SEPT-2013)
FINANCIAL HIGHLIGHTS
NUTRESA AT A GLANCE
US millions
$3
80
$2
54
$3
.00
1
$1
.66
0
REVENUE MIX 2012 US millions
$69 2,3%
$3.001
$977 32,6%
Other
$632 21,1%
$531 17,7%
$458 15,3%
$215 7,2%
$118 3,9%
Cold Cuts
Biscuits Chocolates
Coffee
Ice Cream
Pasta

SIGNIFICANT EXPANSION
SINCE 2000
4
Acquisition Merger Spin off
2000 2002 2004 2005
Colombia Colombia Colombia Puerto Rico Costa Rica Colombia Colombia
2006 2007
Colombia Colombia Panama and Nicaragua Peru Colombia Colombia Costa Rica Panama
2008 2009 2010 2011
Colombia Panama Costa Rica Mexico Colombia Colombia USA Dominican Republic
Plants and Brands
from Nestlé
Panama
Industrial Activity
of CNCH and Noel
2012
Costa Rica Malaysia Chile
2013
Creation Company adopts Nutresa name, transitioning
from Grupo Nacional de Chocolates Colombia

GROUP STRUCTURE
5
7
3
12
55
5
4
12
40
5
2
9
46
2
1
1
1
10
3
3
9
6
4
7
7
Plants
Countries with plants
Countries with its own distribution network
Countries where we sell
Pastas
International sales and distribution network
Biscuits Chocolates Coffees Cold Cuts Ice Cream
11
3
3 17
TMLUC

Cold Cuts $ 256 20%
Biscuits $ 255 20%
Chocolates $ 150 12%
Coffees $ 159 12%
Ice Cream $ 24 2%
TMLUC $ 439 34%
Cold Cuts $ 125,15
28%
Biscuits $ 68,38
16% Chocolates $ 81,22
18%
Coffees $ 50,53
11%
Ice Cream $ 34,22
8%
Pastas $ 16,67
4%
TMLUC $ 59,83
14%
Others $ 3,36
1% Cold Cuts
$ 977 28%
Biscuits $ 632 18% Chocolates
$ 531 16%
Coffees $ 458 13%
Ice Cream $ 215
6%
Pastas $ 118
4%
TMLUC $ 438,57
13%
Others $ 69 2%
6
Sales by business unit 2012
International sales by business unit 2012
EBITDA by business unit 2012
$3.439 $440 $1.283 $3.001* $380* $844*
*Grupo Nutresa 2012 official results
+ 15 % + 16 % + 52 %
Figures calculated at 2012 closing exchange rates
PROFORMA 2012 GN + TMLUC
(USD mm)

Total international sales
$1.293
37.6%
7
6.5% USA
4.1% Mexico
5.9% Central America
Peru
0.9% Ecuador
62.4%
Venezuela
Other regions
Dominican Rep. & Caribean
Production & Distribution Distribution
70 Countries
11 Countries
15 Countries
1.8%
6.8%
1.3%
7
$223
$233
$204
$143
$62
$67
$31
$45
Chile 7.9% $272
Argentina 0.4% $14
Colombia $2.146
2.0%
Grupo Nutresa + TMLUC 2012 pro-forma data expressed in USD million dollar, FX december 31 -2012
LEADING REGIONAL FOOD COMPANY
PRO-FORMA 2012
7

CORPORATE MODEL
8

MAIN STRATEGIC GOAL
STRATEGY FOR OUR FIRST CENTURY 1920-2020
“Our Centennial strategy aims to double our 2013 sales by 2020; with sustained profitability between 12% and 14% of the EBITDA margin. To achieve this, we offer our consumers foods and experiences of recognized and beloved brands, that nourish, generate wellness and pleasure, that are distinguished by the best price/value relation; widely available in our strategic region, managed by talented, innovative, committed and responsible people, who contribute to sustainable development.”
* Through organic growth
9

DIFFERENTIATORS OF OUR BUSINESS MODEL
11
OUR PEOPLE +37.000 employees with a high level of satisfaction Our culture promotes participation, collaborative work, wellness, recognition and professional growth, which are reflected in the quality of our people and their commitment to the objectives.
OUR BRANDS
•16 brands with sales of more than USD 50 million •Portfolio of 146 brands Our brands are leaders in the markets in which we participate; they are recognized and loved and are part of people’s everyday lives. They are supported in nutritional, reliable products with an excellent price/value relation.
OUR DISTRIBUTION NETWORK +582.000 points of sale •+ 5.200 sellers Our extensive distribution network with an offer differentiated by channels and segments, with specialized attention teams, allows us to have our products available, with appropriate frequency and a close relationship with clients.

Investment Thesis
12
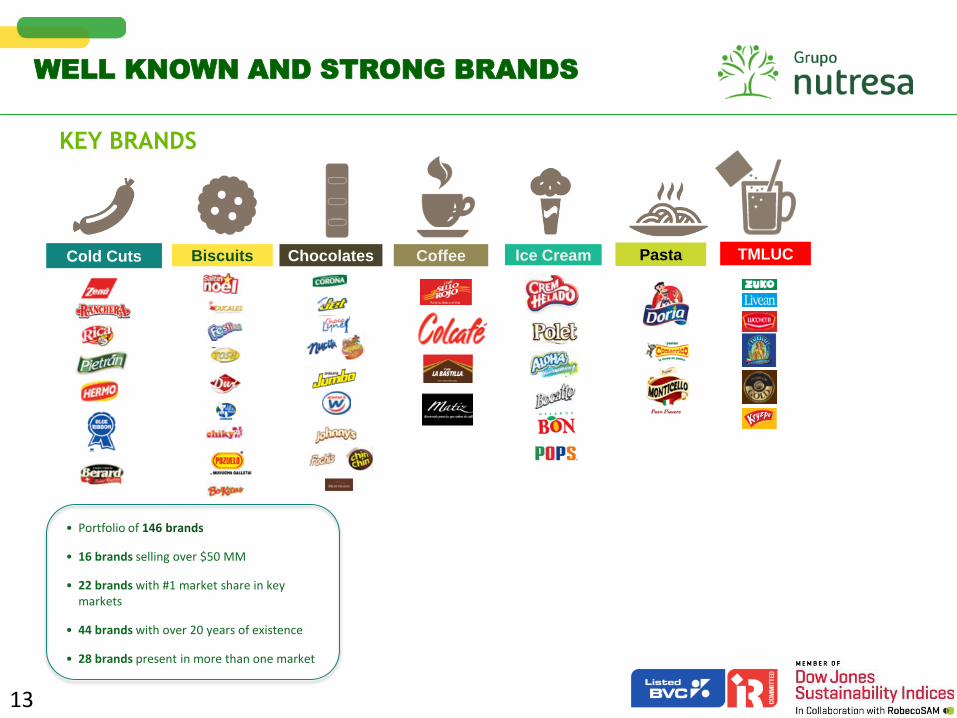
KEY BRANDS
12.5% 12.1%
• Portfolio of 146 brands
• 16 brands selling over $50 MM
• 22 brands with #1 market share in key markets
• 44 brands with over 20 years of existence
• 28 brands present in more than one market
12.6%
WELL KNOWN AND STRONG BRANDS
13
Ice Cream Pasta Cold Cuts Coffee Biscuits Chocolates TMLUC

14
54,7% +1,0%
Bicsuits
Chocolate confectionary 65,9% (A) +2.2% Hot chocolate 63,4% (B) -1.2% Milk modifiers 27,3% (C) 0,0% Nuts 47,0% -1,2% (D)
Chocolates
Roast and ground
coffee (A)
56,8% -0,9%
Soluble Coffee (B
40,6% -0.7%
Coffee
N.D.
Ice Cream
50,8% +0,3%
Pasta
73,7% +1,2%
Cold Cuts
#2 Private labels 6.8% #3 Friko 0,8%
#2 Nestlé 12,5% #3 Mondelez 10,7%
#2 La Muñeca 28,9% (A) #2 Colombina 8,7% (B) #2 Casa Lúker 25,0% (C) #1 Nestlé 66,8% (D) Frito Lay 27,4%
(A) #2 Águila Roja 22,6% (B) #1 Nestlé 45,3%
TMLUC
*PSD = Powdered soft drinks Source: Nielsen ago-sept 2013. (% share as of april – may 2013 in value and change vs. same period last year)
Chile PSD* 61,7% (A) Pasta
29.0% (B)
Coffee
17.1% (C)
Mexico PSD*
30.1% (D)
(A) #2 Carozzi 36,2% (B) #1 Carozzi 44,6% (C) #1 Nestlé 70,8% (D) #1 Mondelez 49.7%
MARKET SHARE
COLOMBIA + TMLUC

UNMATCHED DISTRIBUTION NETWORK
REVENUE MIX BY CHANNEL COLOMBIA
EMPLOYEES
7% Food Service (HORECA)
8% Alternative
18% Supermarket
chains +238.000
Point of sales
1% Industrial
66% Traditional (Mom-and- pop Stores) / Independent Retail Stores +344.000*
Point of sales outside Colombia
24.625 Colombia
12.726 International
37.351
15 15 Doesn´t include TMLUC coverage

16
6,7% 7,7% 7,6% 8,6% 6,8% 7,6% 7,9%
18,1% 17,9% 17,5% 19,1%
18,8% 17,8% 18,1%
1,4% 1,4% 1,4% 1,3%
1,3% 1,4% 1,3% 6,4% 7,1% 6,8%
6,2% 6,7% 6,9% 6,8%
67,4% 66,0% 66,6% 64,8% 66,5% 66,2% 65,8%
0%
10%
20%
30%
40%
50%
60%
70%
80%
90%
100%
Trim 1 - 12 Trim 2 - 12 Trim 3 - 12 Trim 4 - 12 Trim 1 - 13 Trim 2 - 13 Trim 3 - 13
2012 2013
Traditional (Mom-and- pop stores)/ independent Retail Stores
Food Service
Industrial
Supermarkets Chains
Alternative

17
COLOMBIA: A UNIQUE DISTRIBUTION
CHALLENGE
6% 7% 7% 7% 7% 7% 7% 7%
23% 23% 23% 23% 23% 23% 23% 23%
39% 38% 37% 38% 38% 38% 38% 38%
33% 32% 33% 32% 32% 32% 32% 32%
2003 2004 2005 2006 2007 2008 2009 2010
Upper class Mid-upper Class Middle Class Lower Class
SOCIAL CLASS EVOLUTION
69%
48% 35%
24%
10% 32%
45% 58%
21% 21% 20% 18%
Upper class Mid-upper Class Middle Class Lower Class
Supermarkets Mom-and-pop Others
WHERE THEY GO FOR SHOPPING?
50% 48% 47% 46% 45% 44% 43%
50% 52% 53% 54% 55% 56% 57%
2006 2007 2008 2009 2010 2011 2012
Supermarkets Mom-and-pop
CHANNEL EVOLUTION
Base on Nielsen Basket Monitor
Source: Nielsen Homescan
Sou
rce: Nielsen
Ho
mesca
n
HOW THEY LOOK?
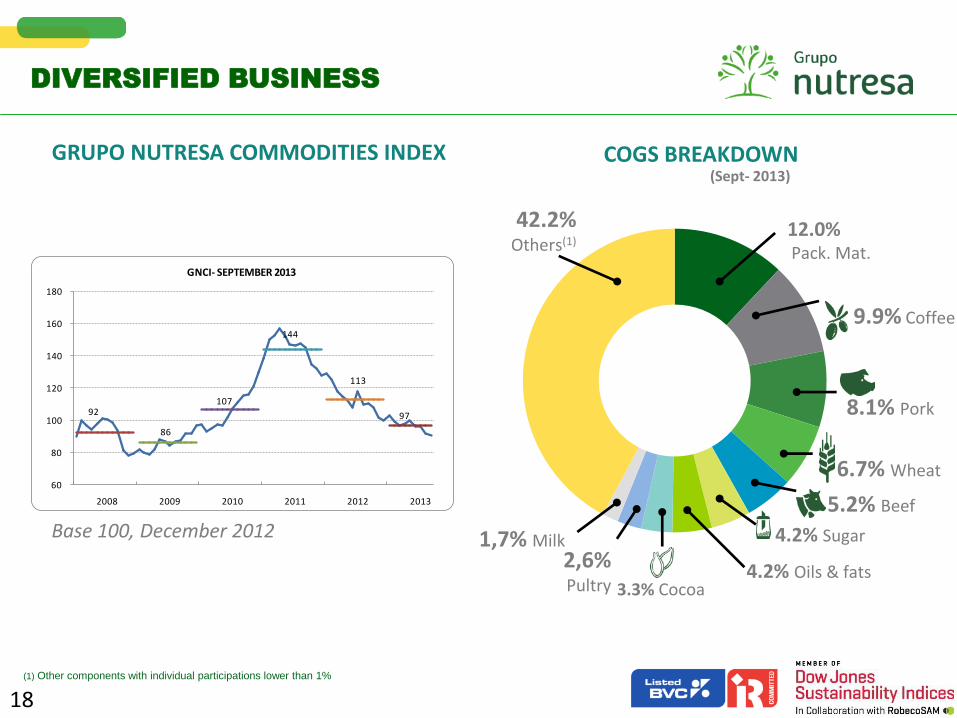
COGS BREAKDOWN
(1) Other components with individual participations lower than 1%
DIVERSIFIED BUSINESS
18
GRUPO NUTRESA COMMODITIES INDEX
Base 100, December 2012
(Sept- 2013)
9.9% Coffee
12.0% Pack. Mat.
8.1% Pork
6.7% Wheat
5.2% Beef
4.2% Sugar
3.3% Cocoa
2,6% Pultry
4.2% Oils & fats
1,7% Milk
42.2% Others(1)
92
86
107
144
113
97
60
80
100
120
140
160
180
2008 2009 2010 2011 2012 2013
GNCI- SEPTEMBER 2013

Financial Highlights
19

Sales EBITDA Sales EBITDA
2012 BUSINESS UNITS RESULTS
21
2011 2012 COP 1000 millions COP 1000 millions COP 1000 millions COP 1000 millions
$1.632 $1.727
2011 2012
$227 $221
2011 2012 2011 2012
Variation
+5,8% Variation
-2,7%
$1.029 $1.118
+8,6%
$941 $940
-0,1%
+15.1%
+34,8%
$105 $121
$107 $144
Margin
13,9 %
Margin
12,8 %
10,2 %
10,8 %
11,3 %
15,3 %
$826 $810 $67 $89
Variation
-1,9% Variation
+32,5%
Margin
8,2 %
Margin
11,0 %
$319 $380
+19,2%
$42 $61
13,2 %
15,9 %
$192 $209
+9,1%
$18 $29
9,5 %
14,1 %
+43,9%
+61,3%
$5.057 $5.306
+4,9% +3,2% volumen +1,7% Price
$568 $671
Margin
11,23 %
Margin
12,65 %
+18,1%
Ice Cream
Pasta
Cold Cuts Coffee
Biscuits
Chocolates

563 663 794 951
1.241 1.471 1.434
1.699 1.869
2.120
121 155
196
267
419
568 694
645
834
844
0
500
1.000
1.500
2.000
2.500
3.000
USD
MM
International
Colombia
104 123 141
162
254 290
256 283
304
375
15,2% 14,2%
15,3%
12,0%
11,2%
12,6%
0,0%
2,0%
4,0%
6,0%
8,0%
10,0%
12,0%
14,0%
16,0%
18,0%
0
50
100
150
200
250
300
350
400
USD
MM
EBITDA
Margin
INCREASING VALUE GENERATION
22
CAGR 2003-2012: 17,7% CAGR 2003-2012: 15,3%
EBITDA SALES 2.964
684
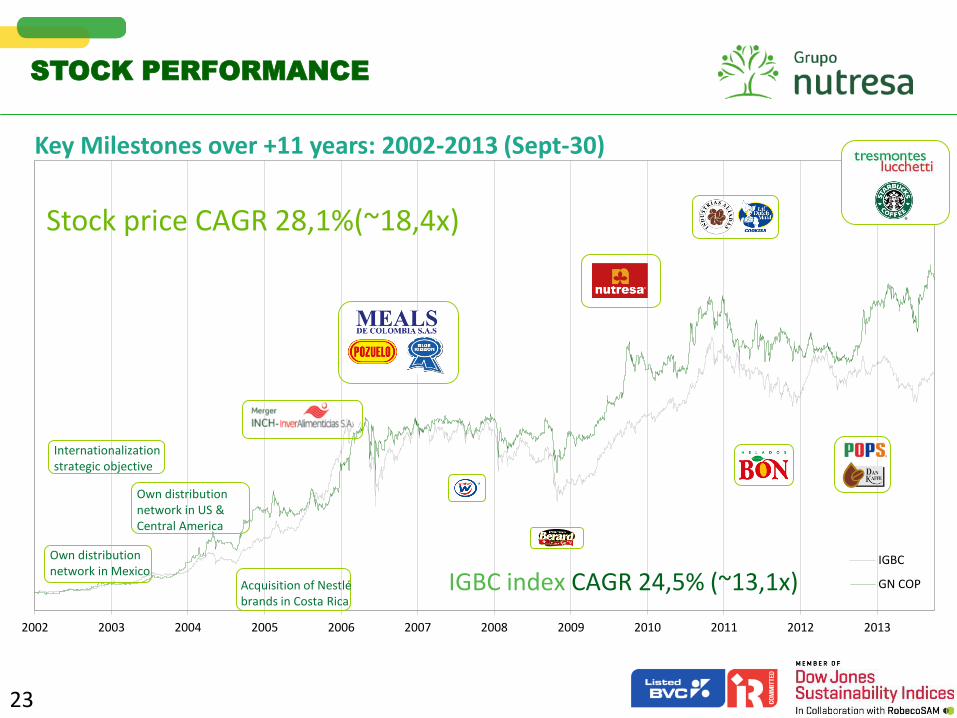
2002 2003 2004 2005 2006 2007 2008 2009 2010 2011 2012 2013
IGBC
GN COP
Stock price CAGR 28,1%(~18,4x)
IGBC index CAGR 24,5% (~13,1x)
Key Milestones over +11 years: 2002-2013 (Sept-30)
STOCK PERFORMANCE
Own distribution network in Mexico
Acquisition of Nestlé brands in Costa Rica
Own distribution network in US & Central America
Internationalization strategic objective
23

35,3%
32,5%
17,5%
9,8% 4,9%
STOCK INFORMATION
Stock details Shareholder base
24
14.765 Shareholders
Other Investors
Grupo Argos
International Investors (122)
Colombian Funds
Grupo Sura
Updated sept 2013 Updated sept 2013 TRM 1.914,65$
Share price (US$) 14,22$
Shares outstanding (MM) 460
Market cap (US billions) 6,54$
3 Mo. ADTV (US millions) 2,76$
12 Mo. ADTV (US millions) 2,39$
Value of Investments (US billions) 2,18$
12.7% of Grupo Sura 1,18$
12.4% of Grupo Argos 0,94$
Other investments 0,06$
Implied Market Cap (Ex. Investments) 4,36$
EBITDA 12M (1) 0,40$
Net Debt (1) 0,88$
Cash 0,18$
Adjusted Enterprise Value (US billions) 5,24$
Enterprise Value / EBITDA 13,2 Deuda Neta / EBITDA 2,21
(1) Food companies, ex cluding inv estments
in unconsolidated companies / 12 months

25
BALANCE SHEET - 2012

3Q13 Results
26

195,6 194,2
112,8 116,6
42,2 29,3
0
50
100
150
200
250
Cold cuts Biscuits Chocolates Coffee Ice cream
Mill
ion
International salesUS$691,0 +15,9%
939,8
460,3 500,1
379,8
284,0
172,2
0
100
200
300
400
500
600
700
800
900
1.000
Cold cuts Biscuits Chocolates Coffee Ice cream PastaBi
llio
n pe
sos
Colombia salesCOP $2.809,9 +1,7%
27
Percentage variation in volume (Q) and prices (P)
International sales organic growth Total: +6,8%
% chg. YoY
Billion pesos
% chg. YoY
Billion pesos
+3,5%
-0,5%
-2,3%
-2,5%
+2,8% +17,2%
+14,6%
+5,9%
+10,8% -2,4%
+122,9%
Q:+8,5P:-4,6
Q: +2.9 P: -1.2
Q:-3,5 P:+1,0
Q:+5,4 P:-5,6
Q:+4,8 P:-6,7
Q:+11,0 P:+3,2
Q:+4,9 P:+1,0
SALES PER
BUSINESS
UNIT
ACCUMULATED
SEPTEMBER 2013

1.312,8
820,3709,3
596,0
362,3
172,2
54,4
0
200
400
600
800
1.000
1.200
1.400
Cold cuts Biscuits Chocolates Coffee Ice cream Pasta TMLUC
Bill
ion
pe
sos
Total salesCOP $4.101,5 +7,0%
28
SALES PER
BUSINESS
UNIT
ACCUMULATED
SEPTEMBER 2013
Sales organic growth Total: +4,4%
Percentage variation in volume (Q) and prices (P)
% chg. YoY
Billion pesos
+5,9%
+8,7%
+1,1% +3,5%
+28,6%
-1,2%
Q: +6,7 P: +0,3

29
7.5% USA
2.0% Mexico
7.5% Central America
Peru
1.1% Ecuador
68.5%
Venezuela
Other regions
Dominican Republic and Caribbean
1.8%
8.0%
1.5%
29
$308
$328
$308
$81
$74
$49.5
$45
$61
Chile 0.9% $36
Colombia $2.810
1.2%
29
SALES BY REGION – 3Q 2013
COP billion
Malaysia
Total international sales
31,5%
$1.292 $26 N.C.

175,7
104,4115,3
98,8
62,5
19,56,5
0
20
40
60
80
100
120
140
160
180
200
Cold cuts Biscuits Chocolates Coffee Ice cream Pasta TMLUC
Bill
ion
pe
sos
EBITDACOP $575,2 +17,8%
margin 14,0%
EBITDA BY BUSINESS UNIT
ACCUMULATED SEPTEMBER 2013
30
13,4%
12,7%
16,3%
16,6%
17,3%
11,3%
+4,6%
+40,3%
+8,4%
+20,5% +67,4%
-14,8%
12,0%
EBITDA margin
% chg. Billion pesos

CONSOLIDATED INCOME STATEMENT
ACCUMULATED SEPTEMBER 2013
31
Figures in COP$ MM sep-13 % sep-12 % % var.
Total operating revenues 4.101.472 100,0% 3.832.919 100,0% 7,0%
Cost of goods sold -2.257.250 -55,0% -2.203.106 -57,5% 2,5%
Gross income 1.844.222 45,0% 1.629.813 42,5% 13,2%
Administrative expenses -242.240 -5,9% -193.226 -5,0% 25,4%
Sales expenses -1.056.595 -25,8% -951.496 -24,8% 11,0%
Production expenses -93.517 -2,3% -104.720 -2,7% -10,7%
Total operating expenses -1.392.352 -33,9% -1.249.442 -32,6% 11,4%
Operating income 451.870 11,0% 380.371 9,9% 18,8%
Financial revenues 8.211 0,2% 8.148 0,2% 0,8%
Financial expenses -61.386 -1,5% -53.292 -1,4% 15,2%
Foreign currency exposure 12.836 0,3% 8.986 0,2% 42,8%
Other revenues (expenditures), net -25.620 -0,6% -10.675 -0,3% 140,0%
Dividends (non-food) 29.867 0,7% 26.346 0,7% 13,4%
Non-recurring capital gains 107 0,0% 35 0,0% N.C.
Non-operating, net -35.985 -0,9% -20.452 -0,5% 75,9%
Income before tax 415.885 10,1% 359.919 9,4% 15,5%
Income tax -135.657 -3,3% -116.825 -3,0% 16,1%
Minority interest -73 0,0% -1.989 -0,1% -96,3%
Net Income 280.155 6,8% 241.105 6,3% 16,2%
Consolidated EBITDA 575.154 14,0% 488.060 12,7% 17,8%
Los gastos de Los gastos de

486 399 430
370
1.438
238
0
200
400
600
800
1.000
1.200
1.400
1.600
1.800
dic/06 dic/07 dic/08 dic/09 dic/10 dic/11 dic/12 mar/13 jun/13 sep/13
Billi
on
Pe
so
s
CONSOLIDATED NET DEBT
32
*The ratio net debt / EBITDA including 12 months EBITDA (pro forma) of TMLUC is 1.96x
Ratio dec-06 dec-07 dec-08 dec-09 dec-10 dec-11 dec-12 mar-13 jun-13 sep-13
Net debt/EBITDA 1,46 1,10 1,20 1,57 1,82 0,86 0,59 0,61 0,50 2,21*
EBITDA / Interest 10,31 9,78 10,00 6,86 8,60 8,85 12,74 13,68 14,90 13,14
Interest / Revenues 1,29% 1,57% 1,42% 1,75% 1,40% 1,27% 0,99% 0,96% 0,91% 1,03%
TMLUC
GN
1.676
Note: Sales, EBITDA and interest of the last 12 months

DEBT BREAKDOWN
33
COP 79,3%
CLP 12,6%
PEN 4,0%
USD 3,3%
Others 0,9%
BY CURRENCY
Long term (>5 Yr.) 51,3%
Mid term (1-5 Yr.) 31,0%
Short term (<1 Yr.) 17,7%
BY PAYMENT PROFILE
IPC 29,4%
IBR 24,7%
DTF 24,6%
TAB Nominal*
8,1%
TAB UF** 4,4%
Fixed rate 7,8%
Others 1,1%
BY REFERENCE RATE
* TAB Nominal: Reference bank rate in Chile ** TAB UF: Reference bank rate in Chile indexed to inflation

Thank you!
34

CONTACT DETAILS
Alejandro Jiménez Moreno Investor Relations Director Tel: (+574) 3258698 email: [email protected] www.gruponutresa.com
35
For more information regarding Grupo Nutresa's level 1 ADR, please call The Bank of New York Mellon marketing desks:
New York New York New York London
BNYM-Latin America BNYM-Sell-Side BNYM-Buy-Side BNYM-Sell-Side/Buy-Side
Gloria Mata Kristen Resch Angelo Fazio Mark Lewis
[email protected] [email protected] [email protected] [email protected]
Telephone 212 815 5822 Telephone 212 815 2213 Telephone 212 815 2892 Telephone 44 207 964 6419
This presentation and further detailed information can be found in the following link in our section "Grupo Nutresa Valuation Kit": http://www.gruponutresa.com/es/content/grupo-nutresa-valuation-kit-gnvk

DISCLAIMER
This document can contain forward looking statements related to Grupo Nutresa S.A. and its subordinated companies, under assumptions and estimations made by company management. For better illustration and decision making purposes Grupo Nutresa’s figures are consolidated; for this reason they can differ from the ones presented to official entities. Grupo Nutresa S.A. does not assume any obligation to update or correct the information contained in this document.
“The IR Recognition granted by Bolsa de Valores de Colombia S.A. (the Colombian Securities Exchange) is not a certification of the registered securities or the solvency of the issuer.”
36