presentación de powerpoint sprawl.pdf · 1. how to identify metropolitan areas? world renaissance:...
TRANSCRIPT

Metropolitan Sprawl
ARELLANO, Blanca & ROCA, Josep
[email protected], [email protected]
http://www.upc.edu/cpsv/
Lisbon, Portugal August 27th of 2015
55th Congress
World Renaissance:Changing roles for people and places

Urbanization and Sprawl
World Renaissance:Changing roles for people and places
The gradual spread of urbanization, thephenomenon known under the term urbansprawl, has become one of the paradigmsthat have characterized the urbandevelopment since the second half of thetwentieth century and early twenty-firstcentury.
Since 1950 there has been a real reversal inthe topology of the landscape. Highlyartificialized landscapes have gone from"islands" within the "rural ocean" to"colonize" almost the entire planet. Theprocess of urban sprawl has relegated, thus,open spaces to the role of auxiliaryelements within the territorial structure.
The green areas in the “urbanized ocean”

Tokyo:
green
areas
Source: CPSV-UPC

Tokyo:
artificialized
land
Source: CPSV-UPC

The concept of urban sprawl
Reconstruction of urban
growth in Baltimore
Sprawl is the spreading out of a city and its
suburbs over more and more rural land at the
periphery of an urban area. This involves the
conversion of open space (rural land) into built-
up, developed land over time.
World Renaissance:
Changing roles for people and places
The European Environment Agency (EEA)
has described sprawl as the physical pattern
of low-density expansion of large urban areas,
under market conditions, mainly into the
surrounding agricultural areas. Sprawl is the
leading edge of urban growth and implies little
planning control of land subdivision.
Development is patchy, scattered and strung
out, with a tendency for discontinuity.
“Sprawl” is an elusive term. Most
people can’t define sprawl but
they know it when they see it.
To some, it means a pattern of
auto-oriented suburban
development.
To others, it means low-density
residential subdivisions on the
metropolitan fringe.

Sprawl is defined as a condition of land use that is represented by low values on one or more of eight distinct dimensions of land use patterns: density, continuity, concentration, clustering, centrality, nuclearity, mixed uses, and proximity (Galster et alt., 2001).
World Renaissance:
Changing roles for people and places

Urbanization and Sprawl
World Renaissance:
Changing roles for people and places
There is no global database that allows comparative studies about urban sprawl between cities or
metropolitan areas.
Although remote sensing technology enables the uniform analysis of land consumption at worldwide scale,
the diversity of methodologies used and the high cost of required computing has led to the proliferation of
scoping studies Local, but have not enabled the generation of an integrated database a planetary scale.
An example of this, is the disparity between the analysis of "urbanized covers" produced by agencies of
the USA (USGS) and the EU (CORINE LAND COVER).

This paper proposes a new methodology to measure the phenomenon of urban sprawlworldwide based on the analysis of the night lights satellite image
The night lights have been used in widespread scientific contributions, from building humandevelopment indices (Elvidge et alt, 2012) to identify megalopolis (Florida et alt, 2008 andArellano & Roca, 2014). However it has not been extensively used to analyze thephenomenon of urban sprawl. In this sense, this paper proposes a new methodology tostudy the impact of urbanization in the world, especially in metropolitan areas
The research has three key research questions:How to define the metropolis?How to differentiate the centers from peripheries?How to measure urban sprawl?
Objective of the Research
Our hypothesis is that metropolitan peripheries consume more land per capita than others types of urban agglomerations and therefore where the urban sprawl is more pronounced
World Renaissance:Changing roles for people and places
1. How to identify Metropolitan Areas?
World Renaissance:Changing roles for people and places
The overflow of administrative boundaries by urbanization has led to overcoming the old concept of the city and its replacement by others that have tried to understand the new territorial phenomenom. Metropolitan and micropolitanareas, agglomerations, conurbations, daily urban systems, local labor market, functional urban regions, megalopolis, mega-city regions have been, among others, concepts that have tried to replace the "outdated" notion of city
Since 1910 the Census Bureau of the USA regulate metropolitan districts, there have been so many efforts to define and delineate the new artifacts that have come to replace our old and beloved cities. Morphologic (urban continuity), demographic (density based), economic (economic structure) and functional (based on residence / work relationship) criteria has been used to identify metropolises
Although functional boundaries have been, since its adoption in 1960 by the Census Bureau to define the American metropolitan areas, the most widespread and used over the past decades, there isn’t an international standard to define metropolitan areas

The study assumes that night lights satellite imagery provides valuable information for the identification of urbanand metropolitan systems.
For this purpose, we develop a methodology to detect the Highly Impacted Areas from the analysis of existingpatterns of urbanization (UA) in the USA and delimitating the metropolitan areas by analyzing the image of nightlights called Black Marble (NASA,2013).
Methodology used to identify the Metropolitan Areas
World Renaissance:Changing roles for people and places
Black Marble: a georeferenced image of 384 Mb, and 54,000 columns and 27,000 rows and a resolution of 0.00667 degrees per pixel

First of all, we analyzed the filesupplied by NASA, which offers, in thevisible spectrum, three images (RGB)differentiated from night lights.
So it has to proceed to the compositionof a single image in conventionalgreyscale palette (0-255).
Finally, the image conversion fromgrayscale to elevations allowsdeveloping contours at differentintensity levels, capable of identifyingdifferent hypothesis of urban andmetropolitan systems
World Renaissance:Changing roles for people and places
Methodology used to identify MA

• The transformation of night lights image into a point file allows the realization of a logisticregression with the Urban Areas (UA) as a dependent variable, and night light intensity asan explanatory variable
• The logistic regression, adjusted for a total of 18 million points (3.6% of which correspond toUA), allows establishing a level of 164 night light intensity (in a scale of greys from 0 to 255levels of intensity) for the determination of those areas highly impacted by urbanization. Themodel gets a 86,4% of effectiveness to explain the UA pattern in USA
World Renaissance:Changing roles for people and places
Methodology used to identify MA

Model for the Urban Areas in Southern California
Red = UA; blue = 164 intensity level contour
World Renaissance:Changing roles for people and places

• We have estimated the population of the continuingcontours of 164 or higher intensity night lights byoverlapping information on population (2008) of theLandScan data base developed by the Oak RidgeNational Laboratory, USA. LandScan allows analyzing thepopulation structure of different environments in theurbanized planet, with a close approximation to thereality
• The overlap of highly Impacted Areas (IA), defined basedon night lights, with demographic information containedin LandScan allows typify world urban areas based ontheir population size and to analyze land consumptionpatterns impacted by urbanization according to thatdimension. For the purpose of this study we haveconsidered metropolitan areas the IA with a populationequal to or greater than 1,000,000 inhabitants
Green colors =< 50 inhabitants per pixel Orange and red colors >= 250 inhabitants per pixel
World Renaissance:Changing roles for people and places
Methodology used to identify MA

• This research has developed a specific methodology for distinguishingthe central areas (CA) from the Periphery (P) similar to what was donewith the areas impacted by urbanization, defined based on a certainlevel of night lighting
• The delimitation of the centers and peripheries of cities was made bysetting a threshold of Impacted Areas allowing the inclusion of most ofthe centers and sub-centers. The centers threshold correspondsapproximately to a light intensity of more than 230, and for themetropolitan peripheries is the rest of the impacted area, between 164and 230.
• More precisely, the identification of core areas was established throughthe division into natural breaks (Jenks), with 5 classes, corresponding tothe highest class. This class breaks at 230 intensity level, which it hasbeen identified as “centers. The image shows the histogram and naturalbreaks obtained by ArcGis
2. How to differentiate centers from peripheries
World Renaissance:Changing roles for people and places

• The measure of Urban Sprawl have been made by the indicator: Surface (per capita) Impacted by Urbanization(measured according to the luminous impact), quantified by the ratio between the surface contour of eachagglomeration (=> 164 for all typologies of urban systems, > 230 in the case of metropolitan centers and from164 to 230 for the metropolitan peripheries; and its population). This indicator will be named Light ImpactedLand per capita (LILpc)
• We distinguish different typologies: small (urban systems with a population between 10 and 100,000inhabitants), medium (from 100,000 to 500,000) and big (from 500,000 to 1,000,000) cities, as well asmetropolitan areas (more than 1,000,000 inhabitants). In the case of metro areas, we also distinguish centers(with night light intensity > 230) and peripheries (from 164 to 230 intensity)
• The comparison between land consumption of the different typologies of urban systems with metropolitancenters and peripheries allow us to contrast the hypothesis that metropolitan peripheries consume more landper capita and therefore where the urban sprawl is more pronounced
3. How to measure Urban Sprawl
World Renaissance:Changing roles for people and places

• The application of the methodology proposed, on obtaining the level of light intensity equivalent to the delimitation of the UA in USA, allows the identification of 186.134 populated illuminated areas (intensity =>164)
• 404 of these illuminated areas, 2.2 per thousand of the total, can be defined as a metropolises to reach a population of over one million inhabitants, concentrating 1.623 million people, 24.45% of the world population. 34 of those areas exceed 10 million, representing the "seeds" of the megalopolitan structures (Florida et alt, 2008; Arellano & Roca, 2014). On the opposite side to those giants, a 86.94% of the illuminated landscapes (with an intensity equal to or greater than 164) do not exceed 5,000 inhabitants, accounting for 1.45% of the world population.
The Results: World Urban Agglomerations
Population Int. 164 Num. Areas Population %
< 100 inhab. 73,861 2,080,640 0,07%
100-1,000 inhab. 56,711 21,996,743 0,75%
1,000-5,000 inhab. 31,249 72,494,669 2,46%
5,000-10,000 inhab. 8,230 58,105,574 1,97%
10,000-50,000 inhab. 10,513 233,741,327 7,93%
50,000-100,000 inhab. 2,431 169,608,631 5,76%
100,000-500,000 inhab. 2,372 506,136,689 17,18%
500,000/1,000,000 inhab. 363 258,781,784 8,78%
1,000,000-5,000,000 inhab. 328 669,451,270 22,72%
5,000,000-10,000,000 inhab. 42 282,833,771 9,60%
>= 10,000,000 inhab. 34 670,749,830 22,77%
TOTAL 186,134 2,945,980,928
World Renaissance:Changing roles for people and places

World Urban Agglomerations
World Renaissance:Changing roles for people and places

Megacities (population > 10,000,000 inhabitants)
World Renaissance:Changing roles for people and places

New York – Philadelphia Metropolitan Area
The metropolitan system of New York (26,581,672 inhabitants) includes Philadelphia, Trenton and Hartford, but not Washington-Baltimore (6,986,575 inhabit.) or Boston (5,243,601 inhabit.)
World Renaissance:Changing roles for people and places

The Metro Area of Los Angeles (15,777,380 inhabitants) includes Orange and San Bernardino Counties, but not the metropolis of San Diego, which absorbs Tijuana, Mexico (4,192,676 inhabit.)
Loa Angeles Metropolitan System
World Renaissance:Changing roles for people and places

Metro Area of Mexico City (20,378,028 inhabitants) doesn’t include the metropolitan systems of Puebla-Tlaxcala (2,797,846 inhabit.), Cuernavaca (1,285,314 inhabit.) or Toluca (1,801,168 inhabit.)
Mexico City
World Renaissance:Changing roles for people and places

The agglomeration of Brussels-Amsterdam (nearby 20 millions of inhabitants) extends from Lille to Utrecht, including Antwerp, Rotterdam, The Hague and Liege. It doesn’t include the near metropolis of the Rhine-Ruhr (8,979,578 inhabitants)
Brussels-Amsterdam agglomeration
World Renaissance:Changing roles for people and places

In front of the agglomeration of Brussels-Amsterdam not only Rhine-Ruhr seems small. Also Metropolitan Areas of Paris (10,672,304 inhabitants) or London (11,420,350 inhabitants) are smaller
Metro Areas of Paris and London
World Renaissance:Changing roles for people and places

The metropolitan area of Tokyo (35,514,940 inhabitants) appears clearly differentiated of the others urban agglomerations of Hokkaido Island, like Nagoya (10,528,167 inhabitants) or Kyoto-Osaka-Kobe (17,234,951 inhabitants)
Metro Area of Tokyo
World Renaissance:Changing roles for people and places

The Metro Area of Shanghai(36,853,534 inhabitants), withNantong, Changzhou, Wuxi andSuzhou as major cities, is thethird metropolitan system in ourranking based on night lights. Itappears clearly differentiate ofNanjing (6,606,566 inhabitants)and Hangzhou (12,356,984inhabitants) agglomerations
Metropolitan Area of Shanghai
World Renaissance:Changing roles for people and places

With 22,851,644 inhabitants, theMetropolitan Area of Delhi is thefirst agglomeration in India,followed by Mumbai (20,953,305inhabitants)
Delhi Metro Area
World Renaissance:Changing roles for people and places

We consider sprawled agglomerations those with a LILpc > average + 1 standard deviation, that means more than 918 m2 / inhab.
Values above 0 mean that are larger than LILpcaverage. Values above 1, LILpc > average + 1 Std. Est.
Negative values mean areas with below average sprawl.
47 of the 404 MA have values above 1
Most affected areas are located in USA (27)
Countries Oil producers also bring a number of significant MA with a higher LILpc, perhaps the effect of oil exploitation
The standardized LILpc value is a good indicator of Sprawl
Metropolis and Sprawl
World Renaissance:Changing roles for people and places
Figure shows agglomerations with standardized LILpc greater than 2

Leaders in urban sprawl (standardized LILpc > 2) are the 24 following metropolises: Ahvaz (Iran), Kuwait (Kuwait), Charlotte(United States), Dubai (United Arab Emirates), Nashville (United States), Abha (Saudi Arabia), Raleigh (United States), Tripoli(Libya), Memphis (United States), Jacksonville (United States), Pittsburgh (United States), Indianapolis (United States),Atlanta (United States), Cincinnati (United States), Bologna-Modena-Parma (Italy), Tampa (United States), Alicante-Murcia(Spain), Kansas City (United States), Reynosa-Mcallen (United States-Mexico), Oslo (Norway), Cleveland (United States), St.Louis (United States), Austin (United States), and Columbus (United States)
Leaders in Urban Sprawl
World Renaissance:Changing roles for people and places

The study allows to compare metropolitan sprawl
Two metropolitan areas with similar population (20 million inhabitants); Brussels-Amsterdam and Mexico City. The first one impacts 20,458.10 square kilometers, the second, just 4,150.86
The LILpc indicator goes from 203.69 m2 per inhabitant in Mexico City, to 1,023.16 in central European agglomeration
Comparison between Metro Areas
World Renaissance:Changing roles for people and places

• Once estimated Sprawl of metropolitan areas, it is usefulto polish this study distinguishing between centers andperipheries. It could happen that a metropolitan area as awhole could not be characterized as disperse due to thehigh density of the center.
• For this purpose we have differentiated central areas,identified by the contours of light intensity above 230,and peripheries (164-230)
• If a reference value of 1,000 m2 / inhabitant is adopted toconsider a landscape as sprawled, some citiestraditionally considered as dense, show a significant levelof sprawl in their peripheries, such as Barcelona, MexicoCity, Buenos Aires, Rio, Seoul or Taipei, appearing withalarming levels of sprawl in the periphery
Centers and Peripheries
World Renaissance:Changing roles for people and places

• Although the impacted land by inhabitant decreases with the size of the city and metropolitan areas “consume” lessland than the rest of urban systems (due to economies of agglomeration), the landscape of metropolitan peripheriesimpact or consume more land. At global scale, only small cities impact more than the peripheries of the metropolises(876.21 vs 786.08 m2/inhabitant )
• In North America the levels of urban sprawl are widespread, affecting not only the metropolitan peripheries butalso small towns, medium and even large cities. All typologies, with the exception of metropolitan centers, show aLILpc greater than 1,000 m2 by inhabitant. The Urban Sprawl is concentrated in small cities (LILpc = 1,809.18) andmetropolitan peripheries (LILpc = 1,523.22)
Comparison between typologies of Urban Systems (I)
World Europa Amer. Nor Amer. Sur Asia África Aust_NZ
Ciudades Pequeñas 876,21 991,13 1.809,18 910,78 598,63 632,80 1.122,26
Ciudades Medias 595,74 694,42 1.351,09 540,45 451,35 371,16 875,27
Ciudades Grandes 605,78 622,03 1.193,19 607,58 468,72 379,68 -
Áreas Metropolitanas 446,09 631,60 791,80 314,91 349,32 374,92 659,99
Centros AM 164,90 202,93 340,52 123,58 120,19 116,82 431,19
Periferia AM 786,08 1.009,82 1.523,22 1.303,47 590,34 624,32 713,47
World Renaissance:Changing roles for people and places
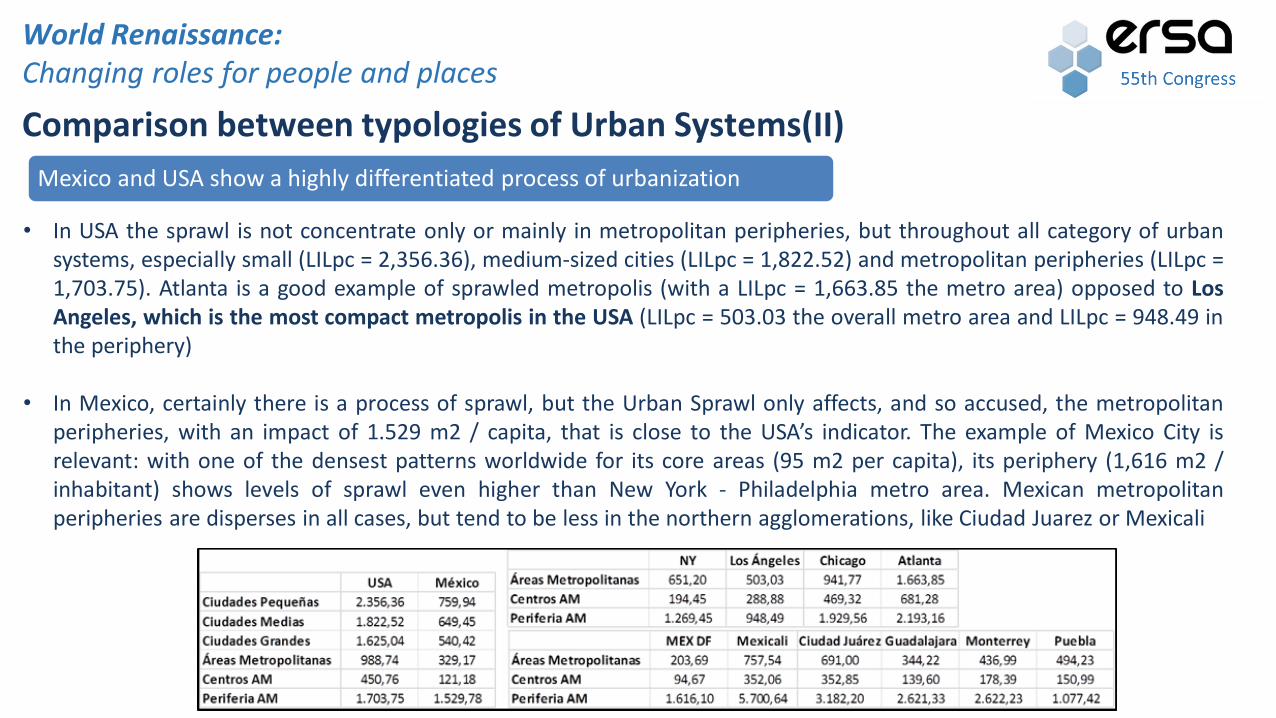
• In USA the sprawl is not concentrate only or mainly in metropolitan peripheries, but throughout all category of urbansystems, especially small (LILpc = 2,356.36), medium-sized cities (LILpc = 1,822.52) and metropolitan peripheries (LILpc =1,703.75). Atlanta is a good example of sprawled metropolis (with a LILpc = 1,663.85 the metro area) opposed to LosAngeles, which is the most compact metropolis in the USA (LILpc = 503.03 the overall metro area and LILpc = 948.49 inthe periphery)
• In Mexico, certainly there is a process of sprawl, but the Urban Sprawl only affects, and so accused, the metropolitanperipheries, with an impact of 1.529 m2 / capita, that is close to the USA’s indicator. The example of Mexico City isrelevant: with one of the densest patterns worldwide for its core areas (95 m2 per capita), its periphery (1,616 m2 /inhabitant) shows levels of sprawl even higher than New York - Philadelphia metro area. Mexican metropolitanperipheries are disperses in all cases, but tend to be less in the northern agglomerations, like Ciudad Juarez or Mexicali
Comparison between typologies of Urban Systems(II)
World Renaissance:Changing roles for people and places
Mexico and USA show a highly differentiated process of urbanization
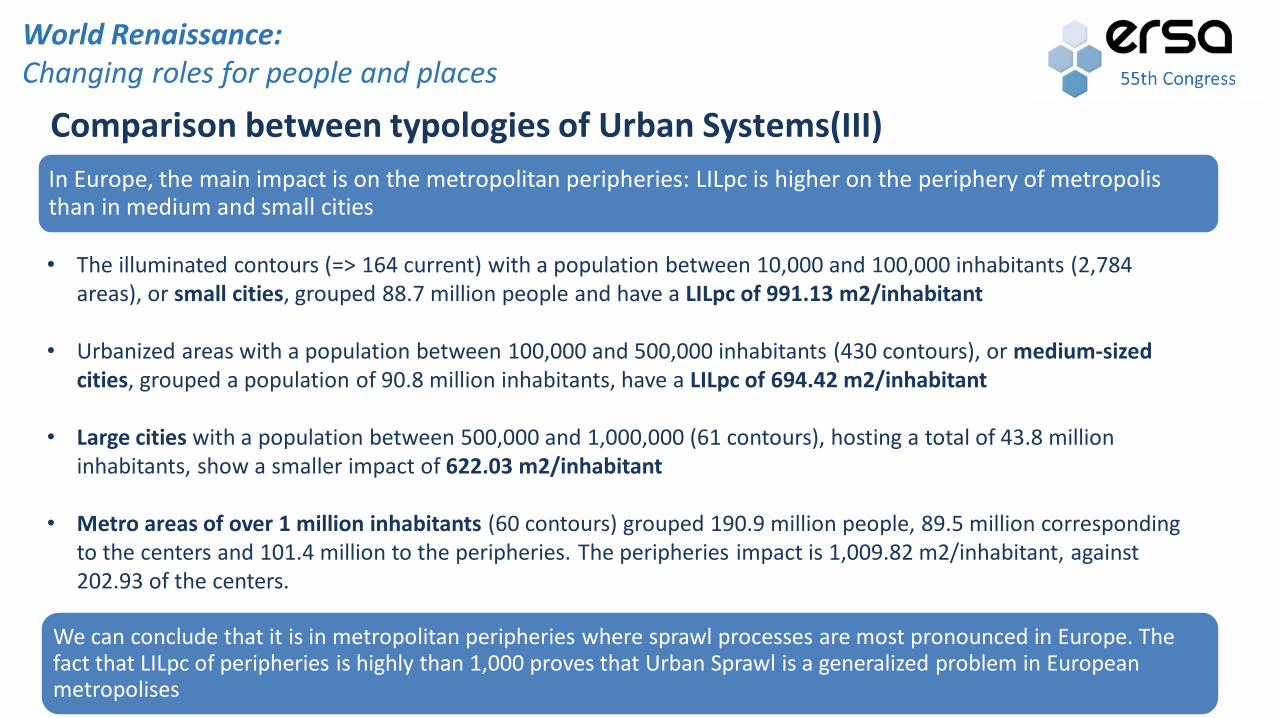
• The illuminated contours (=> 164 current) with a population between 10,000 and 100,000 inhabitants (2,784 areas), or small cities, grouped 88.7 million people and have a LILpc of 991.13 m2/inhabitant
• Urbanized areas with a population between 100,000 and 500,000 inhabitants (430 contours), or medium-sized cities, grouped a population of 90.8 million inhabitants, have a LILpc of 694.42 m2/inhabitant
• Large cities with a population between 500,000 and 1,000,000 (61 contours), hosting a total of 43.8 million inhabitants, show a smaller impact of 622.03 m2/inhabitant
• Metro areas of over 1 million inhabitants (60 contours) grouped 190.9 million people, 89.5 million corresponding to the centers and 101.4 million to the peripheries. The peripheries impact is 1,009.82 m2/inhabitant, against 202.93 of the centers.
Comparison between typologies of Urban Systems(III)
World Renaissance:Changing roles for people and places
In Europe, the main impact is on the metropolitan peripheries: LILpc is higher on the periphery of metropolis than in medium and small cities
We can conclude that it is in metropolitan peripheries where sprawl processes are most pronounced in Europe. The fact that LILpc of peripheries is highly than 1,000 proves that Urban Sprawl is a generalized problem in European metropolises

Agglomerations like Sao Paulo (LILpc = 1,397.19), Buenos Aires (LILpc = 3,362.38), Rio de Janeiro (LILpc = 1,170.50), Bogota(1,157.02), Belo Horizonte (1,132.48), Caracas (1,340.74), Medellin (1,266.25), Porto Alegre (1,102.85), Valencia (1,467.98), Fortaleza(1,263.04), Curitiba (1,267.71), Brasilia (1,891.83), Maracaibo (2,805.34) or Cali (1,747.56), are good examples of sprawl in southAmerican metropolitan peripheries.
Comparison between typologies of Urban Systems(IV)
World Renaissance:Changing roles for people and places
In South America, the Urban Sprawl processes are concentrated in metropolitan peripheries (LILpc = 1,303.47), overpassing the cut off of 1,000 m2 per inhabitant.
Africa and Asia show similar patterns of light impacted land. The sprawl doesn’t seem to be an accused problem in these continents. Although 42 between 200 metropolises in Asia show levels of highly metropolitan peripheral sprawl.
Agglomerations like Kuwait, Dubai, Riyadh, Medina, Mecca, Ad Daman, or Abba in Saudi Arabia, Mashhad, Tehran or Esfahan inIran, Baghdad in Iraq, Jerusalem-Tel Aviv, Damascus, Amman, Beirut, Ankara or Izmir in Turkey, Seoul or Pusan in South Korea,Hyderabad in India, Tianjin in China or Kuala Lumpur in Malaysia, have sprawled peripheries (=> 1,000 m2 per inhabitant). In thecase of Africa, just 8 of 38 metropolises have disperse peripheries, including cities as Tripoli (Libya), Luanda (Angola), Lusaka(Zambia), Algiers (Algeria), or Casablanca, Rabat or Marrakech in Morocco.
Australia-New Zealand expressed a level of Sprawl accused in small towns. Perth and Brisbane, from 6 metropolitan areas, show disperses peripheries
The study shows that night lights satellite image have a high potential for analysis of urban and metropolitan systems. The results appear to be consistent with most metropolitan delimitations
The application of the methodology proposed, on obtaining the level of light intensity equivalent to the delimitation of the Urban Areas in the USA, allows the identification of 186.134 populated illuminated areas (intensity =>164). 404 of these illuminated areas, 2.2 per thousand of the total, can be defined as a metropolises to reach a population of over one million inhabitants
We have used the Light Impacted Land per capita (LILpc) as indicator of Urban Sprawl and considered sprawled agglomerations those with a LILpc > average + 1 standard deviation, that is more than 918 m2 / inhab. 47 of the 404 Metro Areas are in that situation. Most of these affected areas are located in USA (27). Countries Oil producers also bring a number of significant MA with a higher LILpc, perhaps the effect of oil exploitation
Metropolises like Kuwait (Kuwait), Dubai (United Arab Emirates), Nashville, Memphis, Jacksonville, Pittsburgh, Indianapolis, Atlanta, Cincinnati, Austin, Kansas City, St. Louis, Cleveland or Columbus (United States), Bologna-Modena-Parma (Italy), and Murcia-Alicante (Spain) are the best samples of sprawled agglomerations
Conclusions
World Renaissance:Changing roles for people and places

Also in metropolitan areas we have distinguish between central areas and peripheries. If a reference value of 1,000 m2 / inhabitant is adopted to consider a landscape as sprawled, some cities traditionally considered as dense, show a significant level of Sprawl in their peripheries. Relatively dense cities such as Barcelona, Mexico City, Buenos Aires, Rio, Seoul or Taipei, appearing with alarming levels of sprawl in the periphery
At global scale, only small cities impact more than the peripheries of the metropolises (876.21 vs 786.08 m2/inhabitant)
In Europe, the main impact is on the metropolitan peripheries: light impacted land per capita (LILpc) is higher on the periphery of metropolis than in medium and small cities
In North America, specially in USA, the Sprawl does not concentrate only or mainly in metropolitan peripheries. The dispersion of urbanization is widespread, affecting not only the metropolitan peripheries but also small towns, medium and even large cities
Conclusions
World Renaissance:Changing roles for people and places

South America and Mexico , the urban sprawl processes are concentrated in metropolitan peripheries. Agglomerations like Mexico DF, Sao Paulo, Buenos Aires, Rio de Janeiro, Bogota, Belo Horizonte, Caracas, Medellin, Porto Alegre, Curitiba, Brasilia, Maracaibo or Cali, are good examples of sprawl in south American metropolitan peripheries
Africa and Asia show similar patterns of land impacted by light. The sprawl doesn’t like to be an accused problem in these continents. Although 42 between 200 metropolises in Asia show levels of highly metropolitan peripheral sprawl. And 8 between 38 metropolises have disperse peripheries in Africa
We can conclude that the hypothesis that the peripheries of the metropolitan areas are the main scenery of urban sprawl is confirmed
Conclusions
World Renaissance:Changing roles for people and places

Thanks for your attention!
World Renaissance:Changing roles for people and places
ARELLANO, Blanca & ROCA, Josep [email protected], [email protected] http://www.upc.edu/cpsv/