present state and evolution trends of the romanian black sea coastal environment
DESCRIPTION
PRESENT STATE AND EVOLUTION TRENDS OF THE ROMANIAN BLACK SEA COASTAL ENVIRONMENT. Dr.Eng. S. Nicolaev et al. National Institute for Marine Research & Development “Grigore Antipa”, Mamaia 300, RO-900581, Constanta 3, Romania, E-mail: . - PowerPoint PPT PresentationTRANSCRIPT
INCDM
PRESENT STATE AND EVOLUTION PRESENT STATE AND EVOLUTION TRENDS TRENDS
OF THE ROMANIAN BLACK SEA OF THE ROMANIAN BLACK SEA COASTALCOASTAL
ENVIRONMENT ENVIRONMENT
Dr.Eng. S. Nicolaev Dr.Eng. S. Nicolaev et al. et al.
National Institute for Marine Research & National Institute for Marine Research & Development Development
““Grigore Antipa”, Mamaia 300, RO-900581, Grigore Antipa”, Mamaia 300, RO-900581, Constanta 3, Constanta 3,
Romania, E-mail: <[email protected]>Romania, E-mail: <[email protected]>
INCDM
STATE OF PHYSICAL – STATE OF PHYSICAL – CHEMICAL INDICATORSCHEMICAL INDICATORS
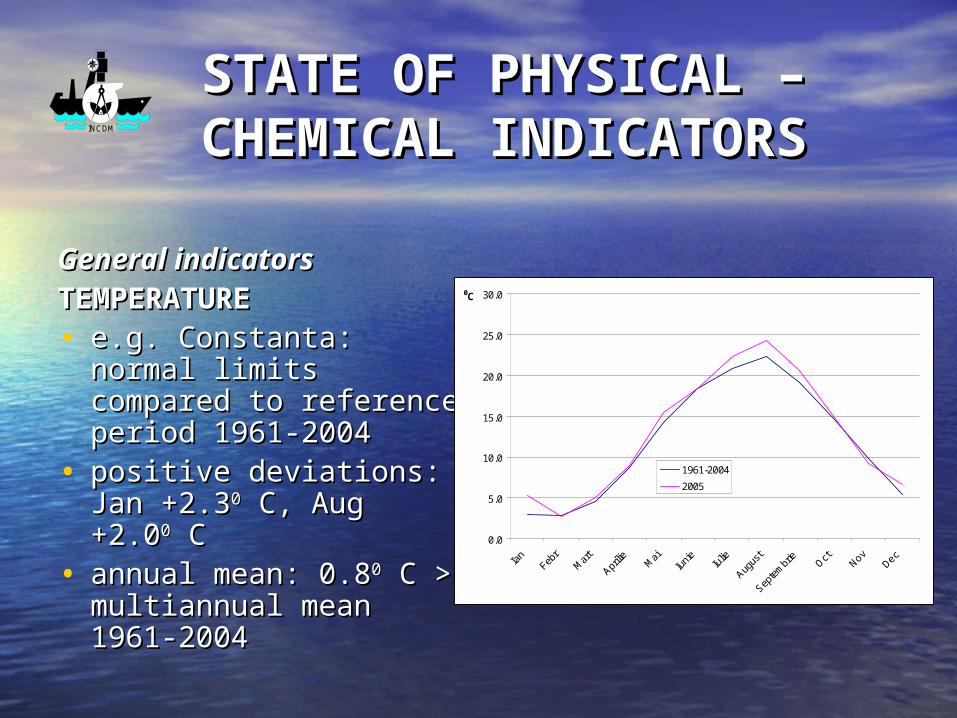
General indicatorsGeneral indicatorsTEMPERATURETEMPERATURE• e.ge.g.. Constanta: normal Constanta: normal
limits compared to limits compared to reference period 1961-reference period 1961-20042004
• positive deviations: Jan positive deviations: Jan +2.3+2.300 C, Aug +2.0 C, Aug +2.000 C C
• annual mean: 0.8annual mean: 0.800 C > C > multiannual mean multiannual mean 1961-20041961-2004
0.0
5.0
10.0
15.0
20.0
25.0
30.00C
1961-2004
2005
INCDM
STATE OF LITTORAL STATE OF LITTORAL AND COASTAL ZONEAND COASTAL ZONE
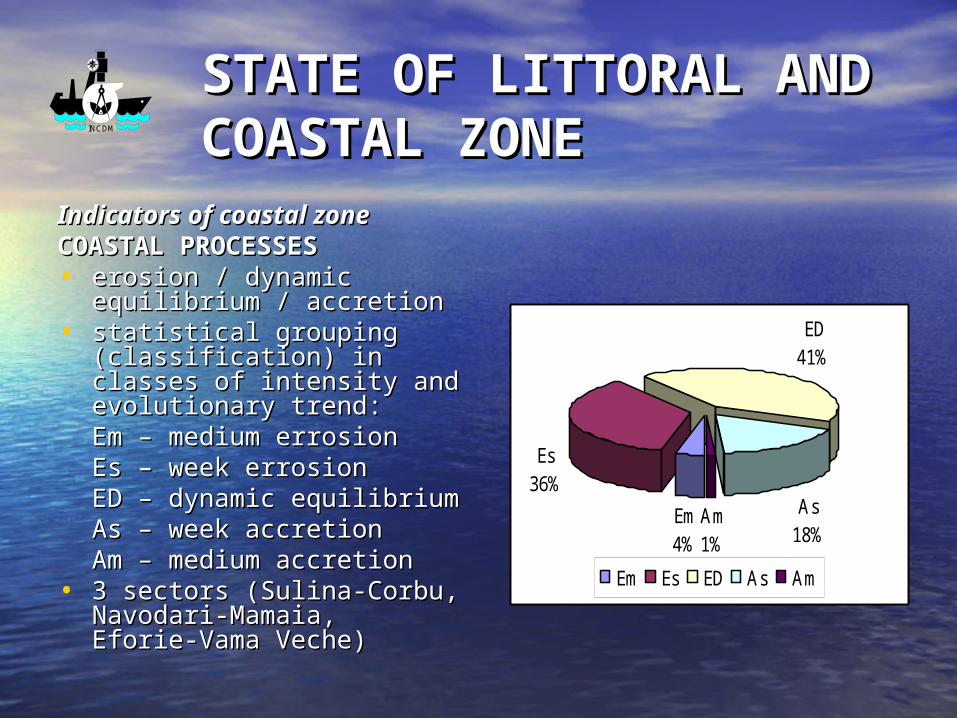
Indicators of coastal zoneIndicators of coastal zoneCOASTAL PROCESSESCOASTAL PROCESSES• erosion / dynamic equilibrium erosion / dynamic equilibrium
/ accretion/ accretion• statistical grouping statistical grouping
(classification) in classes of (classification) in classes of intensity and evolutionary intensity and evolutionary trend:trend:
EEmm – medium errosion – medium errosionEs – week errosionEs – week errosionEEDD – dynamic – dynamic
equilibriumequilibriumAs – week accretionAs – week accretionAm – medium Am – medium
accretionaccretion• 3 sectors (Sulina-Corbu, 3 sectors (Sulina-Corbu,
Navodari-Mamaia, Navodari-Mamaia, Eforie-Eforie-Vama Veche)Vama Veche)
Em4%
Es36%
ED41%
As18%
Am1%
Em Es ED As Am

INCDM SEA LEVELSEA LEVEL • very high values very high values
compared to reference compared to reference period 1933-2004period 1933-2004
• due to precipitations / due to precipitations / floods and increased floods and increased Danube flow Danube flow ((dischargedischarge))
• mean annual value in mean annual value in 2005 32.4 cm = 2005 32.4 cm = maximum annual mean maximum annual mean for whole period of for whole period of reference 1933-2004 reference 1933-2004 (100% higher than mean (100% higher than mean 1933-2004)1933-2004)
0
5
10
15
20
25
30
35
40
Ian Feb Mart Apr Mai Iun Iul Aug Sept Oct Nov Dec
cm
2005
1933-2004

INCDM SALINITYSALINITY
• e.ge.g.. Constanta: Constanta: significant deviations significant deviations from multiannual from multiannual values 19values 19996-2004 due 6-2004 due to abundant to abundant precipitions / increase precipitions / increase of Danube flow of Danube flow (discharge)(discharge)
• maximum: 19.49 g/l maximum: 19.49 g/l AprApr
• minimum: 6.9 g/l May, minimum: 6.9 g/l May, Jul, SepJul, Sep
6.00
8.00
10.00
12.00
14.00
16.00
18.00
Ian Feb Mar Apr Mai Iun Iul Aug Sep Oct Nov Dec
g/l
1966-2004
2005
INCDM DISSOLVED ODISSOLVED O22
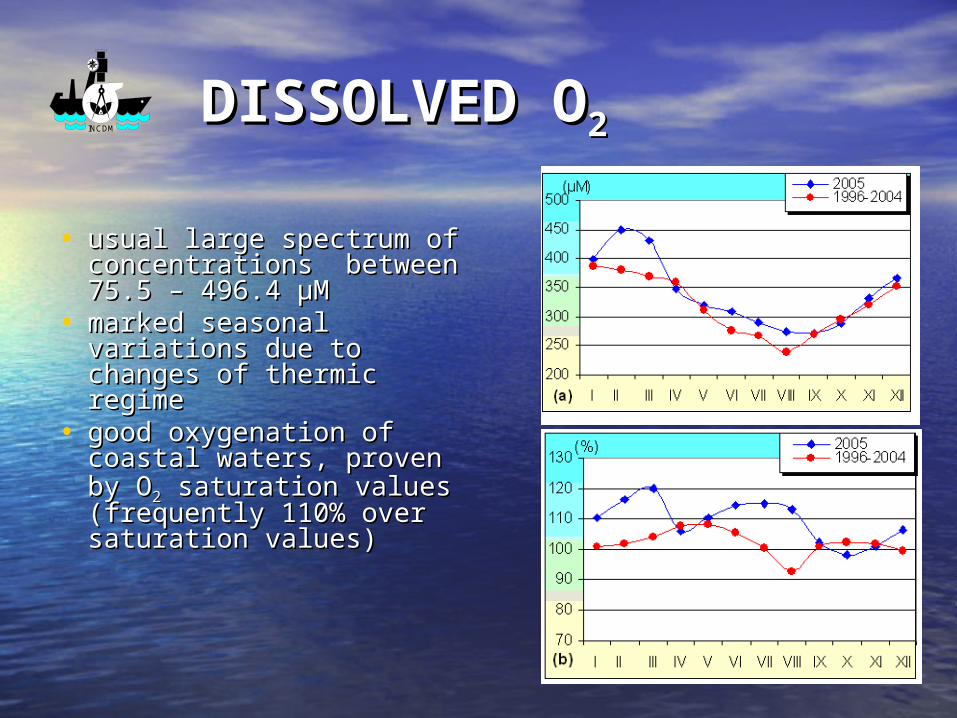
• usual large spectrum of usual large spectrum of concentrations concentrations between between 75.5 – 496.4 µM75.5 – 496.4 µM
• marked seasonal marked seasonal variations due to variations due to changes of thermic changes of thermic regimeregime
• good oxygenation ofgood oxygenation of coastal waters, proven coastal waters, proven by Oby O22 saturation values saturation values (frequent(frequentlyly 110% over 110% over saturation values)saturation values)

INCDM
Eutrophication Eutrophication indicatorsindicatorsNUTRIENTSNUTRIENTS• strongly influenced by Danube flow (discharge) of 271.8 kmstrongly influenced by Danube flow (discharge) of 271.8 km33
(compared to 1959-2004 multiannual (compared to 1959-2004 multiannual meanmean of 205.7 km of 205.7 km33) )
• increase of all nutrient concentrations (sometimes exceeding those increase of all nutrient concentrations (sometimes exceeding those betweenbetween 1996-2004) 1996-2004)
• total inorganic N:total inorganic N: < 8 µM compared to 1996-2004< 8 µM compared to 1996-2004
• P: mean annual level 0.54 µM P-POP: mean annual level 0.54 µM P-PO44 (twice higher than in 2004)(twice higher than in 2004)
• Si: <Si: < 3 µM than 2004 (mean concentration 14.9 µM Si-SiO3 µM than 2004 (mean concentration 14.9 µM Si-SiO44))
0.0 0.5 1.0 1.5
I II III IV V VI VII VIII IX X XI XII 2005 1996-2004
P-PO4 (µM)
0 10 20 30
I II III IV V VI VII VIII IX X XI XII 2005 1996-2004
Si-SiO4 (µM) 14.9 15.0 Medii anuale
0 10 20 30
I II III IV V VI VII VIII IX X XI XII 2005 1996-2004
Ntotal (µM)
21.14 13.34
Medii anuale 0.54 0.78
Medii anuale
INCDM CHLOROPHYLL CHLOROPHYLL aa
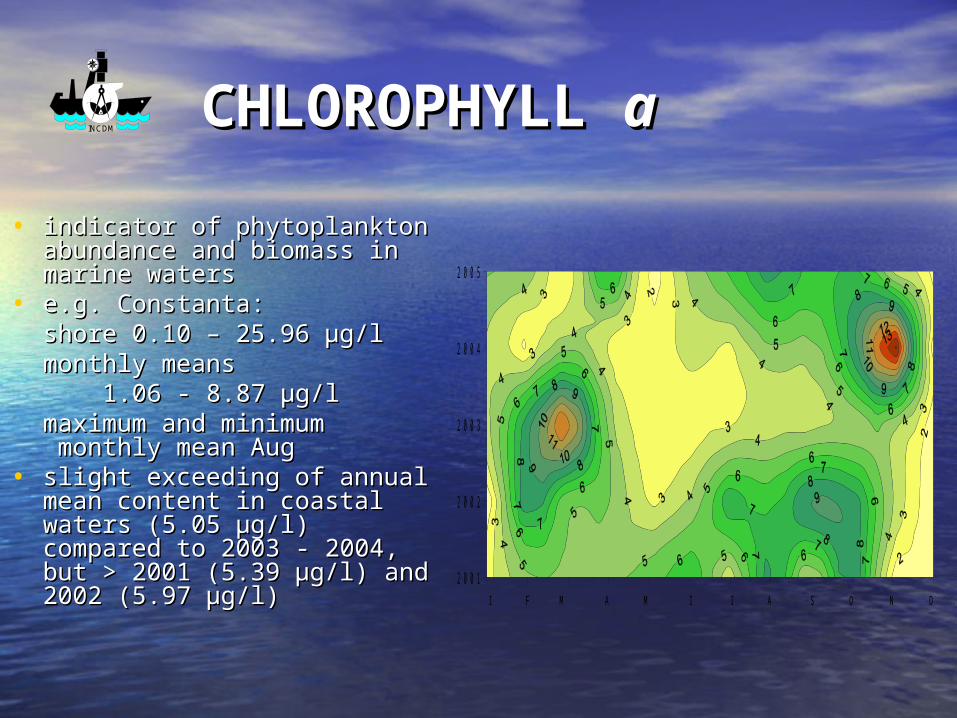
• indicator of phytoplankton indicator of phytoplankton abundance and biomass in abundance and biomass in marine watersmarine waters
• e.g. Constanta:e.g. Constanta:shore 0.10 – 25.96 µg/lshore 0.10 – 25.96 µg/lmonthly meansmonthly means 1.061.06 -- 8.87 µg/l 8.87 µg/l maximum and maximum and
minimumminimum monthly monthly mean Augmean Aug
• slight exceeding of annual slight exceeding of annual mean content in coastal mean content in coastal waters (5.05 µg/l) compared waters (5.05 µg/l) compared to 2003to 2003 -- 2004, but > 2001 2004, but > 2001 (5.39 µg/l)(5.39 µg/l) and 2002 (5.97 and 2002 (5.97 µg/l) µg/l)
2001
2002
2003
2004
2005
I F M A M I I A S O N D
INCDM
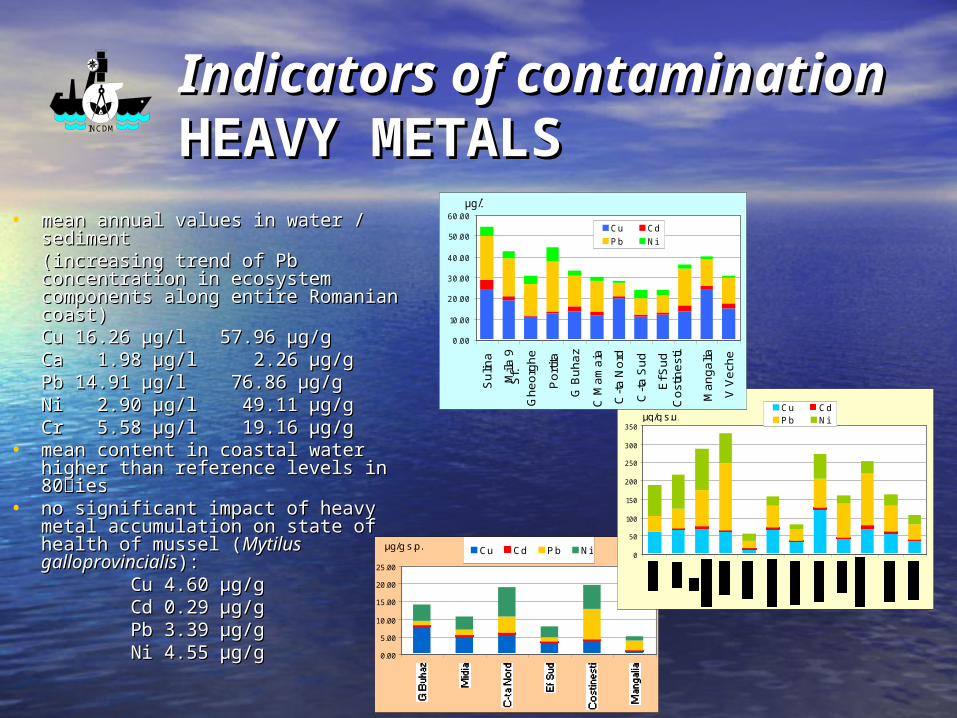
Indicators ofIndicators of ccontaminationontaminationHEAVY METALSHEAVY METALS
• mean mean annual values in water / annual values in water / sedimentsediment(increasing trend of Pb concentration (increasing trend of Pb concentration in ecosystem components along in ecosystem components along entire Romanian coast)entire Romanian coast)
Cu 16.26 µg/lCu 16.26 µg/l 57.96 µg/g57.96 µg/gCa 1.98 µg/lCa 1.98 µg/l 2.26 µg/g 2.26 µg/gPb 14.91 µg/lPb 14.91 µg/l 76.86 µg/g76.86 µg/gNi 2.90 µg/lNi 2.90 µg/l 49.11 µg/g49.11 µg/gCr 5.58 µg/lCr 5.58 µg/l 19.16 µg/g19.16 µg/g
• mean content in mean content in coastalcoastal water water higher than reference levels in higher than reference levels in 8080ۥۥ iesies
• no significant impact of heavy metal no significant impact of heavy metal accumulation on state of health of accumulation on state of health of mussel (mussel (Mytilus galloprovincialisMytilus galloprovincialis): ):
Cu 4.60 µg/gCu 4.60 µg/g Cd 0.29 µg/gCd 0.29 µg/g PbPb 3.39 µg/g3.39 µg/g Ni 4.55 µg/gNi 4.55 µg/g
0.00
5.00
10.00
15.00
20.00
25.00
µg/g s.p. Cu Cd P b Ni0
50
100
150
200
250
300
350µg/g s.u.
Cu CdP b Ni
0.00
10.00
20.00
30.00
40.00
50.00
60.00
Su
lina
Mila
9S
f.G
he
org
he
Po
rtita
G B
uh
az
C M
am
aia
C-t
a N
ord
C-t
a S
ud
Ef S
ud
C
ost
ine
sti
Ma
ng
alia
V V
ech
e
µg/l
Cu CdP b Ni
INCDM
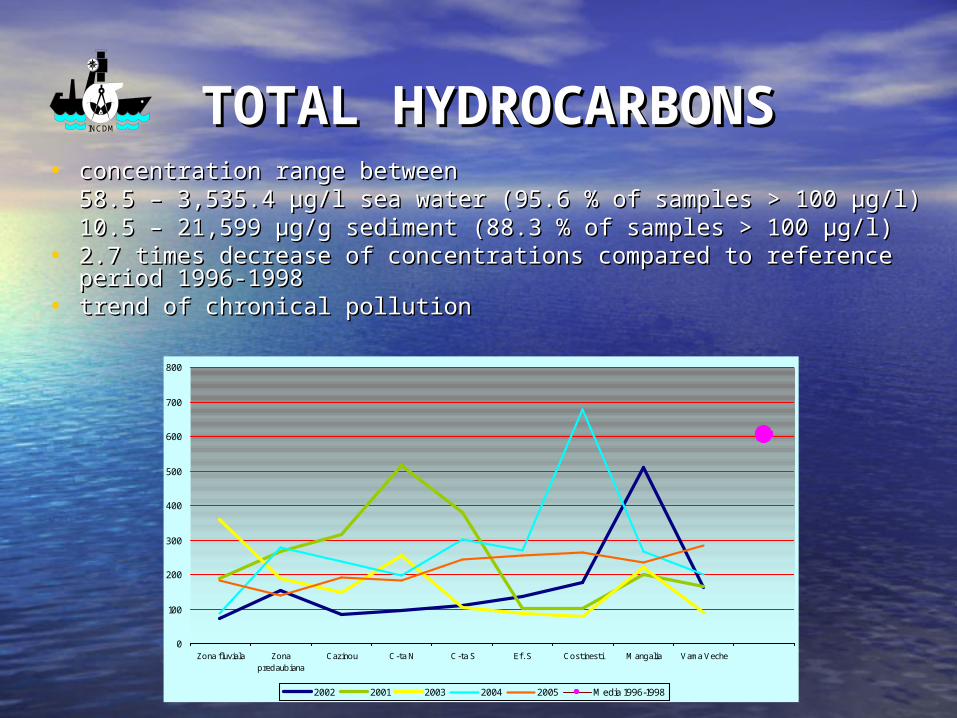
TOTAL TOTAL HYDROCARBONSHYDROCARBONS
• concentration range betweenconcentration range between58.5 – 3,535.4 µg/l sea58.5 – 3,535.4 µg/l sea waterwater (95.6 % of samples > 100 (95.6 % of samples > 100 µg/lµg/l))10.5 – 21,599 µg/g sediment10.5 – 21,599 µg/g sediment (88.3 % of samples > 100 (88.3 % of samples > 100 µg/lµg/l))
• 2.7 times decrease of concentrations compared to reference period 2.7 times decrease of concentrations compared to reference period 1996-19981996-1998
• trend of chronical pollutiontrend of chronical pollution
0
100
200
300
400
500
600
700
800
Zona fluviala Zonapredaubiana
Cazinou C-ta N C-ta S Ef. S Costinesti Mangalia Vama Veche
2002 2001 2003 2004 2005 Media 1996-1998

INCDM
POLYAROMATIC POLYAROMATIC HYDROCARBONS HYDROCARBONS (PAHs)(PAHs)
• high variation range of concentrations high variation range of concentrations
• increase of total PAHs in seaincrease of total PAHs in sea water along the water along the southernsouthern coast between 2003-2005coast between 2003-2005
• increase of 9.9 times in seaincrease of 9.9 times in sea water and 4.6 times water and 4.6 times inin sediments in 2005 compared to 2004,sediments in 2005 compared to 2004, in some in some locationslocations

INCDM
ORGANOCHLORINE ORGANOCHLORINE PESTICIDES (OCPs)PESTICIDES (OCPs)
• occurence of high variety occurence of high variety of OCPs of OCPs
• usual concentrations up to:usual concentrations up to:1 µg/l in sea water1 µg/l in sea water1 µg/g in dry 1 µg/g in dry
sedimentsediment• occasional higher occasional higher
concentrationsconcentrations (up to 7.95 (up to 7.95 µg/l at Mangalia)µg/l at Mangalia)
• up to 2 times higher up to 2 times higher values in sea water in values in sea water in 2005 (compared to 2003-2005 (compared to 2003-2004), possibly due to 2004), possibly due to major floodsmajor floods
• concentrations up to 2 concentrations up to 2 µg/g dry weight in marine µg/g dry weight in marine bivalves bivalves
Gura Buhaz Midia
ConstantaNord Eforie S
Costinesti Mangalia
0
2
4
6
8
10
12
ug
/g t
esu
t u
scat
HCB Heptaclor Aldrin
Diledrin p,p' DDE p,p' DDD
p,p' DDT Lindan Endrin

INCDM
STATE OF MARINE STATE OF MARINE ECOSYSTEMECOSYSTEM
Indicators of eutrophicationIndicators of eutrophicationPHYTOPLANKTONPHYTOPLANKTON• 178 species / 7 178 species / 7 taxonomic taxonomic groupsgroups
6969 % Diatoms% Diatoms2222 % Dinoflagellates +% Dinoflagellates + ChlorophytaChlorophyta 99 % Others% Others
• marine + marinemarine + marine--brackishbrackishwaterwater58%58%
freshwater + freshwaterfreshwater + freshwater- - brackishwaterbrackishwater 42%42%
• density 6 times lower and density 6 times lower and biomass 3.6 times lower than biomass 3.6 times lower than multiannual mean value for multiannual mean value for 1983-19901983-1990
0
2
4
6
8
10
12
1983
1984
1985
1986
1987
1988
1989
1990
1991
1992
1993
1994
1995
1996
1997
1998
1999
2000
2001
2002
2003
2004
2005
0
2
4
6
8
10
12
14
16
18
Densitate Biomasa
Den
sita
te (x
106 c
el/l)
INCDM
PHYTOPLANKTONIC PHYTOPLANKTONIC BLOOMSBLOOMS
• reduced, both numerically and as number of mass reduced, both numerically and as number of mass speciesspecies
• 6 blooms > 5 million cells/l 6 blooms > 5 million cells/l 4 > 10 million cells/l (2 in 2004)4 > 10 million cells/l (2 in 2004)
• dominant speciesdominant speciesAphanizomenon flos-aquae Aphanizomenon flos-aquae (45 mill. cells/l)(45 mill. cells/l)Microcystis orae Microcystis orae (200 mill. cells/l)(200 mill. cells/l)Cyclotella caspia Cyclotella caspia (19 mill. cells/l)(19 mill. cells/l)
INCDM
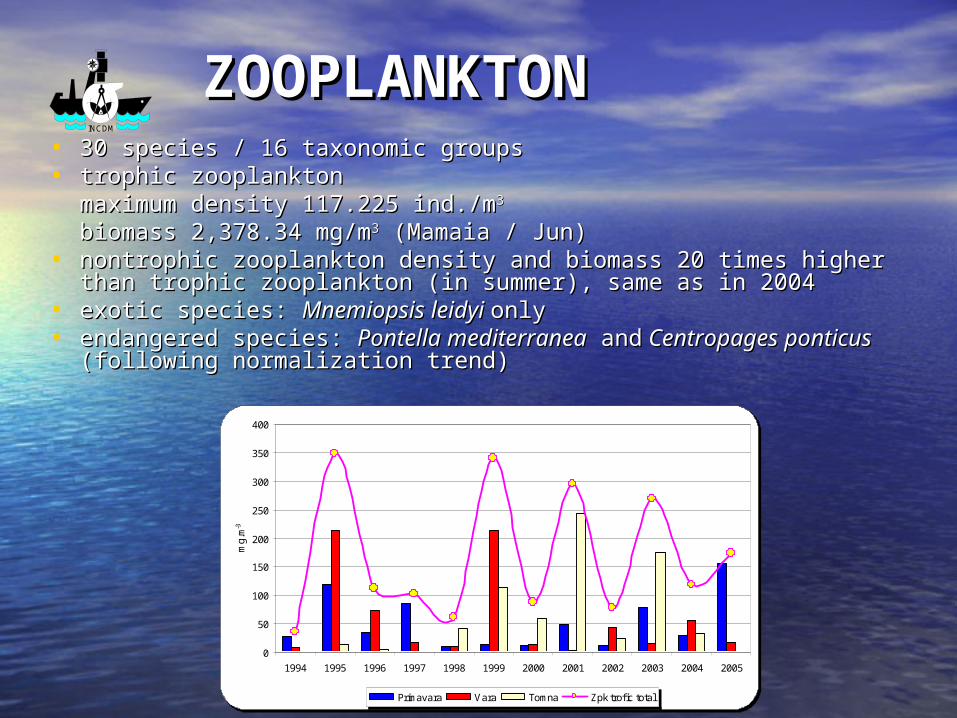
ZOOPLANKTONZOOPLANKTON• 30 species / 16 taxonomic groups 30 species / 16 taxonomic groups • trophic zooplanktontrophic zooplankton
maximum density 117.225 ind./mmaximum density 117.225 ind./m33
biomass 2,378.34 mg/mbiomass 2,378.34 mg/m33 (Mamaia / Jun) (Mamaia / Jun)• nontrophic zooplankton density and biomass nontrophic zooplankton density and biomass 20 20 times higher times higher
than trophic zooplanktonthan trophic zooplankton (in summer)(in summer), same as in 2004, same as in 2004• exotic species: exotic species: Mnemiopsis leidyi Mnemiopsis leidyi onlyonly• endangered species: endangered species: Pontella mediterraneaPontella mediterranea and and Centropages Centropages
ponticusponticus (following normalization trend) (following normalization trend)
0
50
100
150
200
250
300
350
400
1994 1995 1996 1997 1998 1999 2000 2001 2002 2003 2004 2005
mg.
m-3
Primavara Vara Tomna Zpk trof ic total
INCDM
MACROPHYTOBENTHMACROPHYTOBENTHOSOS • 33 species33 species
16 Chlorophyta16 Chlorophyta 5 Phaeophyta5 Phaeophyta10 Rhodophyta10 Rhodophyta 2 Phanerogama 2 Phanerogama
• biomasses biomasses e.g. / e.g. / EnteromorphaEnteromorpha 13.22 g fresh weight/m13.22 g fresh weight/m22
CladophoraCladophora 5.395.39CeramiumCeramium 18.918.9PolysiphoniaPolysiphonia 12.7712.77
• sporadic occurence of sporadic occurence of DesmarestiaDesmarestia (exotic brown alga) (exotic brown alga)• reappearance of red algae reappearance of red algae LomentariaLomentaria (Vama Veche) (Vama Veche)
and and PhyllophoraPhyllophora (Constanta) (Constanta)• considerable development / deposits of strandedconsiderable development / deposits of stranded
macrophytes, up to 15-350 mmacrophytes, up to 15-350 m33 dry weight, along dry weight, along southern littoral between Jun-Julsouthern littoral between Jun-Jul

INCDM ZOOBENTHOSZOOBENTHOS • 60 (comparative to 41-60 (comparative to 41-
55 species between 55 species between 2003-2005, or to 16-28 2003-2005, or to 16-28 species in early species in early 9090ۥۥ ies !), ies !), at 5 to 20 m depths at 5 to 20 m depths
• increases of about 29 increases of about 29 times of mean density times of mean density and 9 times of mean and 9 times of mean biomass values, biomass values, respectively, compared respectively, compared to 2004 to 2004
• dominance of small and dominance of small and medium sized medium sized individuals of mussel (individuals of mussel (M.M. ggalloproallopro--vincialisvincialis), and ), and occurence of highoccurence of high sized sized ones (northern sector)ones (northern sector)
0
10
20
30
40
50
60
num
ar s
peci
i
1990-93 2003 2004 2005
perioada
INCDM
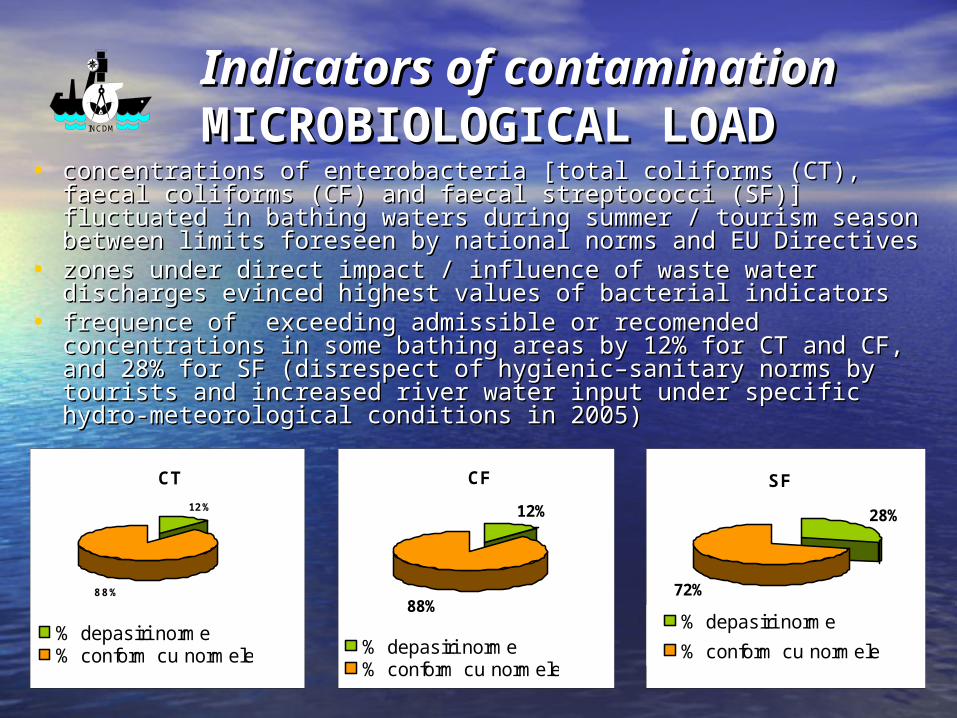
Indicators of Indicators of contaminationcontaminationMICROBIOLOGICAL LOADMICROBIOLOGICAL LOAD • concentrations of enterobacteriaconcentrations of enterobacteria [ [total coliforms (CT), faecal total coliforms (CT), faecal
coliforms (CF) and faecal streptococci (SF)coliforms (CF) and faecal streptococci (SF)] ] fluctuated in bathing fluctuated in bathing waters during summer / tourism season between limits foreseen waters during summer / tourism season between limits foreseen by national normby national normss and E and EUU Directives Directives
• zones under direct impact / influence of waste waterzones under direct impact / influence of waste water discharges discharges evinced highest values of bacterial indicatorsevinced highest values of bacterial indicators
• frequence of frequence of exceeding admissible or exceeding admissible or recomrecomeended nded concentrations in some bathing areas by 12% for CT and CF, and concentrations in some bathing areas by 12% for CT and CF, and 28% for SF (disrespect of hygienic–sanitary norms by tourists and 28% for SF (disrespect of hygienic–sanitary norms by tourists and increased river water input under specific hydro-meteorological increased river water input under specific hydro-meteorological conditions in 2005)conditions in 2005)
CT
12%
88%
% depasiri norme% conform cu normele
CF
12%
88%
% depasiri norme% conform cu normele
SF
28%
72%
% depasiri norme
% conform cu normele
INCDM
STATE OF ENDANGERED STATE OF ENDANGERED SPECIES SPECIES
Indicators for biodiversity and Indicators for biodiversity and habitatshabitats
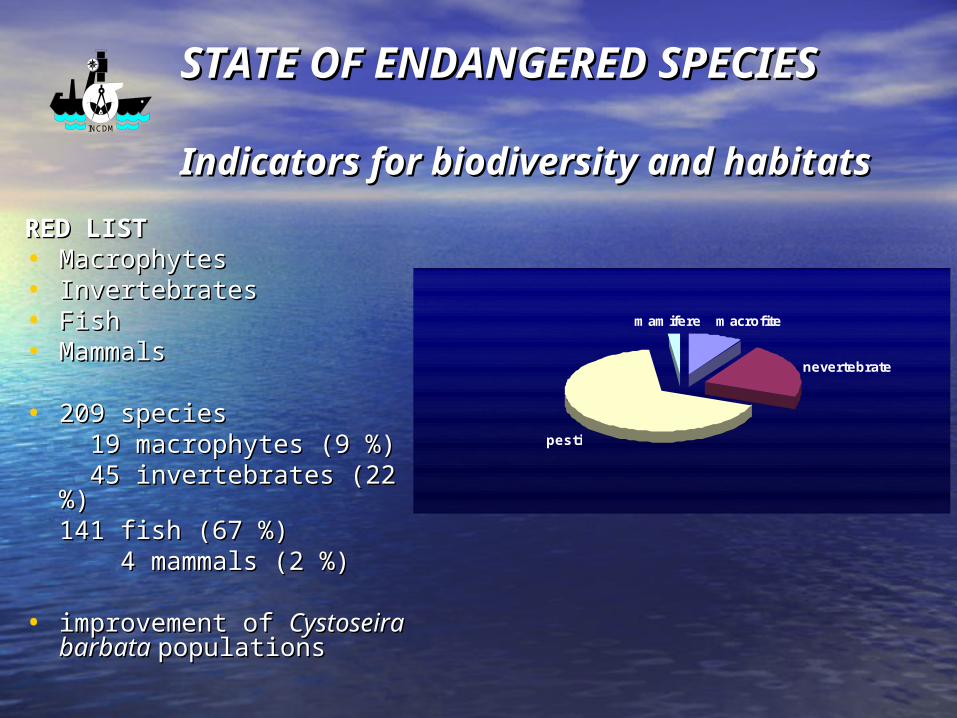
RED LISTRED LIST• Macrophytes Macrophytes • InvertebratesInvertebrates• FishFish• MammalsMammals
• 209 species209 species 19 macrophytes (919 macrophytes (9
%)%) 45 invertebrates (2245 invertebrates (22
%)%)141 fish (67141 fish (67 %)%) 4 mammals (24 mammals (2 %)%)
• improvement of improvement of Cystoseira Cystoseira barbata barbata populationspopulations
macrofite
nevertebrate
pesti
mamifere
INCDM
BIODIVERSITY AND BIODIVERSITY AND HABITATSHABITATS
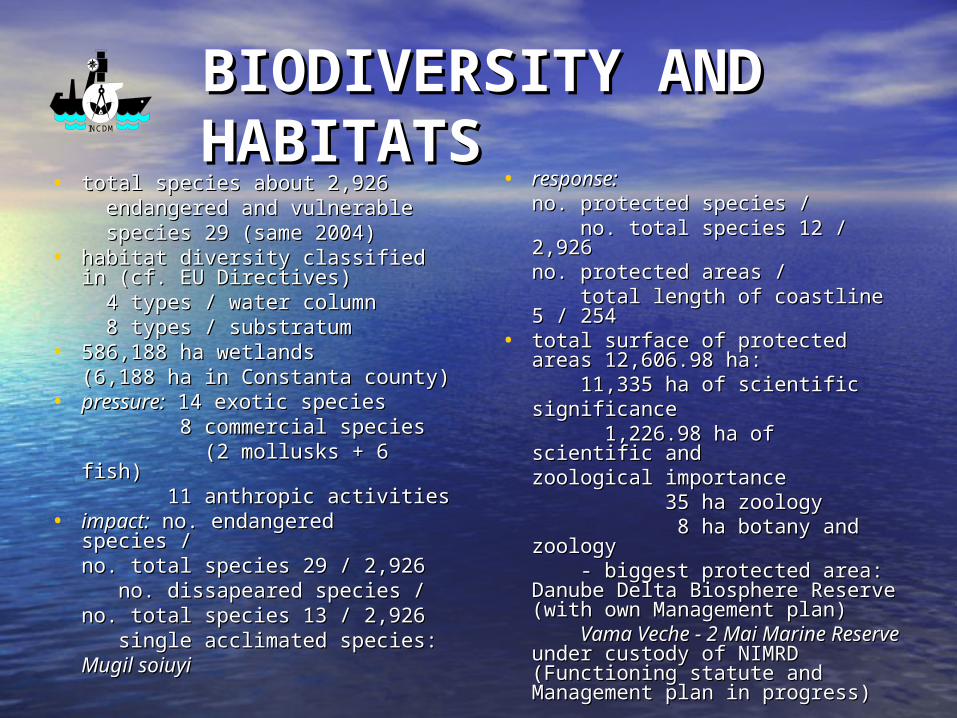
• total species abouttotal species about 2,9262,926 endangerendangereed and vulnerabled and vulnerable species 29species 29 (same 2004) (same 2004)
• habitat diversity classifiedhabitat diversity classified in in (cf. EU (cf. EU Directives)Directives) 4 types / water column4 types / water column 8 types / substratum8 types / substratum
• 586,188 ha wetlands586,188 ha wetlands(6,188 ha in Constanta county)(6,188 ha in Constanta county)
• pressure:pressure: 14 exotic species14 exotic species 8 commercial species8 commercial species (2 mollusks + 6 fish)(2 mollusks + 6 fish) 11 anthropic activities11 anthropic activities
• iimpactmpact:: no. endangered speciesno. endangered species / / nno. total species 29o. total species 29 // 22,,926926 no. dissapeared speciesno. dissapeared species / / no. total species 13no. total species 13 // 22,,926926 single acclimated speciessingle acclimated species::Mugil soiuyiMugil soiuyi
• response:response:no. protected speciesno. protected species / /
no. total speciesno. total species 1212 // 2,9262,926no. protected areasno. protected areas / /
total length of coastlinetotal length of coastline 55 // 254254
• total surface of protected areastotal surface of protected areas 12,606.98 ha12,606.98 ha:: 11,335 ha of scientific11,335 ha of scientific
significancesignificance 1,226.98 ha of scientific and1,226.98 ha of scientific and
zoological importancezoological importance 35 ha zoology35 ha zoology 8 ha botany and zoology8 ha botany and zoology - - biggest protected area: biggest protected area: Danube Delta Biosphere Danube Delta Biosphere ReserveReserve (with own Management (with own Management plan)plan) Vama Veche - 2 Mai Marine Vama Veche - 2 Mai Marine ReserveReserve under custody of under custody of NIMRD (NIMRD (FFunctioning statute and unctioning statute and Management plan in progress)Management plan in progress)

INCDM
STATE OF FISH STOCKSSTATE OF FISH STOCKS
Indicators for living Indicators for living resourcesresources
• STATESTATE• stock biomassstock biomass
sprat 60,000 tsprat 60,000 t (>2003-2004 / 45,000 (>2003-2004 / 45,000 t)t)
• intensity of reproductionintensity of reproduction estimated relativeestimated relative abundanceabundance of spratof sprat eggs, betweeneggs, between 1995-1995- 2005,2005, 0.2890.289xx101099 to to 178.651178.651xx101099
• population structure population structure 25 species25 species (17 for industrial fishing)(17 for industrial fishing)
0
500
1000
1500
2000
2500
tone
Capturatotala
Sprot Hamsie Bacaliar Alose Stavrid Calcan Gobiide Aterina Lufar Barbun Gingirica Sturioni
2001
2002
2003
2004
2005
INCDM
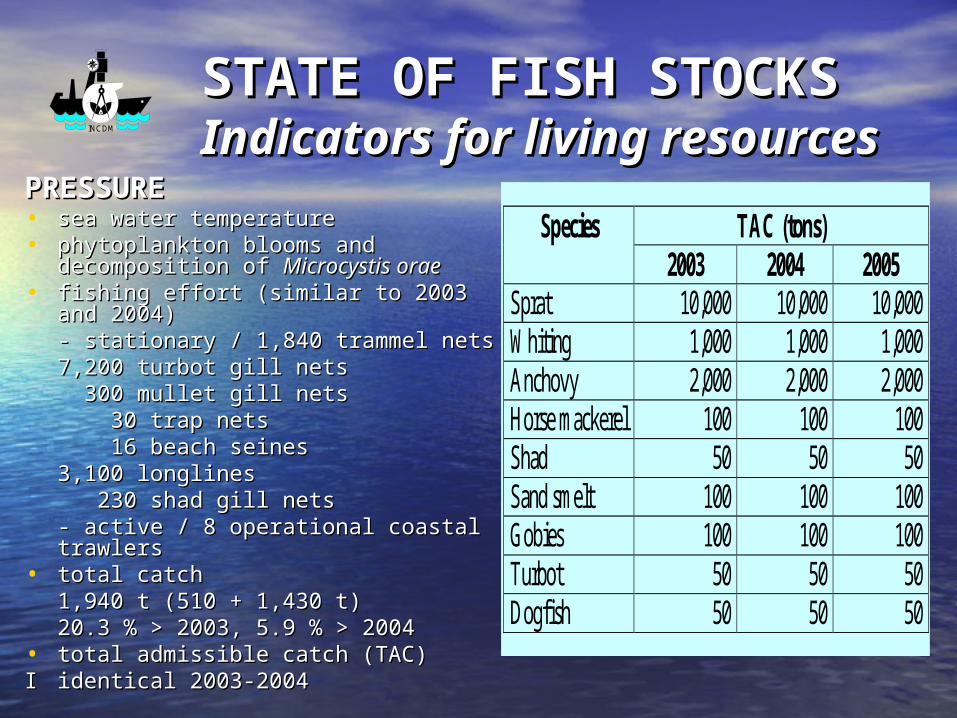
STATE OF FISH STOCKSSTATE OF FISH STOCKSIndicators for living Indicators for living resourcesresourcesPRESSUREPRESSURE
• sea water temperaturesea water temperature• phytoplankton phytoplankton blooms blooms and and
decomposition of decomposition of Microcystis oraeMicrocystis orae• fishing effort (similar to 2003 and fishing effort (similar to 2003 and
2004)2004)- - stationary / 1stationary / 1,,840 trammel nets840 trammel nets
77,,200 turbot gill nets200 turbot gill nets 300 300 mulletmullet gill nets gill nets 30 trap nets30 trap nets 16 beach seines16 beach seines33,,100 longlines100 longlines 230 shad gill nets230 shad gill nets
- - active / 8 operational coastal active / 8 operational coastal trawlerstrawlers
• total catchtotal catch1,940 t (510 + 1,430 t)1,940 t (510 + 1,430 t)20.320.3 % > 2003, 5.9% > 2003, 5.9 % > 2004% > 2004
• total admissible catch (TAC)total admissible catch (TAC)II iidentical 2003-2004dentical 2003-2004
TAC (tons) Species 2003 2004 2005
Sprat 10,000 10,000 10,000 Whiting 1,000 1,000 1,000 Anchovy 2,000 2,000 2,000 Horse mackerel 100 100 100 Shad 50 50 50 Sand smelt 100 100 100 Gobies 100 100 100 Turbot 50 50 50 Dogfish 50 50 50
INCDM
CONCLUSIONCONCLUSIONSS
• SState and evolution trends of tate and evolution trends of Romanian Black Sea coastal Romanian Black Sea coastal environment continued to be environment continued to be monitored in 2005 from monitored in 2005 from physical, chemical and physical, chemical and biological point of view biological point of view compared with reference compared with reference periods dating back in early periods dating back in early 6060ۥۥ ies or more recent ies or more recent yearsyears
depending on parametres.depending on parametres.• Coastal processes during the Coastal processes during the
geomorphological cycle 2004-geomorphological cycle 2004-2005 have been dominated by 2005 have been dominated by dynamic equilibrium (41%) and dynamic equilibrium (41%) and erosion (40%) compared to erosion (40%) compared to accretion (19%).accretion (19%).
• Sea level indicated very high Sea level indicated very high values compared to reference values compared to reference period 1933-2004, in period 1933-2004, in correlation correlation with with precipitations, precipitations, floods and increased Danube floods and increased Danube flow flow ((dischargedischarge))
• Considerable decrease of Considerable decrease of salinity in May, July and salinity in May, July and September much below usual September much below usual limits relates as well to limits relates as well to increase of Danube flow.increase of Danube flow.
• Nutrient (N, PNutrient (N, P,, Si) and Si) and chlorophyll chlorophyll aa concentrations, concentrations, major indicators of major indicators of eutrophication, increased eutrophication, increased compared to last years, compared to last years, occasionally exceeding those occasionally exceeding those between 1996-2004, due to between 1996-2004, due to above mentioned reason.above mentioned reason.
• Some indicators of Some indicators of contamination, such as heacontamination, such as heavvy y metals, total hydrocarbons, metals, total hydrocarbons, PAHs and OCPs exceeded PAHs and OCPs exceeded occasionaly previously occasionaly previously encountered reference encountered reference concentrations.concentrations.
INCDM
CONCLUSIONCONCLUSIONS S (cont’d)(cont’d)
• Bioaccumulation of contaminants Bioaccumulation of contaminants in edible bivalve mollusks did not in edible bivalve mollusks did not affect their state of health.affect their state of health.
• SSlight improvement of light improvement of state of state of marine ecosystem signaled end marine ecosystem signaled end 9090ۥۥ ies, beginning 2000, continued ies, beginning 2000, continued
to be proved by: to be proved by: – decrease of phytoplankton decrease of phytoplankton
densities / biomasses and densities / biomasses and related blooms,related blooms,
– comparable densities / comparable densities / biomasses of biomasses of Centropages Centropages ponticusponticus with those prior to with those prior to eutrophication,eutrophication,
– reinstallment of reinstallment of Cystoseira Cystoseira barbatabarbata belts off Vama Veche, belts off Vama Veche,
– increase of macrozoobenthic increase of macrozoobenthic specific diversity (up to 60 specific diversity (up to 60 species compared to fewer species compared to fewer number in number in 9090ۥۥ ies till 2004).ies till 2004).
• Concentrations of enterobacteria Concentrations of enterobacteria (total coliforms, faecal coliforms, (total coliforms, faecal coliforms, faecal streptococci) exceeded faecal streptococci) exceeded between 12 tobetween 12 to
28% national and EC previsions, 28% national and EC previsions, due todue to certain local disrespect of certain local disrespect of hygienic-sanitary norms and hygienic-sanitary norms and specific hydro-meteorological specific hydro-meteorological conditions.conditions.
• Revised Red List of macrophytes, Revised Red List of macrophytes, invertebrates, fish and invertebrates, fish and mammals totalized same 209 mammals totalized same 209 species as in 2004.species as in 2004.
• Biodiversity and habitats Biodiversity and habitats continued to be characterized by continued to be characterized by specific decision indicators (state, specific decision indicators (state, pressure, impact, response).pressure, impact, response).
• SState of living resources tate of living resources / / fish fish stocks has been surveyed taking stocks has been surveyed taking into consideration evolution of into consideration evolution of state, pressure and impact state, pressure and impact indicators.indicators.
• New versus historical reference New versus historical reference data concerning present state data concerning present state and evolution trends of the and evolution trends of the Romanian coastal environment Romanian coastal environment do constitute contributions for a do constitute contributions for a joint „Report on the state of the joint „Report on the state of the Black Sea”.Black Sea”.

INCDM
Thank you for your Thank you for your attention!attention!