presence of informed trading in options markets: an
TRANSCRIPT
Journal of Business & Leadership: Research, Practice, and Journal of Business & Leadership: Research, Practice, and
Teaching (2005-2012) Teaching (2005-2012)
Volume 1 Number 1 Journal of Business & Leadership Article 4
1-1-2005
Presence of Informed Trading In Options Markets: An Experiment Presence of Informed Trading In Options Markets: An Experiment
Using Monte Carlo Simulation Using Monte Carlo Simulation
Rafiqul Bhuyan California State University, Sacramento
Mohammad Robbani Alabama A&M University
Yuxing Van University of Pennsylvania
Follow this and additional works at: https://scholars.fhsu.edu/jbl
Part of the Business Commons, and the Education Commons
Recommended Citation Recommended Citation Bhuyan, Rafiqul; Robbani, Mohammad; and Van, Yuxing (2005) "Presence of Informed Trading In Options Markets: An Experiment Using Monte Carlo Simulation," Journal of Business & Leadership: Research, Practice, and Teaching (2005-2012): Vol. 1 : No. 1 , Article 4. Available at: https://scholars.fhsu.edu/jbl/vol1/iss1/4
This Article is brought to you for free and open access by the Peer-Reviewed Journals at FHSU Scholars Repository. It has been accepted for inclusion in Journal of Business & Leadership: Research, Practice, and Teaching (2005-2012) by an authorized editor of FHSU Scholars Repository.

Jo urnal of Business and Leadership : Research. Practi ce. and Teachin g 2005. Vol. I . No. I . 23 -29 -
PRESENCE OF INFORMED TRADING IN OPTIONS MARKETS: AN EXPERIMENT USING MONTE CARLO SIMULATION
Rafiqul Bhuyan, Californi a State Uni versity, Sacramento Mohammad Robbani. Alabama A&M University Yuxing Yan, University of Pennsylvani a
Using Monte Carlo Simulation we sltow that informed trading take place in the options market. Our results indicate that at-the-money option contracts are less likely to be information based trades. Using B/ack-Sclwles model to evaluate call and put options, we find that with positive and negative information shocks, informed investors are better off trading out-of-the-money and/or in-the-money-options. This is clear evidence that investors with inside or superior information would take advantage of options' leverage effect, Black (1975). Our analysis sheds light on the direction to revisit the models proposed by Easley et a/ ( 1998) and Chan eta/ (2002). We argue that, to e.xamine the role of option volume, the out-ofthe-money anll/or in-the-money option volumes should be considered as well.
Introduction
The ori gin of the informati on models can be traced back in 19 7 1. Bagehot ( 197 1 ). Informati on production is costly. So producers of informati on (a lso kn O\\n as traders with superi or informati on) trade in financi a l mark ets with uninformed traders and/or market makers. The loss. for uninformed traders, ari sin g from the trades with informed traders is the ga in for the latter to recoup the cost of informati on producti on.
The effect of informati on takes on added dimens ion \\hen there are multiple fin ancial markets ( like stock market. option market. and futures market) and multiple types of sec urities (like stock. ca ll option wi th different strike prices. ana put opti011 with different strike pri ces. ca ll and put options of different maturi ties, and futures contract etc) . The market with the ex istence of informati on asymmetries reach es eq uilibrium in terms of all related securities in a sequential manner. That is. the true market price wi ll not be di scovered until all market participants· expectations are factored in. The presence of multiple markets may make the equi librium process a little longer. Even though informati on may be public in one market. it may sti II remain unexpl ored by many market partic ipants. and sec uri ty prices in other related market may not reflect all public informat ion.
The interest of research in thi s paper is to address the presence of informati on in option markets by usin g option vo lume and maturi ty and its impact on underlying sec urities for the maturity date. Current literature prov ides a mi xed result regardin g the information in different markets. lead-l ag re lationship between markets. and reflecti on of information tradin g.
Chan. Chung and Fong (2 002) and Eas ley, O'Hara
23
and Srini vas ( 1998) prov ide the first step investigatin g the role of vo lume in options markets and complements researc h by Blume, Eas ley and O' Hara ( 1994) on the in formation content of vo lume in eq uity markets. Eas ley et al. ( 1998). Cher i an ( 1998). Cheri an and Jarrow ( 1998). Cheri an and Villa (1997). Back ( 1993). Kraus and Smith ( 1996), and John et al. (2000), find that informed traders mi ght trade in th e options market first . Manaster and Rendl eman ( 198:?.) . Bhattac harya ( 1987), and Anthony ( 1988) present ev idence that the options market leads the stock market in term s of both pri ce movements and trad in g ac ti vity. Easley et al. ( 1998) show that positive options vo lume and negati ve options vo lume have predicti ve power co ncerning the movement of the underl yin g stock. Cao. Chen, and Griffin (2003) show that firm s that have experi enced takeover ann ouncements, higher pre-announcement vo lume on ca ll options is predicti ve of hi gher takeove r premium s. There is not much ev idence that during normal time option vo lume predicts under lyin g stoc k prices. Sandeep Sri vastava (2 003) shows ev id ence that option vo lume improves the price di scovery in underl yin g asset market in India.
Pam and Poteshm an (2004) find strong evidence that option tradin g vo lum e conta in s informat ion about future stock price move ments. Chae (200 5) find s ev idence of a decrease in the leve l of vo lume befo re scheduled announcement and fo ll owed by an increase after the scheduled an nouncements. Eas ley, 0' Hara and Sri ni vas ( 1998), also find some differin g result that overall total vo lume from the op ti on market has no predi ctive power. Chan. Chun g and Fong (200:?.) find that option net vo lume has no incremental predicti ve abili ty suggesting that in fo rmed in vestors initi ate trades
1
Bhuyan et al.: Presence of Informed Trading In Options Markets: An Experiment Us
Published by FHSU Scholars Repository, 2005

Ohu~an . Robbani . and Yan
in tod marl-.e ts but not in options markets. Th e purpose of thi s resea rch is to e~p l o re . the
informati on content of the trading ac t1 v1t1es 111 o ptl o ~ s markets and to e:-.a mine the prese nce of informati on 111 opti on mark et and types of in struments that can hold inform ati on.
lnfot·matio n Search
\\ 'e de\ elop several scenarios to analyze the informati on cont ems of option trades. T\\ O iss ues \\ e b1·inQ in to di cuss ion to add ress our question : (I) simp le trad; and (2) mone) ness of the trade . Si mple trade focu ses on the total vo lume attac hed in eac h trade.
Wh ere as. mone yness add resses the va lue attached
Journal of Business and Leadersh ip: Research. Practice. and Teac hing
to the vo lume at eac h strike and its ro le in ana lyz ing information. Consider that a stoc k is currently trad in g at $50 (S=SO) in a stoc k market. and there are ca ll and put opt ions ava ilab le in the options markets with only 3 exercise pri ces. K1=$40. K2=$SO. and K:;= $60. Here. K1 < K, < K :;. In term s of ca ll options, these options with d i ff;re nt ~trik es are known as In -the- money (ITM ). Atthe- money (A TM ). and Out-of-the-Money (OTM ). respec ti ve ly. For put options. however. the order is just the oppos ite while keeping th e A TM as same as ca ll option .
There are four poss ible scenari os co nsidered for simp le trades . From da il y trading. option vo lumes at eac h strike of ca ll and put option can be generated and are shown in tabl e I.
Table 1: Scenario Analys is for Volumes of Call Option a nd Put Option at Different Strike Prices
Call Ontio n 'Iarke !
~ c.:nan o I Volume
at (K- 60) - I I' Vo lume at ( f-. 50) I 00 V olume at (K -1 0) 1 00 ~ ccnari o 2 Volume 31 (K- 60) -100 Vo lume at (K = 50) = 10 Vo lume at (K- 40) - I 0 '-; c cn:-~n o J Volu me at (K- 60) - 10 Vol ume at (K- 50) 100 Vo lume 3t (K -1 0) I 0 'i cenano -1 Volume at (K- 601- 10 \ o lume at (K- 50) 10 Vol ume at (K -1 0) 1 00
Put 0 to on \I arke!
S ce nano A Volume at (K= 60) = I 00 Volume at (K= 50) = 100 Vo lume at (K= -1 0) = I 00 ~cenano B Volume at (K= 60) = 100 Vol ume at (K= 50) = 10 Vo lume at ( K= -1 0) = I 0 ~ce naro o C Volume at (K= 60) = 10 Volume at (K= 50 ) = I 00 V olum e at (K= -1 0) = 10 Scenano D Volume at (K= 60) = 10 Vol ume at (K= 50) = 10 Vo lu me at (K= -1 0) = I 00
In a ca ll option mark et. scenari o I imp lies that th ere are eq ual num bers of \ Olum e of options traded at eac h o, tril-. e p1 ·ice . Loo kin g at the di stributi on of option \ olum e. it appears that there is no majority in Yo lume at any strike price that may contain some informati on. lll\·es tors are equa lly divi ded in terms of ex pected pr ice of th e un der lying for the matu rity date. So vo lume at ATM has the same ex pectati ons as vo lume at ITM and OTM. The same conc lu sion can be drawn from th e \ Oium es in put option market in scenari o A as we ll. Both markets perhaps provide no inform ati on based trad ing. Acco rding to Eas ley et al ( 1998) and Chan et al (2002). the defin ition of tota l \'Oiu me is th e vo lum e attached to th e at-the-mo ney strik e and th e economic meanin g of our \'Oium e and th at of Ea ley et al ( 1998) and Chan et al (2002) \\ Ould imp ly be the same- no infor mati on.
Scenari o 2 in a ca ll opti on market is interestin g and perhaps informative It shows th at the re are I 00 opti on \ olume at OT M str ike whi ch is significantly hi gher than those of A TM and ITM. Thi s heavy ac ti vity in th e OTM trike may im ply pos iti ve information tradi ng.
ce nari o B in a put opti on market is al so interest ing and in formative as \\e ll. It shows a heavy vo lume attached to th e ITM options and significant ly lowe r vo lumes in oth er strikes . Both marke ts offer pos iti ve informati on based trades. Eas ley et al ( 1998) and Chan et al (2002) di sca rd these \' lume from th eir econometri c analys is.
24
That wou ld be di sca rdin g pure in form ati on based tradin g and hence needs rev isiting th e vo lume analys is by incorporatin g these vo lumes.
Scenari os 3 and C from ca II and put option markets indicate heayy vo lume traded around ATM strike . These heavy vo lumes in both options markets ec ho the economic mea ning that in ves tors are unanimously in ag reemen t that the underlyin g stock pri ce would be around that strike price. These vo lumes in options markets are regarded as informati ve. Eas ley et a l ( 1998) and Chan et a l (2002) will find pos iti ve and or nega ti ve volum es \\·hi ch are in fo rmati ve vo lumes.
Finally scenari os -1 and D in ca ll and put options markets offe r s ignificant negati ve informat ion. Scenario 4 indi cates that vo lumes are heav il y conce ntrated around IT M strike. Scenar io D in a put option market shows that vo lumes are s ignifi cant at ITM strike . Both markets are in dicating negati ve informati on trad in g in the options markets. Howeve r. Eas ley et a l ( 1998) and Chan et a l (2002) di scard these vo lumes from the ir analysis. It is c lea rl y ev ident fro m our ex periment that these vo lumes mu st have c lear attent ion to retri eve information from options markets.
Now cons ider th e moneyness of options vo lumes . In order to do that we need the price of option for each strike of ca ll and put options. Considering the same set of stock pri ce, strikes, vo lumes of ca ll and put options,
2
Journal of Business & Leadership: Research, Practice, and Teaching (2005-2012), Vol. 1 [2005], No. 1, Art. 4
https://scholars.fhsu.edu/jbl/vol1/iss1/4
Bhuyan. Robbani . and Yan
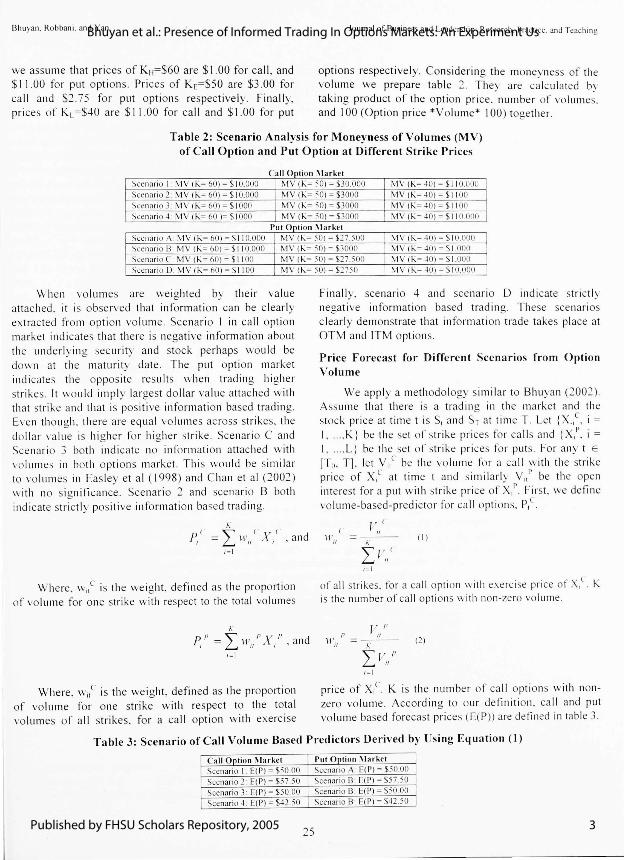
we assume th at prices of KH=$60 are $ 1.00 for ca ll , and $ 11 .00 for put options. Prices of KE= $5 0 are $3. 00 for ca ll and $2.75 for put opt ions respectively. Fina lly, pri ces of KL=$40 are $ 11 .00 for ca ll and $ 1.00 for put
Journal of Business and Leade rship Research. Practi ce . and Teachm g
options respect ive ly. Considering the moneyness of the vo lum e we prepare tabl e 2. Thev are ca lcul ated b,· tak ing product of the option pri ce, .number of vo l ume~. and 100 (Option price *Volume* 100) together.
Table 2: Scenario Analysis for Moneyness of Volumes (MV) of Call Option and Put Option at Different Strike Prices
c a ll Option !\larket Scenari o I: MY (K = 60) = $ 10.000 MY (K = 50) = $30.000 MY (K= -l O) = $1 1 O.OOU
Scenario 2: MY (K= 60) = $ 10.000 MY (K= 50)= $3000 MY (K= -l O) = $ 11 00 ~ccnario 3. MY (K= 60) = $1 000 MY (K= 50)= $3000 MY (K = 40) = $ 11 00 ~ce nari o -l
. MY (K= 60 )= $ 1000 MY (K = 50 ) = $3000 MY (K= -lO) = $ 11 0.000
ut >p!I Oil . ar ·et p 0 \I k
Scenari o A. MY ( K- 60) = $ 1 I 0.000 MY (K= 50) = $27.500 MY (K= -l O) = $ 10.000 Scena ri o B MY (K= 60) = $ 11 0.000 MY t K= 50 ) = $3000 MV( K=-l O) = SI. OOO
Scenari o C. MY (K= 60) = $ 11 00 MY (K= 50)= $27.500 MY (K= 40) = $1 .000 Scenario D. MY (K= 60) = $ 11 00 MY (K = 50)= $2750 MY (K= 40) = $ 10.000
When vo lumes are weighted by their va lue attac hed . it is obse rved that in format ion can be clear ly extracted fro m opti on vo lum e. Scenari o I in ca ll option market indicates that there is negative inform ation about the und erl yin g sec urity and stoc k perhaps wou ld be down at the maturity date. The put option market indi cates the oppos ite results when tradin g hi gher strikes. It wo uld impl y largest do llar va lue attac hed with that strike and that is pos iti ve inform ation based trading. Even th ough. there are eq ual vo lumes ac ross strikes, th e doll ar va lue is hi gher for hi gher strike. Scenari o C and Scenari o 3 both indi cate no in fo rmati on attached with vo lumes in bot h options market. Thi s would be similar to vo lumes in Eas ley et al ( 1998) and Chan et a l (2002) with no signifi cance . Scenari o 2 and scenario B both indicate strict ly pos iti ve informati on ba-;e d trading.
;;
P 1 ="" lt '
1 X
1 • and I ~ II I
1=1
Where , w,.c is th e weight. defined as the proporti on of vo lume for one strike with respect to the total vo lum es
;;
P ,, "" ,, v ,, d I = ~ \ 1111 A I • an
1= 1
Wh ere . w/ is the wei ght, defined as the propo1tion of vo lume for one strike wi th respect to the total vo lumes of a ll strikes. for a ca ll option with exercise
Finally, scenari o 4 and scenario D indi cate strictl y negati ve information based trading. These scenarios c lea rl y dem onstrate th at informati on trade takes pl ace at OTM and ITM options.
Price Forecast for Different Scenarios from Option Volume
We apply a methodo logy simil ar to Bhuyan (2002). Assume that th ere is a tradin g in the market and the stoc k pri ce at tim e t isS, and S~ at timeT. Let {X.,c, i = I . .... K} be the set of strike prices for ca ll s and {X,~'. i =
1 . .. .. L] be the set of strike prices fo r puts. For any t E
[T0, T] , let V/ be the vo lume for a ca ll with the strike price of X,c at time t and simil arl y V/ be the open interest for a put with strike price of X,P First. we defin e volume-based-predictor for ca ll opti ons. P,c.
(
\I' II
v (' II
;.: ""T ' < ~ II
( I)
of all strikes. for a ca ll opt ion with exercise price of X,L. K is the number of ca ll op ti ons wit h non-zero vo lum e.
" l\ ' II
v " II
,. .. "" v f l ~ II 1=1
(2)
price of xr K is the number of ca ll opti ons with nonzero vo lume. According to our defi niti on. ca ll and put vo lume based forecast prices (E( P)) are defined in tab le J.
Table 3: Scenario of Call Volume Based Predictors Derived by Using Equation (I)
Call Option i\ lark et Put Option :\Iarke! Scenari o I: E( P) = $50.00 Scenario A: E( P) - $50.00
Scenari o 2: E( P) = $57.50 Scenario B· E(P) - $57 .50
Scenari o 3: E( P) = $50 .00 Scenari o B: E(P)- $50 .00
Scenario 4: E( P) = $47 .50 Scenario B: E( P) = $42 .50
25 3
Bhuyan et al.: Presence of Informed Trading In Options Markets: An Experiment Us
Published by FHSU Scholars Repository, 2005

13h u, an . Rnbh an1 . and Yan
In tab le 3. '' e utili ze the inform ation from table I to app l: our meth od o log: to foreca t pri ce for th e under!\ in 2. . A it becomes clear that our meth odo logy offe r .qu~e clea r and common re ult for information based tradin!..'. and non information based trading. When pos iti,·e info~mation dr ives the volum e heavy at OTM in
a ll and IT 1 in Put opti on mark ets. they both indi cate hi!.!.her future sto ch. prices impl: in g informed trading. \\ 'l1en ne ga ti\ e inform ati on dri,·es the \ Oium e hi gh at IT \1 in ; II and OTi\ 1 in Put options markets. they both indi cate IO\\t' r fut ure stoch. pri ces implying informed tradin!.!. a!..'.a in . 1-he simil ar anal\ is ca n be dra\\ n using th .: eq-uatio n (2 ) a ''ell . \\' e ,,· ould lea \ e to readers to C.\ peri ment if in te rested. HO\\ e\'er. \\ e ha\ e the resu lts that can be prO\ ided as ''ell if reque ted.
A Mo nte Carlo Si mulation
In thi s sec ti on ''e examin e ''hat types of ·ad ing that
benefit ime stors mo t ''h en pri\'a te informati on
e\J ::> t !:>. \\ 'e <b !:>ume th at due to th e reasons outlin ed at the begi
nnin g or the paper. inform ed imestors co uld trade
clerintti\ e \ec uriti es. Wh en it comes to choos ing scc ur iti e!:> and mark ets. the inform ed in,·e tor has se\'eral choices. The: ca n trade in the ca ll opti ons marke t or in the pu t opti ons market. If th ey choose the ca ll or th e put marh.ct. th e: ha\ c a choice of trike pri ces . For pos iti\'e info rm ati on cases. for exa mpl e. if th ey h.n O\\ the \' a lue of th e inf orm ati on. i.e. hO\\ mu ch th e re lated stoch. price ''ill _jump b: th e maturity ela te. th ey ca n bu: (out of the mone;) call option of different strikes. or se ll (i n th e monc:) put opti on of diffe rent trih. es ''he re trades in ca ll marh. ets ''ill require initi al im estments and trade in put marh. ets ''ill req uire no initia l im estment but ,,·ill
Journal of Business and Leadaship · Research. Practice. and Teachi ng
ha,·e certain margi n req uirements. The main foc us of this s imu lation will be the effect of leverage on their payoffs ,,
·hen in formed traders choose strike pri ces of a call or a
put option. The whole simulati on procedure is divided into two
steps . In the first step. we si mul ate the terminal stock prices. and in the second step. we s imulate random informati on shoc ks. By ass umpti on. the normal di stribution is used to simulate the terminal \'alues. For information shoc ks. '' e assume that some in vestors have less than perfect in side informati on about a firm . The presence of such investors with some private in formati on shock ts represe nted by a uniform d istribution. Then the option price will be derived by discounting the sum of the termin al price and thi s rand om shoc k. Through t)1e s imulation. we will show \\' hether an in vesto r. with positive (negati ve) informati on abo ut the underlying stoc k. will buy/se ll calls or puts. Thi s imu lation will a lso address the in vestor·s poss ible choices of strikes in ca ll s and puts . An optimal choice ''ill be reached by ranking the poss ible return s from ho lding differe nt strikes o f ca li s and from se llin g different strikes of put s.
Tab le 4 provides the results of our s imulation. The parameters used are: The current stock (under lying) pri ce i 50. the number of steps is 500. number of simulation is 1.000. the time to maturity is half a yea r. the ri sk free rate is 5%. and th e standard deviation o f the under lyin g sec urit_\ is 20% . The first type of shock is dra\\ n from a uniform di stributi on \\ ith parameters of a = -0 .4. b = -0 .1. The both neQa tive siQns mean bad news for in\'estors. In other ,, ·o rd s.~ th e s ho~ks are drawn. with equ al probab ility. fro m an inten al [a.b]*S. where S is the current stoc k price .
Table-t: Monte Ca rl o Simulation Res ults of Benefits of So rtino Ca lls o r Buyin g Put with Nega tive Ins ide Information "'
Panel.-\ . Stock.' antl Call Options Stnt: !-
SO" o of stoc l- s and ~ o· o nr call (shon ca ll )
A I \1 OTi\ 1 IJOTM ITi\t DITI\1 lll C(]Il . () ~ ~ 7 .() 008 -0110 1 (J 005 I -0.0 17 -0 05 t , ttJ 0 171 (1 I ~ 0 0 15 9 () 353 I 0 098 0 068 \h
arr" -1 32:' . IJ 066 -o nos (I () 13 ·U 172 . () 7-1 5
\' aR . () 606 -03 16 -0 33 2 . () 291 . () 285 ·0 285 l' ancl B: Stoc ~s antl Put options
"'''"" go" oof ; toc!- s and ~0°oo fnut (l on!:! put ) A r~ t OTI\ 1 DOH \ ITI\1 DITM
lllt::11l - (1 227 0 687 I 982 59 ~59 0.266 0 008 ' ttl (I 171 () 5 6~ I 98 1 I ll 859 0.187 0 0 I~ <;ha rpe -1 .325 l ,..,.., I 00 1 (I 530 I -12 0 0 635 \ 'aR ·0606 ·0 ICJO -0 276 -0 -1 37 ·0 11 3 . () 0 16
1-he normal di stributi on i used to s imulate the terminal ~ l oc h. prr ces. t. e.. 111 a Black-Scholes· em ironment. The negati,·e informatt.Orl ,· d - represente by
a rand om shock with a uniform di stribution with parameters of a = -0.4 and b = -0.1. The current stoc k price is 50 (S = 50). the number of steps is 500, number
26 4
Journal of Business & Leadership: Research, Practice, and Teaching (2005-2012), Vol. 1 [2005], No. 1, Art. 4
https://scholars.fhsu.edu/jbl/vol1/iss1/4

Bhuyan. Ro bbani . an d Yan
of s imulation is I ,000, the time to maturity is half a year which is the holdin g ( investment) period as well, the ri sk free rate is 5%, and the standard deviati on of the und erl ying is 20%. There are 5 exerc ise prices x =
S*[0.7, 0.9, I, 1.1, 1.3 ]. Thus. we have at-the-money (A TM). in-the-money (ITM ), deep-in-the-money (DITM ). out-of-th e-money (OTM) and deep-out-of-the-
For example, the in vestor knows th at the shock would be in thL range of (-0 .4.-0 .1)*5 0 That is, the negative shock will lie between short fa ll of $20 (maximum dec line) and $5 (minimum dec line) and any oth er number betvve en these t\vo bounds will have an equal probabili ty. Further we ass ume that in vestors in vest 80% on stoc ks and 20% on options. either se lling ca ll or buyin g put s i nee it is bad news. In thi s table. panel A shows the results rel ated to short se lling call s and panel B shows th e results for long put . Options prices are estim ated using the Blac k-Scholes ' mode l.
Row 4 gives the expected portfo lio return s for stocks onl y portfo li o and stoc k-call portfo li os . We can see that the expected portfo lio return . 0. 5%. is mu ch better for the portfo lio whi ch inc I udes the deep-out-of-the-money ca ll options. For compari so n. the ex pected return for stock-ca II portfo li o whi ch inc I udes the at-the-m oneyoption call is merel y -0 .8%. From th e table, it is obvious that portfo lios with both in-the-money ca ll opti on and deep-in-the-money ca ll are inferior to the portfo lio with th e deep-out-the-money options. The impli ca ti on is that an in vestor with nega ti ve in side informati on would prefer ca ll s with hi gher exercrse pri ces . Thi s prov ides clear ev idence of the leverage effec ts.
The panel B shows the related expected return. ri sk expressed by standard deviati on and YaR for the portfo lios with stocks and put options. Here we long put options s ince we have bad news about the firm s. Again
Journal o f Business and Leadershi p: Research. Practice. and Teaching
money (DOTM) options for both ca ll and put . We use 80% of stocks and 20% of options (e ight ca ll or put) and the benchmark is 100% stoc ks. The transaction cost is ignored . YaR is value at Ri sk and it is defined as 1% lowest portfoli o return . Thus, YaR is I% * number of s imulation of the sor1ed portfo lio return s.
the dee p-out-the-money put options offer highest return . The second observation. based on the compari son of panels A and B. is that in vestors would prefer a long put pos iti on to a short call one since the former offers larger benefit s wh en a negati ve in fo rmation shoc k ex i st s .~ If informed traders choose to trade in the puts market. it is a lso observed that they would prefer to buy out-of-th emoney and at-the-money to increase profit leve ls.
Tabl e 5 shows th e impact of pos iti ve informati on shocks. The setup is exactl y the sa me as that of tabl e 4. except that two pairs of parameters of [a. b] are [0 . 1. 0.5] and [0 .2, 0.4]. Aga in a uniform di stributi on is used to mimi c th e ins ider information. From the tabl e. we can make three major observati ons. First. from panels A and B. when an in vestor possesses pos iti ve informati on, buyin g a call option is preferred to se lling a put s ince percentage "gain s'· are hi gher for all call options. Second , if a pos itive ins ide information ho lder ( investor) intends to buy ca ll options. the investor would choose options with hi gh exerc ise pri ces. i.e .. prefer out-themoney options. The reason is that with the same leve l of uncertainty of future pos iti ve in formati on shocks. these out-of-th e-money options offer hi gher benefit s. Third. the higher the preci sion of in side informati on, i.e .. the range of di stribution is narrowe r (b-a is small er). the hi gher the ga in in terms of buyin g ca ll or se lling put . The Sharp e rati os are hi gher for hi gh prec ision cases than the results from lower prec isions except one case (DOTM ).
Table 5: Monte Carlo Simulation for Positive Inside Information with Different Precision of the Shock
P!t nel A Stoc ~ 80°oofstod.s and 20°oofcall :1 - 0 I b -0 'i
·\T\1 OT.\ 1 DOH I IT.\ I D\T \1 mean 0 J:S I 017 I 678 .:; go;,~ 0 {lC)b 0 -'" 8
, ,d 0 185 0 o78 13-'2 8172 Il -l" : u :6.:;
Sharpe 1 7bQ I '- 01 1251 0 7 10 I b-0 t7cs Va R -0 U"ll .o c40 .o :40 -0 2-4 0 .. l)[()'i -0 os: Pa n t- 1 B Stod. 81)0 o of .; t oe~!> and 20° o of put a U I b-0 5]
AT\\ OH I DOH\ ITM D IT~ I
0 328 0 -' 'b 0 46 \ 0 461 n 4-lS 0 4 17
std 0 18' I) 167 0 I 'il 0 148 0 181 0 :07 Sharoe I 760 :719 3 06-1 1 11 9 ' 476 : 0 19
\ 'aR -0 Q'i O ·0 00 4 0 160 0 160 -0 133 -0 QC} 8
Panel C Stock 80°o o f stocks and 20° o o f call a=O 1,b-O -1
AT~ l OHI
DOH \ \HI DITM 0 J :7 I 01 1 1 643 '0)6 0 ()Cl 4 0 4 57
std 0 1; 7 0 581 I 172 7181 0 359 0 "'"'5
Sh~ roe ' 080 17-11 1 402 0 701 1 936 2 032 \ ·~ R 001)" .o 181 ·0 196 .o 190 -00-W -0 00 4
l)a nt'l 0 SIOd .. 80° o of SIOC I.. S and :!0° o Of p lll a - O ::! .b 0 4]
AT:'\ I OT\1 DOTt\1 IT~ I D1Ti\l
0 J : 7 0 461 0 46::! 0 4 6::! 0 4" 6 0 4:5
std 0 l'i? o tc8 0 126 0 126 0 \40 0 172
Sharpe 2 080 3 597 3 67 1 ] 671 3 "'66 24 67
\ ·aR 0 005 o c04 0 ::! 04 0 204 0 018 -00\ 4
27 5
Bhuyan et al.: Presence of Informed Trading In Options Markets: An Experiment Us
Published by FHSU Scholars Repository, 2005

Bhu~an . Ro bban1. and Yan
The second informati on shoc ks ca n be estimated m?re acc urate ly than th at of the first t)~pc of mform atl on
shock.. i.e .. [0.4-0 .2] = 0.2<0.4 = [0 .) -0 .1 ]. For the case ,,hen the e:-:e rci c is $45 (OTM. fo ur1h co lumn ) and fifth r0 , , (fi rst t:pe of shoc k) and 17'" rO\\ (second type of shoc k. ). ,,e have Sharp e rati o of 1.25 1 _and 1.402. rc pecti\el: . Thi s mea ns that for the second rnform atr on ::. hoc k.. the benefit of buyi ng a ca ll \\'lth exerc rse prr ce of S-+5 i · about !5° o more profitable than that of buying a call ,, hen the fir t type of shock ex ists. Thi s pattern is true for all case of sell ing put options.
Co ncluding Remarks
Traders '' ith ,·alu ab le pri va te information find the opt ions in strum ents more attractive than its underl yin g due to the ]e, eraQe effect. Traders. in genera l. in the options market e~m to have be tt er understanding of the futu re pr ice mO\ ement or the underlyin g secll ritie than traders in the stoc k market. When trad ing ac tiv ities are ill\ csti Qated aero s differe nt strikes it can be observed th at o p~i o n trade rs have bette r predi cti ve ab ility of the under!: in g sec ur it::- ·s future pri ce mo,·ement s fo r th e ma turit Y dat . 'v\'h en all strikes of ca ll and put options are con~ id e rcd in searc hing for informati on. it is obvious th at informed trad in g take pl ace in opti ons market due to the ]e,·erage effec t. The sce nari o analvs is conducted in thi s paper o~ ca ll and put opti ons mar.k.ets \'a li date our h: pothesis about the presence of in formati on trad in g in opti on:, market s. The Monte Ca rl o simulati on also shO\\ S th e incenti,·es to \\ ard s tradin g in options markets and the t: pes or opti ons inf rm ed traders \\ Ould trade. If one has to add ress '' heth er a part icu lar ma rket is the venue for informati on trading. th en di sca rdin g a range of trike and their respective vo lume are quite wrong. Inform ati on trad in g may or may not take pl ace on the set of stri kes taken into considerati on. If inform ati on trad ing too k. place in trike th at were not considered in condu cti ng resea rch. th en one \\ Ould come to a \Hong co nclu ion.
REFERENCES
An thon:. J. 1988. The interrelati on of stoc k and option mark et tracl in g-\o lume data. Journal of Finance, -+ 3: 9-+9-961
ck.ert . L. . & Tian. Y. 2000. E' idence of th e efficie nc\' of index opt ions market. Economic Review ::_ Federal Rese n ·e Bank of At lanta , 85: -+0-43.
Ammann . M .. & Herr iger. 2002 . Relati ve implied -\ Oiatilit: arb itrage ''ith index options. Financial Analysts Journal, 58 : 42-55 .
28
Jo urnal o f Business and Leaders hi p: Research. Practi ce. and Teach ing
Back, B. 1993 . Asymmetric in forma ti on and opt ions. Review of Financial Studies, 6: 435-4 72 .
Bagehot. W. 19 7 1. The only game in to\\'n . Financial ~Analysts Journal, '27: 12-1 4.
Bessembinder, H., Chan. K., & Seguin. P. 1996. An empir ical examinati on of informati on. differences of opinion. and tradin g activit ies. Journal of Financial Economics, 40: I 05 -1 34.
Bhattacharya. M .. 1987. Price changes of related sec urities: The case of ca ll options and stocks . Journal of Financial and Quantitative Analysis, 22: 1-15 .
Biais. B .. & Hilli on. P. 1994. In sider and liquidity trad ing in stock and options markets. Review of Financial Studies, 7: 74-3 -780 .
Black. F .. 1975. Fact and fantasy in use of options. Financial Analysts Journal, 3 I: 36-4 1.
Black. F .. & Sc ho les. M. 1973. The pricing of options and corporate li ab ilities. Journal of Political Economy, 81 : 63 7-659 .
Blume. L .. Eas ley. D .. & O' Hara , M. 1994. Market statis ti cs and techni ca l analy i : The role of volume. Journal of Finance, 49: 153- 181 .
Bhuvan. R. 2002. Informational •·ole of open interests i~ st rategic portfolio decisions. Thesis. Concordia Uni\'ers ity. Ca nada.
Bhuyan.R .. & Choudhury. M. 200 1. Trading on the information content of open interests: Evidence from the US equit) ' options markets. McGill Finance Resea rch Centre Working Paper.
Bhuyan. R .. & Yan. Y. 200 I. Informational role of open interests and volumes: Evidence from options Markets. Proceedin gs o f the 12'" AsiaPac ifi c Futures Research Sympos ium. Chicago Board of Trade.
Chan. K .. Chung. Y.. & Fong. W. 2002. The informati onal role of stoc k and option volume. Review of Financial Studies, 15: I 049- 1075.
Chae, J. 2005 . Trading vo lume. informati on asymmetry, and timing informati on. Journal of Finance, 60: 413-442.
Chakravarty. S., Gu len. H.. & Mayhew, S. 2004. Informed trading in stock and option markets . Journal of Finance, 59: 1235- 1257 .
Copeland. T. 19 76. A model o f asset trading under the assumpti on of sequenti a l information arrival. Journal of Finance, 3 1: I 149-1 168.
6
Journal of Business & Leadership: Research, Practice, and Teaching (2005-2012), Vol. 1 [2005], No. 1, Art. 4
https://scholars.fhsu.edu/jbl/vol1/iss1/4

Bhuyan. Robbani . and Yan
DeBondt, W., & Thaler, R. 1985 . Does the stock market overreact? Journal of Finance, 40: 793-805 .
Eas ley. D. , & O'Hara. M. 1987. Prices, trade size, and information in security markets. Journal of Financial Economics, 19: 69-90.
Eas ley. D., O' Hara. M ., & Srini vas, P. 1998. Option vo lume and stock prices : Ev idence on where informed traders trade. Journal of Finance, 53 : 43 1-465.
Manaster. S .. & Rendl eman, R. 1982 . Opti on pri ces as predictors of equi librium stoc k prices. Journal of Finance, 37: 1043 -1 057 .
Pan. L & Poteshman , A. 2003. The information in option volume for stock prices. Soc ial Sc ience Research Network.
Poo h. S .. & Pope . P. 2000. Trading vo latili ty spreads: A test of index option market effic iency. European Financial Management, 6: 235-26 1.
Rendleman . R .. Jones. C. . & Latane. H. 1982. Empirica l a noma I ies based on unexpected earnin gs and the
Journal of Business and Leadership: Research. Prac1ice. and Teaching
importance of risk adjustments . Journal of Financial Economics, 10: 269-287.
Sorescu. S. 2000. The effect of options on stock pri ces: 1973 to 1995. Journal ofFinance, 55:487-514.
Srivastava. S. 2003 . Informational content of trading volume and open interest - An empirical study of stock option market in India. Socia l Sc ience Research Network.
Stephen , J.. & Whaley. R. 1990. 1ntraday pri ce change and trading vo lume relat ions in the stoc k and stoc k options markets. Journal of Finance, 44 : I 15 -1 34 .
Sto ll , H .. & Whaley, R. 1990. The dynamics of stock index and stock index futures return s. Journal of Financial and Quantitative Analysis, 25: 441 -468.
Vij h. A. 1988. Potenti a l bi ases from using only trade prices of related sec urities on different exchanges. Journal of Finance, 43: I 049-1055.
Vijh . A. 1990. Liquidity of CBOE equity options. JournalofFinance,-lS : 11 57-1179.
Rafiqul Bhuyan is an ass istant professor at Ca lifornia State Univers ity. Sacramento. He received hi s Ph .D. from Concordia Uni versity, Ca nada. He has published several art ic les in finan ce and economi cs journals around the world . Hi s research interests are in corporate finance . op tions. in vestm ents, inform at ion and security prices. and microfi nance.
Mohammad Robbani is a professor of fin ance at Alabama A&M Uni versity. He rece ived hi s Ph .D. fro m Fl orida Internationa l Uni,·ers ity . He authored and co-a uthored many research papers that were pub li shed in va ri ous refereed journal s. He ho ld s membership in man y profess ional organizations including Financial Manage ment Assoc iat ion, Academy of Financial Se rvices, and Academy of Economics and Finance.
Y uxin g Van is a technical di rector. Wharton Research Data Serv ices at the Whar1on Sc hoo l. University of Pennsy lvani a. Hi s research areas incl ude portfolio theory. information di scovery. fi nancia l restatements and micro structure. He has publi shed in Journ al of Multinational Financial Manage ment, Journal of Banking and Fi nance, Pacific Basin Finance Journ al and Ann als of Operat ions Research.
29 7
Bhuyan et al.: Presence of Informed Trading In Options Markets: An Experiment Us
Published by FHSU Scholars Repository, 2005