prescribed drug spending in canada, 2013: a focus on ... drug spending in... · 6 prescribed drug...
TRANSCRIPT
Spending and Health Workforce
Prescribed Drug Spending in Canada, 2013: A Focus on Public Drug Programs
Our VisionBetter data. Better decisions. Healthier Canadians.
Our MandateTo lead the development and maintenance of comprehensive and integrated health information that enables sound policy and effective health system management that improve health and health care.
Our ValuesRespect, Integrity, Collaboration, Excellence, Innovation

Table of Contents Acknowledgements ..................................................................................................................... 4
About CIHI .................................................................................................................................. 5
Highlights .................................................................................................................................... 6
Introduction ................................................................................................................................. 7
1 Prescribed Drug Spending in Canada .................................................................................. 8 1.1 How Much Do Canadians Spend on Prescribed Drugs? ............................................... 8 1.2 What Are the Trends in Prescribed Drug Spending in Canada? .................................. 10 1.3 What Proportion of Prescribed Drug Spending Is Funded by the Public Sector? ......... 12
2 Public Drug Program Spending in Selected Jurisdictions ................................................... 14 2.1 Which Drugs Account for the Highest Proportion of Public Drug
Program Spending? .................................................................................................... 14 2.2 Which Drugs Contributed to the Observed Trends in Public Drug
Program Spending? .................................................................................................... 22 2.3 How Is Public Drug Program Spending Distributed? ................................................... 27
Appendix A: Glossary of Terms ................................................................................................. 29
Appendix B: Overview of Drug Program Design and Formulary ................................................ 31
Appendix C: Drug Classification Systems ................................................................................. 34
Appendix D: Factors That May Influence Drug Use and Expenditure in Canada ....................... 35
Appendix E: Methodological Notes ............................................................................................ 37
Appendix F: Federal, Provincial and Territorial Drug Programs ................................................. 42
Appendix G: Percentage of Public Drug Program Spending, by Broad Therapeutic Category, Selected Jurisdictions, 2013 ................................................................. 43
Appendix H: Generic Drugs as a Percentage of Total Drug Program Spending and Total Number of Accepted Claims, Selected Jurisdictions, 2003, 2008 and 2013 .......... 44
Appendix I: Percentage of Paid Beneficiaries and Public Drug Program Spending, by Program Spending per Paid Beneficiary, Selected Jurisdictions, 2008 and 2013 ...................................................................................................... 45
Appendix J: Proportion of Public Drug Program Spending per Paid Beneficiary per Chemical, Selected Jurisdictions, 2003, 2008 and 2013 ................................. 46
Appendix K: Top 10 Drug Classes With the Highest Proportion of Public Drug Program Spending, by Jurisdiction, 2013 ............................................................................ 47
Appendix L: IMS Brogan Disclaimer .......................................................................................... 52
References ............................................................................................................................... 53

4
Prescribed Drug Spending in Canada, 2013: A Focus on Public Drug Programs
Acknowledgements The Canadian Institute for Health Information (CIHI) wishes to acknowledge and thank the following groups for their contributions to Prescribed Drug Spending in Canada, 2013: A Focus on Public Drug Programs:
• Newfoundland and Labrador Prescription Drug Program, Department of Health and Community Services
• Prince Edward Island Provincial Pharmacare Program, Department of Health and Wellness
• Nova Scotia Pharmaceutical Services, Department of Health and Wellness
• New Brunswick Pharmaceutical Services Branch, Department of Health
• Ontario Pharmaceutical Services Coordination Unit, Ministry of Health and Long-Term Care
• Manitoba Provincial Drug Programs, Department of Health
• Saskatchewan Drug Plan and Extended Benefits Branch, Ministry of Health
• Alberta Health Economics and Funding Branch, Ministry of Health
• British Columbia Health Outcomes and Economic Analysis Division, Ministry of Health
• First Nations and Inuit Health Branch, Non-Insured Health Benefits Directorate, Health Canada
Please note that the analyses and conclusions in this document do not necessarily reflect those of the organizations mentioned above.
5
Prescribed Drug Spending in Canada, 2013: A Focus on Public Drug Programs
About CIHI The Canadian Institute for Health Information (CIHI) collects and analyzes information on health and health care in Canada and makes it publicly available. Canada’s federal, provincial and territorial governments created CIHI as a not-for-profit, independent organization dedicated to forging a common approach to Canadian health information. CIHI’s goal: to provide timely, accurate and comparable information. CIHI’s data and reports inform health policies, support the effective delivery of health services and raise awareness among Canadians of the factors that contribute to good health.
Production of this analysis is made possible by financial contributions from Health Canada and provincial and territorial governments. The views expressed herein do not necessarily represent the views of Health Canada or any provincial or territorial government.

6
Prescribed Drug Spending in Canada, 2013: A Focus on Public Drug Programs
Highlights This report focuses on prescribed drug expenditure, which accounts for 85.0% of drug spending in Canada. The first section provides an overview of prescribed drug spending using CIHI’s National Health Expenditure Database (NHEX) data. The second section looks more in-depth at public drug program spending using data from CIHI’s National Prescription Drug Utilization Information System (NPDUIS) Database.
Slowed growth in prescribed drug spending, observed since 2000, is forecast to have continued in 2014 in both the public and private sectors. • Prescribed drug spending is expected to have reached $28.8 billion, accounting for 85.0% of
total drug spending ($33.9 billion) and 13.4% of total health expenditure. • Prescribed drug spending is forecast to have grown at 0.9%, its lowest rate since spending
was first measured in 1975.
Public-sector spending on prescribed drugs in 2014, which represents 42.0% of total prescribed drug spending, is forecast to have been $12.1 billion. • 10 drug classes accounted for about a third (32.9%) of public drug program spending in 2013.
6 of the top 10 drug classes were used to treat conditions related to either the cardiovascular or nervous system.
• Tumour necrosis factor alpha inhibitors (anti-TNF drugs), a biologic drug class used to treat rheumatoid arthritis and Crohn’s disease, accounted for the highest proportion of spending.
• Individuals for whom public drug programs paid $2,500 or more toward drug costs accounted for 12.1% of beneficiaries and 62.9% of public drug spending.
• Generic drugs accounted for 34.1% of public drug program spending and 71.5% of claims. When looking at only cases in which generic products are available, generics accounted for 79.1% of spending and 85.2% of claims.
Savings from generics between 2008 and 2013 were largely offset by increased spending on other drug classes. • The expiration of patents and subsequent introduction of lower-cost generic drugs and the
implementation of generic pricing policies contributed to a decline in spending in 5 of the top 10 drug classes in terms of public drug program spending.
• Between 2008 and 2013, public drug program spending on these 5 classes decreased by $270.7 million in the 7 jurisdictions where data was available in both years.
• These decreases in spending were offset by increases in other drug classes during this time period. In particular, public drug program spending on anti-TNF drugs alone increased by $233.8 million between 2008 and 2013.
• 4 of the top 10 drug classes that contributed most to the growth of public drug spending—anti-TNF drugs, antineovascularization agents, long-acting insulins and analogues for injection, and interleukin inhibitors—are classes of drugs known as biologic agents.

7
Prescribed Drug Spending in Canada, 2013: A Focus on Public Drug Programs
Introduction Spending on prescribed drugs continues to rise and is forecast to have reached almost $28.8 billion in 2014. Spending is forecast to have increased by 0.9% from the previous year, continuing the recent trend of slower growth and representing the lowest annual growth rate since spending was first measured in 1975.1 The lower growth observed in recent years has been due in large part to patent expirations for commonly used chemicals and the implementation of generic pricing policies.2–5
Multiple payers are involved in the financing of prescribed drugs, including public drug programs, private insurers and households. In 2014, public-sector expenditure on prescribed drugs is expected to have reached $12.1 billion, which is the same as it was in 2013, accounting for 42.0% of prescribed drug spending in Canada. Private-sector expenditure on prescribed drugs is expected to have reached $16.7 billion in 2014, an increase of 1.3% from 2013. This includes $10.3 billion (35.8%) financed by insurers and $6.4 billion (22.2%) financed by Canadian households.
To support drug program management and decision-making, there is an ongoing need for detailed information about drug use and expenditure. This report focuses on prescribed drug expenditure, which accounts for the majority (85.0%) of drug spending in Canada. The first section of this report provides an overview of prescribed drug spending in Canada using 2014 forecast data from CIHI’s National Health Expenditure Database (NHEX), which contains a historical series of macro-level drug expenditure statistics by province and territory. It examines trends in overall prescribed drug spending in Canada and by source of funds.
The second section of this report provides a more in-depth look at public drug program spending. It looks at the types of drugs and characteristics of people accounting for the majority of spending and examines some of the components of spending that contributed to observed trends in overall public drug program spending. The analysis in this section uses drug claims data submitted to CIHI’s National Prescription Drug Utilization Information System (NPDUIS) Database in 2013 (see appendices E and F for more information about the data used in this report). The NPDUIS Database contains claims from public drug programs in 9 provinces—Newfoundland and Labrador, Prince Edward Island, Nova Scotia, New Brunswick, Ontario, Manitoba, Saskatchewan, Alberta and British Columbia—as well as 1 federal program administered by the First Nations and Inuit Health Branch (FNIHB).

8
Prescribed Drug Spending in Canada, 2013: A Focus on Public Drug Programs
1 Prescribed Drug Spending in Canada This section examines prescribed drug spending in Canada and will address the following questions:
• How much do Canadians spend on prescribed drugs?
• What are the trends in prescribed drug spending in Canada?
• What proportion of prescribed drug spending is funded by the public sector?
A glossary (Appendix A) provides definitions of key terms used in this report.
1.1 How Much Do Canadians Spend on Prescribed Drugs? Canadians spent an estimated $33.9 billion on drugs in 2014, the majority of which (85.0%) was spent on prescribed drugs, at an estimated $28.8 billion. Multiple payers are involved in the financing of prescribed drugs. In the public sector, these payers include provincial/territorial and federal drug subsidy programs and social security funds (such as workers’ compensation boards). In the private sector, payers include private insurers and households or individuals paying out of pocket.
In 2014, $12.1 billion (42.0%) of prescribed drug spending is expected to have been financed by the public sector (Figure 1). In the private sector, prescribed drug spending financed by private insurers is expected to have been $10.3 billion (35.8%), with the remaining $6.4 billion (22.2%) financed by Canadian households.

9
Prescribed Drug Spending in Canada, 2013: A Focus on Public Drug Programs
Figure 1: Prescribed Drug Expenditure, by Source of Finance, Canada, 2014f
Notes * Social Security Funds (SSFs) include health care spending by workers’ compensation boards and the
premium component of the Quebec Drug Insurance Fund. f: Forecast. $ billions; percentage share of total prescribed drug expenditure. Source National Health Expenditure Database, 2014, Canadian Institute for Health Information.
In 2014, among the major categories of health spending, spending on prescribed drugs is expected to account for 13.4% of spending, the third-largest category after hospitals (29.6%) and physicians (15.5%, Figure 2). The share of prescribed drugs in total health spending varied among provinces, ranging from 10.5% in B.C. and 10.7% in Alberta to 15.5% in New Brunswick and 16.7% in Quebec.1

10
Prescribed Drug Spending in Canada, 2013: A Focus on Public Drug Programs
Figure 2: Total Health Expenditure, by Use of Funds, Canada, 2014f
Notes f: Forecast. $ billions; percentage share of total health expenditure. Source National Health Expenditure Database, 2014, Canadian Institute for Health Information.
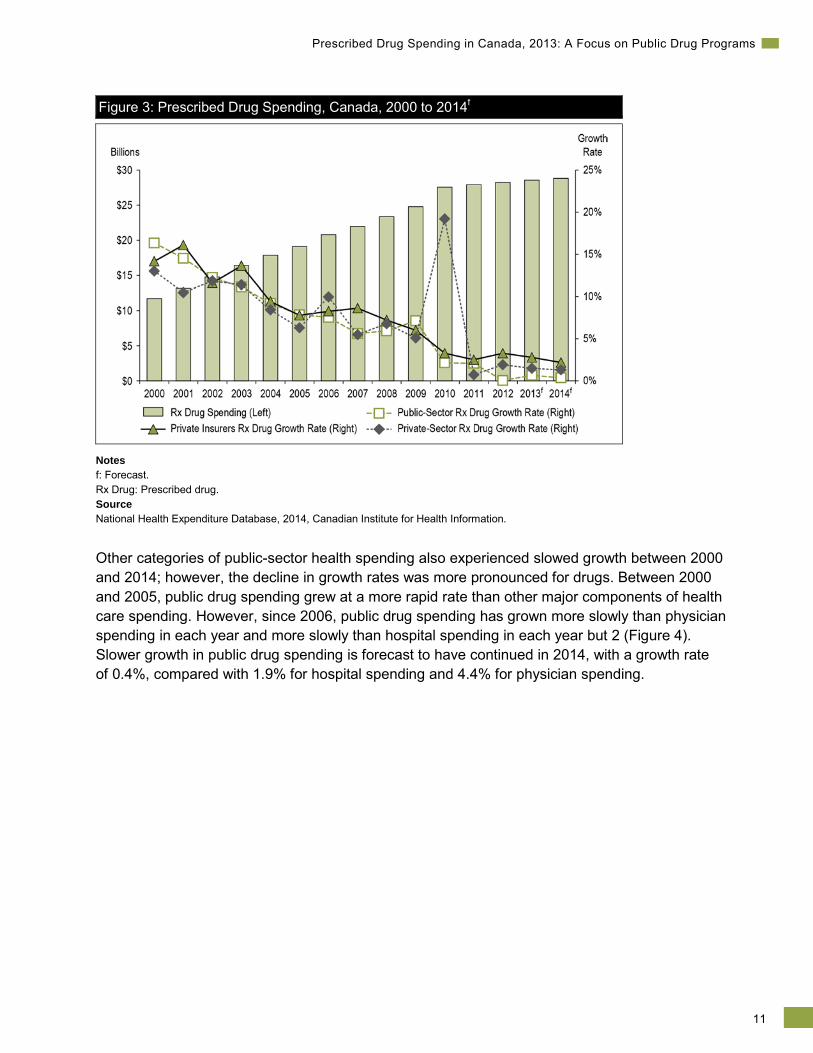
1.2 What Are the Trends in Prescribed Drug Spending in Canada? Since 2000, the growth in drug spending has been slowing fairly consistently from year to year.1 Similar trends have been observed in both the public and private sectors (Figure 3).i Prescribed drug spending in Canada grew rapidly in the early 2000s when many blockbuster drug classes expanded in terms of use and cost. More recently, growth rates have been lower as a result of patent expirations for many of the same drugs that led to higher growth in the previous years, as well as the introduction of generic pricing policies.2–5
In 2014, the rate of annual growth in prescribed drug spending is forecast to have been 0.9%, the lowest rate since spending was first measured in 1975.1
i. Due to a major redesign of the Survey of Household Spending by Statistics Canada in 2010, out-of-pocket prescribed drug
estimates from 2009 and earlier years should not be compared with those between 2010 and 2014. These were effectively 2 different surveys before and after the methodology redesign. The differences in survey design are responsible for the spike in private-sector prescribed drug spending observed in 2010. For more information, please refer to CIHI’s report National Health Expenditure Trends, 1975 to 2014.
11
Prescribed Drug Spending in Canada, 2013: A Focus on Public Drug Programs
Figure 3: Prescribed Drug Spending, Canada, 2000 to 2014f
Notes f: Forecast. Rx Drug: Prescribed drug. Source National Health Expenditure Database, 2014, Canadian Institute for Health Information.
Other categories of public-sector health spending also experienced slowed growth between 2000 and 2014; however, the decline in growth rates was more pronounced for drugs. Between 2000 and 2005, public drug spending grew at a more rapid rate than other major components of health care spending. However, since 2006, public drug spending has grown more slowly than physician spending in each year and more slowly than hospital spending in each year but 2 (Figure 4). Slower growth in public drug spending is forecast to have continued in 2014, with a growth rate of 0.4%, compared with 1.9% for hospital spending and 4.4% for physician spending.

12
Prescribed Drug Spending in Canada, 2013: A Focus on Public Drug Programs
Figure 4: Annual Growth Rate of Publicly Funded Health Spending, by Selected Categories, 2000 to 2014f
Note f: Forecast. Source National Health Expenditure Database, 2014, Canadian Institute for Health Information.
1.3 What Proportion of Prescribed Drug Spending Is Funded by the Public Sector?
In 2014, the public sector is forecast to have financed 42.0% of prescribed drug spending in Canada (Figure 5). The public share of prescribed drug spending varied among provinces, ranging from 31.5% in New Brunswick and 34.4% in B.C. to 45.7% in Quebec and 51.0% in Saskatchewan.

13
Prescribed Drug Spending in Canada, 2013: A Focus on Public Drug Programs
Figure 5: Publicly Funded Drug Spending as a Percentage of Prescribed Drug Spending, by Source of Finance, by Provinces and Canada, 2014f
Notes * Social Security Funds include health care spending by workers’ compensation boards and the premium
component of the Quebec Drug Insurance Fund. f: Forecast. Source National Health Expenditure Database, 2014, Canadian Institute for Health Information.
The majority of public-sector spending in each province is funded by the provincial government. It should be pointed out that the federal share of spending is larger in Manitoba and Saskatchewan because of the proportionally higher First Nations population in those provinces. FNIHB administers a federal drug plan that provides drug coverage to eligible First Nations populations in all provinces and territories in Canada. Conversely, the federal share is lower in Ontario because the provincial drug program funds costs that are funded by FNIHB in other provinces. The share of prescribed drug spending financed by the provincial governments ranges from 28.0% in New Brunswick to 40.9% in Alberta.

14
Prescribed Drug Spending in Canada, 2013: A Focus on Public Drug Programs
2 Public Drug Program Spending in Selected Jurisdictions
To better understand trends in public drug program spending, this section examines public drug program spending using data submitted to the NPDUIS Database by 10 federal/provincial public drug programs. This section will address the following questions:
• Which drugs account for the highest proportion of public drug program spending?
• Which drugs contributed to the observed trends in public drug program spending?
• How is public drug program spending distributed?
2.1 Which Drugs Account for the Highest Proportion of Public Drug Program Spending?
Spending by Broad Therapeutic Category In 2013, total public drug program spending among the 10 jurisdictions was almost $7.8 billion. Among 14 broad therapeutic categories, the top 2 categories—nervous system and cardiovascular system drugs—accounted for 35.8% of total public drug program spending (Table 1). Spending by broad therapeutic category provides a high-level overview of the types of conditions that account for drug spending. Broad therapeutic categories are regarded as groups of different chemicals that act on the same organ or system (see Appendix C).

15
Prescribed Drug Spending in Canada, 2013: A Focus on Public Drug Programs
Table 1: Percentage of Total Public Drug Program Spending and Rate of Use, by Broad Therapeutic Category, Selected Jurisdictions,* 2013
Broad Therapeutic Category TPS
($ Millions) Proportion of
TPS (%) Rate of Use
(%) Nervous System 1,560.9 20.1 41.6 Cardiovascular System 1,217.4 15.7 43.2
Antineoplastic and Immunomodulating Agents 1,171.8 15.1 2.6 Alimentary Tract and Metabolism 937.6 12.1 31.9 Respiratory System 498.0 6.4 19.2 Sensory Organs 440.8 5.7 10.9 Anti-Infectives for Systemic Use 386.9 5.0 51.2
Blood and Blood-Forming Organs 297.4 3.8 11.7 Musculoskeletal System 283.8 3.6 22.9 Genitourinary System and Sex Hormones 189.8 2.4 13.9 Systemic Hormonal Preparations 115.1 1.5 16.8
Dermatologicals 81.5 1.0 20.0 Various 56.1 0.7 0.5 Anti-Parasitic Products, Insecticides and Repellents 13.4 0.2 3.6
Unassigned† 526.7 6.7 23.3 Total 7,777.2 100.0
Notes * The 10 jurisdictions submitting claims data to the NPDUIS Database as of January 2015 are Newfoundland and Labrador, Prince
Edward Island, Nova Scotia, New Brunswick, Ontario, Manitoba, Saskatchewan, Alberta, British Columbia and the First Nations and Inuit Health Branch.
† This category includes drug products without an Anatomical Therapeutic Chemical (ATC) code assigned by Health Canada and products assigned as pseudo–drug identification numbers.
TPS: Total program spending. Source National Prescription Drug Utilization Information System Database, Canadian Institute for Health Information.
In general, the distribution of spending across broad therapeutic categories was similar among jurisdictions, with antineoplastic and immunomodulating agents and nervous system drugs each accounting for the highest proportion of spending in 5 of the 10 jurisdictions, and appearing in the top 3 broad therapeutic categories in all jurisdictions except Newfoundland and Labrador, Ontario and FNIHB (see Appendix G). There are many factors that can influence the distribution of spending, including the health of the population covered, formulary coverage, prescribing patterns and how costs are shared between the public drug program and beneficiaries. For a more comprehensive list of factors, see Appendix D.
It should be noted that public drug program spending does not include spending on drugs dispensed in hospitals or on those funded through cancer agencies and other special programs. Spending on these drugs can impact the distribution of spending across broad therapeutic categories, especially as it relates to antineoplastic and immunomodulating agents. In 2009, an estimated $2.4 billion was spent on drugs dispensed in hospitals, $800 million of which was spent on cancer drugs.4

16
Prescribed Drug Spending in Canada, 2013: A Focus on Public Drug Programs
The distribution of public drug program spending across broad therapeutic categories is also impacted by the drug program design in each jurisdiction, which in turn impacts the age distribution of the active beneficiary population (see Appendix B). For example, FNIHB, Manitoba and B.C.—the 3 jurisdictions where non-seniors account for the highest proportion of drug program spending—spend the highest proportion on nervous system drugs (the category accounting for the highest proportion of drug program spending for non-seniors) and the lowest proportion on cardiovascular drugs (the category accounting for the highest proportion of drug program spending for seniors; see Appendix G). In contrast, Nova Scotia and Alberta—the 2 provinces where seniors account for the highest proportion of drug program spendingii—spend the highest proportion on cardiovascular drugs and the lowest proportion on nervous system drugs. However, not all jurisdictions follow this pattern. For example, Ontario, where the proportion spent on seniors is third-highest among the 10 jurisdictions, spends more on nervous system drugs than on cardiovascular drugs, again highlighting that other factors aside from drug program design can influence these numbers.
Spending by Drug Class
Spending by drug class provides more detail in terms of the specific conditions being treated. Drug classes are regarded as groups of different chemicals that act in the same way to treat similar medical conditions.
As expected, based on the distribution of spending by broad therapeutic category, 6 of the top 10 drug classes in terms of public drug program spending act on either the cardiovascular or nervous system (Table 2). These top 10 drug classes accounted for 32.9% of drug program spending in 2013, compared with 34.1% in 2012. All of the top 10 drug classes also appeared in the top 10 drug classes in 2012.
ii. The lower proportion of non-seniors appearing in the data is due in large part to the fact that drug claims from programs for
income assistance recipients in Alberta and Nova Scotia are not submitted to the NPDUIS Database.

17
Prescribed Drug Spending in Canada, 2013: A Focus on Public Drug Programs
Table 2: Top 10 Drug Classes by Public Drug Program Spending, Selected Jurisdictions,* 2013
Drug Class Common Uses TPS
($ Millions) Proportion of TPS (%)
Tumour Necrosis Factor Alpha Inhibitors (Anti-TNF Drugs)
Rheumatoid Arthritis, Crohn’s Disease 576.7 7.4
Antineovascularization Agents† Age-Related Macular Degeneration 337.3 4.3 HMG-CoA Reductase Inhibitors (Statins)
High Cholesterol 295.6 3.8
Proton Pump Inhibitors (PPIs) Gastroesophageal Reflux Disease, Peptic Ulcer Disease
249.6 3.2
Adrenergics in Combination With Corticosteroids or Other Drugs, Excluding Anticholinergics
Asthma, Emphysema, Chronic Bronchitis
217.3 2.8
Angiotensin-Converting Enzyme (ACE) Inhibitors, Plain
Heart Failure, High Blood Pressure 190.7 2.5
Selective Serotonin Reuptake Inhibitors
Depression 185.8 2.4
Natural Opium Alkaloids Management of Moderate to Severe Pain
180.5 2.3
Other Antidepressants Depression 171.5 2.2 Diazepines, Oxazepines, Thiazepines and Oxepines
Schizophrenia, Bipolar Disorder 155.9 2.0
Combined Top 10 2,560.9 32.9
Notes * The 10 jurisdictions submitting claims data to the NPDUIS Database as of January 2015 are Newfoundland and Labrador, Prince
Edward Island, Nova Scotia, New Brunswick, Ontario, Manitoba, Saskatchewan, Alberta, British Columbia and the First Nations and Inuit Health Branch.
† Spending on ranibizumab (which accounted for 99.9% of spending on antineovascularization agents) in Nova Scotia, Manitoba and British Columbia is funded through special programs and is not included in the NPDUIS Database.
TPS: Total program spending. Source National Prescription Drug Utilization Information System Database, Canadian Institute for Health Information.
Anti-TNF drugs, which are used to treat conditions such as rheumatoid arthritis and Crohn’s disease, accounted for the highest proportion of public drug program spending, at 7.4%. Antineovascularization agents used to treat age-related macular degeneration, which is a condition that results in the loss of vision, accounted for the second-highest proportion of spending, at 4.3%.
A comparison of drug spending by jurisdictions in 2013 reveals that 3 drug classes (anti-TNF agents, statins and PPIs) appear among the top 10 drug classes in each jurisdiction (Appendix K). However, there are some jurisdictional differences in the distribution of spending across drug classes. Most notably, the proportion of spending on anti-TNF agents varied from 3.8% for FNIHB to 16.8% in Manitoba.

18
Prescribed Drug Spending in Canada, 2013: A Focus on Public Drug Programs
In Alberta and Ontario, antineovascularization agents accounted for a significant portion of spending (7.9% and 5.9%, respectively). Almost all of this spending (99.9%) was for the drug ranibizumab (sold under the brand name Lucentis). In some provinces (B.C., Manitoba and Nova Scotia), public spending on ranibizumab is through special programs that are not included in the NPDUIS Database’s drug claims data.iii
There was also variation in the proportion of spending on statins across provinces, from 2.1% in Manitoba to 6.1% in P.E.I. This was due, in large part, to differences in the age distribution across provinces and the fact that statins are most commonly used among seniors. The 3 jurisdictions with the lowest proportion of spending on statins (B.C., Manitoba and FNIHB) do not have programs designed explicitly for seniors.
The drug classes accounting for the highest proportion of public-sector spending were similar to those accounting for the majority of private-sector spending,iv which includes private drug program and out-of-pocket spending. Statins, anti-TNF agents and PPIs were among the top 4 drug classes in terms of spending in both the public and private sectors, while 8 drug classes appeared among the top 10 classes in terms of spending in both sectors (Table 3). A notable difference is that antineovascularization agents, which account for the second-largest proportion of public drug program spending, ranked 36th in terms of private-sector spending. This is due to the fact that ranibizumab (which accounted for 99.9% of spending in this class for public drug programs) is commonly used to treat age-related macular degeneration, which is much more prevalent in seniors. The majority of seniors’ drug coverage in Canada is financed by public drug programs.
iii. For example, the special program in Manitoba spent $7.7 million on ranibizumab in 2013. This amount included the drug cost as
well as the operational and administrative costs of the program. iv. Private drug spending data used in this analysis includes only ingredient costs, without dispensing and markup fees. For more
information on data sources, see Appendix E.

19
Prescribed Drug Spending in Canada, 2013: A Focus on Public Drug Programs
Table 3: Top 10 Drug Classes by Total Spending Funded by the Private Sector,* Selected Provinces,† 2013
Drug Class Common Uses Total Spending
($ Millions)
Proportion of Total Spending
(%) Tumour Necrosis Factor Alpha Inhibitors (Anti-TNF Drugs)
Rheumatoid Arthritis, Crohn’s Disease 509.0 6.4
HMG-CoA Reductase Inhibitors (Statins)
High Cholesterol 503.2 6.3
Proton Pump Inhibitors (PPIs) Gastroesophageal Reflux Disease, Peptic Ulcer Disease
495.9 6.2
Selective Serotonin Reuptake Inhibitors
Depression 341.4 4.3
Other Antidepressants Depression 294.5 3.7 Angiotensin-Converting Enzyme (ACE) Inhibitors, Plain
Heart Failure, High Blood Pressure 218.2 2.7
Other Antiepileptics Epilepsy 186.8 2.4 Adrenergics in Combination With Corticosteroids or Other Drugs, Excluding Anticholinergics
Asthma, Emphysema, Chronic Bronchitis
176.6 2.2
Dihydropyridine Derivatives High Blood Pressure 156.9 2.0 Centrally Acting Sympathomimetics Attention Deficit Hyperactivity
Disorder (ADHD) 156.6 2.0
Combined Top 10 3,039.1 38.2
Notes * Includes drug spending on ingredients, excluding dispensing and markup fees, paid for by private insurers and out of pocket. † The 9 provinces are Newfoundland and Labrador, Prince Edward Island, Nova Scotia, New Brunswick, Ontario, Manitoba,
Saskatchewan, Alberta and British Columbia. Source Geographic Prescription Monitor, 2013, IMS Brogan.
Given the fact that seniors account for close to two-thirds (58.8%) of public drug program spending, it is not surprising that 7 of the top 10 drug classes also appeared on the top 10 list for seniors in 2013 (Table 4). Antineovascularization agents accounted for the highest proportion of public drug program spending for seniors (7.2%), followed by statins (5.4%), which are the most commonly used drug class among seniors.6

20
Prescribed Drug Spending in Canada, 2013: A Focus on Public Drug Programs
Table 4: Top 10 Drug Classes by Public Drug Program Spending on Seniors, Selected Jurisdictions,* 2013
Drug Class Common Uses TPS
($ Millions) Proportion of
TPS (%)
Antineovascularization Agents† Age-Related Macular Degeneration 328.9 7.2
HMG-CoA Reductase Inhibitors (Statins)
High Cholesterol 244.9 5.4
Proton Pump Inhibitors (PPIs) Gastroesophageal Reflux Disease, Peptic Ulcer Disease
184.1 4.0
Adrenergics in Combination With Corticosteroids or Other Drugs, Excluding Anticholinergics
Asthma, Emphysema, Chronic Bronchitis
166.6 3.6
Angiotensin-Converting Enzyme (ACE) Inhibitors, Plain
Heart Failure, High Blood Pressure 154.7 3.4
Tumour Necrosis Factor Alpha Inhibitors (Anti-TNF Drugs)
Rheumatoid Arthritis, Crohn’s Disease 154.3 3.4
Anticholinesterases Alzheimer’s Disease 133.8 2.9
Dihydropyridine Derivatives High Blood Pressure 119.9 2.6 Anticholinergics Emphysema, Chronic Bronchitis 100.5 2.2 Selective Serotonin Reuptake Inhibitors
Depression 94.1 2.1
Combined Top 10 1,681.8 36.8
Notes * The 10 jurisdictions submitting claims data to the NPDUIS Database as of January 2015 are Newfoundland and Labrador, Prince
Edward Island, Nova Scotia, New Brunswick, Ontario, Manitoba, Saskatchewan, Alberta, British Columbia and the First Nations and Inuit Health Branch.
† Spending on ranibizumab (which accounted for 99.9% of spending on antineovascularization agents) in Nova Scotia, Manitoba and British Columbia is funded through special programs and is not included in the NPDUIS Database.
TPS: Total program spending. Source National Prescription Drug Utilization Information System Database, Canadian Institute for Health Information.
Only 2 drug classes—anti-TNF drugs and selective serotonin reuptake inhibitors (SSRIs)—appeared in both the top 10 drug classes in terms of public drug program spending for both seniors and non-seniors (Table 5). Anti-TNF drugs accounted for the highest proportion of public drug program spending for non-seniors (13.2%), followed by 2 classes of antipsychotics (accounting for 3.8% and 3.6% of spending, respectively). Antineovascularization agents, which accounted for the highest proportion of spending among seniors, ranked 75th in program spending on non-seniors in 2013. This reflects the difference in the prevalence of age-related macular degeneration between the 2 age groups.

21
Prescribed Drug Spending in Canada, 2013: A Focus on Public Drug Programs
Table 5: Top 10 Drug Classes by Public Drug Program Spending on Non-Seniors, Selected Jurisdictions,* 2013
Drug Class Common Uses TPS
($ Millions) Proportion of
TPS (%) Tumour Necrosis Factor Alpha Inhibitors (Anti-TNF Drugs)
Rheumatoid Arthritis, Crohn’s Disease
422.4 13.2
Diazepines, Oxazepines, Thiazepines and Oxepines
Schizophrenia, Bipolar Disorder 120.3 3.8
Other Antipsychotics Schizophrenia, Bipolar Disorder 116.8 3.6 Natural Opium Alkaloids Management of Moderate to
Severe Pain 115.3 3.6
Interferons Multiple Sclerosis, Chronic Hepatitis C 96.1 3.0 Other Antidepressants Depression 96.0 3.0 Selective Serotonin Reuptake Inhibitors
Depression 91.7 2.9
Antivirals for Treatment of HIV Infections, Combinations
Human Immunodeficiency Virus (HIV) 88.6 2.8
Drugs Used in Opioid Dependence Drug Addiction, Pain Control 82.1 2.6 Protease Inhibitors Human Immunodeficiency Virus (HIV) 69.1 2.2
Combined Top 10 1,298.4 40.7
Notes * The 10 jurisdictions submitting claims data to the NPDUIS Database as of January 2015 are Newfoundland and Labrador, Prince
Edward Island, Nova Scotia, New Brunswick, Ontario, Manitoba, Saskatchewan, Alberta, British Columbia and the First Nations and Inuit Health Branch.
TPS: Total program spending. Source National Prescription Drug Utilization Information System Database, Canadian Institute for Health Information.
Among non-seniors, 4 of the top 10 drug classes were classes of psychotropic drugs, used to treat a variety of mental health conditions. These 4 classes accounted for 13.3% of public drug program spending on non-seniors in 2013.
Spending by Brand Name and Generic Drugs In 2013, generic products accounted for 34.1% of public drug program spending (Figure 6). Although the share of generic spending varies by province, generic products increased as a proportion of drug program spending over the past decade in each of the jurisdictions for which data was available (Appendix H). Generics also increased as a share of utilization during this time period, accounting for 71.5% of accepted claims in 2013.

22
Prescribed Drug Spending in Canada, 2013: A Focus on Public Drug Programs
Figure 6: Percentage Share of Public Drug Program Spending and Number of Accepted Claims (Brand Name and Generic), Selected Jurisdictions,* 2013
Note * The 10 jurisdictions submitting claims data to the NPDUIS Database as of January 2015 are Newfoundland
and Labrador, Prince Edward Island, Nova Scotia, New Brunswick, Ontario, Manitoba, Saskatchewan, Alberta, British Columbia and the First Nations and Inuit Health Branch.
TPS: Total program spending. Source National Prescription Drug Utilization Information System Database, Canadian Institute for Health Information.
It should be noted that the share of spending on generic products does not necessarily reflect the extent of use of generic products in place of brand products, as generic alternatives are not available in all cases (most often when the brand name product is still under patent). For cases where generic products were available, generics accounted for 79.1% of spending and 85.2% of claims in 2013.
2.2 Which Drugs Contributed to the Observed Trends in Public Drug Program Spending?
While the overall change in public drug spending between 2008 and 2013 was a relatively small increase of 1.7% (Table 6),v examining growth rates by drug class shows that there were both significant increases and decreases in spending during this time period. The slowed growth observed in overall public drug program spending was due in large part to patent expirations for commonly used chemicals after 2007, which occurred in 8 of the top 10 drug classes in terms of drug spending in 2013. Statins, for instance, had one of the highest proportions of total program spending (3.8%) in 2013; however, public drug program spending on statins declined by an average annual rate of 17.3% between 2008 and 2013. A decline in spending was also observed for 4 other top 10 drug classes: PPIs (commonly used to treat gastroesophageal reflux
v. Data from 5 provinces is included: Nova Scotia, New Brunswick, Manitoba, Saskatchewan and Alberta.

23
Prescribed Drug Spending in Canada, 2013: A Focus on Public Drug Programs
disease), ACE inhibitors (commonly used to lower blood pressure), selective serotonin reuptake inhibitors (commonly used to treat depression) and diazepines, oxazepines, thiazepines and oxepines (commonly used to treat schizophrenia and bipolar disorder).
Table 6: Average Annual Growth in Public Drug Program Spending for Top 10 Drug Classes by Total Program Spending, Selected Jurisdictions,* 2003 to 2013
Drug Class Common Use
AAG in TPS, 2003 to 2008
(%)
AAG in TPS, 2008 to 2013
(%)
Percentage Change Over
2012 (%)
Tumour Necrosis Factor Alpha Inhibitors (Anti-TNF Drugs)
Rheumatoid Arthritis, Crohn’s Disease
39.0 24.8 18.3
Antineovascularization Agents† Age-Related Macular Degeneration
0.2 148.4 25.8
HMG-CoA Reductase Inhibitors (Statins)
High Cholesterol 13.1 -17.3 -38.3
Proton Pump Inhibitors (PPIs) Gastroesophageal Reflux Disease, Peptic Ulcer Disease
3.7 -7.4 -25.4
Adrenergics in Combination With Corticosteroids or Other Drugs, Excluding Anticholinergics
Asthma, Emphysema, Chronic Bronchitis
17.4 8.7 6.1
Angiotensin-Converting Enzyme (ACE) Inhibitors, Plain
Heart Failure, High Blood Pressure
-1.7 -7.6 -19.4
Selective Serotonin Reuptake Inhibitors
Depression -1.7 -1.2 -13.8
Natural Opium Alkaloids Management of Moderate to Severe Pain
13.3 3.4 0.7
Other Antidepressants Depression 5.6 1.9 -10.2 Diazepines, Oxazepines, Thiazepines and Oxepines
Schizophrenia, Bipolar Disorder 7.1 -7.9 -13.7
All Drug Classes 7.9 1.7 -2.4
Notes * The 5 jurisdictions submitting claims data to the NPDUIS Database as of January 2015 are Nova Scotia, New Brunswick,
Manitoba, Saskatchewan and Alberta. Newfoundland and Labrador data is not available prior to 2009, Ontario and First Nations and Inuit Health Branch data is not available prior to 2011, and Prince Edward Island and British Columbia data is not available prior to 2005; these jurisdictions are thus excluded from the results.
† Spending on ranibizumab (which accounted for 99.9% of spending on antineovascularization agents) in Nova Scotia, Manitoba and British Columbia is funded through special programs and is not included in the NPDUIS Database.
AAG: Average annual growth. TPS: Total program spending. Source National Prescription Drug Utilization Information System Database, Canadian Institute for Health Information.
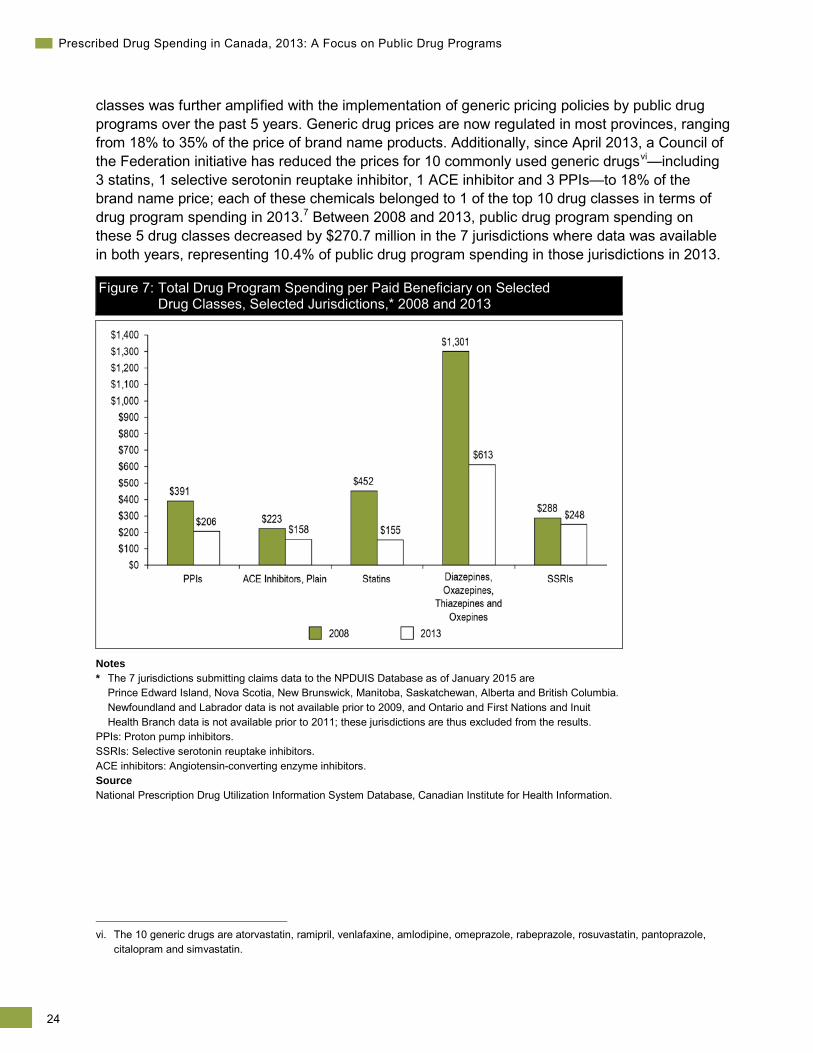
In each of the 5 classes that experienced a decline in spending between 2008 and 2013 (i.e., statins, PPIs, ACE inhibitors, selective serotonin reuptake inhibitors and diazepines, oxazepines, thiazepines and oxepines), patents on commonly used chemicals expired, allowing for the entry of lower-priced generic versions. Drug program spending per beneficiary reduced across all these classes. For example, spending per beneficiary for statins decreased from $452 in 2008 to $155 in 2013 (Figure 7). The impact of the entry of lower-cost generics in these
24
Prescribed Drug Spending in Canada, 2013: A Focus on Public Drug Programs
classes was further amplified with the implementation of generic pricing policies by public drug programs over the past 5 years. Generic drug prices are now regulated in most provinces, ranging from 18% to 35% of the price of brand name products. Additionally, since April 2013, a Council of the Federation initiative has reduced the prices for 10 commonly used generic drugsvi—including 3 statins, 1 selective serotonin reuptake inhibitor, 1 ACE inhibitor and 3 PPIs—to 18% of the brand name price; each of these chemicals belonged to 1 of the top 10 drug classes in terms of drug program spending in 2013.7 Between 2008 and 2013, public drug program spending on these 5 drug classes decreased by $270.7 million in the 7 jurisdictions where data was available in both years, representing 10.4% of public drug program spending in those jurisdictions in 2013.
Figure 7: Total Drug Program Spending per Paid Beneficiary on Selected Drug Classes, Selected Jurisdictions,* 2008 and 2013
Notes * The 7 jurisdictions submitting claims data to the NPDUIS Database as of January 2015 are
Prince Edward Island, Nova Scotia, New Brunswick, Manitoba, Saskatchewan, Alberta and British Columbia. Newfoundland and Labrador data is not available prior to 2009, and Ontario and First Nations and Inuit Health Branch data is not available prior to 2011; these jurisdictions are thus excluded from the results.
PPIs: Proton pump inhibitors. SSRIs: Selective serotonin reuptake inhibitors. ACE inhibitors: Angiotensin-converting enzyme inhibitors. Source National Prescription Drug Utilization Information System Database, Canadian Institute for Health Information.
vi. The 10 generic drugs are atorvastatin, ramipril, venlafaxine, amlodipine, omeprazole, rabeprazole, rosuvastatin, pantoprazole,
citalopram and simvastatin.

25
Prescribed Drug Spending in Canada, 2013: A Focus on Public Drug Programs
These decreases in spending were offset by increases in other drug classes during this time period. In particular, public drug program spending on anti-TNF drugs alone increased by $233.8 million between 2008 and 2013. Anti-TNFs contributed the greatest amount to the overall growth in public drug program spending and were the top contributor to growth in each jurisdiction for which data was available.vii
4 of the 10 drug classes that contributed most to the growth of public drug spending—anti-TNF drugs, antineovascularization agents, long-acting insulins and analogues for injection, and interleukin inhibitors—are classes of drugs known as biologic agents (Table 7).
Antineovascularization agents exhibited the highest average annual growth rate in terms of public drug program spending between 2008 and 2013, at 148.5%, followed by interleukin inhibitors, which grew at an average annual rate of 106.8%.
Biologic agents are often significantly more expensive than alternative medications (where they exist), and public drug programs in the 10 jurisdictions spent an average of $18,523, $9,366 and $14,297 per paid beneficiary on anti-TNFs, antineovascularization agents and interleukin inhibitors, respectively, in 2013.
vii. Data from 7 provinces is included: P.E.I., Nova Scotia, New Brunswick, Manitoba, Saskatchewan, Alberta and B.C.

26
Prescribed Drug Spending in Canada, 2013: A Focus on Public Drug Programs
Table 7: Top 10 Drug Classes by Contribution to Public Drug Program Spending Growth, Average Annual Growth, Selected Jurisdictions,* 2008 to 2013
Drug Class Common Use
Contribution to TPS
Growth (%)
Average Annual
Growth (%)
Percentage Change Over
2012 (%) Tumour Necrosis Factor Alpha Inhibitors (Anti-TNF Drugs)
Rheumatoid Arthritis, Crohn’s Disease
126.3† 24.5 17.8
Antineovascularization Agents‡ Age-Related Macular Degeneration
33.3 148.5 25.7
Insulins and Analogues for Injection, Long-Acting
Diabetes Mellitus 13.9 55.0 42.9
Adrenergics in Combination With Corticosteroids or Other Drugs, Excluding Anticholinergics
Asthma, Emphysema, Chronic Bronchitis
13.3 8.5 5.2
Other Antipsychotics Schizophrenia, Bipolar Disorder 12.7 15.3 15.5 Protease Inhibitors Human Immunodeficiency Virus
(HIV) 11.3 48.5 93.7
Drugs Used in Opioid Dependence
Drug Addiction, Pain Control 9.5 12.5 6.5
Selective Immunosuppressants Organ Transplant 9.0 21.2 20.1 Interleukin Inhibitors Rheumatoid Arthritis, Psoriasis,
Organ Transplant 8.1 106.8 63.1
Anticholinergics Emphysema, Chronic Bronchitis 6.8 8.6 6.2 All Drug Classes 100.0 1.5 -2.1
Notes * The 7 jurisdictions submitting claims data to the NPDUIS Database as of January 2015 are Prince Edward Island,
Nova Scotia, New Brunswick, Manitoba, Saskatchewan, Alberta and British Columbia. Newfoundland and Labrador data is not available prior to 2009, and Ontario and First Nations and Inuit Health Branch data is not available prior to 2011; these jurisdictions are thus excluded from the results.
† Contributing more than 100% to growth means that the dollar value of the growth in spending on the drug class was greater than the dollar value of the overall growth in spending.
‡ Spending on ranibizumab (which accounted for 99.9% of spending on antineovascularization agents) in Nova Scotia, Manitoba and British Columbia is funded through special programs and is not included in the NPDUIS Database.
TPS: Total program spending. Source National Prescription Drug Utilization Information System Database, Canadian Institute for Health Information.

27
Prescribed Drug Spending in Canada, 2013: A Focus on Public Drug Programs
2.3 How Is Public Drug Program Spending Distributed? The majority of public drug spending in 2013 was for a relatively small number of individuals. Public drug programs paid $2,500 or more toward drug costs for 12.1% of beneficiaries, accounting for 62.9% of public drug spending. Conversely, the programs paid less than $500 on drug costs for more than half (56.1%) of beneficiaries, accounting for only 6.3% of program spending (Table 8).
Table 8: Percentage of Paid Beneficiaries and Public Drug Program Spending, by Program Spending per Paid Beneficiary, Selected Jurisdictions,* 2013
Program Spending Proportion of
Paid Beneficiaries (%) Proportion of TPS (%)
<$500 56.1 6.3
$500–$1,499 22.8 16.7
$1,500–$2,499 8.9 14.0
$2,500–$4,999 7.7 21.6
$5,000–$9,999 2.8 15.0
$10,000+ 1.6 26.3
Notes * The 10 jurisdictions submitting claims data to the NPDUIS Database as of January 2015 are Newfoundland
and Labrador, Prince Edward Island, Nova Scotia, New Brunswick, Ontario, Manitoba, Saskatchewan, Alberta, British Columbia and the First Nations and Inuit Health Branch.
TPS: Total program spending. Source National Prescription Drug Utilization Information System Database, Canadian Institute for Health Information.
The distribution of cost in each jurisdiction is similar to the overall distribution (see Appendix I). The proportion of individuals for whom the drug program covered less than $500 in drug costs ranged from 72.0% for FNIHB to 39.8% for Nova Scotia.viii In contrast, the proportion of individuals for whom the drug program paid $2,500 or more toward drug costs is significantly smaller, ranging from 16.2% for Manitoba to 6.2% for P.E.I.
Among the 7 jurisdictionsix for which data is available for 2008 and 2013, the proportion of drug program spending on beneficiaries for whom the drug program paid $10,000 or more in drug spending increased from 15.9% in 2008 to 29.7% in 2013, while the proportion of beneficiaries they accounted for increased by less than 1 percentage point (from 1.1% in 2008 to 1.8% in 2013) (Appendix I).
This increase is due in large part to the increased spending on more expensive drugs. In 2013, 21.8% of public drug spending was on chemicals that cost $10,000 or more per beneficiary, representing 5.6% of the total number of chemicals that were paid for by the public drug programs (Figure 8). In 2008, 2.6% of the chemicals paid for by public drug programs exceeded $10,000 per beneficiary, accounting for only 9.1% of program spending. viii. As a result of the creation of the First Nations Health Authority (FNHA), claims in British Columbia or for FNHA clients were
excluded from October 1, 2013, onward (see the Methodological Notes section for more detail). Although this would result in an underestimation of drug program spending for clients whose claims were excluded, results were similar in 2012.8
ix. The 7 jurisdictions submitting claims data to the NPDUIS Database as of January 2015 are Prince Edward Island, Nova Scotia, New Brunswick, Manitoba, Saskatchewan, Alberta and British Columbia.

28
Prescribed Drug Spending in Canada, 2013: A Focus on Public Drug Programs
Figure 8: Proportion of Public Drug Program Spending and Proportion of Chemicals Paid, Chemical That Cost $10,000 or More per Paid Beneficiary, Selected Jurisdictions,* 2008 to 2013
Notes * The 7 jurisdictions submitting claims data to the NPDUIS Database as of January 2015 are
Prince Edward Island, Nova Scotia, New Brunswick, Manitoba, Saskatchewan, Alberta and British Columbia. Newfoundland and Labrador data is not available prior to 2009, and Ontario and First Nations and Inuit Health Branch data is not available prior to 2011; these jurisdictions are thus excluded from the results.
TPS: Total program spending. Source National Prescription Drug Utilization Information System Database, Canadian Institute for Health Information.

29
Prescribed Drug Spending in Canada, 2013: A Focus on Public Drug Programs
Appendix A: Glossary of Terms Please note that some of the terms in this glossary may have alternate definitions. The stated definitions are meant only to reflect how these terms were used in the context of this report and are not necessarily the sole definitions of these terms.
Accepted claim: A claim where the drug program accepts at least a portion of the cost, either toward a deductible or for reimbursement.
Active beneficiary: An individual with at least 1 claim accepted by a public drug program, either for reimbursement or applied toward a deductible. In Manitoba and Saskatchewan, active beneficiaries are also individuals with accepted claims who are eligible for coverage under a provincial drug program but who have not submitted an application and, therefore, do not have a defined deductible.
Amount paid per paid beneficiary: The average amount paid by the plan/program per individual, for whom the public plan/program paid at least part of 1 claim.
Anatomical Therapeutic Chemical (ATC) level: A classification system that divides drugs into different groups according to the organ or system on which they act and their chemical, pharmacological and therapeutic properties. This report uses the 2014 version of the ATC classification system.
Average annual growth rate: The constant annual rate necessary for a value at the beginning of a period to grow to a value at the end of a period over the number of compounding years in the period. (See Appendix E for more detail.)
Broad therapeutic category: Subgroups of chemicals classified by the World Health Organization at the first level of the ATC classification system. At this level, groups are, in theory, regarded as groups of different chemicals that act on the same organ or system.
Chemical: Chemicals classified by the World Health Organization at the fifth level of the ATC classification system, 2014 version. Each unique code represents a distinct chemical or biologic entity within the respective drug class.
Chemical paid: A chemical that has had, at least, part of at least 1 claim paid by a plan/program as a benefit.
Claim: 1 or more transactions, with the final result indicating that a prescription had been filled and dispensed in exchange for payment.
Copayment: The portion of the claim cost that individuals must pay each time they make a claim. This may be a fixed amount or a percentage of the total claim cost. When calculated as a percentage of the total cost, it is also known as “co-insurance.”
Cost sharing: The amount of the total prescription cost accepted by the plan/program that is not paid by the plan/program (i.e., the amount of the total prescription cost accepted that is paid out of pocket by the beneficiary or through another plan/program/insurer).

30
Prescribed Drug Spending in Canada, 2013: A Focus on Public Drug Programs
Cost-sharing mechanisms: The ways through which prescription costs can be shared between drug programs and their beneficiaries (e.g., copayments, deductibles and premiums).
Deductible: The amount of total drug spending an individual must pay in a given year (or other defined time period) before any part of his or her drug costs will be paid by the drug program. A deductible may be a fixed amount or a percentage of income (income-based deductible).
Drug: See Chemical.
Drug class: Subgroups of chemicals classified by the World Health Organization at the fourth level of the ATC classification system, 2014 version. At this level, subgroups are, in theory, regarded as groups of different chemicals that work in the same way to treat similar medical conditions (e.g., the chemical subgroup bisphosphonates includes chemicals such as etidronate, alendronate and risedronate).
Drug program: A program that provides coverage for drugs for a set population. Programs have defined rules for eligibility, payment and the drugs they cover.
Drug program formulary: A formal listing of the benefits eligible for reimbursement under a specific drug benefit plan/program and the conditions under which coverage is provided. For the purpose of the NPDUIS Database, a “benefit” means a drug, product, medical supply, equipment item or service covered under a drug benefit plan or program.
Drug program spending: The amount paid by the drug program toward an individual’s prescription costs. Any portion of the prescription cost paid by the individual or a third-party private insurer is not captured in this amount, including the drug cost, professional fees paid to the pharmacy or markup charged by the pharmacy. (See Appendix E for more detail.)
Indication: Refers to the use of a drug for treating a particular disease. For example, gastroesophageal reflux disease is an indication for proton pump inhibitors.
Jurisdiction: The federal/provincial/territorial jurisdiction responsible for the drug program formulary and for financing the paid amount of accepted claims.
Paid beneficiary: An individual who has had, at least, part of at least 1 claim paid by a plan/program as a benefit.
Paid claim: A claim for which the drug program paid at least a portion of the cost.
Palliative: Individuals who have been diagnosed by a physician or nurse practitioner as being in the end stage of a terminal illness or disease, who are aware of their diagnosis and have made a voluntary informed decision related to resuscitation, and for whom the focus of care is palliation and not treatment aimed at a cure.
Premium: The amount an individual must pay to enrol in the drug program.
Public drug coverage: Drug coverage offered to individuals by the federal/provincial/ territorial jurisdictions.
Total drug program spending: See Drug program spending.
31
Prescribed Drug Spending in Canada, 2013: A Focus on Public Drug Programs
Appendix B: Overview of Drug Program Design and Formulary Overview of Drug Plan Design Although public drug coverage is available in the 10 jurisdictions included in this analysis, the design of public drug programs varies widely across jurisdictions. One major difference is that drug programs in B.C. and Manitoba, as well as FNIHB’s drug program, offer similar coverage to people of all ages, while the other jurisdictions have a separate plan designed specifically for seniors.
There is less consistency in the coverage of non-seniors across jurisdictions. In B.C., Saskatchewan and Manitoba, drug costs are reimbursed if they exceed a certain percentage of an individual’s income. In most other jurisdictions, similar plans are available but only to those without private insurance. In all jurisdictions, coverage is available to individuals receiving income assistance. Coverage is also available for selected drugs to treat particular conditions in all provinces, though the drugs and conditions vary.
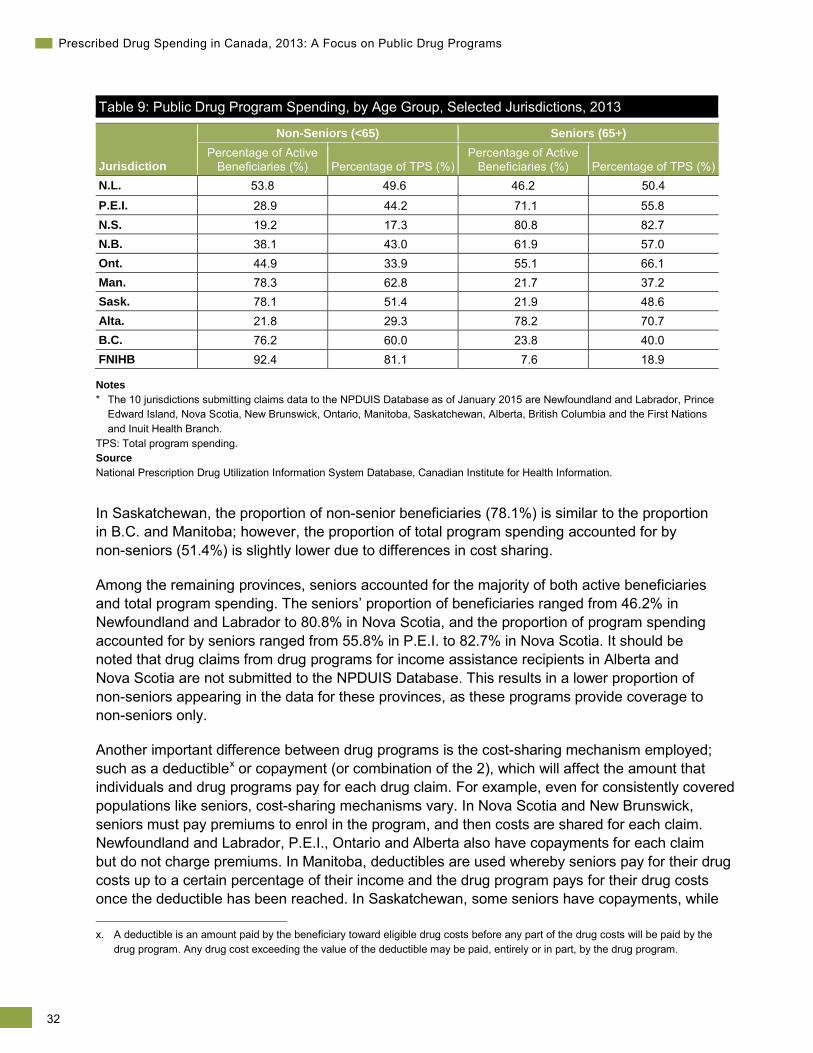
The differences in coverage of non-seniors across jurisdictions, along with population demographics, greatly impact the age distribution of the active beneficiary population, and in turn how drug program spending is distributed across age groups. In jurisdictions offering similar coverage to both non-seniors and seniors, non-seniors account for the vast majority of active beneficiaries, and the majority, albeit a lower proportion, of total drug program spending (Table 9). In these jurisdictions the proportion of non-senior beneficiaries ranges from 76.2% in B.C. to 92.4% for FNIHB beneficiaries, where the large proportion is due to both plan design and the relatively lower average age of the population it covers. Non-seniors accounted for a proportion of drug program spending ranging from 60.0% in B.C. to 81.1% for FNIHB.
32
Prescribed Drug Spending in Canada, 2013: A Focus on Public Drug Programs
Table 9: Public Drug Program Spending, by Age Group, Selected Jurisdictions, 2013
Jurisdiction
Non-Seniors (<65) Seniors (65+) Percentage of Active
Beneficiaries (%) Percentage of TPS (%) Percentage of Active
Beneficiaries (%) Percentage of TPS (%) N.L. 53.8 49.6 46.2 50.4 P.E.I. 28.9 44.2 71.1 55.8 N.S. 19.2 17.3 80.8 82.7 N.B. 38.1 43.0 61.9 57.0 Ont. 44.9 33.9 55.1 66.1 Man. 78.3 62.8 21.7 37.2 Sask. 78.1 51.4 21.9 48.6 Alta. 21.8 29.3 78.2 70.7 B.C. 76.2 60.0 23.8 40.0 FNIHB 92.4 81.1 7.6 18.9
Notes * The 10 jurisdictions submitting claims data to the NPDUIS Database as of January 2015 are Newfoundland and Labrador, Prince
Edward Island, Nova Scotia, New Brunswick, Ontario, Manitoba, Saskatchewan, Alberta, British Columbia and the First Nations and Inuit Health Branch.
TPS: Total program spending. Source National Prescription Drug Utilization Information System Database, Canadian Institute for Health Information.
In Saskatchewan, the proportion of non-senior beneficiaries (78.1%) is similar to the proportion in B.C. and Manitoba; however, the proportion of total program spending accounted for by non-seniors (51.4%) is slightly lower due to differences in cost sharing.
Among the remaining provinces, seniors accounted for the majority of both active beneficiaries and total program spending. The seniors’ proportion of beneficiaries ranged from 46.2% in Newfoundland and Labrador to 80.8% in Nova Scotia, and the proportion of program spending accounted for by seniors ranged from 55.8% in P.E.I. to 82.7% in Nova Scotia. It should be noted that drug claims from drug programs for income assistance recipients in Alberta and Nova Scotia are not submitted to the NPDUIS Database. This results in a lower proportion of non-seniors appearing in the data for these provinces, as these programs provide coverage to non-seniors only.
Another important difference between drug programs is the cost-sharing mechanism employed; such as a deductiblex or copayment (or combination of the 2), which will affect the amount that individuals and drug programs pay for each drug claim. For example, even for consistently covered populations like seniors, cost-sharing mechanisms vary. In Nova Scotia and New Brunswick, seniors must pay premiums to enrol in the program, and then costs are shared for each claim. Newfoundland and Labrador, P.E.I., Ontario and Alberta also have copayments for each claim but do not charge premiums. In Manitoba, deductibles are used whereby seniors pay for their drug costs up to a certain percentage of their income and the drug program pays for their drug costs once the deductible has been reached. In Saskatchewan, some seniors have copayments, while x. A deductible is an amount paid by the beneficiary toward eligible drug costs before any part of the drug costs will be paid by the
drug program. Any drug cost exceeding the value of the deductible may be paid, entirely or in part, by the drug program.
33
Prescribed Drug Spending in Canada, 2013: A Focus on Public Drug Programs
others have deductibles, depending on income level; in B.C., deductibles are used, but there are also copayments for each claim once the deductible has been reached. FNIHB covers all eligible costs for those enrolled in its drug program, regardless of age or income.
Common to all provinces included in the analysis, seniors covered by provincial workers’ compensation boards or federal drug programs are not eligible for coverage under provincial drug programs. Federal drug programs include those delivered by
• Correctional Service of Canada;
• First Nations and Inuit Health Branch;xi and
• Veterans Affairs Canada.
In addition to the overview presented here, further information about public drug programs in Canada can be found in the NPDUIS Plan Information Document,9 available at www.cihi.ca, or on the websites of the public drug programs (Appendix F).
Formulary Overview Variation in the number and types of drugs covered by provincial formularies is one of many factors that can lead to differences in drug utilization and expenditure. Other factors include the health, age and sex of the population, prescribing trends and the availability of non-drug therapies.
In 2013, drugs common in all 10 public drug programs made up 93.5% of drug claims and 78.9% of drug program spending on seniors. For drug classes covered in at least 9 jurisdictions, the rates increased to 94.9% of drug claims and 86.7% of total program payments on seniors.xii Because such a large portion of program expenditures relates to drug classes that are listed in most jurisdictions, differences in formulary coverage are not expected to play a large role in any provincial differences in overall utilization and expenditure. However, differences in formulary coverage may have a significant impact on the utilization of specific drugs or drug classes across provinces. Given this potential impact, it is important to consider differences in formulary listings when comparing provincial drug utilization or expenditure for specific drugs or drug classes.
xi. This excludes seniors living in Ontario who also have coverage through FNIHB. These seniors first have their drug claims
covered by the Ontario Drug Benefit program; any remaining drug costs are covered by FNIHB. xii. Drug products without an Anatomical Therapeutic Chemical (ATC) code assigned by Health Canada and products assigned as
pseudo–drug identification numbers are excluded.

34
Prescribed Drug Spending in Canada, 2013: A Focus on Public Drug Programs
Appendix C: Drug Classification Systems Drugs can be analyzed using many different classification systems. For the purposes of this analysis, the following systems were used:
• The drug identification number (DIN) as assigned by Health Canada: A DIN is specific to manufacturer, trade name, active ingredient(s), strength(s) of active ingredient(s) and pharmaceutical form. In this analysis, references to drug products are implied to be specific to the DIN level.
• The pseudo-drug identification number (PDIN), as assigned by a drug program, in cases where a benefit has not been assigned a DIN by Health Canada: This may occur when a benefit is not a drug product (e.g., a glucose test strip) or when it is a compound consisting of multiple drug products, each with its own DIN.
• The 2014 version of the World Health Organization ATC classification system as reported in the Health Canada Drug Product Database:xiii
In the ATC classification system, drugs are divided into different groups according to –the organ or system on which they act and their chemical, pharmacological and therapeutic properties.
The ATC does not distinguish between strength, dosage, route or form of drug, except as –implied by the ATC (e.g., inhaled corticosteroid).
Drugs are classified in groups at 5 different levels: –
o The drugs are divided into 14 main groups (first level), with 1 pharmacological/ therapeutic subgroup (second level).
o The third and fourth levels are chemical/pharmacological/therapeutic subgroups.
o The second, third and fourth levels are often used to identify pharmacological subgroups when they are considered more appropriate than therapeutic or chemical subgroups.
o The fifth level is the chemical substance.
Drug products assigned a DIN but not assigned to an ATC classification by Health –Canada are automatically classified under the ATC classification “unassigned.”
Benefits assigned a PDIN are automatically classified under the ATC classification –“not applicable.”
Where appropriate, CIHI may assign DINs or PDINs to other ATC classifications. –
Drug program spending on and use of DINs and PDINs not assigned to ATC classifications are included in total amounts, but the default drug classes “unassigned” and “not applicable” are not counted as drug classes. This applies to any count of drug classes and to any top 10 lists (i.e., they are not included in any top 10 lists, even if their utilization or spending level puts them in the top 10).
xiii. Although Health Canada typically assigns drug products to a fifth-level ATC, in some cases it may assign an ATC at the fourth
or even third level.

35
Prescribed Drug Spending in Canada, 2013: A Focus on Public Drug Programs
Appendix D: Factors That May Influence Drug Use and Expenditure in Canada Prices • Changes in the unit prices of drugs (both patented and non-patented)
• Changes in retail and wholesale markups and professional fees
• Availability of generics
• International prices
• Inflation
Entry of New Drug Chemicals Volume of Drug Use • Population-related
Changes in population size –
Changes in population structure/distribution –
Age, sex and ethnicity –
Changes in health status of a population –
Emergence of new diseases –
Epidemics –
Prevalence and severity of disease –
• System-related
Changes and transition associated with health system reform –
Availability and access to third-party insurance coverage –
Changes in policies and programs –
Extent of formulary listings –
Eligibility and copayments –
• Research- and technology-related
New treatment approaches –
Drugs replacing surgery –
Drug therapy for previously untreatable or undertreated diseases –
Availability of more and/or improved diagnostic technology –
Outcomes research, evidence-based preventive or curative approaches in diagnosis –or treatment
Use of programs and technology in monitoring patients –

36
Prescribed Drug Spending in Canada, 2013: A Focus on Public Drug Programs
• Pharmaceutical industry–related
Development of new drug products (e.g., new strengths, new drug forms –and presentations)
Promotion of drugs to physicians –
Drug sampling –
Direct-to-consumer advertising –
• Practice- and people-related (health care providers and consumers)
Changes in prescribing and dispensing practices –
Number and mix of prescribers (specialists, general practitioners, nurse practitioners –and others)
Multiple doctoring –
Consumers’ expectations and behaviours –
Adherence to treatment –

37
Prescribed Drug Spending in Canada, 2013: A Focus on Public Drug Programs
Appendix E: Methodological Notes Data Sources National Health Expenditure Database CIHI’s National Health Expenditure Database (NHEX) contains a historical series of macro-level health expenditure statistics by province and territory. The “drugs” category in NHEX is intended to measure final consumption, outside an institutional setting, of drugs purchased by consumers or third-party payers on their behalf, generally from retail outlets. Drug expenditure data in NHEX is an estimate that represents the final costs to Canadian consumers, including dispensing fees, markups and appropriate taxes. For more information on the drugs component of NHEX, please refer to CIHI’s National Health Expenditure Trends report series.
Geographic Prescription Monitor The Geographic Prescription Monitor, maintained by IMS Brogan, contains retail prescription information on volume of dollars and units of pharmaceutical products by payer (i.e., public drug program, private insurer, out of pocket). Dollars represent drug/ingredient costs and do not include dispensing fees or retail markups.
National Prescription Drug Utilization Information System Database The drug claims and formulary data used in this analysis comes from the NPDUIS Database, as submitted by Newfoundland and Labrador, Prince Edward Island, Nova Scotia, New Brunswick, Ontario, Manitoba, Saskatchewan, Alberta, British Columbia, and the First Nations and Inuit Health Branch provincial and federal public drug programs. The NPDUIS Database houses pan-Canadian information related to public program formularies, drug claims, policies and population statistics. It was designed to provide information that supports accurate, timely and comparative analytic and reporting requirements for the establishment of sound pharmaceutical policies and the effective management of Canada’s public drug benefit programs.
The NPDUIS Database includes claims accepted by public drug programs, either for reimbursement or to be applied toward a deductible.xiv Claims are included regardless of whether the individual actually used the drugs.
The NPDUIS Database does not include information regarding
• Prescriptions that were written but never dispensed;
• Prescriptions that were dispensed but for which the associated drug costs were not submitted to or not accepted by the public drug programs; or
• Diagnoses or conditions for which prescriptions were written.
xiv. In Manitoba and Saskatchewan, this includes accepted claims for people who are eligible for coverage under a provincial drug
program but have not submitted an application and, therefore, do not have a defined deductible.

38
Prescribed Drug Spending in Canada, 2013: A Focus on Public Drug Programs
Drug claims data from Nova Scotia, New Brunswick, Manitoba, Saskatchewan and Alberta was available for 2002 through 2013; data for Newfoundland and Labrador was available from 2009 onward; for Ontario and FNIHB, it was available from 2011 onward; and for P.E.I. and B.C., it was available from 2007 through 2013. Analyses that include drug claims data prior to 2007 do not include data from P.E.I. or B.C., and those prior to 2012 do not include data from Newfoundland and Labrador, Ontario or FNIHB.
Table 10: Claims Data Sources From the Public Drug Programs in the 10 Jurisdictions
Jurisdiction Plan/Program Description Newfoundland and Labrador Foundation Plan
65 Plus Plan
Access Plan
Select Needs/Cystic Fibrosis Plan
Select Needs/Growth Hormone Plan
Assurance Plan
Prince Edward Island Diabetes Control
Family Health Benefit
High-Cost Drug
Nursing Home
Seniors’ Drug Cost Assistance
Catastrophic Drug
Children in Care Financial Assistance
Sexually Transmitted Disease
Quit Smoking Nova Scotia Diabetic Assistance Pharmacare Program
Palliative Home Care Drug Coverage Program
Pharmacare Long-Term Care (Under 65)
Drug Assistance for Cancer Patients
Seniors’ Pharmacare Program
Family Pharmacare Program New Brunswick Seniors
Cystic Fibrosis
Individuals in Licensed Residential Facilities
Social Development Clients
Children in Care of the Minister of Social Development and Special Needs Children
Multiple Sclerosis
Organ Transplant
Human Growth Hormone
HIV/AIDS
Nursing Home Residents
(cont’d on next page)

39
Prescribed Drug Spending in Canada, 2013: A Focus on Public Drug Programs
Table 10: Claims Data Sources From the Public Drug Programs in the 10 Jurisdictions (cont’d)
Jurisdiction Plan/Program Code—Description Ontario Ministry of Community Services (MCSS)
MOHLTC Ontario Drug Benefit Program (ODB)
Manitoba Employment and Income Assistance Program
Palliative Care
Pharmacare
Personal Home Care/Nursing Homes
Saskatchewan Universal Program Alberta Non-Group
Seniors
Palliative Care
British Columbia Fair PharmaCare
Permanent Residents of Licensed Residential Care Facilities
Recipients of British Columbia Income Assistance
Cystic Fibrosis
Children in the At Home Program
No-Charge Psychiatric Medication Program
BC Palliative Care Drug Plan
Smoking Cessation
First Nations and Inuit Health Branch
Non-Insured Health Benefits Program
Provincial Notes Prince Edward Island
Claims dispensed through the Children in Care, Catastrophic Drug, Seniors’ Drug Cost Assistance, Diabetes, Family Health Benefit, High-Cost Drug, Nursing Home, Quit Smoking and Sexually Transmitted Disease programs are included in the NPDUIS Database. Claims for all other plans are not submitted.
Nova Scotia
Claims dispensed through the Department of Community Services Pharmacare Benefits Program are not submitted.
Saskatchewan
Claims for non-published drug identification numbers (i.e., DINs not listed on the Saskatchewan Drug Formulary) and claims dispensed through special programs, such as the Saskatchewan Cancer Agency, are not submitted to the NPDUIS Database. Claims dispensed through Saskatchewan Aids to Independent Living and Supplementary Health are included in the NPDUIS Database only if they are for DINs published on the Saskatchewan Drug Formulary.

40
Prescribed Drug Spending in Canada, 2013: A Focus on Public Drug Programs
Alberta
Claims dispensed through the Income Support, Alberta Adult Health Benefit, Assured Income for the Severely Handicapped and Alberta Child Health Benefit programs are not submitted. Claims dispensed to residents of long-term care facilities are not submitted to the NPDUIS Database.
First Nations and Inuit Health Branch
The FNIHB client population decreased significantly in 2013 with the creation of the First Nations Health Authority (FNHA). In a phased approach, between July and October 2013, the FNHA assumed the programs, services and responsibilities formerly provided by FNIHB to First Nations clients residing in B.C. As a result, claims in B.C. or for FNHA clients have been excluded from October 1, 2013, onward.
Calculation Methods Claims from years 2003, 2008 and 2013 from the 10 jurisdictions submitting claims data to the NPDUIS Database (Newfoundland and Labrador, P.E.I., Nova Scotia, New Brunswick, Ontario, Manitoba, Saskatchewan, Alberta, B.C. and FNIHB) were used for this analysis. Due to data availability, Newfoundland and Labrador, Ontario and FNIHB data is excluded from analyses using data prior to 2012, and P.E.I. and B.C. data is excluded from analyses prior to 2007.
Average Annual Growth Rate
The average annual growth rate is the constant annual rate necessary for a value at the beginning of a period to grow to a value at the end of a period over the number of compounding years in the period. The formula used to calculate the average annual rate of growth is as follows:
(e(ln(value at end of period) − ln(value at beginning of period))/(T − 1) − 1)
Where the constant “e” equals 2.718, which is the base of the natural logarithm, and “T” equals the number of years in the period.
Total Drug Program Spending
Calculated by summing the amount that the drug program paid for each accepted claim.
Total Drug Program Spending per Beneficiary
Calculated by dividing the total amount paid by the public drug program for each claim by the total number of paid beneficiaries.
Rate of Use
Calculated by dividing the number of active beneficiaries who had at least 1 claim for the group (e.g., broad therapeutic category, drug class) by the total number of active beneficiaries.

41
Prescribed Drug Spending in Canada, 2013: A Focus on Public Drug Programs
Brand and Generic Products
Identification of brand and generic products is based on the methodology developed by CIHI using data sources such as the Health Canada Drug Product Database (HC-DPD), the Health Canada Notice of Compliance (HC-NOC) and the Health Canada Patent Register. Products may be categorized in 1 of the following categories:
1. Brand Name Products: Products submitted as new drug submission/active ingredient(s) to Health Canada as reported by the HC-NOC database, associated with a patent number as reported by the Health Canada Patent Register database, or manufactured by an innovative pharmaceutical research company. Products assigned with Schedule D (Biological) as reported by the HC-DPD.
2. Generic Products: Products with a description that contains the main active ingredient as reported by Health Canada and/or a prefix of a generic company name (e.g., NOVO, APO, PMS, RATIO, SANDOZ); products not otherwise defined as brand name products.
Over-the-counter products (those with an assigned schedule of “OTC” as reported in the HC-DPD) were excluded from analyses involving brand name and generic drugs.
Limitations As claims data indicates only that a drug was dispensed, and not that it was used, it may not always reflect utilization. A patient may take all, some or none of a dispensed prescription.
The NPDUIS Database does not contain information regarding diagnoses or the conditions for which prescriptions were written. Therefore, the conditions that contribute to drug program spending cannot be identified with certainty. However, identifying the most common indications for the drug classes that account for the majority of spending gives an idea of which conditions are the main contributors.
42
Prescribed Drug Spending in Canada, 2013: A Focus on Public Drug Programs
Appendix F: Federal, Provincial and Territorial Drug Programs More information on public drug programs is available from the following websites:
Newfoundland and Labrador Prescription Drug Program www.health.gov.nl.ca/health/prescription/index.html
Prince Edward Island Pharmacare www.healthpei.ca/pharmacare
Nova Scotia Pharmacare https://www.gov.ns.ca/health/pharmacare/
New Brunswick Prescription Drug Program www.gnb.ca/0051/0212/index-e.asp
Régime général d’assurance médicaments du Québec (RGAM) www.ramq.gouv.qc.ca/en/citizens/prescription-drug-insurance/Pages/description.aspx
Ontario Drug Benefits www.health.gov.on.ca/en/public/programs/drugs/
Manitoba Pharmacare Program www.gov.mb.ca/health/pharmacare/index.html
Saskatchewan Drug Plan www.health.gov.sk.ca/drug-plan-benefits
Alberta Prescription Drug Program www.health.alberta.ca/services/drug-coverage-services.html
British Columbia PharmaCare www.health.gov.bc.ca/pharmacare/
Yukon Pharmacare www.hss.gov.yk.ca/pharmacare.php
Northwest Territories Health Care Plan www.hss.gov.nt.ca/health/nwt-health-care-plan
Nunavut www.gov.nu.ca/health/information/health-insurance
Health Canada—First Nations and Inuit Health Branch www.hc-sc.gc.ca/fniah-spnia/nihb-ssna/index-eng.php

43
Prescribed Drug Spending in Canada, 2013: A Focus on Public Drug Programs
Appendix G: Percentage of Public Drug Program Spending, by Broad Therapeutic Category, Selected Jurisdictions,* 2013
Broad Therapeutic Category Percentage of Public Drug Program Spending (%)
N.L. P.E.I. N.S. N.B. Ont. Sask. Man. Alta. B.C. FNIHB Combined
Nervous System 17.7 21.0 14.4 23.9 18.8 17.9 21.7 13.2 31.0 22.7 20.1 Cardiovascular System 20.7 20.0 23.5 17.3 15.8 17.0 11.2 17.9 13.4 11.8 15.7 Antineoplastic and Immunomodulating Agents
13.2 24.0 19.4 18.0 12.2 22.4 30.1 20.2 20.2 7.3 15.1
Alimentary Tract and Metabolism
14.6 14.3 13.2 12.2 12.4 10.3 10.5 11.6 9.6 15.0 12.1
Respiratory System 6.7 6.1 7.1 7.7 6.4 6.5 5.2 7.7 5.1 6.8 6.4 Sensory Organs 2.4 2.4 2.3 3.2 7.4 2.2 0.8 9.2 1.1 1.1 5.7 Anti-Infectives for Systemic Use
4.1 1.2 2.1 5.2 5.2 5.2 6.2 3.3 4.1 8.3 5.0
Blood and Blood-Forming Organs
3.2 1.7 3.4 4.0 4.0 3.7 2.6 5.2 2.9 2.9 3.8
Musculoskeletal System 3.0 1.1 2.7 3.1 4.2 3.1 2.2 3.6 2.3 3.5 3.6
Genitourinary System and Sex Hormones
2.1 1.6 1.8 2.3 2.6 2.3 1.8 3.1 1.4 3.2 2.4
Systemic Hormonal Preparations
1.4 0.8 2.2 1.5 1.4 1.1 2.1 1.9 1.5 1.1 1.5
Dermatologicals 1.5 0.9 1.1 0.8 1.1 1.0 0.6 0.8 0.7 2.3 1.0 Various 0.3 0.1 0.3 0.3 0.9 0.5 0.2 0.4 0.5 0.7 0.7 Anti-Parasitic Products, Insecticides and Repellents
0.2 0.1 0.2 0.2 0.1 0.2 0.2 0.2 0.1 0.7 0.2
Unassigned† 9.0 4.9 6.4 0.4 7.5 6.6 4.5 1.8 6.3 12.5 6.8
Notes * The 10 jurisdictions submitting claims data to the NPDUIS Database as of January 2015 are Newfoundland and Labrador, Prince
Edward Island, Nova Scotia, New Brunswick, Ontario, Manitoba, Saskatchewan, Alberta, British Columbia and the First Nations and Inuit Health Branch.
† This category includes drug products without an ATC assigned by Health Canada and products assigned as pseudo-DINs. Source National Prescription Drug Utilization Information System Database, Canadian Institute for Health Information.

44
Prescribed Drug Spending in Canada, 2013: A Focus on Public Drug Programs
Appendix H: Generic Drugs as a Percentage of Total Drug Program Spending and Total Number of Accepted Claims, Selected Jurisdictions,* 2003, 2008 and 2013
Jurisdiction
2003 2008 2013 Percentage of Claims
Percentage of TPS
Percentage of Claims
Percentage of TPS
Percentage of Claims
Percentage of TPS
N.L. N/A N/A N/A N/A 74.3% 48.7% P.E.I. N/A N/A 59.5% 37.2% 68.4% 41.5% N.S. 48.0% 29.7% 59.5% 37.0% 72.1% 45.1%
N.B. 49.5% 24.8% 64.4% 38.0% 73.2% 39.0% Ont. N/A N/A N/A N/A 70.8% 31.1% Man. 43.0% 20.6% 58.8% 32.0% 76.0% 38.0% Sask. 46.3% 22.4% 54.7% 31.0% 67.9% 32.1% Alta. 42.0% 20.5% 56.6% 31.5% 72.1% 32.3%
B.C. N/A N/A 62.2% 40.3% 71.7% 38.5% FNIHB N/A N/A N/A N/A 73.9% 48.8%
Notes * The 10 jurisdictions submitting claims data to the NPDUIS Database as of January 2015 are Newfoundland and Labrador, Prince
Edward Island, Nova Scotia, New Brunswick, Ontario, Manitoba, Saskatchewan, Alberta, British Columbia and the First Nations and Inuit Health Branch.
TPS: Total program spending. N/A: Data not available. Source National Prescription Drug Utilization Information System Database, Canadian Institute for Health Information.
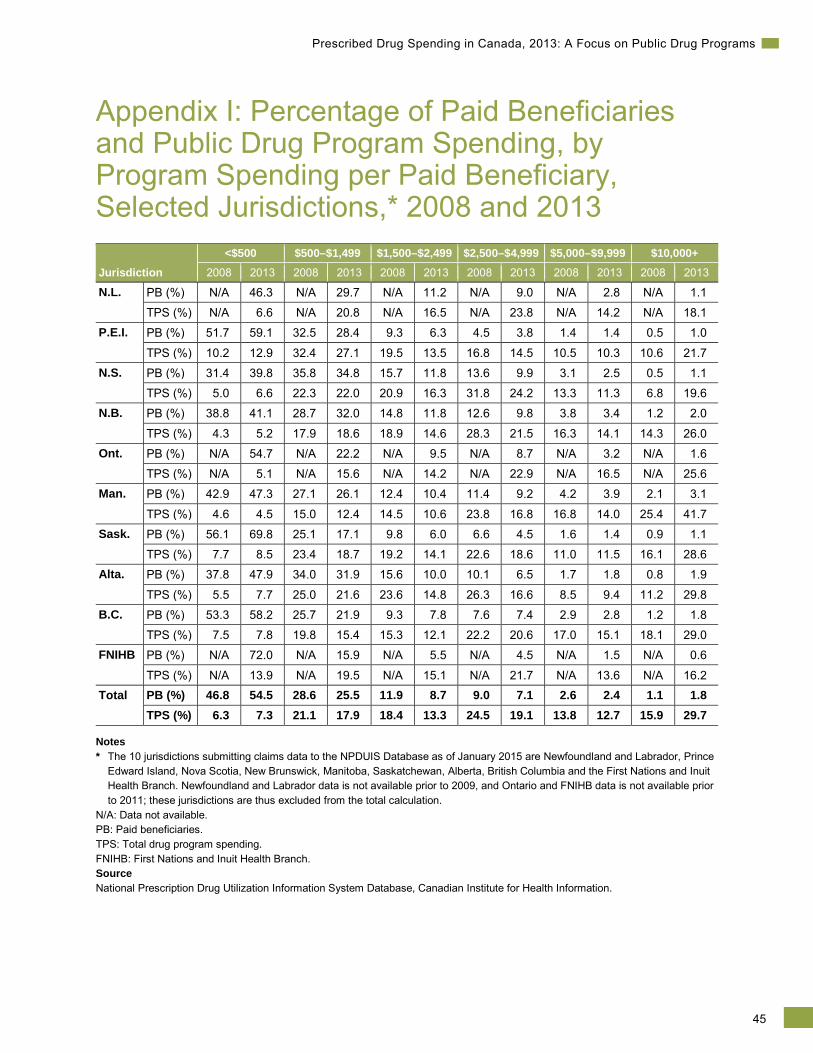
45
Prescribed Drug Spending in Canada, 2013: A Focus on Public Drug Programs
Appendix I: Percentage of Paid Beneficiaries and Public Drug Program Spending, by Program Spending per Paid Beneficiary, Selected Jurisdictions,* 2008 and 2013
Jurisdiction <$500 $500–$1,499 $1,500–$2,499 $2,500–$4,999 $5,000–$9,999 $10,000+
2008 2013 2008 2013 2008 2013 2008 2013 2008 2013 2008 2013
N.L. PB (%) N/A 46.3 N/A 29.7 N/A 11.2 N/A 9.0 N/A 2.8 N/A 1.1
TPS (%) N/A 6.6 N/A 20.8 N/A 16.5 N/A 23.8 N/A 14.2 N/A 18.1 P.E.I. PB (%) 51.7 59.1 32.5 28.4 9.3 6.3 4.5 3.8 1.4 1.4 0.5 1.0
TPS (%) 10.2 12.9 32.4 27.1 19.5 13.5 16.8 14.5 10.5 10.3 10.6 21.7 N.S. PB (%) 31.4 39.8 35.8 34.8 15.7 11.8 13.6 9.9 3.1 2.5 0.5 1.1
TPS (%) 5.0 6.6 22.3 22.0 20.9 16.3 31.8 24.2 13.3 11.3 6.8 19.6 N.B. PB (%) 38.8 41.1 28.7 32.0 14.8 11.8 12.6 9.8 3.8 3.4 1.2 2.0
TPS (%) 4.3 5.2 17.9 18.6 18.9 14.6 28.3 21.5 16.3 14.1 14.3 26.0 Ont. PB (%) N/A 54.7 N/A 22.2 N/A 9.5 N/A 8.7 N/A 3.2 N/A 1.6
TPS (%) N/A 5.1 N/A 15.6 N/A 14.2 N/A 22.9 N/A 16.5 N/A 25.6 Man. PB (%) 42.9 47.3 27.1 26.1 12.4 10.4 11.4 9.2 4.2 3.9 2.1 3.1
TPS (%) 4.6 4.5 15.0 12.4 14.5 10.6 23.8 16.8 16.8 14.0 25.4 41.7 Sask. PB (%) 56.1 69.8 25.1 17.1 9.8 6.0 6.6 4.5 1.6 1.4 0.9 1.1
TPS (%) 7.7 8.5 23.4 18.7 19.2 14.1 22.6 18.6 11.0 11.5 16.1 28.6 Alta. PB (%) 37.8 47.9 34.0 31.9 15.6 10.0 10.1 6.5 1.7 1.8 0.8 1.9
TPS (%) 5.5 7.7 25.0 21.6 23.6 14.8 26.3 16.6 8.5 9.4 11.2 29.8 B.C. PB (%) 53.3 58.2 25.7 21.9 9.3 7.8 7.6 7.4 2.9 2.8 1.2 1.8
TPS (%) 7.5 7.8 19.8 15.4 15.3 12.1 22.2 20.6 17.0 15.1 18.1 29.0 FNIHB PB (%) N/A 72.0 N/A 15.9 N/A 5.5 N/A 4.5 N/A 1.5 N/A 0.6
TPS (%) N/A 13.9 N/A 19.5 N/A 15.1 N/A 21.7 N/A 13.6 N/A 16.2 Total PB (%) 46.8 54.5 28.6 25.5 11.9 8.7 9.0 7.1 2.6 2.4 1.1 1.8
TPS (%) 6.3 7.3 21.1 17.9 18.4 13.3 24.5 19.1 13.8 12.7 15.9 29.7
Notes * The 10 jurisdictions submitting claims data to the NPDUIS Database as of January 2015 are Newfoundland and Labrador, Prince
Edward Island, Nova Scotia, New Brunswick, Manitoba, Saskatchewan, Alberta, British Columbia and the First Nations and Inuit Health Branch. Newfoundland and Labrador data is not available prior to 2009, and Ontario and FNIHB data is not available prior to 2011; these jurisdictions are thus excluded from the total calculation.
N/A: Data not available. PB: Paid beneficiaries. TPS: Total drug program spending. FNIHB: First Nations and Inuit Health Branch. Source National Prescription Drug Utilization Information System Database, Canadian Institute for Health Information.

46
Prescribed Drug Spending in Canada, 2013: A Focus on Public Drug Programs
Appendix J: Proportion of Public Drug Program Spending per Paid Beneficiary per Chemical, Selected Jurisdictions,* 2003, 2008 and 2013
Program Spending per Paid Beneficiary per Chemical
Proportion of TPS (%)
Proportion of Number of Chemicals
(%) Proportion of
TPS (%)
Proportion of Number of Chemicals
(%) Proportion of
TPS (%)
Proportion of Number of Chemicals
(%) 2003 2008 2013
<$500 75.3 83.8 64.4 79.3 56.0 76.2
$500–$1,499 13.7 8.5 21.0 9.9 12.9 10.7 $1,500–$4,999 4.6 5.1 3.9 5.9 3.5 4.7 $5,000–$9,999 2.8 1.5 1.6 2.3 6.4 3.5 $10,000+ 3.7 1.1 9.2 2.6 21.3 5.0
Notes * The 5 jurisdictions submitting claims data to the NPDUIS Database as of January 2015 are Nova Scotia, New Brunswick,
Manitoba, Saskatchewan and Alberta. Ontario and First Nations and Inuit Health Branch data is not available prior to 2011, Newfoundland and Labrador data is not available prior to 2009, and Prince Edward Island and British Columbia data is not available prior to 2005; these jurisdictions are thus excluded from the results.
TPS: Total program spending. Source National Prescription Drug Utilization Information System Database, Canadian Institute for Health Information.

47
Prescribed Drug Spending in Canada, 2013: A Focus on Public Drug Programs
Appendix K: Top 10 Drug Classes With the Highest Proportion of Public Drug Program Spending, by Jurisdiction, 2013 Newfoundland and Labrador
Drug Class TPS
($ 000) Proportion of
TPS (%) Rate of Use
(%) Tumour Necrosis Factor Alpha Inhibitors (Anti-TNF Drugs) 7,795.0 5.6 0.4 HMG-CoA Reductase Inhibitors 7,482.7 5.4 36.1 Proton Pump Inhibitors 5,371.9 3.9 29.4
ACE Inhibitors, Plain 4,514.1 3.2 22.2 Dihydropyridine Derivatives 3,998.0 2.9 12.9 Selective Serotonin Reuptake Inhibitors 3,356.2 2.4 13.3 Diazepines, Oxazepines, Thiazepines and Oxepines 3,202.0 2.3 4.9 Glucocorticoids 2,760.0 2.0 9.6
Beta-Blocking Agents, Selective 2,497.9 1.8 21.7 Natural Opium Alkaloids 2,282.8 1.6 12.9
Note TPS: Total program spending. Source National Prescription Drug Utilization Information System Database, Canadian Institute for Health Information.
Prince Edward Island
Drug Class TPS
($ 000) Proportion of
TPS (%) Rate of Use
(%) Tumour Necrosis Factor Alpha Inhibitors (Anti-TNF Drugs) 3,934.6 13.6 0.8 HMG-CoA Reductase Inhibitors 1,749.8 6.1 33.4 Proton Pump Inhibitors 1,166.1 4.0 23.7 Drugs Used in Opioid Dependence 1,052.7 3.7 1.2
Insulins and Analogues for Injection, Fast-Acting 857.2 3.0 6.3 Diazepines, Oxazepines, Thiazepines and Oxepines 824.8 2.9 3.1 ACE Inhibitors, Plain 795.5 2.8 19.1 Dihydropyridine Derivatives 686.5 2.4 15.2
Selective Serotonin Reuptake Inhibitors 680.3 2.4 12.4 Protein Kinase Inhibitors 659.2 2.3 0.1
Note TPS: Total program spending. Source National Prescription Drug Utilization Information System Database, Canadian Institute for Health Information.
P.E.I.
N.L.

48
Prescribed Drug Spending in Canada, 2013: A Focus on Public Drug Programs
Nova Scotia
Drug Class TPS
($ 000) Proportion of
TPS (%) Rate of Use
(%) Tumour Necrosis Factor Alpha Inhibitors (Anti-TNF Drugs) 19,927.4 10.9 0.8 HMG-CoA Reductase Inhibitors 10,990.7 6.0 44.7 Proton Pump Inhibitors 7,800.6 4.3 32.4
ACE Inhibitors, Plain 5,578.5 3.1 23.2 Dihydropyridine Derivatives 4,970.0 2.7 18.5 Adrenergics in Combination With Corticosteroids or Other Drugs, Excluding Anticholinergics
4,472.9 2.5 3.9
Beta-Blocking Agents, Selective 3,770.7 2.1 26.4
Selective Serotonin Reuptake Inhibitors 3,663.6 2.0 13.7 Anticholinergics 3,657.1 2.0 8.5 Protein Kinase Inhibitors 3,471.9 1.9 0.1
Note TPS: Total program spending. Source National Prescription Drug Utilization Information System Database, Canadian Institute for Health Information.
New Brunswick
Drug Class TPS
($ 000) Proportion of
TPS (%) Rate of Use
(%) Tumour Necrosis Factor Alpha Inhibitors (Anti-TNF Drugs) 12,094.3 6.5 0.5 Proton Pump Inhibitors 9,561.6 5.1 33.3
HMG-CoA Reductase Inhibitors 7,675.2 4.1 37.4 Diazepines, Oxazepines, Thiazepines and Oxepines 6,915.3 3.7 8.8 Adrenergics in Combination With Corticosteroids or Other Drugs, Excluding Anticholinergics
5,355.0 2.9 5.3
Drugs Used in Opioid Dependence 5,276.3 2.8 1.7
ACE Inhibitors, Plain 5,032.5 2.7 23.1 Dihydropyridine Derivatives 4,198.8 2.3 15.8 Interferons 4,154.5 2.2 0.3 Selective Serotonin Reuptake Inhibitors 4,126.0 2.2 16.7
Note TPS: Total program spending. Source National Prescription Drug Utilization Information System Database, Canadian Institute for Health Information.
N.B.
N.S.

49
Prescribed Drug Spending in Canada, 2013: A Focus on Public Drug Programs
Ontario
Drug Class TPS
($ 000) Proportion of
TPS (%) Rate of Use
(%) Antineovascularization Agents 272,401.7 5.9 0.8 Tumour Necrosis Factor Alpha Inhibitors (Anti-TNF Drugs) 201,708.5 4.4 0.3 HMG-CoA Reductase Inhibitors 179,781.7 3.9 32.5
Proton Pump Inhibitors 145,155.3 3.2 22.4 Adrenergics in Combination With Corticosteroids or Other Drugs, Excluding Anticholinergics
136,109.2 3.0 6.3
Other Antidepressants 114,676.8 2.5 9.3 ACE Inhibitors, Plain 111,475.7 2.4 17.9
Selective Serotonin Reuptake Inhibitors 107,754.3 2.3 9.7 Anticholinesterases 102,050.8 2.2 2.3 Natural Opium Alkaloids 95,290.1 2.1 12.8
Note TPS: Total program spending. Source National Prescription Drug Utilization Information System Database, Canadian Institute for Health Information.
Manitoba
Drug Class TPS
($ 000) Proportion of
TPS (%) Rate of Use
(%) Tumour Necrosis Factor Alpha Inhibitors (Anti-TNF Drugs) 50,343.8 16.8 0.3 Protein Kinase Inhibitors 9,601.6 3.2 0.0
Natural Opium Alkaloids 8,931.8 3.0 15.0 Diazepines, Oxazepines, Thiazepines and Oxepines 8,695.0 2.9 2.3 Proton Pump Inhibitors 8,511.2 2.8 7.5 Interferons 8,149.6 2.7 0.1 Adrenergics in Combination With Corticosteroids or Other Drugs, Excluding Anticholinergics
7,664.6 2.6 3.8
Other Antiepileptics 6,479.6 2.2 3.4 HMG-CoA Reductase Inhibitors 6,399.2 2.1 16.2 Other Antidepressants 6,023.4 2.0 6.2
Note TPS: Total program spending. Source National Prescription Drug Utilization Information System Database, Canadian Institute for Health Information.
Man.
Ont.

50
Prescribed Drug Spending in Canada, 2013: A Focus on Public Drug Programs
Saskatchewan
Drug Class TPS
($ 000) Proportion of
TPS (%) Rate of Use
(%) Tumour Necrosis Factor Alpha Inhibitors (Anti-TNF Drugs) 42,709.6 15.1 0.3 HMG-CoA Reductase Inhibitors 10,281.4 3.6 15.9 Proton Pump Inhibitors 8,527.8 3.0 10.6
Natural Opium Alkaloids 7,675.8 2.7 11.6 Interferons 7,286.9 2.6 0.1 Diazepines, Oxazepines, Thiazepines and Oxepines 6,719.5 2.4 2.4 Other Antiepileptics 6,463.2 2.3 4.0 Adrenergics in Combination With Corticosteroids or Other Drugs, Excluding Anticholinergics
6,438.6 2.3 1.7
ACE Inhibitors, Plain 6,208.6 2.2 10.2 Dihydropyridine Derivatives 5,295.4 1.9 6.8
Note TPS: Total program spending. Source National Prescription Drug Utilization Information System Database, Canadian Institute for Health Information.
Alberta
Drug Class TPS
($ 000) Proportion of
TPS (%) Rate of Use
(%) Tumour Necrosis Factor Alpha Inhibitors (Anti-TNF Drugs) 91,337.6 13.3 0.9 Antineovascularization Agents 54,532.7 7.9 1.1
Adrenergics in Combination With Corticosteroids or Other Drugs, Excluding Anticholinergics
29,655.0 4.3 9.5
HMG-CoA Reductase Inhibitors 29,362.9 4.3 38.6 Proton Pump Inhibitors 26,166.2 3.8 29.2 ACE Inhibitors, Plain 18,853.0 2.7 22.9
Natural Opium Alkaloids 16,200.0 2.4 16.1 Anticholinergics 14,462.3 2.1 6.0 Interferons 13,698.7 2.0 0.2 Dihydropyridine Derivatives 13,451.5 2.0 17.0
Note TPS: Total program spending. Source National Prescription Drug Utilization Information System Database, Canadian Institute for Health Information.
Alta.
Sask.
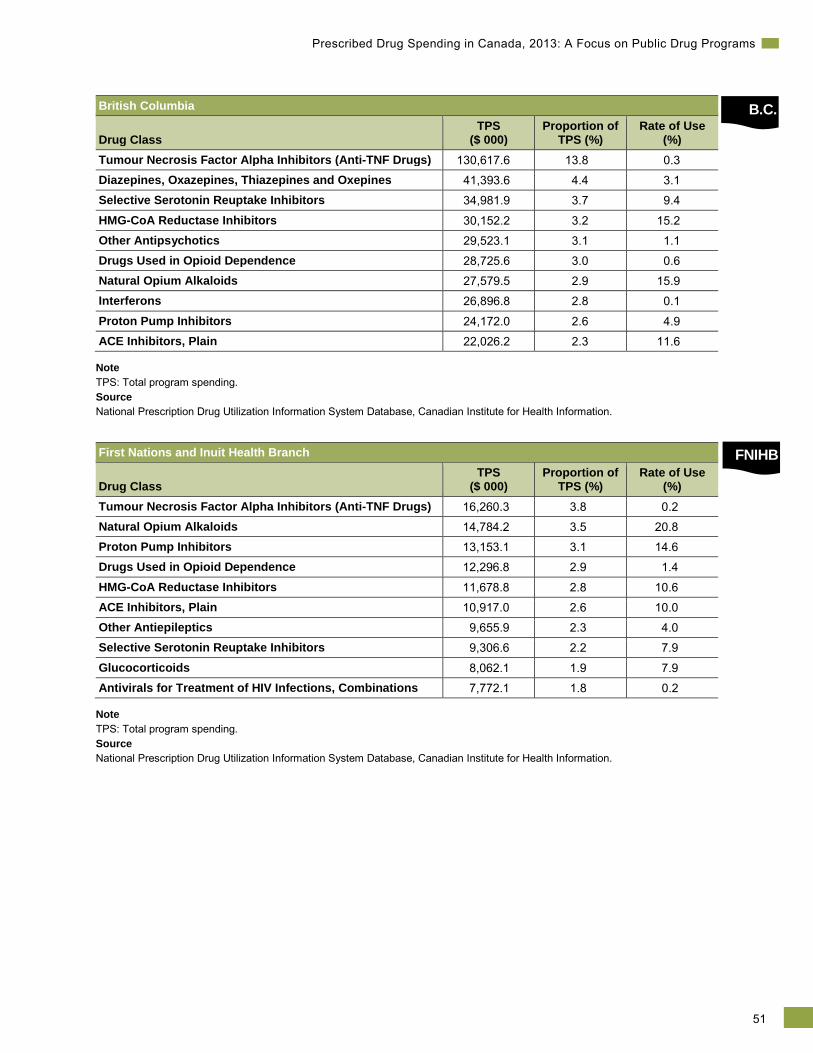
51
Prescribed Drug Spending in Canada, 2013: A Focus on Public Drug Programs
British Columbia
Drug Class TPS
($ 000) Proportion of
TPS (%) Rate of Use
(%) Tumour Necrosis Factor Alpha Inhibitors (Anti-TNF Drugs) 130,617.6 13.8 0.3 Diazepines, Oxazepines, Thiazepines and Oxepines 41,393.6 4.4 3.1 Selective Serotonin Reuptake Inhibitors 34,981.9 3.7 9.4
HMG-CoA Reductase Inhibitors 30,152.2 3.2 15.2 Other Antipsychotics 29,523.1 3.1 1.1 Drugs Used in Opioid Dependence 28,725.6 3.0 0.6 Natural Opium Alkaloids 27,579.5 2.9 15.9 Interferons 26,896.8 2.8 0.1
Proton Pump Inhibitors 24,172.0 2.6 4.9 ACE Inhibitors, Plain 22,026.2 2.3 11.6
Note TPS: Total program spending. Source National Prescription Drug Utilization Information System Database, Canadian Institute for Health Information.
First Nations and Inuit Health Branch
Drug Class TPS
($ 000) Proportion of
TPS (%) Rate of Use
(%) Tumour Necrosis Factor Alpha Inhibitors (Anti-TNF Drugs) 16,260.3 3.8 0.2 Natural Opium Alkaloids 14,784.2 3.5 20.8 Proton Pump Inhibitors 13,153.1 3.1 14.6 Drugs Used in Opioid Dependence 12,296.8 2.9 1.4
HMG-CoA Reductase Inhibitors 11,678.8 2.8 10.6 ACE Inhibitors, Plain 10,917.0 2.6 10.0 Other Antiepileptics 9,655.9 2.3 4.0 Selective Serotonin Reuptake Inhibitors 9,306.6 2.2 7.9
Glucocorticoids 8,062.1 1.9 7.9 Antivirals for Treatment of HIV Infections, Combinations 7,772.1 1.8 0.2
Note TPS: Total program spending. Source National Prescription Drug Utilization Information System Database, Canadian Institute for Health Information.
B.C.
FNIHB

52
Prescribed Drug Spending in Canada, 2013: A Focus on Public Drug Programs
Appendix L: IMS Brogan Disclaimer IMS Brogan, a unit of IMS Health, has offices in Montréal, Toronto and Ottawa.
IMS Health provides market intelligence and health information to pharmaceutical and health care industries worldwide. For this report, CIHI used IMS Brogan’s Geographic Prescription Monitor, which contains retail prescription information on volume of dollars and units of pharmaceutical products by payer (i.e., public drug program, private insurer, out of pocket). Dollars represent drug/ingredient costs and do not include dispensing fees or retail markups.
IMS Brogan relies on external suppliers for all of its data and therefore, while employing its best efforts to ensure the accuracy and completeness of its data and any analysis thereof, IMS Brogan makes no representation as to the reliability of such data or any application derivative thereof. In no event shall IMS Brogan be liable for any damages, including any consequential, incidental or special damages, resulting from any use or application of its data, whether foreseeable or not, even if IMS Brogan has been advised of the possibility of such damages.

53�
Prescribed Drug Spending in Canada, 2013: A Focus on Public Drug Programs
References 1. Canadian Institute for Health Information. National Health Expenditure Trends, 1975 to 2014.
Ottawa, ON: CIHI; 2014.
2. Morgan S, et al. The Canadian Rx Atlas, Third Edition. Vancouver, BC: Centre for Health Services and Policy Research, University of British Columbia; 2013.
3. Organisation for Economic Co-operation and Development. Health at a Glance 2013: OECD Indicators. Paris, France: OECD; 2013.
4. Canadian Institute for Health Information. Drivers of Prescription Drug Spending in Canada. Ottawa, ON: CIHI; 2012.
5. Patented Medicine Prices Review Board. NPDUIS CompassRx: Annual Public Drug Plan Expenditure Report, 1st Edition. Ottawa, ON: PMPRB; 2015.
6. Canadian Institute for Health Information. Drug Use Among Seniors on Public Drug Programs in Canada, 2002 to 2008. Ottawa, ON: CIHI; 2010.
7. Council of the Federation. Fact Sheet on Pan-Canadian Pharmaceutical Initiatives. http://www.canadaspremiers.ca/en/latest-news/74-2014/370-fact-sheet-on-pan-canadian-pharmaceutical-initiatives. Accessed November 19, 2014.
8. Canadian Institute for Health Information. Prescribed Drug Spending in Canada, 2012: A Focus on Public Drug Programs. Ottawa, ON: CIHI; 2014.
9. Canadian Institute for Health Information. National Prescription Drug Utilization Information System Database—Plan Information Document, July 2014. Ottawa, ON: CIHI; 2014.

Production of this document is made possible by financial contributions from Health Canada and provincial and territorial governments. The views expressed herein do not necessarily represent the views of Health Canada or any provincial or territorial government.
All rights reserved.
The contents of this publication may be reproduced unaltered, in whole or in part and by any means, solely for non-commercial purposes, provided that the Canadian Institute for Health Information is properly and fully acknowledged as the copyright owner. Any reproduction or use of this publication or its contents for any commercial purpose requires the prior written authorization of the Canadian Institute for Health Information. Reproduction or use that suggests endorsement by, or affiliation with, the Canadian Institute for Health Information is prohibited.
For permission or information, please contact CIHI:
Canadian Institute for Health Information495 Richmond Road, Suite 600Ottawa, Ontario K2A 4H6
Phone: 613-241-7860Fax: [email protected]
ISBN 978-1-77109-370-5 (PDF)
© 2015 Canadian Institute for Health Information
How to cite this document:Canadian Institute for Health Information. Prescribed Drug Spending in Canada, 2013: A Focus on Public Drug Programs. Ottawa, ON: CIHI; 2015.
Cette publication est aussi disponible en français sous le titre Dépensesen médicaments prescrits au Canada 2013 : regard sur les régimes publicsd’assurance-médicaments.ISBN 978-1-77109-371-2 (PDF)

www.cihi.caAt the heart of data
Talk to UsCIHI Ottawa 495 Richmond Road, Suite 600 Ottawa, Ontario K2A 4H6 Phone: 613-241-7860
CIHI Toronto 4110 Yonge Street, Suite 300 Toronto, Ontario M2P 2B7 Phone: 416-481-2002
CIHI Victoria 880 Douglas Street, Suite 600 Victoria, British Columbia V8W 2B7 Phone: 250-220-4100
CIHI Montréal 1010 Sherbrooke Street West, Suite 300 Montréal, Quebec H3A 2R7 Phone: 514-842-2226
CIHI St. John’s 140 Water Street, Suite 701 St. John’s, Newfoundland and Labrador A1C 6H6 Phone: 709-576-7006
10166-0515