prepublication version, december 15, 2009 version, december 15, 2009 contributors new york city...
TRANSCRIPT
Prepublication version, December 15, 2009
Prepublication version, December 15, 2009
Contributors
New York City Department of Health and Mental Hygiene: Jane E. Clougherty
Iyad Kheirbek Sarah Johnson Grant Pezeshki
J. Bryan Jacobsen Daniel Kass
Thomas Matte
Mayor’s Office of Long-Term Planning and Sustainability Carter H. Strickland, Jr. Kizzy Charles-Guzman
Queens College City University of New York
Holger M. Eisl John E. Gorczynski
Alyssa Benson Andres Camacho
Jordan Werbe-Fuentes Jonah Haviland-Markowitz
Rolando Munoz Anna Tilles
Steven Markowitz
ZevRoss Spatial Analysis Zev Ross
Hollie Kitson
Acknowledgements: The contributors are grateful to colleagues who provided logistical support and advice, including: Peter D’Amico, Thomas Maguire, and Joseph Noto of the NYC Department of Transportation; John Mattera of the NYC Department of Parks and Recreation; David Wheeler of the New York State Department of Environmental Conservation; Christina Chang and Jason Labate of the NYC Department of Health and Mental Hygiene. The NYCCAS contributors appreciate the input of experts in air pollution monitoring, exposure assessment and health effects who provided comments on the project design and the findings presented in this report. These experts include: Michael Brauer, School of Environmental Health, University of British Columbia; Michael Jerrett, Division of Environmental Health Sciences, School of Public Health, University of California, Berkeley; Patrick Kinney, Department of Environmental Health Sciences, Columbia University Mailman School of Public Health; Jonathan Levy, Department of Environmental Health, Harvard School of Public Health; George D. Thurston, Department of Environmental Medicine, New York University School of Medicine.

Page 3 - New York City Community Air Survey: Results Winter 2008-2009
December 2009 Dear Fellow New Yorker: PlaNYC, the ambitious sustainability initiative launched in 2007, set in motion a range of initiatives to make New York City a healthier and more livable place. It recognizes that our future growth will require more of some things (housing, heat, electricity and transportation) and less of others, especially air pollution and greenhouse gases. By reducing emissions from buildings, vehicles, and other local sources we can accelerate progress towards giving New York City the cleanest air of any large U.S. city. One of PlaNYC’s air quality initiatives was to undertake, for the first time in any American city, a systematic and comprehensive assessment of street-level air quality in all of our neighborhoods. This will inform policy discussions about which local sources are responsible for neighborhood pollution and what are the most promising strategies for curbing those sources. The Health Department is tracking health and environmental quality in every part of the city. The New York City Community Air Survey (NYCCAS), launched last year as part of that effort, is now yielding important insights. This report, an analysis of wintertime air quality, is the first of many that this landmark study will generate. Sustainability and public health policies must be grounded in science. By illuminating the local sources and patterns of air pollution and their effects on public health, NYCCAS fills critical gaps in our knowledge. We hope that you will find it useful and informative. Sincerely,
Thomas Farley, MD, MPH Commissioner Department of Health and Mental Hygiene
Rit Aggarwala Director Office of Long-Term Planning and Sustainability
Page 4 - New York City Community Air Survey: Results Winter 2008-2009
Table of Contents Glossary ............................................................................................................................5
Executive Summary ..........................................................................................................8
Introduction and Background ............................................................................................9
Methods ..........................................................................................................................13
Results ............................................................................................................................20
Discussion.......................................................................................................................33
References......................................................................................................................36
Annex: Reference Map of Community Districts ..............................................................37

Page 5 - New York City Community Air Survey: Results Winter 2008-2009
Glossary Air Quality System (AQS): EPA’s repository of ambient air quality data. The AQS includes data from over 10,000 monitors, 5000 of which are currently active, collected by state, local and tribal agencies, following EPA protocol, and submitted to EPA on a periodic basis, in order to comply with National Ambient Air Quality Standards (NAAQS) and other regulations. Co-Located Samplers: Samplers operated side-by-side, during the same time period. These paired measures are compared as a quality control measure, to establish reproducibility in pollution measurements. Community District (CD): Fifty-nine areas within New York City, each of which is represented by a community board with an advisory and advocacy role in land-use and zoning matters, the City budget, municipal service delivery and other community concerns. DEP permits: New York City Department of Environmental Protection (DEP) permits, which are required for all combustion sources (including boilers and generators) with capacity of >350,000 BTUs and any industrial establishment with emissions. Elemental carbon (EC): Also known as black carbon, EC is a component of particulate matter. EC is produced in the combustion of fuels, and diesel exhaust is an important source. Federal Reference Method (FRM): A method specified by EPA for measuring a given air pollutant to compare with clean air standards. Geographic Information Systems (GIS): A computer-based software system that enables the creation, analysis and application of geographic data or other information linked to specific locations on a map. Land Use Regression (LUR): A statistical modeling technique that examines the geographic relationship between air pollution measurements collected across an urban area and distributed sources, such as traffic, buildings or land-use type. Lattice cell: A two-dimensional unit of space representing a portion of a geographic area. An array of uniformly sized cells (e.g., 300 by 300 meter squares) covering a geographic area, known as a lattice or grid, can be used with geographic information systems (GIS) software to estimate and map environmental characteristics, such as traffic density, building density or estimated area pollution concentrations. National Ambient Air Quality Standards (NAAQS): Federal standards for ambient air pollution concentrations. NAAQS standards are determined by EPA with the goal of protecting public health (Primary Standards) and to protect public welfare, including visibility, damage to animals and crops (Secondary Standards). The New York Community Air Survey (NYCCAS): A local air quality study, part of PlaNYC, to measure street-level concentrations of combustion-related air pollutants shown to impact public health, at 150 locations throughout New York City, in each season of the year. NYCCAS is a collaborative effort among the NYC Department of Health and Mental Hygiene (DOHMH), City University of New York Queens College Center for the Biology of Natural Systems (CBNS) and ZevRoss Spatial Analysis. New York City Department of Environmental Protection (DEP): The agency responsible for the protection of natural resources in New York City, including providing safe drinking water and wastewater treatment for NYC residents, and regulating certain sources of air pollution.
Page 6 - New York City Community Air Survey: Results Winter 2008-2009
New York City Department of Health and Mental Hygiene (DOHMH): The agency responsible of public health issues in New York City. New York City Department of Parks and Recreation (NYC DPR): The agency responsible for New York City’s parks and recreational spaces. NYC DPR manages maintenance of the city parks, permit applications and events. New York City Department of Transportation (DOT): The agency responsible for the management of transportation systems and infrastructure including bridges, tunnels, streets, sidewalks, highways and waterways. New York Metropolitan Transportation Council (NYMTC): Regional planning organization that addresses transportation related issues in the New York region. New York State Department of Environmental Conservation (NYS DEC): The state agency responsible for the management and protection of New York’s natural resources and environment. New York State emissions inventory: NYS Department of Environmental Conservation (DEC) database of air pollution emissions, which include all permitted large emitters. Large emitters are required by law to report emissions data annually to DEC, which is recorded in the emissions inventory database. Nitrogen oxides (NOx): The group of gases composed of only nitrogen and oxygen, including nitrogen dioxide (NO2) and nitric oxide (NO), gaseous compounds formed by combustion. Number 2 fuel oil (#2 Oil): Distillate oil or home heating oil; #2 fuel oil is a distillate fraction of crude oil commonly used in boilers or furnaces for space heating and hot water. Number 4 fuel oil (#4 Oil): A blend of distillate (#2) and residual (#6) fuel oils used in boilers or furnaces for space heating. Most equipment burning #4 or #6 fuel oil in New York City is found in large commercial, residential and institutional buildings. Number 6 fuel oil (#6 Oil): Residual fuel oil; #6 fuel oil is used for space heating in larger buildings equipped with high-heat residual fuel combustion technology. Number 6 oil is also known as “heavy fuel oil” and is the remainder of crude oil, following the removal by distillation of the lighter gasoline and distillate fuel oils. Ozone (O3): A gaseous pollutant, formed in the lower atmosphere when nitrogen oxides react with hydrocarbons (a type of volatile organic compound) in the presence of sunlight. Ozone formed in the lower atmosphere is harmful to health and the environment. Naturally-occurring ozone found 10 to 30 miles above the earth’s surface forms a protective barrier against ultraviolet radiation. Parts per million (ppm):A measure of concentration. For gaseous pollutants, ppm is the ratio of the mass of a pollutant contained in a given quantity of air. PlaNYC: New York City’s first long-term sustainability plan, released in 2007, designed to improve environmental quality and livability while providing for sustainable development in New York City. PlaNYC is implemented by the Mayor’s Office for Long-term Planning and Sustainability, and NYCCAS is one of many initiatives in the plan. PM2.5: Fine particulate matter less than 2.5 micrometers in aerodynamic diameter, composed of many solid chemical compounds. PM2.5 is emitted directly from combustion activities or indirectly formed through chemical reactions in the atmosphere. Primary Land Use Tax-lot Output (PLUTO): Land-use and geographic database maintained by NYC Department of City Planning. The database includes details on the usage (residential,

Page 7 - New York City Community Air Survey: Results Winter 2008-2009
commercial, industrial), footprint and interior square footage of every building in the city, at the tax lot level. Purposeful monitoring site: NYCCAS monitoring sites assigned to fill spatial gaps, to ensure that at least one monitor is located in every community district, and near selected sites of interest, such as areas of high traffic, transportation facilities or major construction projects. Quality Assurance/ Quality Control (QA/QC): Steps taken before, during, and after sample collection and analysis to ensure that all data is accurate and meets acceptable quality standards. An example of a measurement which would not pass QA/QC review is one for which the particulate monitoring pump mechanically failed during sample collection. Reference monitoring site: NYCCAS monitoring sites, centrally located in each borough, away from nearby traffic and commercial/industrial activities. Data from these sites are used to adjust measurements from other NYCCAS sites taken during different time periods for city-wide pollution variation across time. Regulatory monitors: Air quality monitors maintained by NYS DEC, in compliance with EPA methods, and used to assess the metropolitan area’s compliance with National Ambient Air Quality Standards (NAAQS). These monitors measure multiple pollutants at a limited number of mostly rooftop monitoring stations to track hourly, daily and annual trends across the metropolitan area. Sulfur dioxide (SO2): A gaseous pollutant formed by the combustion of fuels containing sulfur (e.g., coal, oil). Systematic monitoring site: NYCCAS monitoring locations, randomly distributed across the city, to reflect the range of traffic and buildings densities. United States Environmental Protection Agency (EPA): The federal agency responsible for environmental regulation and the enforcement of regulatory standards, such as the National Ambient Air Quality Standards (NAAQS). United States Geological Survey (USGS): The federal agency and multi-disciplinary science organization that focuses on biology, geography, geology, geospatial information and water. Among many sources of data provided by USGS are ground-cover data used in some NYCCAS analyses. US Census: A comprehensive census of all U.S. residents is performed every 10 years by the United States Census Bureau. One product of this census is geographic population data, documenting the number, age distribution and demographic characteristics of individuals living in all U.S. census tracts. Volatile organic compounds (VOC): Volatile organic compounds are gaseous pollutants containing carbon (excluding carbon monoxide and carbon dioxide) formed from fuel combustion or evaporation of some liquids and solids such as fuels, paints and solvents. Some VOCs react with nitrogen oxides (NOx) in the presence of sunlight to form ozone. NOTE: In this prepublication version '<URL>' appearing in footnotes to figures refers to the NYCCAS Web page at www.nyc.gov/health/nyccas where more information is available.

Page 8 - New York City Community Air Survey: Results Winter 2008-2009
Executive Summary In 2007, New York City’s first comprehensive sustainability plan, PlaNYC, set the ambitious goal of achieving “the cleanest air quality of any big U.S. city” by 2030. Developed with the help of civic groups, the scientific community and the general public, PlaNYC proposed several city-led emissions-reduction initiatives. PlaNYC also acknowledged the need for citywide air pollution data to complement data from routine regulatory monitoring, prior neighborhood studies and ongoing research. To provide this data, the New York City Community Air Survey (NYCCAS), one of the largest local air quality studies conducted to date, was launched in December 2008. NYCCAS involves measurements of street-level concentrations of combustion-related air pollutants shown to impact public health. Measurements are collected, at 150 locations throughout the city, in each season of the year. Based on associations between measured pollution and indicators of sources near the monitoring sites — such as traffic density or boilers in buildings — NYCCAS provides estimates of air pollution concentrations across the city. This interim report summarizes findings from NYCCAS air monitoring during the winter of 2008-2009. All four pollutants included in this report — fine particles (PM2.5), elemental carbon (EC), nitrogen dioxide (NO2) and sulfur dioxide (SO2) — varied two-fold or more across the NYCCAS monitoring sites within the city. Research has linked each of these pollutants to adverse health effects, especially in individuals with respiratory or cardiovascular conditions. NYCCAS data quantify, for the first time, the extent to which some areas of the city may have higher average pollution levels than other areas. Higher concentrations tend to occur in areas where fuel combustion sources — especially emissions from on-road vehicles and buildings — are more abundant. Specifically, PM2.5 concentrations were greater in areas where there are more large units burning fuel oil in buildings (including the most polluting types of oil, known as ‘residual’ oil, or #4 or #6 oil), more total traffic and more truck traffic. Higher EC concentrations were measured in areas with more truck traffic, large fuel oil burning units, industrial land use and overall traffic. Concentrations of NO2 were greater in areas with a greater density of building interior space (an indicator of overall building-related fuel combustion) and in higher traffic locations as indicated by location on a bus route and overall nearby traffic. Higher SO2 concentrations were observed in areas with more nearby buildings with units burning #4 or #6 heating oil and in higher population areas. The results of the NYCCAS study underscore the importance of ongoing PlaNYC initiatives to reduce emissions from buildings and vehicles, because the density of these sources is associated with higher pollution levels in many neighborhoods. Future reports will provide findings for other seasons, and for annual average air pollution estimates. Because of seasonal differences in weather and emissions, the geographic patterns in air quality in other seasons, and year–round, will likely differ from those summarized in this report. Data from NYCCAS will help to inform air quality initiatives in the next version of PlaNYC, to be published in 2011. New York City’s second round of sustainability planning will continue to draw upon community involvement to develop these initiatives, as did the initial PlaNYC.

Page 9 - New York City Community Air Survey: Results Winter 2008-2009
Introduction and Background In 2007, New York City’s first comprehensive sustainability plan, PlaNYC, set the ambitious goal of achieving “the cleanest air quality of any big U.S. city” by 2030. Developed with the help of civic groups, the scientific community and the general public, PlaNYC proposed several city-led emissions-reduction initiatives and acknowledged the need for citywide air pollution data to complement data from routine air quality monitoring, prior neighborhood studies and ongoing research. To provide this data, the New York City Community Air Survey (NYCCAS), one of the largest local air quality studies conducted to date, was launched in December 2008. NYCCAS involves measurements of street-level air pollution at 150 locations across the city, in each season of the year. The methods used in NYCCAS are based on those used to study within-city geographic variation in air pollution in other cities. By analyzing the association between measured pollution and indicators of sources near the monitoring sites — such as traffic and boilers in buildings — NYCCAS can produce estimates of air quality pollution concentrations across the city. The study will include at least two full years of monitoring. This interim report, based on NYCCAS air monitoring conducted during the winter of 2008-2009, provides the most detailed information yet available on how wintertime air quality varies from place to place across New York City’s diverse neighborhoods. Future reports will provide findings from other seasons and for annual average air pollution estimates. Air pollution is a significant public health problem in New York City Across the country and in New York City, air quality has improved in recent decades, due to measures implemented to meet U.S. Environmental Protection Agency (EPA) clean air regulations. Emissions controls are now required for motor vehicles, factories and electric power plants, and products like motor fuels and paints have been reformulated to reduce emissions. In addition, state agencies, including the New York State Department of Environmental Conservation (NYS DEC), act to enforce emissions limits and to develop other measures to reduce pollution, such as promoting car pooling and encouraging the use of public transportation. These federal and state actions have produced significant improvements in air quality in most parts of the country and in New York City. Despite these efforts, routine air monitoring shows that the New York City metropolitan area still does not meet the clean air standards for two pollutants — fine particulate matter (PM2.5) and ozone (O3). Figure 1 depicts trends for these pollutants at regulatory monitors located within the five boroughs. Scientific research indicates that these levels of air pollution are harmful to public health (U.S. EPA, 2004)

Page 10 - New York City Community Air Survey: Results Winter 2008-2009
Despite improvements, NYC PM2.5 and ozone levels continue to exceed clean air standards
Maximums shown are the 98th percentile 24-hr PM2.5 concentration and the 4th highest daily maximum eight-hour ozone concentration within a year. Source: US EPA Air Quality System (AQS).

Page 11 - New York City Community Air Survey: Results Winter 2008-2009
All New Yorkers can be affected by air pollution, but some populations may be more sensitive to it. Some chronic health problems such as asthma, emphysema or heart disease may be worsened by exposure to air pollution. Young children whose bodies are still developing and seniors may also be more susceptible to air pollution. People without air conditioning at home, school or work may also experience more exposure to outdoor air pollution, compared to those in air-conditioned environments. Thus, for a given level of air pollution, the public health burden will be greater where the population is more susceptible. The air pollutants with the greatest public health impact in New York City result mainly from fuel combustion emissions from vehicles, building heating systems, electric power generators and other sources. Emissions from sources outside the five boroughs and local (within-city) sources contribute to outdoor pollution concentrations; pollution originating far from the city tends to impact air quality relatively evenly across the city, but local sources and their affect on air pollution vary within New York City. These pollutants include fine particles (PM2.5), nitrogen dioxide (NO2), and ground-level ozone (O3), which are being measured by NYCCAS. More information on their sources, health effects and measurement methods is provided in the Methods section of this report. The measurements used to gauge compliance with federal clean air regulations are carried out by the New York State Department of Environmental Conservation (NYS DEC). In addition to providing essential data on long-term trends across the metro area, NYS DEC monitors provide continuous data on hourly and daily fluctuations in air quality, that are related to changes in weather, meteorological conditions and emissions both inside and outside the city (see Figure 2). Existing regulatory monitors capture variation over time in PM2.5 and other pollutants in NYC
Figure 2 shows average of daily (24-hour average) PM2.5 across all regulatory (DEC) Federal Reference Method (FRM) monitors in NYC. Daily levels for the FRM are reported every third day. The values shown here are for the 2008-2009 winter season, corresponding to the NYCCAS winter monitoring campaign. Source: US EPA Air Explorer (http://www.epa.gov/airexplorer/)

Page 12 - New York City Community Air Survey: Results Winter 2008-2009
These data identify days when air pollution levels may increase the risk of acute adverse health effects. NYS DEC data also help to improve air quality forecasts, and are an important resource in scientific research on the health effects of air pollution. NYCCAS Goals: To understand the scope of NYC’s air pollution problem, and to inform future air quality improvement measures For more than a decade, community groups in New York City have partnered with air pollution scientists to study air pollution in their own neighborhoods, and to understand the effects of local sources, such as truck and bus traffic (Kinney et al., 2000; Lena et al., 2002; Maciejczyk et al., 2004). These studies have helped to fill important gaps in the information available about air pollution within New York City. Specifically, regulatory air pollution monitoring in New York as in other cities is carried out at a relatively small number of fixed monitors, mostly on rooftops (Figure 3). As such, it is not designed to capture important neighborhood-to-neighborhood variations within the city. Additional information on neighborhood air quality is emerging from ongoing research on air pollution and health effects in certain parts of the city, especially northern Manhattan and the Bronx. Figure 3: Regulatory air monitoring in New York City occurs at a limited number of locations
Source: New York State Department of Environmental Conservation (DEC)

Page 13 - New York City Community Air Survey: Results Winter 2008-2009
PlaNYC recognized the need for a comprehensive city-wide, year-round study to complement ongoing regulatory monitoring, and to build upon what has been learned about emissions sources in some specific neighborhoods. The Department of Health and Mental Hygiene (NYC DOHMH) was charged with conducting a study of neighborhood variation in air quality, and NYCCAS was launched in December 2008. The goals of NYCCAS are to: Measure concentrations of important air pollutants that affect public health
Measure how pollution concentrations near street level vary across NYC’s diverse neighborhoods, in each season of the year
Learn how emissions from traffic, buildings and other local sources affects differences in air pollution levels across NYC neighborhoods
Help to inform City policy priorities for reducing local emissions and improving air quality
Provide information to help improve how the New York City monitors air quality in the future
Provide estimates of population exposure to air pollution for future surveillance and health research.
This report describes the results from the first season of monitoring, conducted during the winter months of December 2008 through March 2009. Year-round monitoring is ongoing and is currently planned to continue into 2011. Additional results will be shared in future reports.
Methods The design of NYCCAS was built upon established methods used to study within-city variation in air pollution in scientific studies in other cities. In addition, five university-based experts in urban air pollution monitoring and modeling provided comments to the NYCCAS team on the project design and the analyses presented in this report. NYCCAS is using portable air samplers mounted on light poles near street level While most regulatory air monitoring is done at rooftop levels, NYCCAS is collecting air samples along city sidewalks and in parks, where people spend much of their time. To do this, Queens College scientists designed a special monitoring unit that is mounted on light poles at 10 and 12 feet above the ground (Figure 4). The mounting height was chosen to better capture street level exposures, while reducing the risk of tampering. In addition, the monitor height was consistent across all NYCCAS sites, to better observe pollution differences among monitoring locations.

Page 14 - New York City Community Air Survey: Results Winter 2008-2009
Figure 4: NYCCAS Air Sampling Unit
The NYCCAS sampling unit houses a battery powered, computer-controlled pump and filter-based collection device designed for collecting fine particle samples. On the outside of the unit is a small weather-protective housing for passive samplers which collect airborne gaseous pollutants. The unit includes instruments to measure and record temperature and humidity data used to more accurately calculate air pollution concentrations. The units were designed and tested to operate in winter and summer, through all weather conditions, and to allow field teams to rapidly install and retrieve the units from locations across the city. The units are deployed for two-week sampling periods to measure the average concentration of study pollutants during that time. NYCCAS is measuring pollutants that affect the health of New Yorkers
Fine particles (PM2.5) are tiny airborne pieces of solid material, with a diameter of 2.5 micrometers or smaller — about 1/30 the diameter of a human hair. PM2.5 is composed of many different elemental compounds. Some fine particles are emitted directly from sources such as diesel engines. Other particles are formed from chemical reactions in the atmosphere. About half of New York City’s PM2.5 comes from sources outside the city, including vehicles and power plants in the metropolitan area and beyond. The rest comes from sources widely but unevenly distributed across the city, including diesel and gasoline engines, building furnaces and boilers, cooking and road dust. Inhaled fine particles can penetrate deep into the lungs, causing inflammation of the airways and blood vessels. They can worsen lung and heart diseases, resulting in hospital admissions and even deaths, contributing to shortened life expectancy (Pope et al., 2009).
Air pollutants measured by NYCCAS: Fine Particles (PM2.5) Elemental Carbon (EC) Sulfur Dioxide (SO2)
Nitrogen Oxides (NOx)
Ground-level Ozone (O3)

Page 15 - New York City Community Air Survey: Results Winter 2008-2009
NYCCAS is collecting samples of PM2.5 using a computer-controlled pump and filters that are weighed precisely before and after sampling to measure the total mass of the collected particles. In addition, filters are now being analyzed in a laboratory to determine the elemental composition of PM2.5 collected at locations across NYC. Elemental carbon (EC) is one component of PM2.5, and is emitted from diesel exhaust and other sources such as oil-burning. Diesel exhaust particles, indicated by EC, can cause irritation of the breathing passages, respiratory symptoms such as cough or asthma exacerbation, and may increase the risk of cancer and of allergies to pollen and other substances in the environment. NYCCAS is estimating EC levels using a method that measures the amount of light reflected by the PM2.5 sample filters. The measures are also referred to as “black carbon” or “light-absorbing carbon” because samples with more EC reflect less light. This method measures absorbance (abs), a recognized surrogate for EC content, calculated by the International Standard (ISO 9835) method [see Technical Appendix (www.nyc.gov/health/nyccas) for details]. Nitrogen dioxide (NO2) is among the gases known as oxides of nitrogen (NOx), produced by fuel combustion. Sources of NO2 include gasoline and diesel engines in on- and off-road vehicles, boilers and furnaces in buildings, and electric power generation. NO2 levels tend to be highest on and near busy roadways. NO2 causes irritation of the lungs and has been linked to emergency department visits and hospital admissions for asthma and other respiratory conditions. NOx also contributes to the formation of ozone and PM2.5. NYCCAS is collecting NO2 samples using specially treated samplers which absorb NO2 from the air and are then analyzed in a laboratory. Sulfur dioxide (SO2) is one of a group of gasses known as sulfur oxides (SOx). Sources of SO2 include burning of sulfur-containing fuels like oil and coal, including fuel oil used for home heating. SO2 reacts with water vapor and other substances in the air to form acid, sulfates, PM2.5, and other harmful pollutants. SO2 can exacerbate asthma and, along with PM2.5, can contribute to other respiratory illnesses and exacerbation of heart disease. NYCCAS is collecting SO2 samples using specially-treated samplers which absorb SO2 from the air and are then analyzed in a laboratory. SO2 is being measured in the winter only, when more oil is burned to heat NYC buildings. Under current law, heating oil in New York City can contain 2,000-3,000 parts per million (ppm) sulfur, compared with only 15 ppm sulfur in on-road diesel fuel. Ozone (O3) is not emitted directly into the air, but is formed when nitrogen oxides (NOx) and other gasses, most often certain volatile organic compounds, react in the presence of sunlight. Volatile organic compounds are gaseous pollutants formed from evaporation or combustion of some liquids and solids such as fuels, paints and solvents. Emissions from fuel combustion are major contributors to ozone formation, and the highest ozone levels in the NYC metropolitan area generally occur in more suburban areas, as the concentrated NOx emissions from the city center drift downwind. Ozone causes irritation and inflammation of the lungs, leading to coughing, wheezing, worsening of asthma, and contributing to the development of pneumonia and bronchitis. Long-term exposure to ozone can impair growth of lung capacity in children.
Page 16 - New York City Community Air Survey: Results Winter 2008-2009
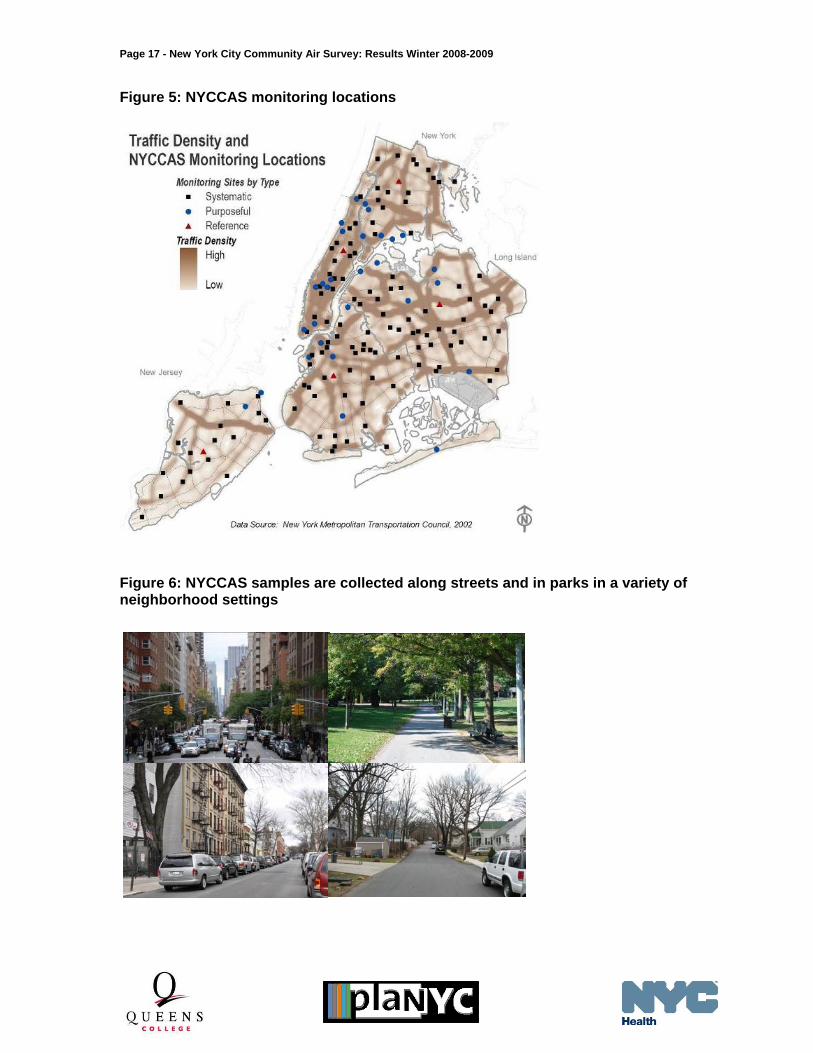
NYCCAS is collecting O3 samples using specially-treated samplers that absorb O3 from the air and are analyzed in a laboratory. Ozone is being measured only in the summertime, when levels are highest, and is not included in this report of winter data. NYCCAS data quality procedures NYCCAS applies monitoring methods that have been extensively used by the scientific community to assess air quality variation within urban areas. NYCCAS quality-control steps include checks on air sampling equipment, collecting some duplicate samples to see how closely the results agree, analyzing filters and passive samplers not exposed to the air to check for contamination, and co-locating two NYCCAS monitors with rooftop regulatory monitors to compare results. These checks showed that duplicate measurements were consistent and that NYCCAS measurements tracked with regulatory monitoring measurements. In addition, each group of measurements is analyzed to look for unusual results that might indicate a faulty instrument or other problem. A small number of winter-season measurements (3% of PM2.5 and EC measures) were excluded from analysis after these checks. The goal of these quality control measures is to reduce the influence of measurement errors on the results. More detailed information on NYCCAS air sampling and quality control procedures and charts is available in a technical appendix found at: www.nyc.gov/health/nyccas. NYCCAS air samples are collected at 150 locations representing a range of traffic, building density and other neighborhood features To study how air pollution varies across the five boroughs, NYCCAS collects air samples at many more locations than are routinely monitored for regulatory purposes. NYCCAS measures at 150 sites, compared with between three and 25 routine monitoring sites, depending on the pollutant (figure 5). To meet the goals of NYCCAS, these 150 locations had to be assigned to allow comparisons across the city. If, for example, only locations with very high traffic were selected in each neighborhood, the data would not be useful for estimating pollution in other locations or for comparing neighborhoods. In addition, to use the monitors most efficiently, it was important to make sure that the density of traffic and buildings — two key sources of local emissions — near the monitoring locations spanned the wide range of conditions found in New York City. This was accomplished in three steps: 1) The map of New York City was divided into more than 7,500 squares or ‘cells’, each
300 by 300 meters. Using computerized geographic databases and software, the cells were classified according to the density of traffic and of buildings. More information on the source of traffic, buildings and other data used in this study is shown in table 1 and in the technical appendix found at www.nyc.gov/health/nyccas. In New York City, locations with a high density of traffic and buildings are concentrated in a relatively small proportion of locations.
Page 17 - New York City Community Air Survey: Results Winter 2008-2009
Figure 5: NYCCAS monitoring locations
Figure 6: NYCCAS samples are collected along streets and in parks in a variety of neighborhood settings
Page 18 - New York City Community Air Survey: Results Winter 2008-2009
2) A random sample of locations was drawn with high traffic and high building areas having an increased chance of selection. This ensured that sampled sites represented neighborhoods with a wide range of traffic and building densities. These sampling sites are referred to as “systematic” sites, and most NYCCAS sites (80%) were chosen in this way.
3) After mapping the random sample, community districts without a monitor assigned,
other large gaps, and selected locations of particular interest were identified. These locations included places near especially high traffic, transportation facilities or major ongoing construction. This process was used to identify the remaining 20% of locations, referred to as “purposeful” sites.
The resulting sample includes mostly street-side locations (138 sites) but also some sites in parks (12 sites). In addition, the sites vary on the type of predominant land use, the amount of street trees and other features (figures 5 and 6). Each of the 150 NYCCAS sites is monitored for a two-week period in each season. The schedule of monitoring is assigned randomly so that 25 sites across the city are monitored in each two-week period. In addition, five “reference” sites — one centrally located in each borough, away from nearby traffic and commercial or industrial activities — are monitored every two weeks year round. Data from these five ‘reference sites’ are used to adjust the measurements made at other sites for variation that occurs across the city over time, mainly due to weather conditions. NYCCAS data are analyzed to see which neighborhood factors predict higher pollutant levels After NYCCAS data pass quality-control procedures, they are summarized to examine overall patterns, to estimate the average levels during each two-week period, and to map the concentrations adjusted for time period. The main NYCCAS analysis uses an approach developed to study air pollution exposure and health effects in urban areas. The approach, which is known as “land-use regression” (LUR), examines how measured pollution levels vary in relation to traffic, buildings, ground cover and other neighborhood factors near the NYCCAS monitor locations. For example, the concentration PM2.5 at NYCCAS monitors was greater at locations with heavier truck traffic, compared to lighter nearby truck traffic. That association is used to help predict pollutant concentrations in locations with similar amounts of truck traffic. The actual LUR models developed for NYCCAS simultaneously consider multiple sources that contribute to pollutant concentrations measured at the NYCCAS sites. Using this statistical model developed at monitored sites, air pollution levels throughout NYC neighborhoods are estimated, including locations where no air pollution measurements were taken. More detail on the LUR analysis is provided in a technical appendix (www.nyc.gov/health/nyccas). To identify factors contributing to air pollution patterns, the NYCCAS investigators used many computerized databases that map features associated with combustion emissions or with land cover (like trees) that might be associated with air pollution levels. Examples are shown in Table 1 and more details are available in a technical appendix (www.nyc.gov/health/nyccas). NYCCAS analyses used many different data sources and several dozen variables to identify a small subset for each pollutant that best explained
Page 19 - New York City Community Air Survey: Results Winter 2008-2009
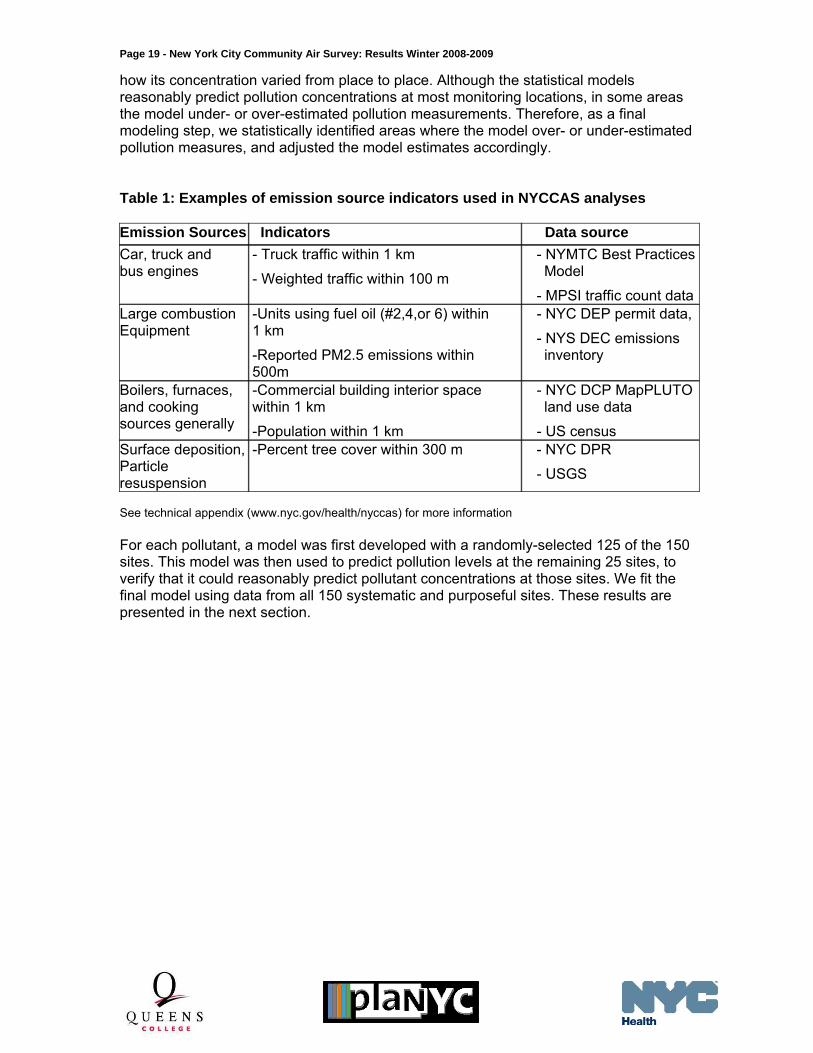
how its concentration varied from place to place. Although the statistical models reasonably predict pollution concentrations at most monitoring locations, in some areas the model under- or over-estimated pollution measurements. Therefore, as a final modeling step, we statistically identified areas where the model over- or under-estimated pollution measures, and adjusted the model estimates accordingly. Table 1: Examples of emission source indicators used in NYCCAS analyses Emission Sources Indicators Data source
Car, truck and bus engines
- Truck traffic within 1 km
- Weighted traffic within 100 m
- NYMTC Best Practices Model
- MPSI traffic count dataLarge combustion Equipment
-Units using fuel oil (#2,4,or 6) within 1 km
-Reported PM2.5 emissions within 500m
- NYC DEP permit data,
- NYS DEC emissions inventory
Boilers, furnaces, and cooking sources generally
-Commercial building interior space within 1 km
-Population within 1 km
- NYC DCP MapPLUTO land use data
- US census Surface deposition,Particle resuspension
-Percent tree cover within 300 m - NYC DPR
- USGS
See technical appendix (www.nyc.gov/health/nyccas) for more information For each pollutant, a model was first developed with a randomly-selected 125 of the 150 sites. This model was then used to predict pollution levels at the remaining 25 sites, to verify that it could reasonably predict pollutant concentrations at those sites. We fit the final model using data from all 150 systematic and purposeful sites. These results are presented in the next section.

Page 20 - New York City Community Air Survey: Results Winter 2008-2009
Results In interpreting these results, it is important to note that they are based on wintertime pollution data, and reflect wintertime sources of air pollution, such as fuel burning for indoor heating. Summertime air pollution patterns may show different patterns, due to seasonal differences in emission sources, weather and sunlight effects on chemical reactions in the atmosphere. These data were collected during one winter season, from December 2008 through March 2009. The pollution concentrations observed during this winter may differ from winter concentrations in other years, due to weather variation and other factors. Geographic patterns of air pollution within the city, however, should be relatively consistent from year to year, as the location of major pollution sources, such as highways, are relatively fixed. The maps display estimated pollution concentrations from a statistical method, known as a ‘land-use regression’ (LUR), described in the previous section. The statistical model is based on actual measurements at a large number of locations across the city — more than in any prior New York City study — and is useful for identifying areas of the city with generally higher or lower pollution levels. The model cannot, however, accurately predict concentrations at specific locations, such as individual street corners or addresses. In addition, while the study helps to identify important pollution sources, such as traffic or buildings, that are widely but unevenly distributed across the city, it is not designed to evaluate the impact of any individual facility on a particular neighborhood. These factors should be considered in interpreting the study’s findings. Overall, the NYCCAS wintertime air pollution measurements vary widely in concentration for each of the four pollutants presented here — fine particles (PM2.5), elemental carbon (EC), nitrogen dioxide (NO2), and sulfur dioxide (SO2). As expected, there were significant differences over time across the six two-week sessions during the winter season. These time trends in average pollution levels tracked well with levels at NYS DEC regulatory monitors. However, the NYCCAS measurements also quantify, for the first time, the strong place-to-place differences in wintertime air pollution levels across the city. NYCCAS data show that this geographic variation in pollution levels is strongly associated with geographic patterns of emission sources, such as traffic and buildings. In this data summary, for each pollutant, we provide: The range of average concentrations at NYCCAS sites compared to city-wide
average levels from DEC regulatory monitoring sites Selected emission source indicators associated with pollutant levels and trends
across locations with the lower, moderate, and higher values of the indicators. Maps of estimated pollutant concentrations predicted by the statistical model. The
maps show Community District boundaries; a reference map labeled with Community District numbers is provided as an annex at the end of this report. An online annex (www.nyc.gov/health/nyccas) provides a chart for each pollutant that summarizes the average and range of estimated concentrations by Community District.

Page 21 - New York City Community Air Survey: Results Winter 2008-2009
Fine particles (PM2.5): Across all NYCCAS sampling sites, after adjusting for temporal differences, wintertime PM2.5 averaged 14.1 μg/m3, compared with 12.4 μg/m3 at DEC regulatory monitoring sites. NYCCAS PM2.5 concentration measures showed considerable spatial variation, ranging from less than 10 μg/m3 to greater than 20 μg/m3 at sites distributed across the city (Figure PM-1).
These spatial differences in PM2.5 concentrations across NYCCAS sites were associated with indicators of nearby fuel combustion -- especially measures of oil burning space and hot water heaters in large buildings. A greater number of permitted oil-burning units within 1 km of the monitor was associated with higher concentrations of PM2.5 (see Figure PM-2). Sites with the highest densities of oil-burning units had PM2.5
concentrations that were 30% higher, on average, than did sites with the lowest number of nearby oil burning units (fewer than 40). Traffic emissions were also an important contributor to PM2.5 concentrations. Sites in the highest third of overall traffic density close to the monitor (within 100 m) had PM2.5 levels that were 27% higher, on average, relative to sites in the lowest third of traffic-weighted road density (Figure PM-3). Additional variability in PM2.5 was explained by truck traffic within 1 km of the monitoring site.

Page 22 - New York City Community Air Survey: Results Winter 2008-2009
Page 23 - New York City Community Air Survey: Results Winter 2008-2009
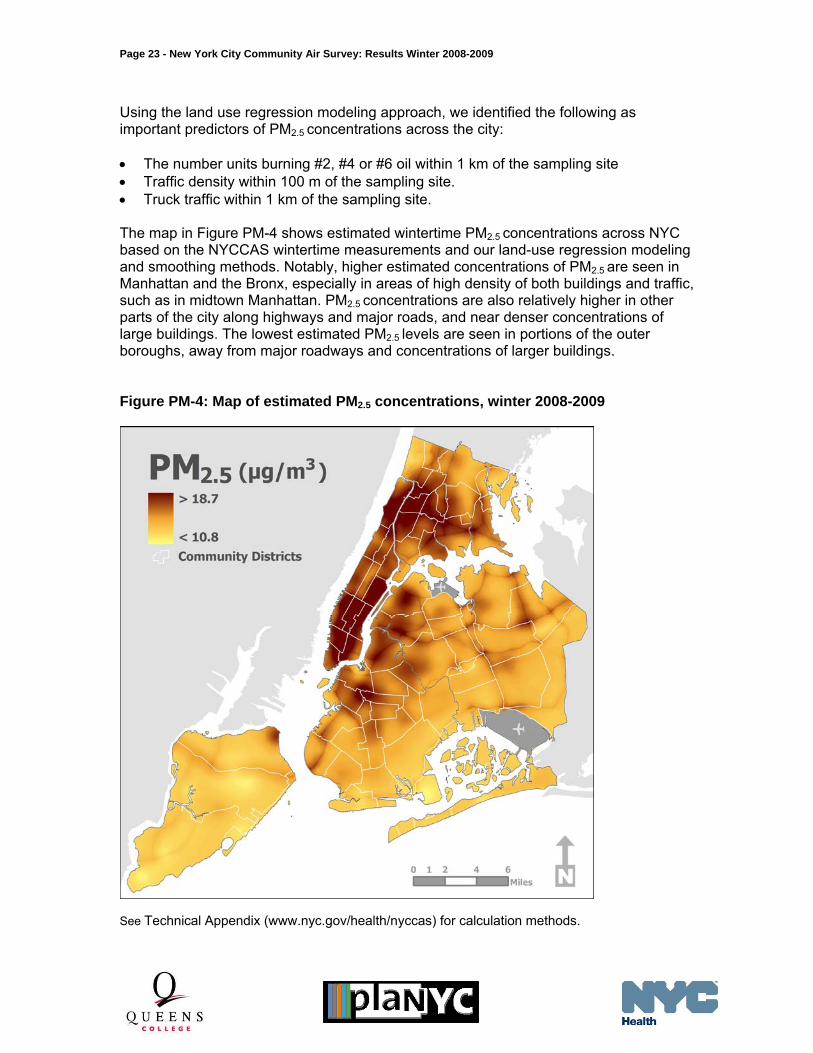
Using the land use regression modeling approach, we identified the following as important predictors of PM2.5 concentrations across the city: The number units burning #2, #4 or #6 oil within 1 km of the sampling site Traffic density within 100 m of the sampling site. Truck traffic within 1 km of the sampling site. The map in Figure PM-4 shows estimated wintertime PM2.5 concentrations across NYC based on the NYCCAS wintertime measurements and our land-use regression modeling and smoothing methods. Notably, higher estimated concentrations of PM2.5 are seen in Manhattan and the Bronx, especially in areas of high density of both buildings and traffic, such as in midtown Manhattan. PM2.5 concentrations are also relatively higher in other parts of the city along highways and major roads, and near denser concentrations of large buildings. The lowest estimated PM2.5 levels are seen in portions of the outer boroughs, away from major roadways and concentrations of larger buildings. Figure PM-4: Map of estimated PM2.5 concentrations, winter 2008-2009
See Technical Appendix (www.nyc.gov/health/nyccas) for calculation methods.

Page 24 - New York City Community Air Survey: Results Winter 2008-2009
Elemental carbon (EC): EC concentrations are estimated by measuring how much light is absorbed by the PM2.5 deposited on a filter. Higher ‘absorbance’ indicates greater EC concentrations. EC showed significant variability across sampling sites during the winter season. Across all NYCCAS sites, and across the entire season, EC averaged 1.3 absorbance units (abs) (Figure EC-1).
Spatial variability in EC was strongly associated with truck traffic. As shown in Figure EC-2, NYCCAS sampling sites with a greater density of truck traffic within 1 km averaged 1.6 abs EC. Sites with low densities of truck traffic averaged only 1.1 abs EC. This finding is consistent with other studies, where EC has been linked to truck and bus diesel emissions. Oil burning also contributed significantly to EC concentrations. NYCCAS sampling sites near a large number of units burning #2, #4 or #6 fuel oil had higher EC concentrations, averaging approximately 1.6 abs. Sampling sites near few oil-burning units (zero or one unit within 200 meters) had EC concentrations averaging only 1.1 abs (Figure EC-3).

Page 25 - New York City Community Air Survey: Results Winter 2008-2009
Page 26 - New York City Community Air Survey: Results Winter 2008-2009
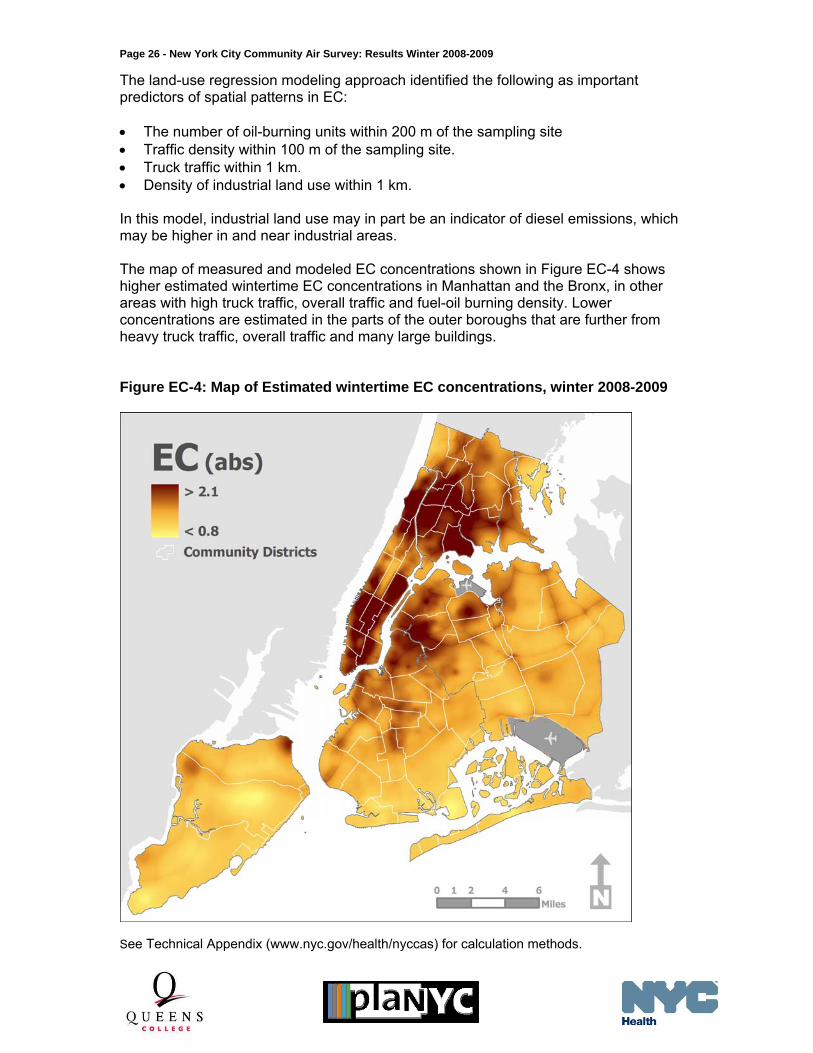
The land-use regression modeling approach identified the following as important predictors of spatial patterns in EC: The number of oil-burning units within 200 m of the sampling site Traffic density within 100 m of the sampling site. Truck traffic within 1 km. Density of industrial land use within 1 km.
In this model, industrial land use may in part be an indicator of diesel emissions, which may be higher in and near industrial areas. The map of measured and modeled EC concentrations shown in Figure EC-4 shows higher estimated wintertime EC concentrations in Manhattan and the Bronx, in other areas with high truck traffic, overall traffic and fuel-oil burning density. Lower concentrations are estimated in the parts of the outer boroughs that are further from heavy truck traffic, overall traffic and many large buildings. Figure EC-4: Map of Estimated wintertime EC concentrations, winter 2008-2009
See Technical Appendix (www.nyc.gov/health/nyccas) for calculation methods.

Page 27 - New York City Community Air Survey: Results Winter 2008-2009
Nitrogen dioxide (NO2): Across all wintertime sampling sessions and sites, NO2 averaged about 32 ppb, but varied greatly across NYCCAS sites throughout the city (from less than 10 to almost 80 ppb.
Figure NO2-1 Spatial differences in NO2 were most closely associated with buildings density. Buildings density is defined as the total interior built space within 1 km of the sampling site. This indicator may reflect emissions from space heating and other sources from and near large buildings. NO2 measures in areas of high buildings density averaged 38.4 ppb, which was 45% higher, on average, than in areas of low buildings density (Figure NO2-2). Local traffic density also contributed to important differences in NO2 concentrations across the city. NYCCAS sampling sites near heavy traffic (within 100 meters) had NO2 levels which averaged about 37 ppb, while low traffic-density sites had NO2 levels of about 27 ppb, on average (Figure NO2-3). NO2 has been consistently associated with nearby traffic emissions in other cities as well.

Page 28 - New York City Community Air Survey: Results Winter 2008-2009
Figure NO2-2
Figure NO2-3

Page 29 - New York City Community Air Survey: Results Winter 2008-2009
NO2 concentrations were higher for monitoring sites located along bus routes. Monitors on bus routes had NO2 concentrations that were 4.8 ppb higher, on average, relative to non-bus route sites, after adjusting for effects of time, buildings, and general traffic. Notably, however, most bus routes are also heavily-trafficked roads, so part of this effect is likely due in part to heavy overall traffic on these roads. In the land-use regression modeling, the following were important predictors of NO2 distributions:
Built space (interior square footage) of buildings within 1 km of the sampling site The sampling site being located along a bus route Traffic density within 100 m of the sampling site. The map in Figure NO2-4 shows estimated average wintertime NO2 concentrations across the city. Predicted NO2 concentrations are generally higher in Manhattan, other areas with a high density of buildings, and along major roadways in the outer boroughs. Figure NO2-4: Map of estimated NO2 concentrations, winter 2008-9
See Technical Appendix (www.nyc.gov/health/nyccas) for calculation methods.

Page 30 - New York City Community Air Survey: Results Winter 2008-2009
Sulfur dioxide (SO2): Across all NYCCAS sampling sites SO2 concentrations averaged 5.4 ppb, which was lower, on average, than at the DEC regulatory monitors (Figure SO2-1). This is because the three DEC monitors for SO2 are located in areas of relatively high SO2 concentrations. NYCCAS monitors are located across the city, including places with much higher and much lower concentrations than the DEC or NYCCAS average.
The spatial pattern in SO2 was strongly predicted by the number of residual oil-burning units (#4 or #6 oil) and nighttime residential population within 1 km of the sampling site. Residential population density may also be a marker for oil-burning and related buildings emissions in higher-density neighborhoods that are not fully reflected in permits for large combustion units. In areas with many permitted residual oil-burning units (more than 32 permitted units within 1 km of the sampling site), SO2 averaged 8.3 ppb. This value was 2.5 times greater than average SO2 in areas with few residual oil-burning sources (fewer than four permitted units within 1 km) (Figure SO2-2). Likewise, in areas with high nighttime population (more than 52,000 people living within 1 km of the sampling site), SO2 averaged 7.5 ppb. In contrast, SO2 averaged only 3.1 ppb in areas of low population density (fewer than 24,000 people) (Figure SO2-3).

Page 31 - New York City Community Air Survey: Results Winter 2008-2009

Page 32 - New York City Community Air Survey: Results Winter 2008-2009
The land use regression model predictors that were most important in describing spatial patterns in SO2, were:
Built space (interior square footage) of buildings within 1 km of the sampling site Nighttime population density within 1 km. The map in Figure SO2-4 depicts model-predicted wintertime average SO2
concentrations across New York City. Concentrations are estimated to be higher in more built up parts of the city where there are more residual oil-burning units, including much of Manhattan and parts of the Bronx, Queens and Brooklyn, compared to less-densely built up areas. Unlike the other pollutants, SO2 is not strongly associated with roadway traffic patterns. Figure SO2-4: Map of estimated SO2 concentrations, winter 2008-9
See Technical Appendix (www.nyc.gov/health/nyccas) for calculation methods.
Page 33 - New York City Community Air Survey: Results Winter 2008-2009
Study Limitations The analyses used geographic data that describe patterns of traffic, buildings and other local sources across the city. These geographic data are not always accurately measured in all locations throughout the city. In addition, these data do not reflect seasonal patterns, such as seasonal trends in traffic, or temporary sources (such as paving or short-term construction). Our models do not account for the spatial variation in emissions that occur outside the city, which contribute importantly to overall air pollution concentrations but contribute less than local sources to place-to-place variation within the city. NYCCAS was not designed to capture short-term (daily or hourly) changes in air pollution levels from changing emissions and weather. Instruments needed to continually measure short-term variation would be too costly to install at all 150 locations. However, scientific research has demonstrated that higher average pollution exposures are associated with adverse health effects. In addition, while the relationship between average and peak concentrations can vary from place to place, locations with higher average concentrations tend to also have higher peak concentrations. Finally, we could not account for localized variations in weather or meteorology (for example, wind patterns at ground levels can be different around large buildings). Our models of how air pollution varies do not account for the effect of sources within the city that mainly affect pollution levels well downwind, such as local electric power stations. Future analyses will address some of these limitations and explore other types of air pollution models to better address these sources.
Discussion Air quality management is evolving along with the underlying science. Prior studies in selected New York City neighborhoods have documented that higher concentrations of specific pollutants are associated with nearby traffic (Kinney et al., 2000; Lena et al., 2002; Maciejczyk et al, 2004). These studies helped raise awareness about exposure to emissions from neighborhood traffic, especially from trucks and busses, as a public health concern and to spur tighter regulations and emission reductions from city buses and other city vehicle fleets. Other ongoing research continues to refine our understanding of air pollution as a public health problem and inform air quality management efforts and regulations. With the launch of PlaNYC in 2007, the city embarked on efforts to improve air quality beyond the steps required by federal regulation. At the same time, the plan acknowledged the need for systematic data on air pollution variation within the city, across its diverse neighborhoods, as one important consideration in guiding and informing its efforts. To fill that need, NYCCAS was developed. This initial NYCCAS report provides a first assessment of how wintertime air quality varies from place to place across the five boroughs and what sources are contributing to higher concentrations in some parts of the city. The results support ongoing emissions-reduction efforts related to important winter-season sources, and provide a framework for future efforts.

Page 34 - New York City Community Air Survey: Results Winter 2008-2009
All four pollutants included in this report — PM2.5, NO2, EC and SO2 — varied two-fold or more across the NYCCAS monitoring sites within the city. Regulatory monitors show that city-wide air quality varies considerably from hour to hour and day to day mainly due to weather and pollution coming from outside the city. NYCCAS data quantify, for the first time, the extent to which some areas of the city tend to have higher average pollution levels than do other areas. Our analysis showed that this strong spatial variability is not random. Higher levels generally occur in locations where sources of fuel combustion are more densely concentrated. This allowed us to develop a statistical model that relates the spatial patterns of air pollutants to different combustion emission source indicators, such as traffic and large combustion boilers density. The statistical model was used to make estimates at unmonitored locations, using GIS-based source indicators that are available across the city. Geographic variation in wintertime air pollution levels For three of the pollutants, PM 2.5, NO2 and elemental carbon, geographic patterns were explained by a combination of building and traffic-related combustion indicators. Although there were some differences among these pollutants in the geographic pattern, levels generally tended to be highest in areas where both traffic and large buildings are concentrated — including parts of Manhattan, such as midtown and downtown, and sections of the Bronx, Brooklyn, and Queens, along busy freeways. While concentrations of all pollutants were lowest on average in Staten Island, there were also some high levels there, along highways and in areas with relatively higher buildings density. The geographic patterns of these air pollutants across New York City are similar to those observed in other urban areas. For example, in one of the first land-use regression–based urban air pollution studies, NO2 concentrations in Amsterdam, Prague and Huddersfield, England, were associated with indicators of nearby traffic and land use, including the density of buildings (Briggs et al., 1997). In Munich, both estimated annual average PM2.5 and a measure of elemental carbon varied more than two-fold across 40 monitoring sites; higher levels were associated with traffic density and population density (indicators of emissions associated with buildings) (Brauer et al., 2003). NO2 levels in Toronto were found to be associated with the density of nearby traffic, dwellings and industrial land use (Jerrett et al., 2007). Other studies, however, have not examined geographic patterns separately for each season, as is being studied in NYCCAS. The geographic pattern of SO2 levels differed from those of PM2.5, NO2, and EC because SO2 was associated with indicators of residual oil (#6 or #4) burning in buildings and with nighttime population, but not with traffic. The association with population may also reflect use of fuel oil to heat large buildings, as oil burning is imperfectly estimated by the number of permitted units. Large combustion boilers that burn residual fuel oil are most heavily concentrated in much of Manhattan and parts of western Bronx, as well as in some Brooklyn and Queens neighborhoods. Few prior studies have examined variation in SO2 levels within a city. One study, in Windsor, Ontario, found that SO2 concentrations were associated with dwelling density and facilities emitting large amounts of SO2, which is similar to our findings. In that city, however, SO2 was also higher nearer to a heavily traveled bridge, while we did not find an association of SO2 with any traffic indicators. Future NYCCAS reports will examine geographic variation in pollutant concentrations throughout the year. This, will identify seasonal differences in pollution sources (e.g.,

Page 35 - New York City Community Air Survey: Results Winter 2008-2009
heating emissions are likely more important in winter than in other seasons) and how seasonal differences in weather and emissions impact different parts of the city. Implications for public health Exposure to PM2.5 has been linked to exacerbation of heart and lung diseases, including asthma, and contributes to hospitalizations, emergency room visits, and work and school absences. NO2 and SO2 are respiratory irritants that can worsen respiratory illnesses like asthma, resulting in emergency department visits and hospitalizations. Elemental carbon is also a respiratory irritant and is often used as a marker of exposure to diesel exhaust. Diesel exhaust is linked to chronic lung inflammation, may cause or exacerbate allergic illnesses, and is a probable human carcinogen. In addition to the health effects of individual pollutants measured by NYCCAS, some research suggests that combined exposures to multiple air pollutants may be especially harmful. Because wintertime combustion pollutants have some common sources, some areas of the city have higher average levels of multiple air pollutants. As noted previously, NYCCAS air pollution measures and concentration estimates are not directly comparable to EPA clean air standards. EPA standards have been developed based on the relationship between concentrations at rooftop routine monitoring sites and average population exposures and health effects. It would not be correct to assume that because the average ambient concentrations found at street level in some locations are be higher than those found at regulatory roof-top monitors, that the overall health impacts of air pollution are greater than assumed in setting regulatory standards. NYCCAS data indicate that concentrations within the city vary substantially from place to place. This geographic variation in exposure, as well as geographic variation in population susceptibility to air pollution — which varies with age, health conditions, health care access, and other factors — likely contributes to population differences in the prevalence and severity of air pollution–related illness. Further analyses of year-round NYCCAS data are needed to more systematically assess and quantify the public health implications of air pollution exposure disparities. Implications for reducing emissions The results of the NYCCAS study supports PlaNYC’s initiatives to reduce emissions from buildings and vehicles, since concentrations of these sources are associated with the highest levels of pollution across many neighborhoods. One set of PlaNYC initiatives is focused on the combustion of fuel oil in large combustion units for space heating and hot water in large buildings. NYCCAS confirms that these sources contribute to higher levels of PM2.5, SO2 and EC in some areas of the city during the winter. New York City is unique in the large amount of #4 and #6 heavy or ‘residual’ oil used for heating. Burning residual oil for heating generates more PM2.5 and SO2 per unit of heat than burning regular #2 home heating oil. Natural gas emits even less PM2.5 per unit of heat produced. Shifting use away from more polluting fuels, especially #6 and #4 oil, toward cleaner burning fuels, may help to reduce air pollution in neighborhoods with many large buildings and combustion boilers.

Page 36 - New York City Community Air Survey: Results Winter 2008-2009
Using fuel more efficiently can also reduce emissions, regardless of fuel type. For example, new boilers are more efficient than older boilers, and well-tuned boilers are more efficient than poorly maintained ones. Some PlaNYC initiatives are already addressing both of these strategies: investing in the shift to cleaner fuels and greater energy efficiency in city buildings while promoting these same measures in large buildings throughout the city. Emissions from on-road vehicles also cause some areas to have higher concentrations of PM2.5, EC and NO2. Diesel engines in trucks, busses and other vehicles are a source of diesel exhaust particles that contribute to EC and total PM2.5 levels. While cars and other vehicles with gasoline engines emit less PM2.5 per mile compared to diesel vehicles, because they are so numerous, they account for a substantial proportion of total New York City’s total PM2.5 emissions from road vehicles. Over time, as newer vehicles replace older more polluting ones, emissions may be reduced, but these improvements may take several years, and may be offset by growing traffic volumes and congestion as our population grows. To accelerate toward the city’s clean air goals and reduce air pollution exposures for people living near busy roadways, efforts must continue to provide expanded mass transit options and speed the shift towards cleaner vehicles.
References Brauer M, Hoek G, van VP, Meliefste K, Fischer P, Gehring U, Heinrich J, Cyrys J, Bellander T, Lewne M, Brunekreef B (2003) Estimating long-term average particulate air pollution concentrations: application of traffic indicators and geographic information systems. Epidemiology 14: 228-239. Briggs DJ, Collins S, Elliott P, Fischer P, Kingham S, Lebret E, Pryl K, van Reeuwijk H, Smallbone K, van der Veen A, (1997) Mapping urban air pollution using GIS: a regression-based approach. Int J GIS 11: 699-718. Jerrett M, Arain MA, Kanaroglou P, Beckerman B, Crouse D, Gilbert NL, Brook JR, Finkelstein N, Finkelstein MM. Modeling the intraurban variability of ambient traffic pollution in Toronto, Canada. J Toxicol Environ Health A. 2007 Feb 1;70(3-4):200-12. Kinney PL, Aggarwal M, Northridge ME, Janssen NAH, Shepard P (2000). Airborne concentrations of PM2.5 and Diesel Exhaust Particles on Harlem Sidewalks: A Community-Based Pilot Study. Environ Health Perspect 108(3): 213-218. Lena TS, Ochieng V, Carter M, Holguin-Veras J, Kinney PL (2002) Elemental carbon and PM2.5 levels in an urban community heavily impacted by truck traffic. Environ Health Perspect 110: 1009-1015 Maciejczyk PB, Offenberg JH, Clemente J, Blaustein M, Thurston GD, Chen LC. Ambient pollutant concentrations measured by a mobile laboratory in South Bronx, NY. Atmospheric Environment 2004; 38(31):5283-5294. Pope CA, Ezzati M, Dockery D. Fine-Particulate Air Pollution and Life Expectancy in the United States 2009; N Engl J Med 2009;360:376-86. U.S. EPA. Air Quality Criteria for Particulate Matter (Final Report, Oct 2004). U.S. Environmental Protection Agency, Washington, DC, EPA 600/P-99/002aF-bF, 2004

Page 37 - New York City Community Air Survey: Results Winter 2008-2009
Annex: Reference Map of Community Districts
Battery Park City, Tribeca (1) Greenwich Village, SOHO (2) Lower East Side, Chinatown (3) Chelsea, Clinton (4) Midtown Business District (5) Stuyvesant Town, Turtle Bay (6) West Side, Upper West Side (7) Upper East Side (8) Manhattanville, Hamilton Heights (9) Central Harlem (10) East Harlem (11)
Man
hat
tan
Washington Heights, Inwood (12)
Melrose, Mott Haven, Port Morris (1) Hunts Point, Longwood (2) Morrisania, Crotona Park East (3) Highbridge, Concourse Village (4) University Hts., Fordham, Mt. Hope (5) East Tremont, Belmont (6) Bedford Park, Norwood, Fordham (7) Riverdale, Kingsbridge, Marble Hill (8)
Bro
nx
Soundview, Parkchester (9)

Page 38 - New York City Community Air Survey: Results Winter 2008-2009
Throgs Nk.,Co-op City, Pelham Bay (10) Pelham Parkway, Morris Park, Laconia (11) Wakefield, Williamsbridge (12)
Williamsburg, Greenpoint (1) Brooklyn Heights, Fort Greene (2) Bedford Stuyvesant (3) Bushwick (4) East New York, Starrett City (5) Park Slope, Carroll Gardens (6) Sunset Park, Windsor Terrace (7) Crown Heights North (8) Crown Heights South, Wingate (9) Bay Ridge, Dyker Heights (10) Bensonhurst, Bath Beach (11) Borough Park, Ocean Parkway (12) Coney Island, Brighton Beach (13) Flatbush, Midwood (14) Sheepshead Bay, Gerritsen Beach (15) Brownsville, Ocean Hill (16) East Flatbush, Rugby, Farragut (17)
Bro
okl
yn
Canarsie, Flatlands (18)
Astoria, Long Island City (1) Sunnyside, Woodside (2) Jackson Heights, North Corona (3) Elmhurst, South Corona (4) Ridgewood, Glendale, Maspeth (5) Forest Hills, Rego Park (6) Flushing Bay Terrace (7) Fresh Meadows, Briarwood (8) Woodhaven, Richmond Hill (9) Ozone Park, Howard Beach (10) Bayside, Douglastown, Little Neck (11) Jamaica, St. Albans, Hollis (12) Queens Village, Rosedale (13)
Qu
een
s
The Rockaways, Broad Channel (14)
Stapleton, Port Richmond (1) New Springville, South Beach (2)
Sta
ten
Is
lan
d
Tottenville, Woodrow, Great Kills (3)