(preprint version of paper to appear in international journal of
TRANSCRIPT

1
(Preprint version of paper to appear in International Journal of Pharmaceutics, 2012)
The impact of training set data distributions for modeling of passive intestinal
absorption
Taravat Ghafouriana*
, Alex A. Freitas
b, Danielle Newby
a
aMedway School of Pharmacy, Universities of Kent and Greenwich, Chatham, Kent, ME4 4TB, UK
b School of Computing, University of Kent, Canterbury, Kent, CT2 7NZ, UK
* Corresponding Author, Email: [email protected] ;Tel +44(0)1634 202952 ; Fax +44 (0)
1634 883927
Abstract
This study presents regression and classification models to predict human intestinal
absorption of 645 drug and drug like compounds using percentage human intestinal values
from the published dataset by Hou et al (2007c). The problem with this dataset and other
datasets in the literature is there are more highly than poorly absorbed compounds. Any
models developed using these datasets will be biased towards highly absorbed compounds
and not applicable for use in industry where now more compounds are likely to be poorly
absorbed. The study compared two training sets, TS1, a balanced (50:50) distribution of
highly and poorly absorbed compounds created by under-sampling the majority high
absorption compounds, with TS2, a randomly selected training set with biased distribution
towards highly absorbed compounds. The regression results indicate that the best models
were those developed using the balanced dataset (TS1). Also for classification, TS1 led to the
most accurate models and the highest specificity value of 0.949. In comparison, TS2 led to
the highest sensitivity with a value of 0.939. Thus, under-sampling the majority class of the
highly absorbed compounds leads to a balanced training set (TS1) that can achieve more
applicable in silico regression and classification models for the use in the industry.
Keywords: Intestinal absorption, QSAR, oral absorption, training set, regression,
classification

2
1. Introduction
Drug discovery has changed from primarily focusing on efficacy and selectivity of new drug
candidates to incorporating the testing of absorption, distribution, metabolism, elimination
and toxicity (ADMET) properties with high throughput (HT) in vitro and in vivo assays
(Davis et al. 2005; Gleeson et al. 2011). With the help of these assays plus the development
of HT automation, drug candidates failing due to undesirable ADMET properties in Phase 1
clinical trials have been reduced from ~40% in 1991 to ~10% in 2000 (Kennedy 1997; Kola
and Landis 2004).
In silico modelling of ADMET properties particularly absorption has become a focus for
pharmaceutical companies due to the need to eliminate unsuitable compounds before too
much resource has been spent (Boobis et al. 2002; Smith 2002; Tsaioun et al. 2009). Reliable
and robust in silico models would mean a cost effective way of predicting
desirable/undesirable properties or act as a tool to help select the appropriate assays to
perform based on chemical structure and physiochemical properties (Geerts and Heyden
2011; van de Waterbeemd and Gifford 2003).
Oral absorption in particular is a primary focus for in silico modelling because it is the easiest
and most convenient route for administration that achieves patient acceptance, rather than
other routes that cause discomfort or inconvenience (Ashford 2007; Hou et al. 2009). In silico
modelling can be used to predict intestinal absorption (percentage human intestinal
absorption - %HIA or fraction absorbed - FA) and/or oral bioavailability (F). Confusion can
sometimes be caused by these terms and acronyms as they are sometimes used
interchangeably and are often coupled together (Burton et al. 2002; Zhao et al. 2001).
Intestinal absorption has been defined as the amount of drug that passes through the intestinal
tissue and enters the portal vein (Hou et al. 2009; Sinko 1999). This contrasts with
bioavailability, which is described as the fraction of drug dose that reaches the systemic
circulation unchanged after first pass metabolism (Kwon 2002; Zhu et al. 2011). Hou et al
(2009) found that the bioavailability of 64% of compounds they analysed were governed by
absorption, therefore accurate predictions of intestinal absorption are required as this is the
prerequisite to predicting oral bioavailability with accuracy and precision. Bioavailability is
complex and dependant on many other variables, therefore making it a challenge to predict
with any model (Zhu et al. 2011).
3
For a drug to be orally absorbed it needs to cross the intestinal membrane. The predominant
route for most drugs is passive diffusion, mainly transcellular. However, some small polar
compounds can exit through the interstitial space between cells; this is known as paracellular
diffusion. Both are driven by concentration gradients (Kay 2011). Recently, the mechanisms
of drug transport through biological membranes have been re-evaluated as a result of
discoveries made in the area of human genome mapping and identification of a vast number
of proteins involved in transporting drugs across membranes (Al-Awqati 1999). These
transporters can either increase the movement of the drug into the cell, known as active
transport, or enhance movement of drugs out of cell, known as efflux. Each will affect
absorption of the drug by increasing or decreasing it respectively (Giacomini et al. 2010;
Kerns and Di 2008).
There are various published papers using simple predictions based on Quantitative Structure-
Activity Relationships/Quantitative Structure-Property Relationships (QSAR/QSPR) for
predicting intestinal absorption. Lipinski‟s „Rule of five‟ is the most commonly known
method used in drug discovery settings (Lipinski et al. 1997). Lipinski states that if two of
the rules are breached then poor absorption is highly likely; these are if molecular weight
>500 Da, sum of OH and NH hydrogen bond donors >5, calculated logP (C LogP) >5 and
sum of N and O atoms as hydrogen bond acceptors >10. Although these rules are for
qualitative purposes and have been criticised, the descriptors can be used to generate
quantitative predictions (Hou et al. 2007b; Lagorce et al. 2011; Macheras and Iliadis 2006).
Zhao et al (2002) and Veber et al (2002) both have used simple predictive models. The basis
of these simple models are physiochemical properties of the compounds that are
physiologically related to intestinal absorption, for example polar surface area (PSA) and
logD have been referenced to be important descriptors (van de Waterbeemd and Gifford
2003). PSA is the area of the Van der Waals surface that arises from oxygen and nitrogen
atoms or hydrogen atoms bound to these atoms, and is also related to size and has a negative
correlation with intestinal absorption. LogD is the logarithm of apparent distribution
coefficient between octanol and water, and a measure of hydrophobicity at a specific pH. In
order to be absorbed the compound must be hydrophobic enough to permeate the cell
membrane. There are also more sophisticated models to improve these predictions. Models
produced by data analysis methods such as Genetic Algorithms (GA), Artificial Neural
Networks (ANN) and Support Vector Machines (SVM) are being developed due to increase
in demand for improved accuracy of predictions (Hou et al. 2007a; Tian et al. 2011). The
4
problem with the currently available models is that they are based on training sets with
unbalanced data distribution due to the greater number of highly absorbed compounds present
in the datasets. This creates biased models which have better ability at predicting highly
absorbed compounds than poorly absorbed compounds (Wessel et al. 1998; Zhao et al. 2002).
In order for a better more applicable well balanced dataset to be achieved, more compounds
in the low/medium absorption range will need to be added (Gleeson et al. 2011; Oprea et al.
2007; Yan et al. 2008).
In this paper, in silico models that focus on predicting passive intestinal absorption using
classification and regression methods for relating the absorption to the physiochemical and
structural properties of drugs are developed and evaluated. The dataset used is taken from
Hou et al (2007c). This paper addresses the problem of unbalanced data distribution by
creating a balanced training set through under-sampling the highly absorbed compounds. In
doing so, this paper seeks to achieve a more applicable model with a better prediction
capacity of poorly absorbed compounds without jeopardizing the prediction accuracy for the
highly absorbed drugs.
2. Methods & Materials
2.1 Datasets of Intestinal Absorption in Humans
The dataset used consisted of Human Intestinal Absorption (%HIA) data for 647 drugs and
drug-like compounds extracted from SDF format from the supporting information of the
paper, which is freely available on the internet (http://cadd.suda.edu.cn/admet/) and is the
largest compilation of data for those drugs to date (Hou et al. 2009). This dataset contains
intestinal absorption (%HIA) of 647 passively absorbed drugs with a wide variety of
pharmacological and chemical classes. It was found that 2 compounds (Sulfamethazine &
Glycine) were duplicated in the initial set so the duplicates were removed, giving a first initial
total of 645 compounds. From the 645 drugs, in the dataset Hou et al (2007c) excluded 95
compounds. 43 were absorbed via carrier mediated transporters, 24 had poor solubility
problems, 26 contained ammonium groups, and for 2, logD could not be calculated. The
significance of the quaternary ammonium group is that complications may arise due to
different levels of ion pairing which may be affected by the formulation and stomach content,
although there has been ambiguity regarding the effectiveness of ion-pair related absorption
levels (Miller et al. 2010). In this study, the 26 compounds containing ammonium groups
were excluded entirely to avoid the added complications. The remaining 619 compounds
5
were used in the analyses. “Upon exclusion of the 95 compounds” means the exclusion of the
remaining 69 compounds, as the 26 compounds containing quaternary compounds have
already been removed.
The dataset was split into two groups, a training set and a validation set. The training set is
used to build the classification and regression models and the validation set is used to
measure the accuracy of the models and then select the best model. From the same original
dataset, different training sets were created that had different numbers of compounds and the
remaining compounds or a selection of the remaining compounds were used as the validation
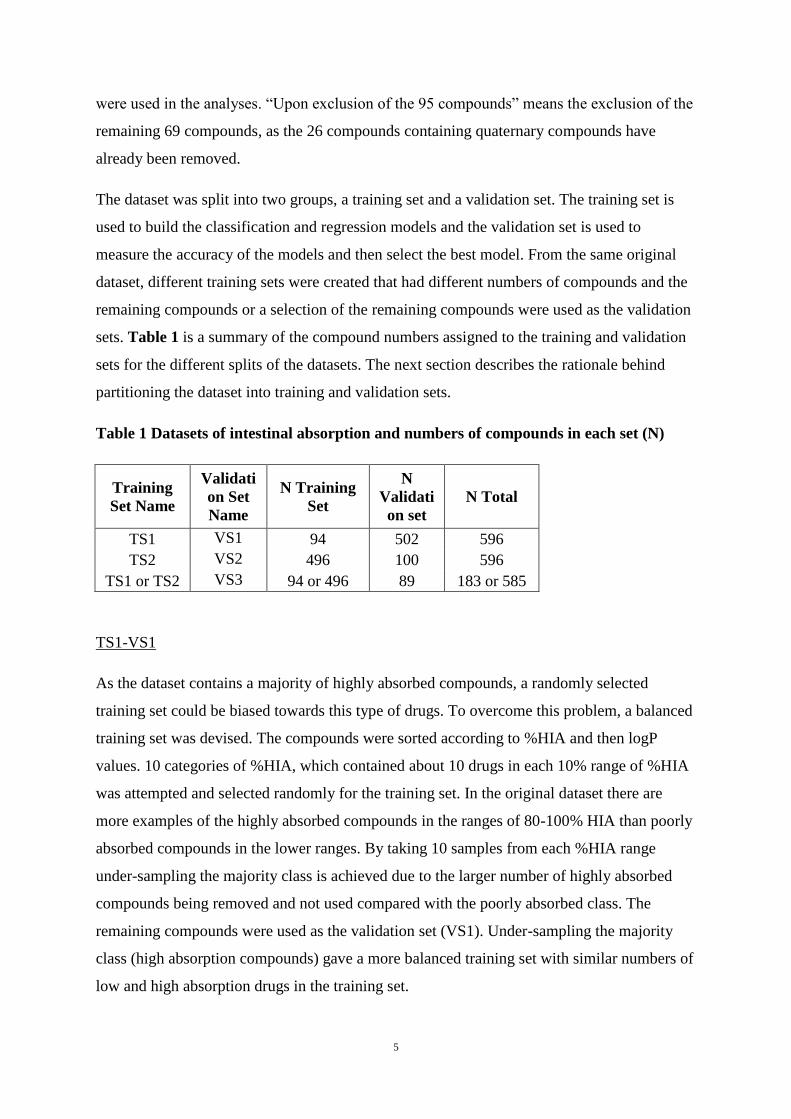
sets. Table 1 is a summary of the compound numbers assigned to the training and validation
sets for the different splits of the datasets. The next section describes the rationale behind
partitioning the dataset into training and validation sets.
Table 1 Datasets of intestinal absorption and numbers of compounds in each set (N)
Training
Set Name
Validati
on Set
Name
N Training
Set
N
Validati
on set
N Total
TS1 VS1 94 502 596
TS2 VS2 496 100 596
TS1 or TS2 VS3 94 or 496 89 183 or 585
TS1-VS1
As the dataset contains a majority of highly absorbed compounds, a randomly selected
training set could be biased towards this type of drugs. To overcome this problem, a balanced
training set was devised. The compounds were sorted according to %HIA and then logP
values. 10 categories of %HIA, which contained about 10 drugs in each 10% range of %HIA
was attempted and selected randomly for the training set. In the original dataset there are
more examples of the highly absorbed compounds in the ranges of 80-100% HIA than poorly
absorbed compounds in the lower ranges. By taking 10 samples from each %HIA range
under-sampling the majority class is achieved due to the larger number of highly absorbed
compounds being removed and not used compared with the poorly absorbed class. The
remaining compounds were used as the validation set (VS1). Under-sampling the majority
class (high absorption compounds) gave a more balanced training set with similar numbers of
low and high absorption drugs in the training set.

6
TS2-VS2
The dataset was initially sorted based on ascending %HIA and then logP values. Then from
each group of six consecutive compounds, five were assigned to the training set, and one
compound was allocated to the validation set randomly. This ensured similar distribution of
%HIA values in the training and validation sets. The training set contained 496 and the
validation set contained 100 compounds. This dataset is unbalanced and not under-sampled
and is more like the %HIA distribution of the original dataset with a higher proportion of
highly absorbed compounds in the training and validation sets.
Exclusion of outliers
The removal of the 95 compounds as highlighted by Hou et al (2007c) from the dataset
reduced the number of compounds in the training and validation sets. The final numbers left
in the training and validation sets after these 95 compounds were removed was for TS1, 73
and 477 and for TS2, 458 and 92 respectively. Removing the outliers did not affect the
balance of high to low absorption compounds significantly for VS1, VS2, VS3 or TS2. For
TS1 the balance changed towards highly absorbed compounds from the initial 50:50 split to
33:67.
VS3 – New balanced validation set with 89 compounds
Comparing the models that are developed using TS1 and TS2 training sets would not be a fair
comparison if validation sets are not similar. In particular for the dataset TS1 the initial
validation set, VS1, (of 502 compounds) consisted of all the remaining compounds not used
in the training set, therefore a drawback is recognised that the training and validation sets
have different %HIA distributions. In other words, not only the validation sets of TS1 and
TS2 are very different in terms of the number of the compounds, for TS1, the validation set is
not a correct representation of the training set as the %HIA distributions are very different.
As such, a new validation set, VS3, containing 89 compounds was selected as follows. After
selection of TS1, from the remaining 502 compounds (VS1), 89 compounds were selected
randomly by under-sampling the highly absorbed compounds (VS3). It was ensured that none
of the TS2 compounds were included in this validation set. This new validation set had a
similar %HIA distribution to the TS1 training set, i.e. roughly similar number of compounds
within each 10% band of %HIA, therefore making direct comparisons between all the models
comprehensible when using the results from the validation set VS3.
7
2.2 Molecular Descriptors
A total of 215 descriptors were used in this study. A variety of different software packages
were used to compute these descriptors, they include TSAR 3D (Accelrys Inc), MDL QSAR
(Symyx Inc.), Kowwin (U.S. EPA) and Advanced Chemistry Development ACD Labs/ LogD
Suit. Due to software restraints some molecular descriptors could not be calculated for some
compounds in the dataset.
2.3 Selection of Molecular Descriptors for Models
Several regression and classification models were developed using molecular descriptors of
the compounds. The descriptors used in these models were:
1. Descriptors selected by stepwise regression analysis.
2. Descriptors selected by stepwise discriminant analysis.
3. Lipinski‟s rule of five descriptors plus the number of rotatable bonds.
Stepwise regression analysis was performed on the training sets using MINITAB Statistical
Software (version 15.1.0.0) to select descriptors which had significant linear relationships
with %HIA. %HIA was set as the dependant variable and the calculated molecular
descriptors of the compounds set as independent variables. In order to minimise the risk of
chance correlations, the maximum number of descriptors allowed in the models was
restricted to eight. The descriptors selected by stepwise regression analysis were used in the
models developed by regression and discriminant analysis. There were a significant number
of compounds that had missing values for descriptors such as ACD_Density, therefore
stepwise regression was carried out again excluding these descriptors and a second model
was developed for the training sets.
Stepwise discriminant analysis was carried out using TSAR 3D. The selected descriptor set
was solely used for the classification of the compounds into highly absorbed (%HIA ≥ 50%)
or poorly absorbed groups (%HIA < 50%) and not for prediction of precise %HIA values
using regression analysis.
Lipinski‟s „rule of five‟ is a popular rapid screen to identify compounds that are poorly
absorbed (Lipinski et al. 1997). The descriptors proposed by Lipinski are: molecular weight,
number of hydrogen bonding donor and acceptor groups and logP. Number of rotatable bonds
was also added, as it has been suggested to help predict oral bioavailability and hence oral

8
absorption (Zakeri-Milani et al. 2006). This set of descriptors was used in regression and
classification analysis.
2.4 Multiple Regression Analysis
Regression analyses on the descriptor sets selected using stepwise regression and the rule of
five descriptors mentioned previously were carried using MINITAB statistical software.
%HIA was set as the dependant variable and the descriptor sets as independent variables.
For each regression analysis the following statistical criteria were obtained: N, the number of
observations, r2, the squared correlation coefficient, S, the standard deviation, F, Fisher's
criterion and p-value, the level of significance of the model. All the descriptors had a p-value
of less than 0.05, indicating that they were all significant for the prediction of %HIA. From
the predicted and observed %HIA data the RMSE (root mean squared error) was calculated
for the training and validation sets separately.
2.5 Discriminant Analysis
Discriminant analysis is a statistical classification technique that examines the set of variables
associated with a given subject and uses similarities and differences to assign the subject to a
group or class. It is a classical statistical approach for classifying samples of unknown classes
(validation set), based on samples from the training set with known classes. Discriminant
analysis was carried out using MINITAB software to categorize drugs into classes of low or
high absorption drugs. This analysis was done for the training set and then utilized to predict
the absorption of drugs in the validation sets. Drugs with %HIA value greater than or equal to
50 were graded 1 (HIA+), while those with %HIA less than 50 were graded as 0 (HIA-). In
this manner, predictive models were developed using the observed %HIA class as the
response, and each set of the descriptors selected by stepwise regression analysis, stepwise
discriminant descriptors and the rule of five descriptors as the predictors. The ability of each
model to predict the %HIA classes of the compounds in the validation set was explored.
To assess and compare the models, the parameters of accuracy, specificity and sensitivity
were calculated. Accuracy determines the overall % of correct classification of compounds
using the model. Specificity highlights the correct classification of HIA- compounds, and
sensitivity is equivalent to the correct classification of HIA+ compounds.
9
4. Results
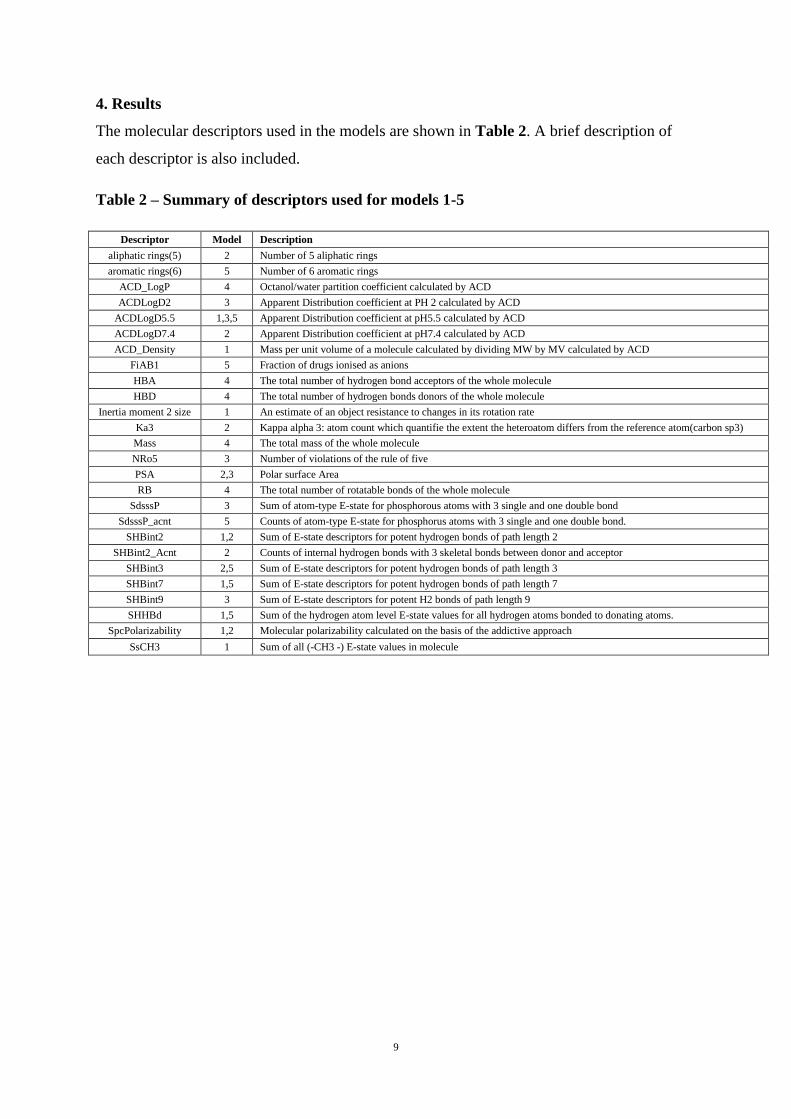
The molecular descriptors used in the models are shown in Table 2. A brief description of
each descriptor is also included.
Table 2 – Summary of descriptors used for models 1-5
Descriptor Model Description
aliphatic rings(5) 2 Number of 5 aliphatic rings
aromatic rings(6) 5 Number of 6 aromatic rings
ACD_LogP 4 Octanol/water partition coefficient calculated by ACD
ACDLogD2 3 Apparent Distribution coefficient at PH 2 calculated by ACD
ACDLogD5.5 1,3,5 Apparent Distribution coefficient at pH5.5 calculated by ACD
ACDLogD7.4 2 Apparent Distribution coefficient at pH7.4 calculated by ACD
ACD_Density 1 Mass per unit volume of a molecule calculated by dividing MW by MV calculated by ACD
FiAB1 5 Fraction of drugs ionised as anions
HBA 4 The total number of hydrogen bond acceptors of the whole molecule
HBD 4 The total number of hydrogen bonds donors of the whole molecule
Inertia moment 2 size 1 An estimate of an object resistance to changes in its rotation rate
Ka3 2 Kappa alpha 3: atom count which quantifie the extent the heteroatom differs from the reference atom(carbon sp3)
Mass 4 The total mass of the whole molecule
NRo5 3 Number of violations of the rule of five
PSA 2,3 Polar surface Area
RB 4 The total number of rotatable bonds of the whole molecule
SdsssP 3 Sum of atom-type E-state for phosphorous atoms with 3 single and one double bond
SdsssP_acnt 5 Counts of atom-type E-state for phosphorus atoms with 3 single and one double bond.
SHBint2 1,2 Sum of E-state descriptors for potent hydrogen bonds of path length 2
SHBint2_Acnt 2 Counts of internal hydrogen bonds with 3 skeletal bonds between donor and acceptor
SHBint3 2,5 Sum of E-state descriptors for potent hydrogen bonds of path length 3
SHBint7 1,5 Sum of E-state descriptors for potent hydrogen bonds of path length 7
SHBint9 3 Sum of E-state descriptors for potent H2 bonds of path length 9
SHHBd 1,5 Sum of the hydrogen atom level E-state values for all hydrogen atoms bonded to donating atoms.
SpcPolarizability 1,2 Molecular polarizability calculated on the basis of the addictive approach
SsCH3 1 Sum of all (-CH3 -) E-state values in molecule

10
4.1 Regression Models
Two regression models were developed for the training set TS1, which contained a similar
number of drugs at each 10% range. These models were obtained using the descriptors
selected by stepwise regression when all the descriptors were used in analysis (model 1) and
when several descriptors with a high number of missing values (ACD density and logP) were
excluded (model 2).
Model 1 Stepwise Regression 1 TS1
%HIA = 125 - 0.357 SHHBd - 0.627 SHBint2 + 4.71 ACDLogD5.5 - 0.00643 Inertia
Moment 2 Size - 0.516 SHBint7 - 297 SpcPolarizability - 22.2 ACD_Density - 1.24 SsCH3
n = 94 S = 15.7 R2 = 0.755 F = 32.7
Model 2 Stepwise Regression 2 TS1
%HIA = 101 - 0.0753 ACD_PSA + 4.02 ACDLogD7.4 - 2.72 ka3 - 0.272 SHBint2 - 6.16
aliphatic rings(5) - 2.98 SHBint2_Acnt - 284 SpcPolarizability - 0.275 SHBint3
n = 94 S = 16.1 R2
= 0.742 F = 30.5
Using TS2, which is a randomly selected training set of 496 compounds, stepwise regression
model 3 was obtained. Model 4 is the regression equation obtained for TS2 using Lipinski‟s
„rule of five‟ parameters.
Model 3 Stepwise Regression 3 TS2
%HIA = 95.4 - 0.138 ACD_PSA - 12.9 ACD_Rule_Of_5 - 3.22 ACDLogD2 - 1.35 SHBint9
+ 6.27 ACDLogD5.5 + 3.48 SdsssP
n = 496 S = 16.1 R2
= 0.686 F = 178.2
Model 4 – Ro5 Descriptors (Ro5) TS2
%HIA = 98.5 + 0.0072 Mass - 1.08 Rotatable Bonds - 5.12 H-bond Donors - 2.40 H-bond
Acceptors + 2.34 ACD_LogP
n = 496 S = 20.2 R2
= 0.533 F = 112.0

11
There are 95 compounds in the dataset that were excluded by Hou et al (2007c) for a variety
of reasons mentioned previously. The remaining outliers were removed from the dataset and
regression analysis was performed again. When these compounds were excluded from the
models above, the statistics were improved for both the training and validation sets. Table 3
shows the statistical parameters of the equations obtained for the training sets before and after
the exclusion of the outliers. It must be noted that only some of the 95 outliers fell within the
training sets and the remaining belonged to the validation set. Table 3 also indicates the
average prediction error (RMSE) for the validation sets.
Table 3 Statistical parameters and prediction accuracies of regression models for
training (t) and validation (v) sets
Model
Training
set
Name
Validation
set
Name
r2 F S
RMSE N
t v t v
1 TS1 VS1 0.755 32.73 15.66 14.90 25.49 94 502
2 TS1 VS1 0.742 30.51 16.08 15.29 26.11 94 502
3 TS2 VS2 0.686 178.2 16.56 17.30 20.37 496 100
4 TS2 VS2 0.533 111.1 20.17 20.37 23.24 496 100
Common Validation set
1 TS1 VS3 0.755 32.73 15.66 14.90 25.05 94 89
2 TS1 VS3 0.742 30.51 16.08 15.29 24.45 94 89
3 TS2 VS3 0.686 178.2 16.56 17.30 30.83 496 89
4 TS2 VS3 0.533 111.1 20.17 20.37 38.64 496 89
After exclusion of 95 compounds (Hou et al. 2007c)
1 TS1 VS1 0.788 29.80 15.41 14.43 24.40 73 477
2 TS1 VS1 0.785 29.25 15.52 14.54 23.84 73 477
3 TS2 VS2 0.697 172.9 15.37 15.24 18.59 458 92
4 TS2 VS2 0.540 106.0 18.91 18.79 22.38 458 92 r2-correlation coefficient; F-Fisher's criterion; S-standard deviation; RMSE-root mean squared error; N-number of compounds, t-training set;
v-validation set
In order for a better comparison of the models, RMSE values were calculated for the new
validation set, VS3, containing 89 compounds for all 4 models. The results in Table 3 show
that models 1 and 2 had the lowest RMSE values for this representative validation set.
4.2 Classification Models
Stepwise discriminant analysis using TSAR 3D selected seven descriptors for the
classification of %HIA class of TS1. The descriptors were number of six-membered aromatic
rings, ACD LogD5.5, Fraction of drugs ionised at pH1, SdsssP_acnt, SHBint3, SHBint7 and

12
SHHBd . Following this, Discriminant analysis was performed using %HIA class as defined
in the Methods section and molecular descriptors selected by the three stepwise regressions
on TS1 or TS2, Lipinski‟s rule of five descriptors plus the number of rotatable bonds, and
descriptors selected by stepwise discriminant analysis. Tables 4 and 5 show the measures of
predictive accuracy (measured on the training and validation sets) of the discriminant models
for TS1 and TS2, respectively.
Table 4 Results of Discriminant Analysis Models using training set TS1 and measured
by validation set VS1
Model Set Accuracy Sensitivity Specificity Descriptor Set
1 t 0.872 0.943 0.780
Stepwise Regression Model 1 v 0.904 0.915 0.786
2 t 0.872 0.887 0.854
Stepwise Regression Model 2 v 0.876 0.878 0.857
3 t 0.798 0.906 0.659
Stepwise Regression Model 3 v 0.958 0.959 0.952
4 t 0.830 0.887 0.756 Lipinski Rule of 5 plus number of
rotatable bonds v 0.898 0.904 0.833
5 t 0.912 0.962 0.846
Stepwise Discriminant analysis v 0.864 0.871 0.786
After exclusion of 95 compounds (Hou et al. 2007c)
1 t 0.877 0.918 0.792
Stepwise Regression Model 1 v 0.956 0.968 0.811
2 t 0.877 0.898 0.833
Stepwise Regression Model 2 v 0.910 0.925 0.730
3 t 0.849 0.939 0.667
Stepwise Regression Model 3 v 0.971 0.973 0.946
4 t 0.863 0.918 0.750 Lipinski Rule of 5 plus number of
rotatable bonds v 0.950 0.959 0.838
5 t 0.863 0.918 0.750
Stepwise Discriminant analysis v 0.923 0.932 0.811
t-training; v-validation; Accuracy shows the correct overall classification and is calculated by number of correct divided by overall number
of compounds; Sensitivity is equivalent to the number of correctly classified HIA+ compounds and is calculated using SE=(TP/(TP+FN));
Specificity is equivalent to the number of correctly classified HIA- compounds and is calculated using SP=(TN/(TN+FP)); TP-true positive;
FN-False negative; TN-true negative; FP-false positive
It must be noted from Table 4 that for some of the models the overall accuracy is higher for
the validation set compared to the training set. This is due to the biased distribution of %HIA
of the compounds and lack of poorly/moderately absorbed compounds represented in dataset.

13
Table 5 Results of Discriminant Analysis Models using training set TS2 and measured
by validation set VS2
Model Set Accuracy Sensitivity Specificity Descriptor Set
1 t 0.928 0.958 0.743
Stepwise Regression Model 1 v 0.890 0.942 0.571
2 t 0.913 0.937 0.771
Stepwise Regression Model 2 v 0.880 0.919 0.643
3 t 0.936 0.967 0.743
Stepwise Regression Model 3 v 0.890 0.930 0.643
4 t 0.932 0.958 0.771 Lipinski Rule of 5 plus number of
rotatable bonds v 0.880 0.942 0.500
5 t 0.930 0.956 0.771
Stepwise Discriminant analysis v 0.890 0.965 0.429
After exclusion of 95 compounds (Hou et al. 2007c)
1 t 0.971 0.985 0.750
Stepwise Regression Model 1 v 0.935 0.988 0.545
2 t 0.971 0.985 0.750
Stepwise Regression Model 2 v 0.935 0.963 0.727
3 t 0.966 0.982 0.708
Stepwise Regression Model 3 v 0.913 0.951 0.636
4 t 0.964 0.982 0.667 Lipinski Rule of 5 plus number of
rotatable bonds v 0.924 0.988 0.455
5 t 0.962 0.977 0.708
Stepwise Discriminant analysis v 0.935 0.988 0.545
t-training; v-validation; Accuracy shows the correct overall classification and is calculated by number of correct divided by overall number
of compounds; Sensitivity is equivalent to the number of correctly classified HIA+ compounds and is calculated using SE=(TP/(TP+FN));
Specificity is equivalent to the number of correctly classified HIA- compounds and is calculated using SP=(TN/(TN+FP)); TP-true positive;
FN-False negative; TN-true negative; FP-false positive
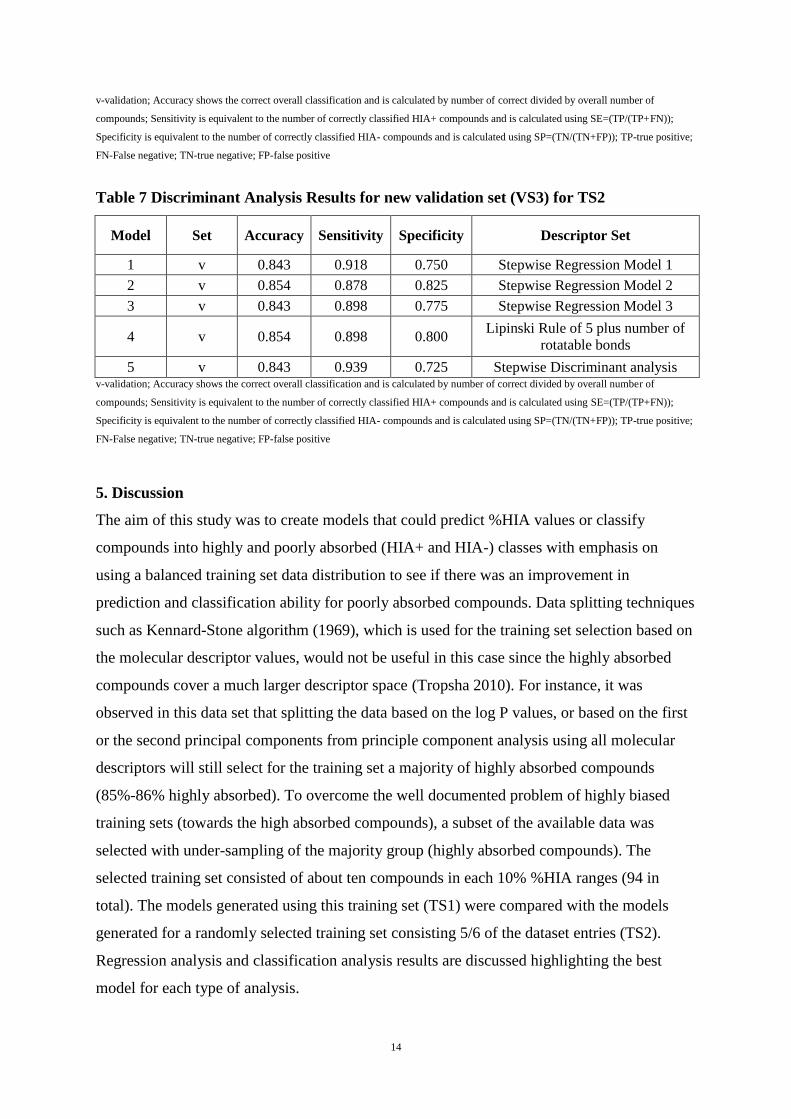
In order to compare the models, the accuracy, sensitivity and sensitivity of discriminant
analysis for the classification of the new validation set, VS3, (containing 89 compounds) for
all 5 models was carried out and the results are in Tables 6 and 7 for TS1 and TS2.
Table 6 Discriminant Analysis Results for new validation set (VS3) for TS1
Model Set Accuracy Sensitivity Specificity Descriptor Set
1 v 0.831 0.880 0.769 Stepwise Regression Model 1
2 v 0.798 0.760 0.846 Stepwise Regression Model 2
3 v 0.899 0.860 0.949 Stepwise Regression Model 3
4 v 0.809 0.800 0.821 Lipinski Rule of 5 plus number of
rotatable bonds
5 v 0.741 0.717 0.769 Stepwise Discriminant analysis
14
v-validation; Accuracy shows the correct overall classification and is calculated by number of correct divided by overall number of
compounds; Sensitivity is equivalent to the number of correctly classified HIA+ compounds and is calculated using SE=(TP/(TP+FN));
Specificity is equivalent to the number of correctly classified HIA- compounds and is calculated using SP=(TN/(TN+FP)); TP-true positive;
FN-False negative; TN-true negative; FP-false positive
Table 7 Discriminant Analysis Results for new validation set (VS3) for TS2
Model Set Accuracy Sensitivity Specificity Descriptor Set
1 v 0.843 0.918 0.750 Stepwise Regression Model 1
2 v 0.854 0.878 0.825 Stepwise Regression Model 2
3 v 0.843 0.898 0.775 Stepwise Regression Model 3
4 v 0.854 0.898 0.800 Lipinski Rule of 5 plus number of
rotatable bonds
5 v 0.843 0.939 0.725 Stepwise Discriminant analysis v-validation; Accuracy shows the correct overall classification and is calculated by number of correct divided by overall number of
compounds; Sensitivity is equivalent to the number of correctly classified HIA+ compounds and is calculated using SE=(TP/(TP+FN));
Specificity is equivalent to the number of correctly classified HIA- compounds and is calculated using SP=(TN/(TN+FP)); TP-true positive;
FN-False negative; TN-true negative; FP-false positive
5. Discussion
The aim of this study was to create models that could predict %HIA values or classify
compounds into highly and poorly absorbed (HIA+ and HIA-) classes with emphasis on
using a balanced training set data distribution to see if there was an improvement in
prediction and classification ability for poorly absorbed compounds. Data splitting techniques
such as Kennard-Stone algorithm (1969), which is used for the training set selection based on
the molecular descriptor values, would not be useful in this case since the highly absorbed
compounds cover a much larger descriptor space (Tropsha 2010). For instance, it was
observed in this data set that splitting the data based on the log P values, or based on the first
or the second principal components from principle component analysis using all molecular
descriptors will still select for the training set a majority of highly absorbed compounds
(85%-86% highly absorbed). To overcome the well documented problem of highly biased
training sets (towards the high absorbed compounds), a subset of the available data was
selected with under-sampling of the majority group (highly absorbed compounds). The
selected training set consisted of about ten compounds in each 10% %HIA ranges (94 in
total). The models generated using this training set (TS1) were compared with the models
generated for a randomly selected training set consisting 5/6 of the dataset entries (TS2).
Regression analysis and classification analysis results are discussed highlighting the best
model for each type of analysis.
15
5.1 Regression Models
Regression models were generated using the randomly selected dataset (TS2) which contains
many more highly absorbed compounds than compounds with intermediate or poor
absorption and the balanced training set chosen by under-sampling the highly absorbed
compounds (TS1). The most suitable equation based on the statistics for the training set was
model 1 which used dataset TS1. Model 1 shows a slightly better fit to the training set than
model 2 using the same training set.
Although in this study model 3 and 4 (developed using TS2) appeared to have poorer
statistics for the training sets, the RMSE for the validation set is better than models 1 and 2.
However it must be noted that a direct comparison between models 1 and 2, with models 3
and 4 at this point is not coherent. This is because models 1 and 2 were derived from a small
training set of 94 compounds (TS1) and evaluated using VS1, a large validation set (N=502),
with a different %HIA distribution to the training set; whereas models 3 and 4 were derived
using a much larger training set (TS2) and were evaluated using VS2, a smaller validation set
that was representative of the training set in terms of %HIA distribution. For a better
comparison of the models with each other a new validation set of 89 compounds (VS3) was
randomly selected from the original large validation set of TS1. This new validation set was
assembled in a way that the %HIA distribution was similar to the TS1 training set i.e. similar
number of compounds at the different %HIA ranges.
RMSE values were calculated for the predicted %HIA values obtained from models 1-4 for
the 89 compound in VS3, the new validation set. The results in Table 3 show that model 2
has the lowest RMSE value of 24.45. Models 3 and 4 have much larger RMSE values for the
new validation set indicating that these models work well for estimation of %HIA of highly
absorbed compounds (as shown by the results in Table 3), but the estimation accuracy is
dropped when the validation set consists of roughly equal proportion of highly and poorly
absorbed compounds (as shown in Table 3), which may be true in real life drug-candidates.
This is expectable due to the highly biased nature of the training set used for the development
of these models (TS2). Therefore, it can be concluded that for the real life scenarios, where a
newly discovered drug candidate maybe expected to have approximately equal probability of
being a highly or poorly absorbable drug, Model 2 may be a more accurate estimate of
%HIA.

16
In this study there is not much difference between the RMSE and r2 values of the models
before and after the exclusion of the compounds that are believed to be absorbed actively or
whose absorption are dissolution limited. This indicated that the effect of transporters does
not have a significant effect on the goodness of fit of the regression models. This could be
because for some compounds, although known to be absorbed via transporters, this process
may not be the dominant one and the effect of the transporters is insignificant compared with
passive diffusion of the compounds (Sugano et al. 2010). So in practice, leaving these
compounds in may be more realistic and help build generic models with a variety of
absorption mechanisms, rather than removing these compounds and possibly reducing the
applicability of the model (Suenderhauf et al. 2011).
Model 2 contained the following descriptors: PSA, log D7.4, Ka3, SHBint2, aliphatic rings(5),
SHBint2_Acnt, SpcPolarizability & SHBint3. All of the descriptors above can be used in
combination to correlate with intestinal absorption; however the correlation decreases
significantly when the descriptors are used independently, highlighting that absorption is a
complex process and is reliant and influenced by a number of different descriptors, not just
one (Clark 1999, 2011; Stouch et al. 2003).
PSA has been found to be the most popular descriptor used in prediction of intestinal
absorption since its first use in relation to brain penetration (van de Waterbeemd and Kansy
1992). It is a measure of the area of the Van der Waals surface that arises from oxygen and
nitrogen atoms or hydrogen atoms bound to these atoms. PSA is related to hydrogen bonding
capacity, which is one of the main influencers of passive drug absorption along with
lipophilicity (Palm et al. 1996). PSA is used more frequently and is deemed more suitable
than normal hydrogen bonding potential descriptors as it accounts for the 3D effects of the
molecule, such as shielding of the polar functional groups by other atoms. It has been shown
that if a molecule has a PSA of ≥ 140Å, it is likely to have poor absorption (<10% FA) and if
the molecule has a PSA ≤60Å, %FA values >90% can be achieved (Clark 1999; Hou et al.
2007c; Palm et al. 1997). This is in agreement with our results as PSA has a negative impact
on absorption. Hydrogen bonding ability has been further characterised in model 2 by three
topological descriptors of SHBint2_Acnt, SHBint2 and SHBint3, all of which have negative
coefficients in agreement with the literature.

17
Hydrophobicity is another physiologically important parameter in intestinal absorption and
descriptors relating to it, such as logP and logD, have a positive contribution to the
predictions for passively absorbed compounds (Zakeri-Milani et al. 2006). An increase in
hydrophobicity would increase the permeation of the compound into and through the cell
membrane in the intestine. However, it has been suggested that the relationship is non linear,
so if the drug is too hydrophobic with a very high logD value for example it may not
penetrate the membrane at all and can also cause solubility issues (Comer 2003; Kerns and Di
2008; Varma et al. 2010). If the compound has a low logD value this could also prevent
absorption but, if the compound is small, with a molecular weight less than 200 Da it may be
absorbed via the paracellular route (Martinez and Amidon 2002; Stenberg et al. 2000). In our
equation logD7.4 has been used, which is the apparent octanol/water partition coefficient at pH
7.4. This particular descriptor has been used in other studies, as well as other logD values at
lower pH values (Hou et al. 2007b). It has been indicated that although logP is easier to
calculate from structure, logD has a better prediction ability as it takes into account the pH
and ionisation (Egan et al. 2000; Hou et al. 2007a). Studies have shown that a combination of
PSA and logD have good prediction abilities for intestinal absorption, indicating that it is a
combination of descriptors that influence predictions (Hou et al. 2009).
Suenderhauf et al (2011) and Hou et al (2006) have compiled summary tables containing
information regarding the results for the models from previously published work. This
enables us to compare our results to previous studies. However, it must be emphasized that it
is very difficult to compare these models due to the lack of compound information regarding
data distribution for the training and validation sets and lack of consistency in validation
techniques (Stouch et al. 2003; The et al. 2011; Zhao et al. 2001). The only way this possibly
could be done would be to mimic the datasets used and compare the models on previous
works‟ datasets (Davis and Brunea 2003).
Taking our best regression model, which was model 2 using dataset TS1 with exclusions an r2
value of 0.785 was achieved with a RMSE for the training and validation set of 14.54 and
23.84. Other studies that used regression analysis such as Wessel et al (1998), Zhao et al
(2001) and Niwa et al (2003) are comparable to our model with regards to the training set.
However, the RMSE for our validation set is slightly higher apart from Niwa et al (2003).
Wessel et al (1998) achieved small RMSE values of 9.5% and 16% for the 76 and 10
compounds used in the training and validation sets. Zhao et al (2001) with an r2
value of 0.83
18
achieved a RMSE of 14%. However, Zhao et al only had 131 and 38 compounds in the
training and validation sets. The more recent study by Niwa et al (2003) showed that although
a small RMSE value was achieved for the training set of 6.5% a much larger RMSE value
was obtained for the validation set of 27.7. The numbers of compounds in the training and
validation set were 67 and 9 compounds.
The studies mentioned so far have used small datasets and so might not be comparable with
this work. Moreover, the comparison of the validation set compounds and distribution of
compounds in them is not known. In fact, Klopman et al (2002) who used a larger dataset
with 417 and 50 compounds in training and validation sets, achieving a r2 value of 0.79,
which is comparable to our model, highlighted that the dataset was limited and that it covered
limited chemical space even with an increase in the number of compounds in the dataset.
Therefore, comparing RMSE values without considering the number of compounds used is
not appropriate as the chemical space of the training set and applicability of the models to a
wider variety of chemicals are different. The models reported in these studies with small
datasets may not be as applicable when the database expands further to include new
structurally diverse compounds of the future.
The more recent studies carried out by Hou et al (2007 and 2009) and Yan et al (2008) both
use 647 compounds but then excluded the 95 outliers for their work. Yan et al (2008) created
3 partial least squares (PLS) models using 380 and 172 compounds for the training and
validation sets. The RMSE value of the best model in this study was 18.18. The best
published method is by Hou et al (2007c), which achieved r2 values of 0.90 and 0.84 and
RMSE values of 7.8% and 11.2% for the training and validation sets using genetic function
approximation (GFA).
5.2 Classification Analysis
There are many advantages for the prediction of intestinal absorption. However, depending
on the stage at which the prediction models are used, the need for precise values predicted by
a regression method may be questionable, when classification methods can be used to define
which drugs will be highly absorbed and likely to be administered orally and those which are
not (Norinder et al. 1997; Suenderhauf et al. 2011).
For the classification analysis, in order to classify which compounds would be grouped as
HIA+ or HIA-, a cutoff of 50% of the %HIA value was defined (HIA+ denotes the high

19
absorbance class, where %HIA is ≥ 50%, and HIA– denotes the low absorbance class,
where %HIA is < 50%). The choice of 50% was arbitrary although it has also been used in
previous studies (Niwa 2003). There have been a number of different cutoffs used, from 10%
(Palm et al. 1997) up to 70% (Xue et al. 2004), with no standard defined.
Table 4, referring to models built from training set TS1, shows that for the classification of
the validation set the best overall classification accuracy was 0.958 (481/502), the highest
specificity value was 0.952 (441/460) and the best sensitivity was 0.959 (40/42), all using
model 3. Model 3 also gives the best accuracy and specificity, and the second best sensitivity
(after model 1) for VS1, the balanced validation set (see Table 6). However for this model,
the overall accuracy and specificity are much lower for the training set compared with the
validation set. In fact in most cases accuracy, specificity and sensitivity of many models are
better for the validation set than for the training set. This can be due to the compound
composition of the training and validation set with the training set containing, by random,
more outlier compounds. Considering also the training set, the best model taking into account
the overall accuracy, specificity and sensitivity values for the training and validation sets was
model 1. However as there were many descriptor values missing (ACD_Density and logP)
this model may not be appropriate in a real life setting as these descriptors maybe difficult to
obtain for new compounds. From this perspective, the best applicable model considering the
training and validation sets is model 2. This achieved an overall accuracy of 0.876 (522/596),
and with specificity and sensitivity values of 0.879 (451/513) and 0.855 (71/83) respectively,
when those measures are calculated over all compounds in the full dataset (merging the
training and validation sets). Model 3 has better overall accuracy of 0.933 (556/596) when
calculated this way; however models 1 and 2 have better overall accuracies for the training
set than model 3 as mentioned previously.
The classification results obtained for TS2 (Table 5) indicate that the classification of poorly
absorbed drugs (specificity values) are less accurate than the highly absorbed compounds
(sensitivity). Moreover, the specificity values of the models developed using TS2 are much
less accurate than models developed using TS1 (compare Tables 6 and 5). This is due to the
unbalanced training set used (TS2) with a lower number of poorly absorbed compounds
compared to highly absorbed compounds. On the other hand, sensitivity is higher in most
models obtained for TS2, compared with models developed with TS1, with exceptions being
the validation set sensitivity of model 3 and model 5.
20
For both TS1 and TS2 the effect of removal of the excluded compounds as highlighted by
Hou et al (2007c) increased overall accuracy, specificity and sensitivity values in the majority
of cases, but there was not a significant increase. So, as stated before, in practice leaving
these compounds in will achieve a more applicable model that will have better generalization
for new compounds.
Suenderhauf et al (2011) and Hou et al (2006) have compiled summary tables that detail the
accuracy, specificity and sensitivity of previous classification work carried out by previous
studies. Overall a similar pattern emerges that the overall accuracy and sensitivity values of
previous studies are higher than the specificity values obtained. This could be due to the low
ratio of HIA- compounds in the training sets. An exception to this pattern is the results
obtained by Hou et al (2007c), where specificity values in the validation set were higher than
the sensitivity values. For our work, the overall accuracy and sensitivity are comparable or
higher than previous studies apart from Hou et al (2007c), who used the same dataset but
excluded carrier mediated and poorly soluble compounds. They also included 26 compounds
with positively charged nitrogen which are known to be poorly absorbed and predicted
readily with a count of positively charged nitrogen atoms. This aids the statistics of their
model by increasing the specificity. This is also the reason for the higher specificity
compared with sensitivity in their model. We have not included these 26 compounds in our
investigation. Also, it must be noted that in Hou‟s investigation, the more complex non-linear
methods of recursive partitioning and genetic function approximation (GFA) have been used
(Hou et al, 2007c). Again, as mentioned earlier it would be precarious to take results at face
value without considering the real impact of this type of information such as number of
compounds in each class in the training and validation sets.
There is a lot of business emphasis on reducing the number of false negatives in drug
discovery due to the potential of missing the next potential drug and therefore potential loss
of revenue, which is very important with the increased cost of drug discovery and
development (Malo et al. 2006). A reduction in the number of false negatives is favoured in
most publications as in practice they are more difficult to assess and highlight, so a model
with as low as possible false negative rate is preferred (Zhang et al. 2000). An example of
this is Amlodipine, which was predicted to be poorly bioavailable by QSAR but in real life is
highly bioavailable (Beresford et al. 2004). However reducing the number of false positives
21
could be considered equally as important or more important for cost effectiveness reasons. If
a drug is misclassified as highly absorbed when in fact it is poorly absorbed (false positive)
more time, effort and money is invested to investigate and reveal the compounds true class
with further tests. Although there are few publications indicating that false positives need to
be decreased rather than the business need of reducing false negatives, with the spiralling cost
of drug discovery it maybe a future consideration for many companies to reduce false
positives and therefore become more cost and time effective (Cummings 2006; Oprea 2000).
Comparing the sensitivity and specificity values reported in Tables 7 and 8 for the consistent
validation set of 89 compounds (VS3), it can be seen that the best specificity is achieved for
models developed using TS1 (Table 6) with the highest value obtained using model 3. On the
other hand the best sensitivity values were obtained using models developed using TS2
(Table 7). This shows that TS1, the balanced dataset has a better classification ability
compared with TS2 (unbalanced dataset) for predicting poorly absorbed compounds whereas
TS2 has a better classification ability for highly absorbed compounds due to the biased nature
of the dataset. In relation to the reduction of false positives and false negatives and depending
on the priority, the balanced TS1 dataset would aid to reduce false positives by the increasing
specificity and TS2 would increase sensitivity and therefore reduce false negatives. In
conclusion if reducing the number of false positives is the priority then under-sampling of the
majority class of the highly absorbed compounds would lead to more accurate and applicable
in silico models for use in industry.
6. Conclusion
The importance of a good dataset is reiterated in numerous publications (Hou et al. 2009;
Hou et al. 2007a; Tian et al. 2011; Zhu et al. 2011). There is a lack of publically available
data to try and improve models for predicting intestinal absorption, however, even with more
compounds it is the quality of the data which will then be questioned (Stouch et al. 2003).
How the data is obtained and how it is validated are important issues to consider (Kortagere
and Ekins 2010). In this work the dataset of Hou et al (2007c) was used for the development
and validation of the models. In order to improve the prediction accuracy for the poorly
absorbed compounds, the training set was selected by under-sampling the highly absorbed
compounds. Two types of linear methods were used for the development of the models:
linear discriminant analysis for the classification and multiple linear regression for the
regression type analysis.
22
In terms of the linear regression models, results were conclusive that using the balanced
dataset with similar proportions of various %HIA ranges leads to more robust models with
lower prediction error for the validation set. This is despite the lower number of compounds
in this training set (N=94), in comparison with the randomly selected training set of 496
compounds. It is interesting to note that the r2
values of this study are comparable to some of
the models obtained using a variety of more complex techniques such as SVM and GA
feature selection, showing that simple regression can obtain just as good r2 and fit for the
prediction of %HIA (Reynolds et al. 2009; Yan et al. 2008).
The discriminant models for the classification of compounds into high and low absorption
classes indicated that the use of the balanced training set significantly improves specificity of
the models indicating the higher accuracy of the classification of poorly absorbed
compounds. However the sensitivity of the models developed using the balanced training set
was lower than the sensitivity of the models based on the randomly selected training set
which is skewed towards the highly absorbed compounds. Therefore, it can be suggested that,
for reducing the number of false positives, it is better to use the balanced training set, despite
the smaller training set size due to the under-sampling of the majority class.
To conclude, this work highlights that by creating a balanced training set the more improved
models which are also applicable to real life scenarios can be achieved for both regression
and classification type analyses. It is envisaged that this conclusion may be extended to
models based on more complex statistical techniques such as non-linear methods to improve
the prediction accuracy further. Another significant point that needs to be considered in
training set selection, in future research, is the impact of solubility and the dataset distribution
of solubility values. Taking this into account may lead to even more applicable models given
the increasing number of the poorly water-soluble and high molecular weight New Chemical
Entities.
The need for in silico modeling for the prediction of absorption is still apparent. There are
many mitigating factors that can affect the use of simple models, but they are still useful.
Even though different models were developed in this work, there were particular descriptors
that were in more than one model. These descriptors help and confirm the understanding and
the process of oral absorption. Descriptors such as logD, PSA and those involving H bonding

23
are all known to have an impact, whether this is positively or negatively, on oral absorption.
There is still a wide scope for improving the prediction of models as there are many
influencing factors that contribute towards absorption and therefore eventually oral
bioavailability.
24
References
Al-Awqati, Q. (1999) One hundred years of membrane permeability: does Overton still rule? Nature
Cell Biology 1, E201-E202.
Ashford, M. (2007) Part 4: Biopharmaceutical principles of drug delivery. In: Aulton's
Pharmaceutics, The design and manufacture of medicines, 3 edn., Ed: M.E. Aulton, Churchill
Livingstone Elsevier, Philadelphia. pp 265-324.
Beresford, A.P., Segall, M. and Tarbit, M.H. (2004) In silico prediction of ADME properties: Are we
making progress? Current Opinion in Drug Discovery & Development 7, 36-42.
Boobis, A., Gundert-Remy, U., Kremers, P., Macheras, P. and Pelkonen, O. (2002) In silico
prediction of ADME and pharmacokinetics - Report of an expert meeting organised by COST
B15. European Journal of Pharmaceutical Sciences 17, 183-193.
Burton, P.S., Goodwin, J.T., Vidmar, T.J. and Amore, B.M. (2002) Predicting drug absorption: How
nature made it a difficult problem. Journal of Pharmacology and Experimental Therapeutics
303, 889-895.
Clark, D.E. (1999) Rapid calculation of polar molecular surface area and its application to the
prediction of transport phenomena. 1. Prediction of intestinal absorption. Journal of
Pharmaceutical Sciences 88, 807-814.
Clark, D.E. (2011) What has polar surface area ever done for drug discovery? Future Medicinal
Chemistry 3, 469-484.
Comer, J.E.A. (2003) High-throughput Measurement of log D and pka. In: Drug Bioavailability:
Estimation of Solubility, Permeability, Absorption and Bioavailability (Methods and
Principles in Medicinal Chemistry), 1 edn., Eds: H.v.d. Waterbeemd, H. Lennernäs, P.
Artursson, R. Mannhold, H. Kubinyi and G. Folkers, Wiley-VCH, Weinheim. p 23.
Cummings, D., J. (2006) Pharmaceutical Drug Discovery: Designing the Blockbuster Drug. In:
Screening Methods for Experimentation in Industry, Drug Discovery, and Genetics, 1 edn.,
Eds: A. Dean and S. Lewis, Springer, New York. pp 74-76.
Davis, A.M. and Brunea, P. (2003) In Silico Prediction of Solubility. In: Drug Bioavailability:
Estimation of Solubility, Permeability, Absorption and Bioavailability (Methods and
Principles in Medicinal Chemistry), 1 edn., Eds: H.v.d. Waterbeemd, H. Lennernäs, P.
Artursson, R. Mannhold, H. Kubinyi and G. Folkers, Wiley-VCH, Weinheim. pp 53-56.
Davis, A.M., Keeling, D.J., Steele, J., Tomkinson, N.P. and Tinker, A.C. (2005) Components of
successful lead generation. Current Topics in Medicinal Chemistry 5, 421-439.
Egan, W.J., Merz, K.M. and Baldwin, J.J. (2000) Prediction of drug absorption using multivariate
statistics. Journal of Medicinal Chemistry 43, 3867-3877.
Geerts, T. and Heyden, Y.V. (2011) In Silico Predictions of ADME-Tox Properties: Drug Absorption.
Combinatorial Chemistry & High Throughput Screening 14, 339-361.
Giacomini, K.M., Huang, S.M., Tweedie, D.J., Benet, L.Z., Brouwer, K.L.R., Chu, X.Y., Dahlin, A.,
Evers, R., Fischer, V., Hillgren, K.M., Hoffmaster, K.A., Ishikawa, T., Keppler, D., Kim,
R.B., Lee, C.A., Niemi, M., Polli, J.W., Sugiyama, Y., Swaan, P.W., Ware, J.A., Wright,
S.H., Yee, S.W., Zamek-Gliszczynski, M.J., Zhang, L. and International, T. (2010)
Membrane transporters in drug development. Nature Reviews Drug Discovery 9, 215-236.

25
Gleeson, M.P., Hersey, A. and Hannongbua, S. (2011) In-Silico ADME Models: A General
Assessment of their Utility in Drug Discovery Applications. Current Topics in Medicinal
Chemistry 11, 358-381.
Hou, T.J., Wang, J.M., Zhang, W., Wang, W. and Xu, X. (2006) Recent advances in computational
prediction of drug absorption and permeability in drug discovery. Current Medicinal
Chemistry 13, 2653-2667.
Hou, T.J., Li, Y.Y., Zhang, W. and Wang, J.M. (2009) Recent Developments of In Silico Predictions
of Intestinal Absorption and Oral Bioavailability. Combinatorial Chemistry & High
Throughput Screening 12, 497-506.
Hou, T.J., Wang, J.M. and Li, Y.Y. (2007a) ADME evaluation in drug discovery. 8. The prediction of
human intestinal absorption by a support vector machine. Journal of Chemical Information
and Modeling 47, 2408-2415.
Hou, T.J., Wang, J.M., Zhang, W. and Xu, X.J. (2007b) ADME evaluation in drug discovery. 6. Can
oral bioavailability in humans be effectively predicted by simple molecular property-based
rules? Journal of Chemical Information and Modeling 47, 460-463.
Hou, T.J., Wang, J.M., Zhang, W. and Xu, X.J. (2007c) ADME evaluation in drug discovery. 7.
Prediction of oral absorption by correlation and classification. Journal of Chemical
Information and Modeling 47, 208-218.
Kay, K. (2011) Introduction. In: ADMET for Medicinal Chemists A Practical Guide, Eds: K. Tsaioun
and S.A. Kates, Wiley, New Jersey. pp 10-11.
Kennedy, T. (1997) Managing the drug discovery/development interface. Drug Discovery Today 2,
436-444.
Kerns, E.H. and Di, L. (2008) Drug like properties: Concepts, Structure Design and Methods from
ADME to Toxicity Optimisation, 1 edn., Academic Press Elsevier, Burlington.
Klopman, G., Stefan, L.R. and Saiakhov, R.D. (2002) ADME evaluation 2. A computer model for the
prediction of intestinal absorption in humans. European Journal of Pharmaceutical Sciences
17, 253-263.
Kola, I. and Landis, J. (2004) Can the pharmaceutical industry reduce attrition rates? Nature Reviews
Drug Discovery 3, 711-715.
Kortagere, S. and Ekins, S. (2010) Troubleshooting computational methods in drug discovery.
Journal of Pharmacological and Toxicological Methods 61, 67-75.
Kwon, Y. (2002) Handbook of Essential Pharmacokinetics, Pharmacodynamics, and Drug
Metabolism for Industrial Scientists, 1 edn., Springer, New York.
Lagorce, D., Reynes, C., Camproux, A.C., Mitieva, M.A., Sperandio, O. and B.O.Villoutreix (2011)
In Silico ADMET/Tox Predictions. In: ADMET for Medicinal Chemists A Practical Guide,
Eds: K. Tsaioun and S.A. Kates, Wiley. pp 29-123.
Lipinski, C.A., Lombardo, F., Dominy, B.W. and Feeney, P.J. (1997) Experimental and
computational approaches to estimate solubility and permeability in drug discovery and
development settings. Advanced Drug Delivery Reviews 23, 3-25.
Macheras, P. and Iliadis, A. (2006) Modeling in Biopharmaceutics, Pharmacokinetics and
Pharmacodynamics - Homogenous and Heterogenous Approaches, Springer, New York.

26
Malo, N., Hanley, J.A., Cerquozzi, S., Pelletier, J. and Nadon, R. (2006) Statistical practice in high-
throughput screening data analysis. Nature Biotechnology 24, 167-175.
Martinez, M.N. and Amidon, G.L. (2002) A mechanistic approach to understanding the factors
affecting drug absorption: A review of fundamentals. Journal of Clinical Pharmacology 42,
620-643.
Miller, J.M., Dahan, A., Gupta, D., Varghese, S. and Amidon, G.L. (2010) Enabling the Intestinal
Absorption of Highly Polar Antiviral Agents: Ion-Pair Facilitated Membrane Permeation of
Zanamivir Heptyl Ester and Guanidino Oseltamivir. Molecular Pharmaceutics 7, 1223-1234.
Niwa, T. (2003) Using general regression and probabilistic neural networks to predict human
intestinal absorption with topological descriptors derived from two-dimensional chemical
structures. Journal of Chemical Information and Computer Sciences 43, 113-119.
Norinder, U., Osterberg, T. and Artursson, P. (1997) Theoretical calculation and prediction of Caco-2
cell permeability using MolSurf parametrization and PLS statistics. Pharmaceutical Research
14, 1786-1791.
Oprea, T.I. (2000) Property distribution of drug-related chemical databases. Journal of Computer-
Aided Molecular Design 14, 251-264.
Oprea, T.I., Allu, T.K., Fara, D.C., Rad, R.F., Ostopovici, L. and Bologa, C.G. (2007) Lead-like,
drug-like or "pub-like": how different are they? Journal of Computer-Aided Molecular
Design 21, 113-119.
Palm, K., Luthman, K., Ungell, A.L., Strandlund, G. and Artursson, P. (1996) Correlation of drug
absorption with molecular surface properties. Journal of Pharmaceutical Sciences 85, 32-39.
Palm, K., Stenberg, P., Luthman, K. and Artursson, P. (1997) Polar molecular surface properties
predict the intestinal absorption of drugs in humans. Pharmaceutical Research 14, 568-571.
Reynolds, D.P., Lanevskij, K., Japertas, P., Didziapetris, R. and Petrauskas, A. (2009) Ionization-
Specific Analysis of Human Intestinal Absorption. Journal of Pharmaceutical Sciences 98,
4039-4054.
Sinko, P.J. (1999) Drug selection in early drug development: screening for acceptable
pharmacokinetic properties using combined in vitro and computational approaches. Current
opinion in drug discovery & development 2, 42-48.
Smith, D.A. (2002) Hello Drug Discovery, I am from Insilico, take me to your President. Drug
Discovery Today 7, 1080-1081.
Stenberg, P., Luthman, K. and Artursson, P. (2000) Virtual screening of intestinal drug permeability.
Journal of Controlled Release 65, 231-243.
Stouch, T.R., Kenyon, J.R., Johnson, S.R., Chen, X.Q., Doweyko, A. and Li, Y. (2003) In silico
ADME/Tox: why models fail. Journal of Computer-Aided Molecular Design 17, 83-92.
Suenderhauf, C., Hammann, F., Maunz, A., Helma, C. and Huwyler, J. (2011) Combinatorial QSAR
Modeling of Human Intestinal Absorption. Molecular Pharmaceutics 8, 213-224.
Sugano, K., Kansy, M., Artursson, P., Avdeef, A., Bendels, S., Di, L., Ecker, G.F., Faller, B., Fischer,
H., Gerebtzoff, G., Lennernaes, H. and Senner, F. (2010) Coexistence of passive and carrier-
mediated processes in drug transport. Nature Reviews Drug Discovery 9, 597-614.

27
The, H.P., Gonzalez-Alvarez, I., Bermejo, M., Sanjuan, V.M., Centelles, I., Garrigues, T.M. and
Cabrera-Perez, M.A. (2011) In Silico Prediction of Caco-2 Cell Permeability by a
Classification QSAR Approach. Molecular Informatics 30, 376-385.
Tian, S., Li, Y., Wang, J., Zhang, J. and Hou, T. (2011) ADME Evaluation in Drug Discovery. 9.
Prediction of Oral Bioavailability in Humans Based on Molecular Properties and Structural
Fingerprints. Molecular Pharmaceutics 8, 841-851.
Tropsha, A. (2010) Best Practices for QSAR Model Development, Validation, and Exploitation.
Molecular Informatics 29, 476-488.
Tsaioun, K., Bottlaender, M. and Mabondzo, A. (2009) ADDME – Avoiding Drug Development
Mistakes Early: central nervous system drug discovery perspective. BMC Neurology 9, S1.
van de Waterbeemd, H. and Gifford, E. (2003) ADMET in silico modelling: towards prediction
paradise? Nature Reviews Drug Discovery 2, 192-204.
van de Waterbeemd, H. and Kansy, M. (1992) HYDROGEN-BONDING CAPACITY AND BRAIN
PENETRATION. Chimia 46, 299-303.
Varma, M.V.S., Obach, R.S., Rotter, C., Miller, H.R., Chang, G., Steyn, S.J., El-Kattan, A. and
Troutman, M.D. (2010) Physicochemical Space for Optimum Oral Bioavailability:
Contribution of Human Intestinal Absorption and First-Pass Elimination. Journal of
Medicinal Chemistry 53, 1098-1108.
Veber, D.F., Johnson, S.R., Cheng, H.Y., Smith, B.R., Ward, K.W. and Kopple, K.D. (2002)
Molecular properties that influence the oral bioavailability of drug candidates. Journal of
Medicinal Chemistry 45, 2615-2623.
Wessel, M.D., Jurs, P.C., Tolan, J.W. and Muskal, S.M. (1998) Prediction of human intestinal
absorption of drug compounds from molecular structure. Journal of Chemical Information
and Computer Sciences 38, 726-735.
Xue, Y., Li, Z.R., Yap, C.W., Sun, L.Z., Chen, X. and Chen, Y.Z. (2004) Effect of molecular
descriptor feature selection in support vector machine classification of pharmacokinetic and
toxicological properties of chemical agents. Journal of Chemical Information and Computer
Sciences 44, 1630-1638.
Yan, A., Wang, Z. and Cai, Z. (2008) Prediction of Human Intestinal Absorption by GA Feature
Selection and Support Vector Machine Regression. International Journal of Molecular
Sciences 9, 1961-1976.
Zakeri-Milani, P., Tajerzadeh, H., Islambolchilar, Z., Barzegar, S. and Valizadeh, H. (2006) The
relation between molecular properties of drugs and their transport across the intestinal
membrane. DARU Journal of Pharmaceutical Sciences 14, 164-171.
Zhang, J.H., Chung, T.D.Y. and Oldenburg, K.R. (2000) Confirmation of primary active substances
from high throughput screening of chemical and biological populations: A statistical approach
and practical considerations. Journal of Combinatorial Chemistry 2, 258-265.
Zhao, Y.H., Abraham, M.H., Le, J., Hersey, A., Luscombe, C.N., Beck, G., Sherborne, B. and
Cooper, I. (2002) Rate-limited steps of human oral absorption and QSAR studies.
Pharmaceutical Research 19, 1446-1457.
Zhao, Y.H., Le, J., Abraham, M.H., Hersey, A., Eddershaw, P.J., Luscombe, C.N., Boutina, D., Beck,
G., Sherborne, B., Cooper, I. and Platts, J.A. (2001) Evaluation of human intestinal absorption

28
data and subsequent derivation of a quantitative structure-activity relationship (QSAR) with
the Abraham descriptors. Journal of Pharmaceutical Sciences 90, 749-784.
Zhu, J.Y., Wang, J.M., Yu, H.D., Li, Y.Y. and Hou, T.J. (2011) Recent Developments of In Silico
Predictions of Oral Bioavailability. Combinatorial Chemistry & High Throughput Screening
14, 362-374.