preparing for productive careers: students’ participation ... · preparing for productive...
TRANSCRIPT

Contract No.: EA95010001 MPR Reference No.: 8292-680
Preparing for Productive Careers: Students’ Participation in and Use of Career-Focused Learning Activities Final Report March 2003 Joshua Haimson John Deke
Submitted to:
U.S. Department of Education 400 Maryland Ave, SW, Room 6W231 Washington, DC 20202
Project Officer:
David Goodwin
Submitted by:
Mathematica Policy Research, Inc. P.O. Box 2393 Princeton, NJ 08543-2393 Telephone: (609) 799-3535 Facsimile: (609) 799-0005
Project Director:
Joshua Haimson


iii
ACKNOWLEDGMENTS
This study and report have benefited from the contributions of many people. Our special thanks go to everyone who assisted with the data collection efforts in the eight states including the school staff, who were extremely helpful, and all of the students responding to the surveys. We also would like to thank David Goodwin, Marsha Silverberg, and Sharon Belli at the U.S. Department of Education, Penni Hudis at MPR Associates, and Russell Jackson at Decision Information Resources for their thoughtful suggestions and comments during the development of this report.
All of the members of the study team at Mathematica Policy Research, Inc. made crucial
contributions. Alan Hershey played a key role during each phase of the development of this report by helping to frame the key questions, interpret key findings, and providing insightful substantive and editorial comments on drafts of this report. Pat Nemeth, the survey director, made invaluable contributions leading all of the survey tasks including the development of the instruments and survey operations. In addition, Anne Self was essential in coordinating the student surveys and the transcript collection effort. John Hall and Frank Potter skillfully led the survey sample design and sample selection effort. The report also reflects the expertise of Xiaofan Sun and Jigar Bhatt who wrote and ran all of the computer programs for the data analysis. Vatsala Karwe, Jeanne Bellotti, and Frank Potter provided helpful technical advice on many programming issues. Roy Grisham provided careful editing assistance, and William Garrett did a superb job of word processing. The authors appreciate every one of these contributions but bear full responsibility for the judgments and conclusions presented in this report.


v
CONTENTS
Chapter Page
EXECUTIVE SUMMARY........................................................................................... xi I INTRODUCTION.......................................................................................................... 1 II CAREER CHALLENGES AFTER HIGH SCHOOL ................................................... 7 III STUDENT PARTICIPATION IN CAREER-FOCUSED LEARNING
ACTIVITIES ................................................................................................................ 23 IV MIX OF STUDENTS PARTICIPATING IN CAREER-FOCUSED
ACTIVITIES ................................................................................................................ 35 V QUALITATIVE FEATURES OF VOCATIONAL CLASSES AND
INTERNSHIPS ............................................................................................................ 47 VI GRADUATES’ ASSESSMENT AND USE OF HIGH SCHOOL ACTIVITIES....... 55
REFERENCES............................................................................................................. 71


vii
TABLES Table Page
1 COMPOSITION OF EIGHT-STATE 12TH GRADE SURVEY RESPONDENTS AND ALL U.S. 12TH GRADERS ............................................ 5
2 CAREER GOAL POPULARITY IN 12TH GRADE AND 18 MONTHS AFTER HIGH SCHOOL GRADUATION............................................................. 9
3 MALE AND FEMALE YOUNG ADULTS’ CAREER GOALS 18 MONTHS AFTER HIGH SCHOOL GRADUATION......................................... 17
4 CHARACTERISTICS OF POSTSECONDARY JOBS BY POSTSECONDARY ENROLLMENT................................................................. 20
5 PARTICIPATION IN CAREER DEVELOPMENT ACTIVITIES BY STUDENT SUBGROUP....................................................................................... 37
6 PARTICIPATION IN CAREER-FOCUSED CLASSES BY STUDENT SUBGROUP.......................................................................................................... 38
7 PARTICIPATION IN WORK ACTIVITIES BY STUDENT SUBGROUP ....... 39
8 PARTICIPATION IN APPLIED ACADEMIC ACTIVITIES IN VOCATIONAL CLASSES, STUDENTS IN CLASS OF 1996 AND 2000........ 49
9 HIGH SCHOOL GRADUATES’ VIEWS ON VALUE OF HIGH SCHOOL ACTIVITIES IN CLARIFYING CAREER GOALS........................... 58
10 CHARACTERISTICS OF FIRST POSTSECONDARY JOBS: DIFFERENCES BETWEEN POSITIONS FOUND THROUGH SCHOOL AND OTHER POSITIONS................................................................................... 68


ix
FIGURES Figure Page
1 POSTSECONDARY EDUCATION GOALS AT THE END OF 12TH GRADE ................................................................................................................. 10
2 YOUNG ADULTS’ POSTSECONDARY GOALS AND ENROLLMENT
STATUS 18 MONTHS AFTER HIGH SCHOOL ............................................... 14 3 REASONS YOUNG ADULTS DROP OUT OF OR NEVER ENROLL IN
POSTSECONDARY EDUCATION..................................................................... 15 4 PARTICIPATION IN CAREER DEVELOPMENT ACTIVITIES,
CLASSES OF 1996 AND 2000 ............................................................................ 25 5 PERCEIVED CAREER-FOCUS OF STUDENTS’ HIGH SCHOOL
CLASSES, CLASSES OF 1996 AND 2000 ......................................................... 28 6 PARTICIPATION IN INTERNSHIPS AND OTHER WORK
EXPERIENCE ACTIVITIES, CLASSES OF 1996 AND 2000........................... 31 7 TIMING OF STUDENTS’ PAID AND UNPAID WORK EXPERIENCE
POSITIONS OBTAINED THROUGH SCHOOL, CLASSES OF 1996 AND 2000 ............................................................................................................. 33
8 QUALITATIVE ADVANTAGES OF POSITIONS HIGH SCHOOL
STUDENTS OBTAIN THROUGH SCHOOL, CLASS OF 2000 ....................... 51 9 POSTSECONDARY STUDENTS USE OF CREDITS EARNED IN HIGH
SCHOOL CLASSES............................................................................................. 61 10 EXTENT TO WHICH YOUNG ADULTS DRAW ON SKILLS
LEARNED IN HIGH SCHOOL IN ANY OF THEIR POSTSECONDARY JOBS...................................................................................................................... 63
11 HOW HIGH SCHOOL GRADUATES FOUND THEIR FIRST JOB................. 66


xi
EXECUTIVE SUMMARY
Policymakers have a long-standing interest in helping high school students formulate career goals and prepare for successful careers. The federal government has supported vocational and other career-focused education programs in high schools for nearly a century, beginning with the Smith Hughes Act of 1917. While federal funding for these programs has declined in real terms over the past 20 years, Perkins Act funding for vocational programs continues to represent one of the largest federal expenditures at the secondary level (Silverberg et al. 2002).
The goals of high school career-focused activities are evolving as educators concentrate
more intensively on improving students’ academic achievement. As a growing number of students plan to attend college, some policymakers have questioned the value and relevance of traditional vocational programs, particularly those that prepare students for jobs that do not require a college degree. This has led some schools to develop career-focused programs designed to prepare students for at least two-year college programs. Some states now encourage all students to participate in career development activities designed to help students clarify goals and develop postsecondary education and employment plans. Nonetheless, some career-focused programs continue to provide technical training and internships for students who plan to work full time after leaving high school.
This report draws on recent surveys of three cohorts of students in eight states to examine
the extent of student participation in career-focused educational activities and the potential value of those activities. The surveys, conducted as part of an evaluation of efforts to expand career-focused activities during the late 1990s, cover a random sample of students in 69 schools. The 69 schools were randomly selected from among those covered by the eight states’ school-to-work initiatives.
The rest of this executive summary outlines findings related to three main topics. First, to
clarify the problems and educational needs that career-focused programs can address, we examine challenges recent high school graduates faced as they sought to achieve their education and career goals. Second, to gauge how schools and students are addressing these challenges, we examine the extent and recent growth of students’ involvement in career-focused high school activities. Finally, although an analysis of the effects of these activities on students’ outcomes is beyond the scope of our study, we examine how high school graduates appear to value and use some of these activities in their jobs and postsecondary programs.
CAREER-RELATED CHALLENGES FOR YOUNG ADULTS
The paths that young adults take as they leave high school reflect some of the challenges they face in defining and pursuing career goals. While some people figure out their career goals early in life, most change their goals as they accumulate work experience. Learning about a career of potential interest is easier if and when one has obtained a job related to one’s interests. As young adults formulate and refine their career goals, they may need to change their educational plans accordingly. Conversely, young adults who discover that they do not have enough resources or preparation for postsecondary education programs may need to revise their
xii
goals. The ways in which young adults’ postsecondary paths conform to, or deviate from, their expressed goals point to challenges they face and needs that schools may be able to address.
Drawing on the eight-state follow-up surveys conducted 18 months after students left high
school, we examine three issues related to students’ postsecondary transitions: (1) the extent to which students modify their career and education goals shortly after they leave high school; (2) the extent to which students make progress in achieving their education goals; and (3) the quality of the jobs they find, particularly the extent to which these jobs relate to their career goals or can finance postsecondary education.
• Most students change their career or education goals shortly after leaving high
school.
As young adults continue to explore potential career paths after high school, it is natural that many of them will change their career and education goals. Students may change their goals after they learn more about particular careers or their own skills. However, shifting goals may also indicate that students have not properly considered alternative career options or the educational preparation needed to achieve them.
Many students appear to leave high school with vague or fluid career goals. Eighteen
months after high school, three-quarters of surveyed students in the eight states changed their career or education goal. Approximately half have changed their career goal, half have changed their education goal, and a quarter changed both.1 The mix of specific career goals students report 18 months after high school is quite different from the mix of goals articulated at the end of the 12th grade. For example, many more students say they are interested in management or administration, and many fewer express interest in technical careers such as engineering.
Nearly all students continue to want some form of postsecondary education, but there are
some large changes in the type of education sought. More than 95 percent of students report, both at the end of 12th grade and 18 months later, that they will need some postsecondary education to prepare for the job they expect to obtain. However, a large fraction change their mind about the type of education they need. For example, at the end of their senior year of high school, about one out of eight students said that they will not need to get either a two- or four-year college degree; however 18 months later, 62 percent of this group changed their minds, with 25 percent deciding they would need a two-year degree, and 37 percent saying they would need a four-year degree.
In designing career-focused high school activities, educators must confront the instability of
young adults’ career and education goals. One open question is whether any high school activities can help students formulate clear, realistic goals and plans. If so, educators need to try
1Career goal changes are measured by a follow-up survey question that directly asks young
adults if they have changed their career goals. Education goal changes are identified by comparing young adults’ stated education goal in high school to their stated goal 18 months later.

xiii
to identify which activities are most effective and whether the efficacy of specific activities depends upon students’ interests, plans, or other characteristics. Another question is whether it makes sense for high school students to take one or more classes focused on a specific career area given the large number who change their goals after they graduate. To address this issue, additional research is needed on whether taking such classes can help students clarify their goals.
• While most graduates have ambitious education goals, many drop out or do not
enroll in postsecondary programs for economic reasons.
Most young adults have high aspirations. Nearly all the respondents to the eight-state surveys conducted in 12th grade and 18 months after high school reported that they needed some postsecondary education for the type of career they plan to pursue. More than three-quarters said they will need at least a bachelor’s degree for their intended career.
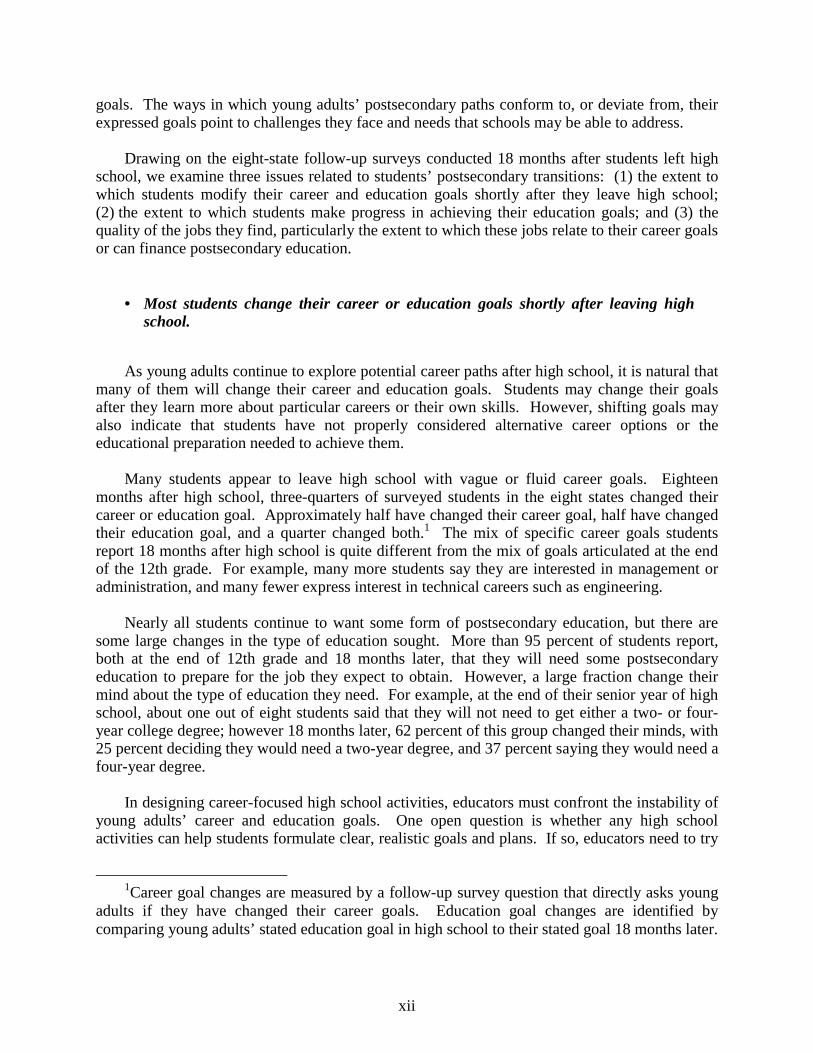
As with previous studies, we find that many of the students in our eight-state sample make
slow progress toward attaining their education goals (Figure 1). A year and a half after leaving high school, 30 percent of the respondents are not enrolled in, and have not completed, any postsecondary program, even though nearly all indicated that they need more than a high school degree to achieve their career goals. Moreover, about 14 percent of those who enrolled in some postsecondary program have dropped out without completing it, have not entered another program, and have no plans to do so within the next year.
Economic factors dominate the list of reasons for dropping out or never enrolling in the first
place, highlighting the potential importance of accumulating some financial resources to help pay for education. Half of all those who drop out of postsecondary programs or never enroll cite an inability to pay tuition or the need to work as the reason. The importance of these economic factors points to the potential value of both financial aid policies and efforts to help students secure good jobs that can help pay for postsecondary education.
• Most high school graduates are employed in jobs that do not relate to their career
goals and provide limited resources for postsecondary education.
Students’ jobs after high school can represent important steps in refining and pursuing their career goals. Whether or not students are enrolled in educational programs, employment can be helpful in developing basic and technical skills, learning more about a field related to a career goal, and accumulating resources that can be used to pay for education or training in the future. Students’ success in finding jobs related to a career interest reflects the degree to which they are prepared for the labor market and the personal resources they can draw upon in their job search.
Although nearly all young adults find some employment after high school, most jobs do not
relate to students’ career goals, and most can provide only limited resources for postsecondary education. About 71 percent of young adults who were employed 18 months after high school reported that their job was in a different field than that of their career goal. As one might expect, given their lack of work experience, the pay and benefits of most students’ jobs are fairly

xiv
1
30
912 12
22
79
36
0
10
20
30
40
50
60
70
80
90
100
No PostsecondaryEducation
Certificate Two-Year College Four-Year College
Goal Enrollment Status
FIGURE 1
YOUNG ADULTS’ POSTSECONDARY GOALS AND ENROLLMENT STATUS18 MONTHS AFTER HIGH SCHOOL
Percent of Survey Respondents
Source: Eight-State Follow-up Survey of Classes of 1996 and 1998, Mathematica Policy Research, Inc.
modest. Employed students earn, on average, $7.76 per hour. With these earnings, it is understandable why many young adults report some difficulty financing postsecondary education.
STUDENT PARTICIPATION IN CAREER-FOCUSED ACTIVITIES
Most high schools seek to help students begin to define career goals and prepare to achieve them. Schools do this by offering students career-focused learning opportunities, including career counseling, vocational and academic classes that center around particular careers, and internships and other work experiences. Each of these types of learning activities has been available in some schools for decades. During the late 1990s, some policies—including the federal school-to-work initiative and changes to Perkins legislation—were designed to expand student participation in career-focused learning activities. Federal and state policies also sought to engage a diverse mix of students in most of these activities. However, during the same period, many schools sought to implement academic reforms that increased graduation requirements. These new requirements could have made it harder for some schools to expand student participation in certain career-focused activities, particularly relatively intensive and time-consuming ones.
To gauge the cumulative effects of these trends, we examine students’ participation in
career-focused high school activities. Drawing on the eight-state 12th-grade surveys, we examine the extent to which students participated in specific career-focused activities and the
xv
degree to which these activities grew or declined between the Classes of 1996 and 2000. Here, we report findings on (1) the prevalence and growth of specific activities, and (2) the mix of students participating in these activities.
• Nearly all high school students participate in some career-focused activities,
although the most prevalent activities are brief ones.
Nearly all students participate in some high school activity designed to clarify their goals and prepare for a career. We analyzed the extent and growth of student participation in three types of activities: (1) career development activities designed to expose students to alternative careers or help students develop educational plans; (2) vocational and academic classes or assignments that students perceive to be related to their career interests; and (3) work experiences that schools developed for students, including paid and unpaid workplace positions and school-based enterprises. Nearly all (99.8 percent) students participated in at least one of these activities, and a substantial fraction (43 percent) participated in one of each of the three kinds of activities.
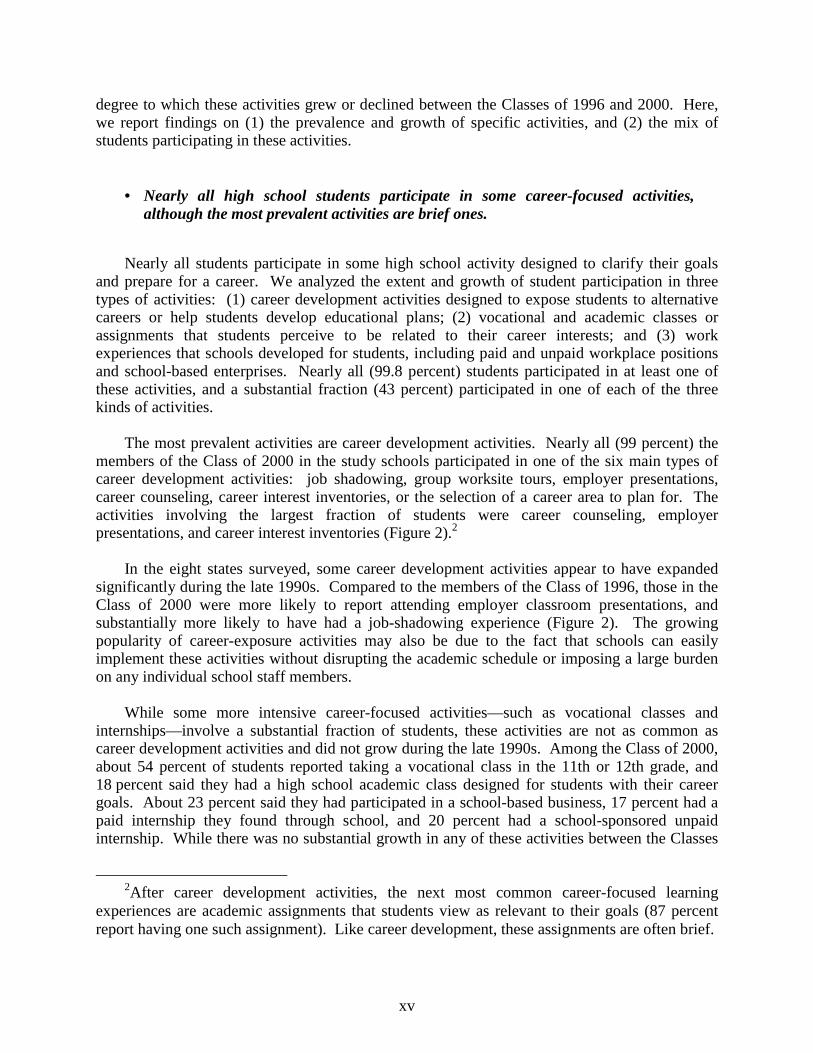
The most prevalent activities are career development activities. Nearly all (99 percent) the
members of the Class of 2000 in the study schools participated in one of the six main types of career development activities: job shadowing, group worksite tours, employer presentations, career counseling, career interest inventories, or the selection of a career area to plan for. The activities involving the largest fraction of students were career counseling, employer presentations, and career interest inventories (Figure 2).2
In the eight states surveyed, some career development activities appear to have expanded
significantly during the late 1990s. Compared to the members of the Class of 1996, those in the Class of 2000 were more likely to report attending employer classroom presentations, and substantially more likely to have had a job-shadowing experience (Figure 2). The growing popularity of career-exposure activities may also be due to the fact that schools can easily implement these activities without disrupting the academic schedule or imposing a large burden on any individual school staff members.
While some more intensive career-focused activities—such as vocational classes and
internships—involve a substantial fraction of students, these activities are not as common as career development activities and did not grow during the late 1990s. Among the Class of 2000, about 54 percent of students reported taking a vocational class in the 11th or 12th grade, and 18 percent said they had a high school academic class designed for students with their career goals. About 23 percent said they had participated in a school-based business, 17 percent had a paid internship they found through school, and 20 percent had a school-sponsored unpaid internship. While there was no substantial growth in any of these activities between the Classes
2After career development activities, the next most common career-focused learning
experiences are academic assignments that students view as relevant to their goals (87 percent report having one such assignment). Like career development, these assignments are often brief.

xvi
FIGURE 2
PARTICIPATION IN CAREER-FOCUSED ACTIVITIESCLASSES OF 1996 AND 2000
26
16
15
87
17
50
43
79
85
78
57
25
23
20
17
87
18
54
47
76
84
82
62
43
0 20 40 60 80 100
School-Based Enterpris e
Unpaid School-A rranged Job/Interns hip
Paid School-A rranged Job/Internship
A cademic A ss ignment Related to Career Interes t
A cademic Clas s Des igned for Students ' Career A rea
Vocational Clas s in 11th or 12th Grade
Selected Career M ajor/A rea to Plan For
Career Interes t Inventory Ques tionnaire
Career Counseling from School Staff
Employer Presentation
Group W ork Site Tour
Job Shadowing
Percentage of Students Participating
Class of 1996 Class of 2000
Career Development Activities:
Career-Focused Classes:
**
*
Source: Eight-State 12th Grade Survey of Classes of 1996 and 2000, Mathematica Policy Research, Inc.
*Difference between Class of 1996 and 2000 is statistically significant at the 5 percent level.**Difference between Class of 1996 and 2000 is statistically significant at the 1 percent level.
Work Experience Activities:

xvii
of 1996 and 2000, a somewhat larger fraction of students reported having more than one unpaid internship, perhaps reflecting efforts by state and federal agencies to promote “service learning” activities. Since unpaid internships tend to be briefer than paid ones, they are often easier to develop and expand and are less likely to interfere with students’ academic studies.
• A diverse mix of students participate in nearly all career-focused activities,
although college-bound students are somewhat more likely than other students to say they received career counseling and somewhat less likely to report taking vocational classes.
Policymakers and educators try to give all groups of students comparable access to career-focused educational activities. Some educators also seek to engage a diverse mix of students in these activities to ensure that stereotypes do not discourage potentially interested students from participating. At least three dimensions of access and diversity are potentially important. First, over the past decade, many educators have sought to design or reconfigure career-focused programs so that they attract not only those who plan to enter the labor market after graduation but also college-bound students. Second, federal vocational education policies encourage schools to find ways of addressing gender-based or racial stereotypes that may impede participation in particular programs. Third, Perkins requires schools to make vocational programs accessible to special populations—including students with disabilities.3
Most career-focused activities appear to attract a diverse mix of students with a broad range
of postsecondary plans. Using the eight-state Class of 1996 and 2000 12th-grade surveys, we examined the extent to which rates of participation in career-focused activities vary by students’ college plans and demographic characteristics. The participation rates for most subgroups were not substantially different from the average for all students, suggesting that schools have engaged a diverse mix of students in most activities. However, we found a few subgroup differences in participation rates with potential policy implications—including differences for groups defined by students’ college plans, disability status, and gender.
While students planning to attend college are somewhat less likely than other students to
participate in vocational classes, they are more likely to recall receiving career counseling. The rates of participation in most career-focused activities do not differ substantially for those who were planning to attend college and those who were not. Consistent with previous findings, a somewhat larger fraction of students who have no plans to enter college said they took a vocational class in their junior or senior year (59 percent) than was the case for students who did have college plans (52 percent). On the other hand, more college-bound students (86 percent) than non-college-bound ones (79 percent) recalled receiving at least some career counseling during high school. These differences may reflect the fact that college-bound students had a
3The other special populations are economically disadvantaged students, foster children,
female or male students preparing for nontraditional occupations, single parents, and displaced homemakers. Our survey did not contain sufficiently large samples of each of these groups to examine each of their participation rates.
xviii
better rapport with staff members who provide career guidance. Some studies suggest that much of the career advice high school guidance staff provide concentrates on planning for college, which might explain why these staff have less contact with students who have no college plans (Rosenbaum 2001). Guidance staff may want to explore new ways to reach students with no postsecondary education plans.
Although students with disabilities were just as likely as other students to participate in most
career-focused activities, their participation in school-sponsored internship programs appears to have declined during the late 1990s. Within the Class of 1996, the fraction of students with disabilities who had participated in a school-sponsored paid internship (22 percent) was significantly higher than that of other students (14 percent). Between the Classes of 1996 and 2000, the internship participation rate of students with disabilities declined (to 9 percent), while the participation rate of other students rose (to 17 percent).4 This trend could reflect the efforts of some schools to remove any perceived stigma associated with internship programs—particularly programs that, in the past, had sought to involve substantial numbers of students with disabilities and other students facing special challenges.
Female students responding to the MPR survey were somewhat more likely than males to
report receiving some career counseling, selecting a career area for the purpose of developing plans, and participating in unpaid internships during high school. These differences in male and female participation rates probably reflect, and perhaps even contribute to, the emerging gender gap in college enrollment. Consistent with the national trends, female respondents were more likely than males to develop plans for attending college and to enroll in college shortly after leaving high school. Career counseling, career planning, and unpaid internships all attract students planning to attend colleges. The larger numbers of females involved in unpaid internships may also reflect that many of these opportunities concentrate on education and health occupations, fields traditionally dominated by young women. Educators and researchers could explore whether, and how, internship programs and guidance staff members could reach out more effectively to male students.
GRADUATES’ ASSESSMENT AND USE OF CAREER-FOCUSED ACTIVITIES
As high school graduates enter postsecondary jobs and education programs, they may realize which skills are useful and which past experiences have been helpful. Although young adults’ views are subjective, they may point to both the value and the limitations of specific high school activities. In addition, students’ actual behavior may indicate ways that specific activities have helped them.
Drawing upon the eight-state follow-up survey, we examined the extent to which graduates
appeared to use their high school career-focused learning experiences. The survey allowed us to examine three ways students valued or made use of these experiences: (1) the extent to which
4While the rate of participation of disabled students within the Class of 2000 appears to be appreciably smaller than that of other students, the difference is not a significant one. However, the participation rate changes between the Classes of 1996 and 2000 are significantly different for disabled and other students.

xix
students viewed specific high school activities as helpful in figuring out what they wanted to do in a career; (2) graduates’ use of college credits earned through high school courses, including credits earned in vocational classes; and (3) how many school-arranged internships led to jobs after high school and the qualitative advantages of these jobs compared to the positions students found in other ways.
• Young adults perceive as helpful in clarifying their goals both workplace activities
providing one-on-one contact with employer staff and career-focused academic and vocational classes.
The eight-state follow-up survey asked students who had participated in specific activities how helpful each of those activities was in “figuring out what you want to do or don’t want to do in a career.” These data should be interpreted with caution because some students may not have known whether they would have chosen the same career goal, had they not participated in a particular activity.
Students rated highly workplace activities that provide one-on-one contacts with employer
staff members. Specifically, 71 percent of students participating in job-shadowing experiences, and 61 percent of those finding a paid job or internship through school reported that these activities were “very helpful” in clarifying their career goals. In contrast, students gave much lower ratings to group worksite tours and school-based enterprises. Thus students appear to feel that individualized workplace experiences are particularly helpful in clarifying their goals. In addition, many students gave high ratings to vocational classes and academic classes designed for students with their career interests. Both career-focused classes and paid internships may allow students to begin to glean whether they enjoy tasks associated with particular careers.
• Many students do not use college credits they earn through high school classes, but
some states are exploring new articulation strategies designed to help more students use these credits
To help students prepare for, and succeed in, postsecondary education, some high schools have been trying to expand opportunities to earn postsecondary credits during high school. Advanced Placement—typically, an academic class designed for high-achieving students planning to enroll in a four-year college—is one of the most common types of high school classes providing postsecondary credits. More recently, educators have sought to expand the range of opportunities to earn college credit during high school. In particular, with support from the federally funded Tech Prep initiative, many high schools and colleges have developed articulation agreements that allow students taking vocational courses to earn credit toward a two-year college degree.
While there is no appreciable growth overall in the fraction of students who earn some
college credit during high school, it appears that high school vocational classes represent a nontrivial fraction of all the credits students earn during high school. About 5 percent of those enrolled in postsecondary education said they had credits recorded on their transcript from high school vocational or technical courses, one-third of the 16 percent who used any credits earned in

xx
high school. This suggests that Tech Prep and related initiatives may have helped some students earn postsecondary credits during high school and may have made it easier for them to complete a postsecondary degree.
Nonetheless, many students appear to have difficulty using credits earned in high school.
The eight-state follow-up survey indicates that about 80 percent of young adults enrolled in at least one postsecondary education program within the first 18 months after high school. Most of these students enrolled in a two- or four-year college program. Even among students who reported that they had taken a high school course offering postsecondary credit and had enrolled in some postsecondary program, only about 43 percent said that those credits had been recorded on their transcript.
One reason many students do not use college credits earned during high school is that often
they can use these credits only in a limited number of local community colleges. However, some states, such as Texas, are trying to help more students use college credits earned in high school by encouraging all two-year colleges in the state to accept credits for specific high school classes. Pursuing these strategies in other states might make it easier for high school students participating in Tech Prep and related programs to enroll and earn a degree in college.
• While few students are employed after high school in jobs they obtain with help
from school staff, these jobs appear to have several advantages over the positions they find in other ways.
Sometimes high school staff try to connect students with employment opportunities or internships that could lead to paid positions after they graduate. Since most students can find some paid work on their own, the value of these efforts often depends upon schools’ ability to help students find positions that are more attractive than the jobs they can find on their own.
Overall, only 4.6 percent of students found their first job out of high school with the help of
high school staff and another 2.8 percent found positions through a postsecondary program. The most common method of finding their first jobs after high school were referrals from family or friends, through the classifieds, or by contacting employers directly.
Although only a fraction of those leaving high school found jobs with help from school staff, these positions appear to have significant qualitative advantages over the positions students found in other ways (Table 1). These positions, while they did not pay higher wages, were more likely to relate to students’ goals, provide training, and offer tuition reimbursement. Moreover, these apparent advantages persist even after one controls for students’ characteristics. However, regression models do not allow us to control for any unobserved differences between students who find jobs with help from school staff and those who find jobs in other ways.5
5For example, if students who find jobs through high school are more motivated and have a
better attitude toward work, then they might get better jobs because of their better attitude, not because they found the job through high school staff.

xxi
TABLE 1
CHARACTERISTICS OF FIRST POSTSECONDARY JOBS: DIFFERENCES BETWEEN POSITIONS FOUND THROUGH SCHOOL AND OTHER POSITIONS
Job Characteristics
First Job Found Through
High School
First Job Found Through
Postsecondary School
First Job Found Through
Other Means
Percentage of Jobs that:
Provide at least some training 70.3 70.0 61.5**
Correspond to career goals 43.1 48.5 23.3**
Helps pay tuition 20.7 14.3 10.2**
Average Hourly Wage $7.40 $7.43 $7.33 Source: Eight-State Follow-up Survey of Classes of 1996 and 1998, Mathematica Policy Research, Inc. Note: This analysis includes only young adults’ first postsecondary job.
**The differences among jobs found through high school, postsecondary school, and other means are
statistically significant at the 1 percent level.
While these findings suggest that some students may benefit from career-related activities in high school, many uncertainties remain. We still do not know which career-focused activities, if any, really help students choose better postsecondary education and jobs. Researchers need to determine the impacts of career-focused activities on students’ ability to enter and succeed in a chosen career, taking into account all preexisting differences between those who participate in these activities and those who do not. In addition, before expanding career-focused activities, educators should consider whether the students who currently make less use of specific activities may not be interested or may face different challenges calling for some distinct approach. Furthermore, high schools clearly have a variety of priorities and demands on their resources, which can limit their capacity to develop or expand career-related activities. Assuming that some of these activities can improve students’ long-term outcomes, schools may still need to make sure that they do not interfere with academic or other activities that are determined to have a greater impact on students’ outcomes. Schools may also need to identify public or private funding sources to help pay for some career-focused activities. Addressing these questions and issues could help more students prepare for productive careers.


1
I. INTRODUCTION
Policymakers have a long-standing interest in helping students formulate career goals and
prepare for successful careers. The federal government has supported career-focused education
programs for nearly a century, beginning with the Smith Hughes Act of 1917. More recently, the
School-to-Work Opportunities Act (STWOA) provided seed grant funding for state and local
career-focused educational reforms between 1994 and 2000. The Carl Perkins Act continues to
provide funding to vocational and career development programs. While federal funding for
career-focused educational activities has declined in real terms over the past 20 years, Perkins
Act funds for vocational and technical programs continue to represent one of the largest federal
expenditures at the secondary level (Silverberg et al. 2002).
As policymakers and educators have concentrated more intensively on increasing students’
academic achievement, some have questioned the value of career-focused education programs.
As policymakers seek to hold students and schools accountable for academic achievement, some
educators have questioned whether substantial resources should be devoted to career-focused
activities unless they clearly contribute to students’ academic achievement. In addition, as
growing numbers of students seek to prepare for college, many have questioned the relevance of
vocational programs that center around careers that do not require a four-year degree.
Indeed, the growth in states’ academic graduation requirements has probably already
contributed to a reduction in some career-focused activities. Between 1982 and 1998, states’
academic reforms, combined with students’ growing interest in preparing for college, contributed
to a 28 percent rise in the average number of academic credits high school students earn and a
15 percent reduction in the average number of vocational credits. As states continue to ratchet

2
up academic graduation requirements, students may have less time to participate in vocational or
other career-focused classes.
Some educators, responding to the increased emphasis on academic achievement and
preparation for college, have sought to modify the structure and objectives of career-focused
programs. While many vocational programs continue to concentrate on occupations that do not
require a two- or four-year college degree, vocational educators increasingly have sought to
expose students to higher-level jobs and prepare students for college. The most recent versions
of the Perkins Act supported efforts to expand vocational programs to serve more college-bound
students. For example, Perkins funds Tech Prep programs designed to prepare high school
students for two-year college programs. In addition, both Perkins and STWOA encouraged
schools to enhance the academic content of technical curricula. Both pieces of legislation also
supported the expansion of career development activities that expose students to alternative
careers—activities typically designed for all students, regardless of their postsecondary plans.
Many important questions remain about the appropriate purpose and design of career-
focused high school learning activities. One key question, which this report does not address, is
how career-focused activities affect students’ postsecondary employment and educational
outcomes.6 Other important questions center on the extent to which schools have sought to make
specific career-focused activities available to students and the extent to which students have
participated in them. Relative rates of growth in specific career-focused activities shed light on
which activities schools expanded and students have found appealing. Still other questions
6The student surveys used for this report were not designed to estimate the impacts of
career-focused activities on student outcomes. In particular, there are not enough data from the surveys to identify a comparison group similar to students who participate in school-to-work activities. Consequently, one cannot precisely estimate how students would have fared had they not participated in school-to-work activities.

3
concern the qualitative features of career-focused programs, such as the extent to which
vocational classes provide opportunities for students to apply academic skills or whether schools’
work experience internships provide more learning opportunities than the jobs students can find
on their own. Finally, without definitive evidence on the impacts of career-focused activities, it
is useful to explore how students value and use career-focused activities.
Purpose and Organization of Report. Drawing upon recent surveys of three cohorts of
students in eight states, this report examines some issues posed by students’ postsecondary
transitions, recent changes in students’ participation in career-focused activities, and how
students perceive the value of these activities. To clarify the nature of the issues students
confront preparing for careers, Chapter II of this report examines the postsecondary outcomes of
the first two cohorts of high school graduates. In Chapter III, we analyze how changes in
educational priorities in the eight states during the late 1990s appear to have affected the extent
of student participation in career-focused learning activities. Chapter IV contains information on
the mix of students who participate in these activities and how this might have changed recently.
In Chapter V, we describe some qualitative features of students’ career-focused classes and
workplace experiences and how specific activities appear to be changing. The sixth and last
chapter of the report examines how graduates perceive the value of various high school activities
in clarifying their career goals and some other ways students appear to draw upon these activities
after they leave school.
Data Sources and Methodology. The primary data sources for this evaluation are surveys
of three cohorts of students in schools covered by eight states’ school-to-work initiatives. These
surveys were part of the Evaluation of School-to-Work Implementation Grants, a study
Mathematica Policy Research, Inc. (MPR) conducted for the U.S. Department of Education. The
eight states the evaluation covered were Florida, Kentucky, Maryland, Massachusetts, Michigan,
4
Ohio, Oregon, and Wisconsin.7 MPR selected a stratified random sample of 69 high schools in
urban, suburban, and rural communities covered by the eight states’ school-to-work initiatives.
Next, students were randomly selected from the Classes of 1996, 1998, and 2000 in these
schools. Each of the three cohorts was interviewed toward the end of the 12th grade, and the
first two cohorts were interviewed again about 18 months after they left high school. Finally,
MPR secured and analyzed transcripts of students who responded to the 12th-grade survey and
whose parents signed consent forms.
Although the student survey data originated from an evaluation of school-to-work
initiatives, the samples include a large, diverse mix of students resembling the overall population
of students in the United States. The analysis sample includes 2,203 students from the Class of
1996; 2,349 from the Class of 1998; and 2,267 from the Class of 2000. The composition of the
sample—including students’ race, gender, and urbanicity—is fairly similar to that of the overall
population of high school students in the United States (Table 1).8
Since the student survey was conducted with representative samples of the entire 12th-grade
population in a wide variety of schools in the eight states, it provides the basis for gauging the
extent and changes in student participation in career-focused activities. Our analysis of the 12th-
grade surveys looks at how many students participate in specific activities, which students
7These states were selected from among the 15 states receiving School-to-Work Implementation grants by fall 1995 that had formed some local partnerships of schools and employers. The eight states were chosen to include diversity in region, urbanicity, and when they received their implementation grant. For more information on the sampling design and sample characteristics, see Hershey et al. 1997.
8The completion rates for the three 12th-grade surveys were 80, 83, and 75 percent, respectively. The follow-up survey sample was made up of students who had completed the 12th-grade questionnaire. Among those students, 81 percent of the Class of 1996 and 80 percent of the Class of 1998 completed the surveys. Schools delivered transcripts for nearly all students providing consent—this represented approximately 80 percent of the students responding to the 12th-grade questionnaire.

5
TABLE 1
COMPOSITION OF EIGHT-STATE 12TH GRADE SURVEY RESPONDENTS AND ALL U.S. 12TH GRADERS
Eight State 12th Grade Survey Respondents Class of
U.S. Class of
1996 1998 2000 2000
By Race
Black 13.7 15.4 12.9 13.5 Hispanic 7.9 7.6 10.5 12.8 White/Other 78.4 76.9 76.6 73.6
By Gender
Female 52.0 50.7 52.4 50.3 Male 48.0 49.3 47.6 49.7
By Urbanicity
Urban 29.1 26.0 30.1 25.7 Suburban 51.1 49.4 49.3 53.1 Rural 19.8 24.6 20.6 21.1
Sources: Eight-State 12th Grade Surveys of Class of 1996, 1998, and 2000; Common Core of
Data School Year 1999-2000, National Center for Educational Statistics.
participate in these activities, and how participation patterns changed between the Classes of
1996 and 2000. In addition, using the follow-up surveys, we examine students’ postsecondary
transitions and how students valued and used specific high school activities during the year and a
half after they left high school.
Most of the analysis is based on cross-tabulations comparing the extent of participation of
specific groups of students at various points in time. We report the results of significance tests
designed to gauge whether the extent of participation is substantially different by subgroup or
cohort. These tests take into account the stratified sample design. In addition, to clarify the
reason for or nature of associations between some key variables, we also report the results of
some multivariate models.

7
II. CAREER CHALLENGES AFTER HIGH SCHOOL
The paths that young adults take as they leave high school reflect some challenges they face
in defining and pursuing career goals. While some people figure out their career goals early in
life, most change their goals as they accumulate work experience. Learning about a career of
potential interest is harder for those who cannot get a job related to any of their interests. As
young adults formulate and refine their career goals, they may need to change their educational
plans accordingly. Young adults who discover that they do not have enough resources or
preparation for postsecondary education programs may need to revise their goals. Educators and
researchers have been concerned about the haphazard ways that some youth prepare for careers.
The ways in which young adults’ postsecondary paths conform to or deviate from their expressed
goals point to challenges they face and needs that schools may be able to address.
This chapter examines the shifting goals of a recent cohort of high school graduates and
their progress toward their goals in the 18 months after high school. Drawing upon the follow-
up surveys MPR conducted in the eight states 18 months after the Classes of 1996 and 1998 left
high school, this chapter attempts to answer four main questions:
1. How do students’ goals change in the 18 months following high school graduation?
2. To what extent do students make progress in achieving their postsecondary educational goals shortly after high school?
3. Which groups of students are making faster or slower progress toward achieving their goals after high school?
4. To what extent do postsecondary jobs appear to match young adults’ career goals or provide the resources needed to help pay for tuition?

8
• Most students changed their career goal or education goal within 18 months of leaving high school.
As young adults continue to explore potential career paths after high school, it is natural that
many of them will change their career and education goals. Many people modify their goals
after they accumulate more work experience and education, learn more about alternative careers
and their own aptitudes, and discover which types of tasks they enjoy performing or learning
about. Some people may not change their career goals but discover that they need to change
their education plans to achieve their desired careers. Some education and career goal changes
are merely refinements of previous goals, while others are more substantial. Changes that
require students to make substantial changes in postsecondary education plans can be costly if
they have already started out on a path that did not prepare them for their new goal.
At the end of 12th grade, most students in our eight-state sample were able to articulate
some career and education goal. Students were asked what job they would like to have in
10 years and how much education that job would require. The most popular fields were
engineering and education (see Table 2). Nine of the 10 most popular careers were in fields that
usually require at least some postsecondary education.9
Reflecting these long-term career ambitions, most students indicate that they need at least
some postsecondary education to achieve their goal. A large majority of these students,
77 percent, indicate that they need at least four years of college to achieve their career goal.10
9The field that might not require postsecondary education is construction.
10This is approximately the same as the high school graduates from 1992 in the National Educational Longitudinal Survey (NELS) cohort. In that survey, 77 percent indicated they needed at least four years of college for the job they expected to have by age 30.

9
TABLE 2
CAREER GOAL POPULARITY IN 12TH GRADE AND 18 MONTHS AFTER HIGH SCHOOL GRADUATION
Field Percent Whose Goal Is in This
Field in 12th Grade
Percent Whose Goal Is in This Field 18 Months
After High School
Engineer 13.0 7.8
Education 10.5 11.4
Psychology 7.7 5.1
Art 7.5 5.4
Medical Doctor 7.4 5.4
Nurse 7.2 10.0
Finance 6.3 5.9
Computer Technology-Related 5.4 5.8
Construction 4.6 4.3
Management 4.6 9.4
Police 4.5 5.1
Medical Technology-Related 4.1 2.0
Journalist 3.6 4.0
Government/Military 2.8 2.2
Attorney/Law 2.7 2.6
Industrial 2.1 2.3
Social Work 2.0 2.1
Sales 1.5 2.0
Administrative 1.2 5.0
Agriculture 0.8 0.7
Self-Employed 0.7 1.5 Source: Eight-State Follow-up Survey of Classes of 1996 and 1998, Mathematica Policy
Research, Inc.

10
About 19 percent indicate that they need an associate’s degree or certificate, and just 4 percent
say that they need at most a high school degree (Figure 1).
Most students change either their career or education goal shortly after high school. About
half of respondents to the eight-state follow-up survey—conducted 18 months after high
school—said that their career goal was different from what it had been at the end of high school.
About half of these students reported an education goal that was different from the one they had
articulated in the 12th-grade survey. In addition, another quarter of students did not change their
career goal but did change their education goal. Thus, about three-quarters of all surveyed
48
11
45
32
0
10
20
30
40
50
60
70
80
90
100
No Postsecondary
Education
Vocational or Trade
School
Some College Four-Year College Masters/PhD
FIGURE 1
POSTSECONDARY EDUCATION GOALSAT THE END OF 12TH GRADE
Postsecondary Goals
Percent of Survey Respondents
Source: Eight-State 12th Grade Survey of Classes of 1996 and 1998, Mathematica Policy Research, Inc.

11
students indicated that they had changed either their career or education goal, with half changing
their career goal, half changing their education goal, and a quarter changing both.11
The mix of specific career goals students articulate 18 months after high school is different
from the mix of goals they articulated at the end of 12th grade. For example, many more
students say they are interested in management or administration, and many fewer articulate
interests in technical careers such as engineering (Table 2). This change may indicate that some
students discover that they are better prepared for fields requiring general skills rather than
technical skills.
Equal numbers of students increase and decrease their estimate of how much education they
need to achieve their goals. Of those who had an education goal at both baseline and followup,
25 percent increased and 26 percent decreased their estimate of how much education they need.
In general, students’ goals are converging over time. That is, students with very low education
goals in high school tend to raise them, while students with very high education goals tend to
lower them.
Some of these changes in education goals may not be problematic. For example, about
37 percent of those who said in 12th grade that they planned to complete some postgraduate
degree changed their mind but still plan to complete a four-year college degree. Since most of
these students still need to complete four years of college, their near-term education plans may
not have changed dramatically.
Other students, however, particularly those who had few postsecondary education plans
during high school, do make more substantial changes in their education goals. At the end of
11Career goal changes are measured by a follow-up survey question that directly asks young
adults if they have changed their career goals. Education goal changes are identified by comparing young adults’ stated education goal in high school to their stated goal 18 months later.
12
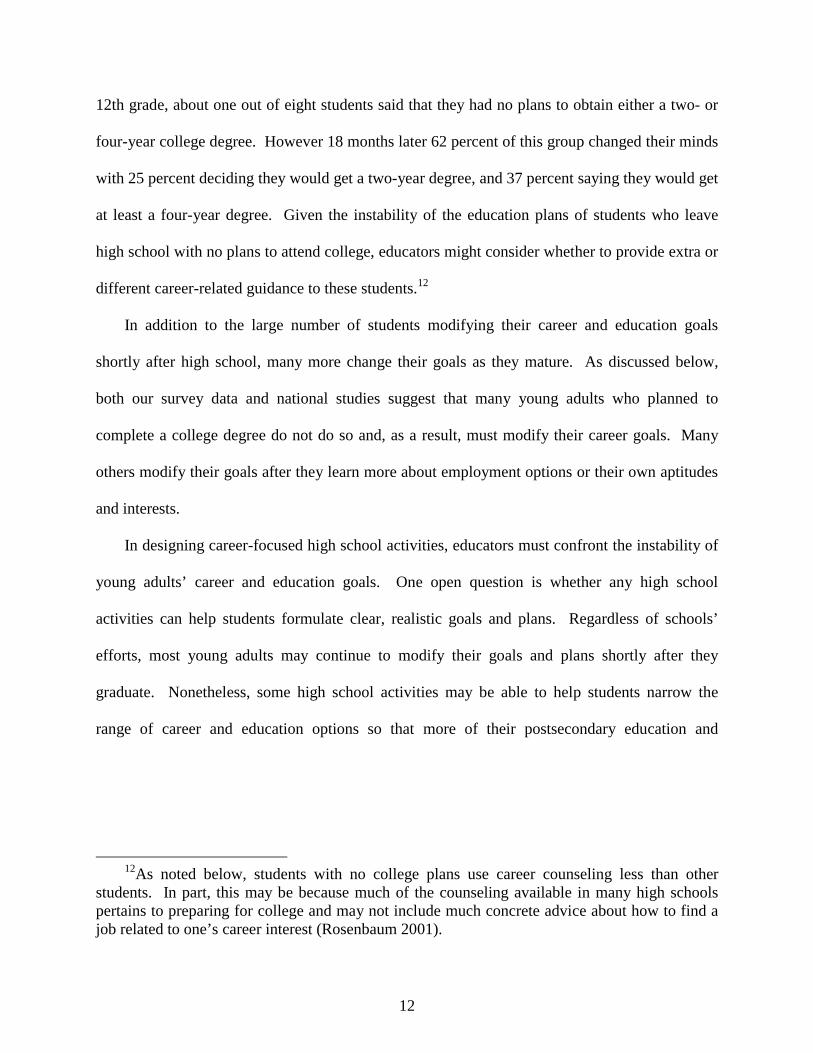
12th grade, about one out of eight students said that they had no plans to obtain either a two- or
four-year college degree. However 18 months later 62 percent of this group changed their minds
with 25 percent deciding they would get a two-year degree, and 37 percent saying they would get
at least a four-year degree. Given the instability of the education plans of students who leave
high school with no plans to attend college, educators might consider whether to provide extra or
different career-related guidance to these students.12
In addition to the large number of students modifying their career and education goals
shortly after high school, many more change their goals as they mature. As discussed below,
both our survey data and national studies suggest that many young adults who planned to
complete a college degree do not do so and, as a result, must modify their career goals. Many
others modify their goals after they learn more about employment options or their own aptitudes
and interests.
In designing career-focused high school activities, educators must confront the instability of
young adults’ career and education goals. One open question is whether any high school
activities can help students formulate clear, realistic goals and plans. Regardless of schools’
efforts, most young adults may continue to modify their goals and plans shortly after they
graduate. Nonetheless, some high school activities may be able to help students narrow the
range of career and education options so that more of their postsecondary education and
12As noted below, students with no college plans use career counseling less than other
students. In part, this may be because much of the counseling available in many high schools pertains to preparing for college and may not include much concrete advice about how to find a job related to one’s career interest (Rosenbaum 2001).

13
employment decisions pay off. If this is true, schools need to identify which activities are most
effective.13
• After high school, many young adults do not enroll in postsecondary programs at rates that match their high aspirations, often for economic reasons.
Previous research suggests that a large fraction of those hoping to complete a college degree
are not successful in doing so and that the expectations of high school students may be
unrealistic in general. For example, tabulations of NELS indicate that, two years after they
graduated, three-quarters of the Class of 1992 believed they needed at least a bachelor’s degree
to achieve their career goal. However, only a third actually earned a B.A. by the year 2000,
when most were about 25 years old.14 The MPR survey data provide a sense of the educational
progress of a more recent cohort of students shortly after graduation and some of the factors that
appear to impede some students’ progress.
As with previous studies, we find that many of the students in our eight-state sample make
slow progress toward attaining their education goals (Figure 2). A year and a half after leaving
high school, 30 percent of survey respondents are not enrolled in, and have not completed, any
postsecondary program, even though nearly all respondents indicated that they need more than a
high school degree to achieve their career goals. The proportion of young adults attending a
four-year college is less than half of the 78 percent who say they need at least a bachelor’s
13See Chapter VI for an analysis of the career-focused activities students find most helpful in
clarifying goals.
14Other studies provide roughly comparable estimates of the fraction of young adults who earn a bachelors degree. Using Current Population Survey data, Wirt (2001) finds that only a third of 25- to 29-year-old high school graduates in 2000 had a four-year college degree. MPR calculated the results for the Class of 1992 using a sample from the NELS. Though these are different data sources, they are both nationally representative and apply to approximately the same cohort of students.

14
1
30
912 12
22
79
36
0
10
20
30
40
50
60
70
80
90
100
No PostsecondaryEducation
Certificate Two-Year College Four-Year College
Goal Enrollment Status
FIGURE 2
YOUNG ADULTS’ POSTSECONDARY GOALS AND ENROLLMENT STATUS18 MONTHS AFTER HIGH SCHOOL
Percent of Survey Respondents
Source: Eight-State Follow-up Survey of Classes of 1996 and 1998, Mathematica Policy Research, Inc.
degree for the career they plan to pursue. Just 36 percent of young adults are enrolled in a four-
year college, and another 22 percent are enrolled in a two-year college. The nationally
representative NELS cohort from the early 1990s shows similar rates of postsecondary
enrollment.15
Many young adults in our sample have already dropped out of postsecondary programs, and
many others have not yet enrolled, even though most still intend to secure additional education.
Approximately 14 percent of those who enrolled in some postsecondary program have dropped
15For example, the NELS indicates that as of 1994, about three-quarters of the Class of 1992
had enrolled in some kind of postsecondary education, which is roughly similar to students in the eight state sample.
15
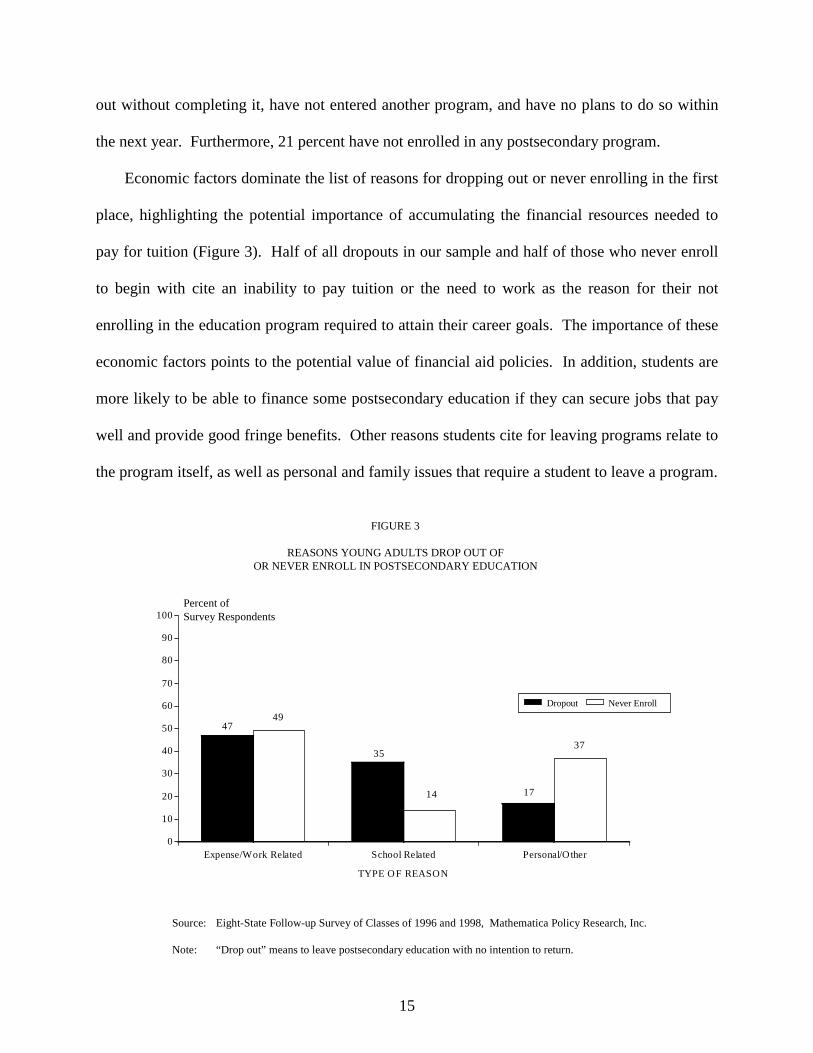
out without completing it, have not entered another program, and have no plans to do so within
the next year. Furthermore, 21 percent have not enrolled in any postsecondary program.
Economic factors dominate the list of reasons for dropping out or never enrolling in the first
place, highlighting the potential importance of accumulating the financial resources needed to
pay for tuition (Figure 3). Half of all dropouts in our sample and half of those who never enroll
to begin with cite an inability to pay tuition or the need to work as the reason for their not
enrolling in the education program required to attain their career goals. The importance of these
economic factors points to the potential value of financial aid policies. In addition, students are
more likely to be able to finance some postsecondary education if they can secure jobs that pay
well and provide good fringe benefits. Other reasons students cite for leaving programs relate to
the program itself, as well as personal and family issues that require a student to leave a program.
4749
35
14 17
37
0
10
20
30
40
50
60
70
80
90
100
Expense/Work Related School Related Personal/Other
TYPE OF REASON
FIGURE 3
REASONS YOUNG ADULTS DROP OUT OFOR NEVER ENROLL IN POSTSECONDARY EDUCATION
Percent of Survey Respondents
Source: Eight-State Follow-up Survey of Classes of 1996 and 1998, Mathematica Policy Research, Inc.
Note: “Drop out” means to leave postsecondary education with no intention to return.
Dropout Never Enroll

16
• Female students’ relatively high rates of postsecondary enrollment reflect differences between female and male students’ career goals.
Many factors shape the educational achievement of specific groups of young adults. These
factors include students’ goals, resources, and academic skills. Educators are particularly
interested in the factors contributing to the educational achievement of two groups: males and
minority students. As a result of the rapid growth in female postsecondary enrollment, female
students now significantly outnumber males in college. Meanwhile, black and Hispanic students
have been less likely to enroll in college for some time. The MPR eight-state survey provides
some new information on the extent to which inter-group differences in postsecondary
enrollment may be related to differences in students’ goals.
The MPR survey indicates that females and males aspire to different types of careers
18 months after they leave high school. Some of the differences reflect long-standing gender
stereotypes. For example, among females, the most popular career fields are education, nursing,
management, and psychology (Table 3). For males, the most popular fields are engineering,
management, construction, and computer technology. However, other differences between
female and male students’ goals are new and more surprising. For example, females are much
more likely than males to aspire to be lawyers and medical doctors. In general, females are more
likely to aspire to white-collar professions that require at least a college degree, while males are
more likely to be interested in careers that require less education.
The differences between male and female students’ education goals are consistent with the
differences in their career goals. Females are more likely than males to seek a four-year degree
or higher. Specifically, 77 percent of females and 71 percent of males want at least a four-year

17
TABLE 3
MALE AND FEMALE YOUNG ADULTS’ CAREER GOALS 18 MONTHS AFTER HIGH SCHOOL GRADUATION
Career Goal Percent of Males with Goal Percent of Females with Goal
Engineer 12.6 3.7
Management 10.0 8.9
Computer Technology-Related 9.0 3.0
Construction 9.0 0.3
Police 7.3 3.3
Education 6.2 15.8
Art 6.0 5.0
Industrial 4.6 0.4
Journalist 4.5 3.5
Finance 4.3 7.3
Government/Military 4.0 0.8
Medical Doctor 3.8 6.8
Administrative 3.8 6.0
Nurse 3.1 15.8
Self-Employed 2.5 0.6
Attorney/Law 2.3 2.9
Sales 2.2 1.8
Psychology 2.1 7.6
Social Work 1.5 2.6
Agriculture 0.8 0.7
Medical Technology-Related 0.5 3.2 Source: Eight-State Follow-up Survey of Classes of 1996 and 1998, Mathematica Policy
Research, Inc.

18
degree.16 This gap in education aspirations is primarily due to the differences in educational
requirements between career fields, with only small differences in education aspirations between
males and females within a given career field.17 In other words, the education gender gap
appears to be largely due to male prevalence in such noncollege fields as construction and female
prevalence in such college-bound fields as education, not to females seeking more education than
their male counterparts in the same field.
A gender gap also exists in postsecondary enrollment. Eighteen months after high school,
73 percent of females are enrolled in, or have completed some form of, postsecondary education,
compared to only 66 percent of males. This gender gap is largely due to the large difference in
college enrollment: 39 percent of females were enrolled in a four-year college 18 months after
high school, compared to only 32 percent of males. Other national surveys have found similar
gender gaps in postsecondary enrollment.
A large difference does not exist in the education goals of white and minority students, but
there is a significant difference in these groups’ postsecondary enrollments. While minority
students responding to MPR’s eight-state survey were slightly less likely than white students to
believe they needed a college education to achieve their career goal, these differences are not
16The difference between white females and males was much smaller in NELS94. Of
females, 78.4 percent expect to obtain at least a four-year degree, compared to 76.1 percent of males. This may suggest a widening gap between males and females across time, since the NELS survey was conducted in the early 1990s, while the eight state school-to-work surveys were conducted in the late 1990s.
17A regression of a college indicator variable on a female indicator variable without including occupation goal indicator variables yielded a coefficient on female that was significant at the 1 percent level and an R2 of 0.0056. Including occupation indicator variables in the regression eliminated the significance of the female variable (a p-value of 0.932) and increased the R2 to 0.1747. This suggests that the difference between male and female students’ occupational goals drives much of the difference in their education goals.

19
statistically significant.18 However, there is a significant difference between minority and white
respondents’ postsecondary enrollments. Only 63 percent of black students and 65 percent of
Hispanic students were enrolled in a postsecondary program 18 months after high school,
compared to 71 percent of white students. The largest differences are in the rates of enrollment
in four-year colleges. Only 28 percent of blacks and 23 percent of Hispanics enrolled in a four-
year college 18 months after high school, compared to 39 percent of whites.
• Most students do not obtain jobs that relate to their career goals or that provide substantial resources for postsecondary education.
Students’ jobs after high school can represent important steps in refining and pursuing their
career goals. Students’ ability to secure useful labor market experience in a field of potential
interest can be particularly important for those who are not making progress toward their career
goals through education. Whether or not students are enrolled in educational programs,
employment can be helpful in developing basic and technical skills, learning more about a field
related to a career goal, and accumulating the resources they can use to pay tuition. Here,
drawing upon MPR’s eight-state follow-up surveys, we examine some of the basic
characteristics of the current job students held at the point when the survey was conducted, about
18 months after they left high school.
Though nearly all young adults find some employment after high school, most appear to
have difficulty finding jobs that correspond to their career goals. Ninety-eight percent of young
adults have at least one paid job in the 18 months after high school, and 87 percent were
18About 75 percent of white students believe they need at least four years of college—a
percentage only slightly higher than that of blacks (71 percent) and Hispanics (72 percent). However, these differences in education goals by students’ race are not significant at the 5 percent level.

20
employed at the time of the follow-up survey. However, about 71 percent of young adults who
are employed 18 months after high school report that their job is in a different field than their
career goal. Though young adults who are not enrolled in any postsecondary program are more
likely to have a job in their career field than those who are enrolled, the majority of both groups
do not (Table 4).
Though a majority do not have jobs in their career field, most do receive at least some
training on the job. Two-thirds of all young adults get at least some training from their
employer, with about a fifth spending at least half their time on the job in training. Students who
are not enrolled in postsecondary education are more likely to report that they spent at least half
TABLE 4
CHARACTERISTICS OF POSTSECONDARY JOBS BY POSTSECONDARY ENROLLMENT
Job Characteristic Overall Not Enrolled in
Postsecondary Education Enrolled in Two-
Year College Enrolled in Four-
Year College
Average Hourly Wage $7.76 $8.25 $7.66 $7.17 Average Hours Worked per Week 30 39 30 21 Percent Receiving the Following Benefits:
Tuition reimbursement 19 28 21 9 Health insurance 45 65 47 20 Paid vacation 38 56 39 18 Retirement plan 27 42 26 11
Percent Whose Job Is in the Same Field as Career Goal 29 35 30 22 Percent of Time Spent in Training on the Job:
No training 33 30 39 33 Some but less than half time
in training 46 44 42 50 At least half time in training 21 26 19 17
Source: Eight-State Follow-up Survey of Classes of 1996 and 1998, Mathematica Policy Research, Inc.

21
their time at the workplace in training. However, it is not clear whether this training has value
beyond the context of this particular job.
As one might expect, given their lack of work experience, the pay and benefits of most
students’ jobs are fairly modest (Table 4). Whether or not students are enrolled in school, their
earnings are typically low: employed students earn, on average, $7.76 per hour (about $233 per
week). Among young adults who are employed 18 months after high school, those not currently
enrolled in an education program work on average 39 hours per week for $8.25 an hour, while
students enrolled in a B.A. program work an average of 20 hours per week for $7.17 an hour.
Most students do not have many fringe benefits, and only 19 percent receive tuition
reimbursement benefits.19 With these modest earnings, it is understandable why many young
adults report some difficulty financing postsecondary education without substantial support from
parents, scholarships, or loans. In summary, young adults are often uncertain of their goals, and
many are making slow progress toward achieving them. A key question remains concerning the
activities and experiences that can feasibly help more students to clarify their goals and enter
postsecondary programs or jobs that are consistent with those goals. Next, we examine some of
the high school activities designed to achieve these objectives and the extent to which students
participate in them.
19Ironically, employed young adults enrolled in postsecondary programs are less likely to
have this fringe benefit than those who are employed but not enrolled in any educational program, perhaps because they are also less likely to work full-time (Table 3).


23
III. STUDENT PARTICIPATION IN CAREER-FOCUSED LEARNING ACTIVITIES
Most high schools seek to help students begin to define career goals and prepare to achieve
them. Schools do this by offering students career-focused learning opportunities, including
career counseling, vocational and academic classes that center on particular careers, and
internships and other work experience opportunities. Many factors affect how much students
participate in these activities. These factors include the activities available, students’ awareness
and perceptions of particular activities, and competing demands on students’ time.
Shifting educational policies and priorities can affect the extent to which students participate
in career-focused learning activities. During the 1990s, some federal policies, including Perkins
III and STWOA, provided support to states seeking to enhance and expand career-focused
learning activities. These policies had the potential to expand student participation in some
career-focused activities. During the same period, however, many states also began pursuing
academic reforms that had the potential to shift attention away from career-focused education.
For example, some states increased the number of academic courses required for high school
graduation, leaving less time for vocational courses. Some schools have sought to reconfigure
career-focused learning opportunities to better complement the new academic requirements.
Others have sought to incorporate career-focused learning opportunities into academic courses.
The types of student activities that have grown and declined reflect, to a large degree, the ways
educators have sought to reconcile schools’ academic and career-focused objectives.
Drawing on the MPR 12th-grade surveys for two cohorts of students, we examine the extent
to which students have participated in specific career-focused activities and changes in these
participation patterns over time. We examine the scale of participation in activities among
students in the high school Classes of 1996 and 2000 in the schools MPR’s eight-state student

24
survey covered. Since these data are based on student surveys, they reflect students’ memories
and experiences of high school. The trends they reveal may differ from those based on school
administrative records or other sources. The rest of this chapter is organized around an analysis
of the extent and growth of student participation in the three main types of activities that Perkins
and STWOA have sought to expand and enhance:
1. Career Development Activities, including career exposure activities such as job shadowing, career counseling, and other career-planning activities
2. Classes Related to Students’ Career Interests, including both vocational classes and academic classes that students perceive as related to their career interests
3. Work Experiences Sponsored by Schools, including paid and unpaid internships that schools arrange, as well as participation in school-based enterprises
• Activities designed to expose students to careers are prevalent and expanded.
Schools offer students two main types of career development learning experiences:
(1) career exposure, and (2) career-planning activities. Career exposure activities provide
students with information about alternative careers. These activities can include employer
presentations in the classroom, group tours of workplaces, and job shadowing, where students
follow an employee around a workplace. Career-planning activities seek to help students
formulate or clarify their goals and figure out how to achieve them. These activities may include
career counseling, completing questionnaires or essays related to students’ interests and plans,
and choosing a career area for selecting high school classes or developing postsecondary plans.
Most of the Class of 1996 in the study schools participated in some career exposure and
career-planning activities during high school. More than three-quarters of these students
reported attending an employer presentation during high school (Figure 4). Most students also

25
43
79
85
78
57
25
47
76
84
82
62
43
0 10 20 30 40 50 60 70 80 90
Selected Career Major/Area to Plan For
Career Interest Inventory Questionnaire
Career Counseling from School Staff
Employer Presentation
Group Worksite Tour
Job Shadowing
Percentage of Students Participating
Class of 2000
Class of 1996Planning Activities:
Career Exposure Activities:
FIGURE 4
PARTICIPATION IN CAREER DEVELOPMENT ACTIVITIESCLASSES OF 1996 AND 2000
*
**
Source: Eight-State 12th Grade Survey of Classes of 1996 and 2000, Mathematica Policy Research, Inc.
*Difference between Class of 1996 and 2000 is statistically significant at the 5 percent level.**Difference between Class of 1996 and 2000 is statistically significant at the 1 percent level.
received some career counseling from school staff, completed a career interest inventory
questionnaire, and went on at least one group worksite tour.
During the late 1990s, a growing fraction of students participated in career exposure
activities, perhaps in part because of national efforts to promote job shadowing and similar
activities. Compared to the Class of 1996, the Class of 2000 was more likely to report attending
employer classroom presentations and substantially more likely to have had a job-shadowing

26
experience (Figure 4). The growth in job shadowing during the late 1990s may reflect the
creation of National Job Shadowing Day in 1998 and the subsequent promotional activities of the
National Job Shadowing Coalition.20 The growing popularity of career exposure activities may
also be due to the fact that schools can easily implement these activities without disrupting the
academic schedule or imposing a large burden on any individual school staff members.
While career exposure activities grew, career-planning activities did not (Figure 4). Despite
some efforts by state career development staff to expand these activities during the late 1990s,
participation rates for the Class of 2000 students were roughly comparable to those of the Class
of 1996. Three factors may have impeded efforts to expand these activities. First, planning
activities often take a substantial amount of staff time to plan or implement. For example, to
administer a career interest inventory or provide career counseling, schools often must hire or
train new staff. Second, the growth of high school academic requirements has left less room for
students to select classes based on their interests. As a result, some parents and school staff
members may place less value on encouraging students to formulate career goals that affect their
choice of high school classes. Third, some advocacy groups opposed career-planning activities,
particularly activities that encourage students to select high school classes based on a stated goal.
Some of these groups voiced fears that schools might use career-planning activities to
pigeonhole students and persuade them to take narrow vocational courses. These types of
concerns may have led some schools to scale back career-planning activities or to reconfigure
them so that they focused on career exposure rather than planning.
20The National Job Shadowing Coalition promotes job shadowing to students, schools, and
employers. The Coalition is currently supported by staff from three main organizations—America’s Promise, Junior Achievement, and the U.S. Department of Labor—and funding from Monster.com and the News Corporation.

27
• A large and growing fraction of students said they completed academic assignments related to students’ career interests.
High school students can learn more about a career of potential interest by taking a relevant
class or working on relevant school assignments. Vocational classes have traditionally provided
the most intensive opportunities for students to learn about a specific occupation or industry.
Academic classes can also provide opportunities to learn about careers. Academic teachers can
ask students to research a career or complete tasks that are similar to those performed by adults
employed in a particular occupation. In some cases, students can select an entire academic
course that they perceive to be relevant to their career interest. The student survey included
questions on whether students (1) at some point during high school took an English, Math, or
Science class designed for students with their career interest; (2) during 11th or 12th grade
worked on academic assignments that related to a career interest; or (3) took a vocational class
during one of these two grades.
The student surveys suggest that many students work on academic assignments related to a
career interest. Even among the Class of 1996, 60 percent said that their English teachers asked
them to write essays or make presentations related to a career of interest in 11th or 12th grades
(Figure 5). In addition, 61 percent of students reported that, in an 11th or 12th grade math class,
they used math “to solve problems that were related to a job or career” that interested them. Just
under half reported working on a science problem related to a career.
When students reported taking an entire class centered on careers, this most commonly was
a vocational class rather than an academic one. About half of all students reported taking a
vocational or technical class that concentrated on a specific occupation. Only about 17 percent
reported taking an entire English, Math, or Science class that was specifically designed for
students with their interest (Figure 5). Moreover, this group probably includes many students
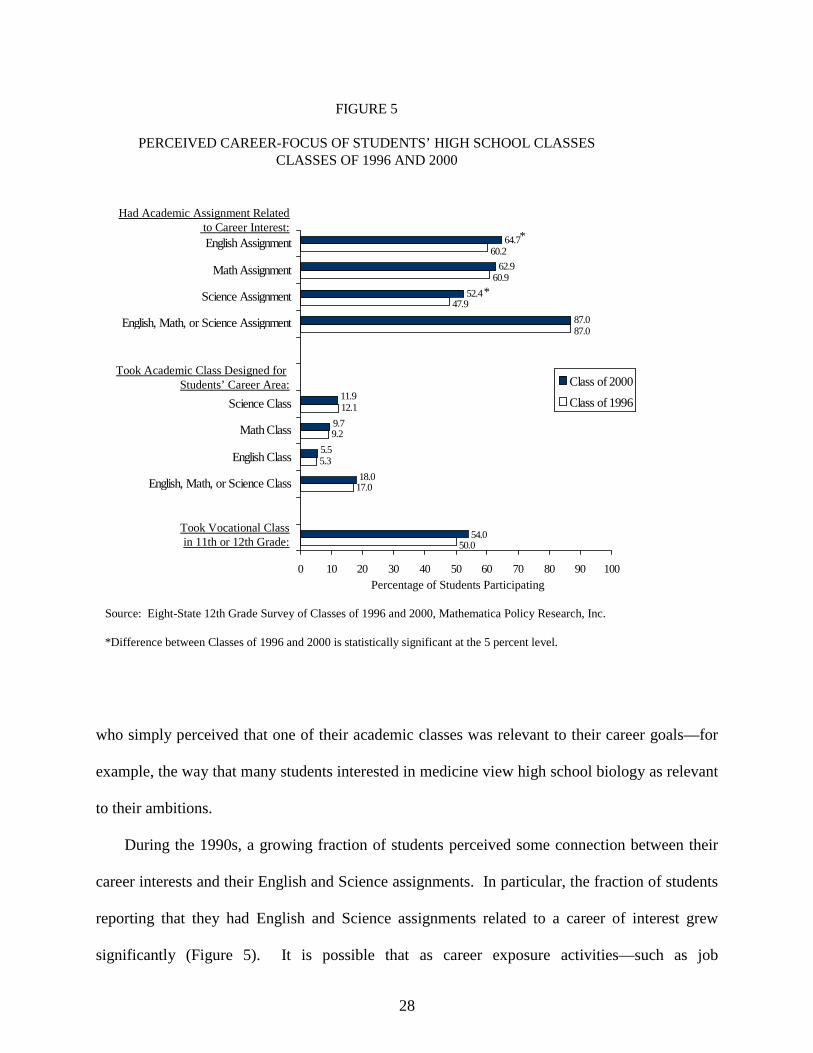
28
17.0
5.3
9.2
12.1
87.0
52.4
62.9
64.760.2
60.9
47.9
87.0
50.0
11.9
9.7
5.5
18.0
54.0
0 10 20 30 40 50 60 70 80 90 100
English, Math, or Science Class
English Class
Math Class
Science Class
English, Math, or Science Assignment
Science Assignment
Math Assignment
English Assignment
Class of 2000
Class of 1996
Took Academic Class Designed for Students’ Career Area:
Had Academic Assignment Relatedto Career Interest:
FIGURE 5
PERCEIVED CAREER-FOCUS OF STUDENTS’ HIGH SCHOOL CLASSESCLASSES OF 1996 AND 2000
*
*
Took Vocational Classin 11th or 12th Grade:
Percentage of Students Participating
Source: Eight-State 12th Grade Survey of Classes of 1996 and 2000, Mathematica Policy Research, Inc.
*Difference between Classes of 1996 and 2000 is statistically significant at the 5 percent level.
who simply perceived that one of their academic classes was relevant to their career goals—for
example, the way that many students interested in medicine view high school biology as relevant
to their ambitions.
During the 1990s, a growing fraction of students perceived some connection between their
career interests and their English and Science assignments. In particular, the fraction of students
reporting that they had English and Science assignments related to a career of interest grew
significantly (Figure 5). It is possible that as career exposure activities—such as job

29
shadowing—became more common in the study schools, English teachers saw more
opportunities to encourage students to reflect upon what they learned about careers during these
activities. The growth in science assignments that students perceive to be related to their career
interests could reflect a shift in students career interests or greater efforts on the part of science
teachers to assign problems that are relevant to students interests.21
There was no appreciable change in the fraction of students reporting that they had taken a
vocational or academic class centered around a specific career interest. Efforts to encourage
students to select classes based on their career interests may have been offset by the growth of
state academic graduation requirements, which gave students less discretion about which classes
they take. While students may have somewhat less choice about which courses they take, it
appears that they are taking advantage of the remaining flexibility in their schedule to continue to
take at least some courses related to career interests.22
• The fraction of students with school-sponsored work experiences has not changed appreciably, although more students have multiple unpaid internships.
School-sponsored internships or other work activities have the potential to help students
obtain concrete information about career options while accumulating useful work experience and
becoming acquainted with workplace norms and expectations. Some internships can also
provide an opportunity to apply skills learned in the classroom. Co-op jobs, one of the most
21In addition, about half of the increase in science assignments related to careers is driven by
the rise in the fraction of students taking at least one science class during the last two years of high school; the rest of the increase is due to growth in career-related assignments among those who took Science.
22National data suggest that, between 1992 and 1998, there was no change in the average number of vocational credits earned by high school students (4.0 credits). However, since the average number of academic credits grew (from 23.9 to 25.2 credits), vocational courses’ percentage share declined slightly (Silverberg et al. 2002).

30
well-established types of internship programs, are typically designed to complement students’
curriculum at school. While paid internships vary in intensity and duration, unpaid internships
tend to be brief.23 Students can also develop entrepreneurial and other skills by participating in a
school-based business that markets products to students, school staff members, or others. In
Chapter VI, we examine the quality of the paid and unpaid internships students obtain through
school. Here, we analyze the prevalence and growth of these activities.
A large fraction of students report participating in some kind of school-sponsored work
activity during high school. Approximately half of the Class of 1996 said they worked in a
school-based enterprise or obtained a paid or unpaid internship with the help of school staff.
About 26 percent of students worked in a school-based enterprise, the most common activity
(Figure 6).24 A substantial fraction of students reported obtaining a paid internship (16 percent)
or unpaid internship (16 percent) with the help of school staff. Most of these internships were
concentrated during the last two years of high school.
Between the Classes of 1996 and 2000, there was no appreciable change in the fraction of
students participating in school-sponsored work activities. The percentage of students who
obtained jobs or internships with help from school staff was approximately the same for the
Classes of 1996 and 2000 (Figure 6). There was no significant change in the extent to which
students participated in school-based enterprises.25
23The student survey indicates that most unpaid internships last less than four weeks and
requires students to be at a workplace for less than eight hours per week.
24These enterprises were most often a school store, restaurant, or bank, or were related to the production and sale of a yearbook.
25Note, however, that the fraction of students who ever had any type of paid work experience declined, and nearly all of this decline was among those who found their own paid position. Hence, among the group of students who reported having some paid position during high school, the fraction finding that position through school rose (not shown in figure). Most of
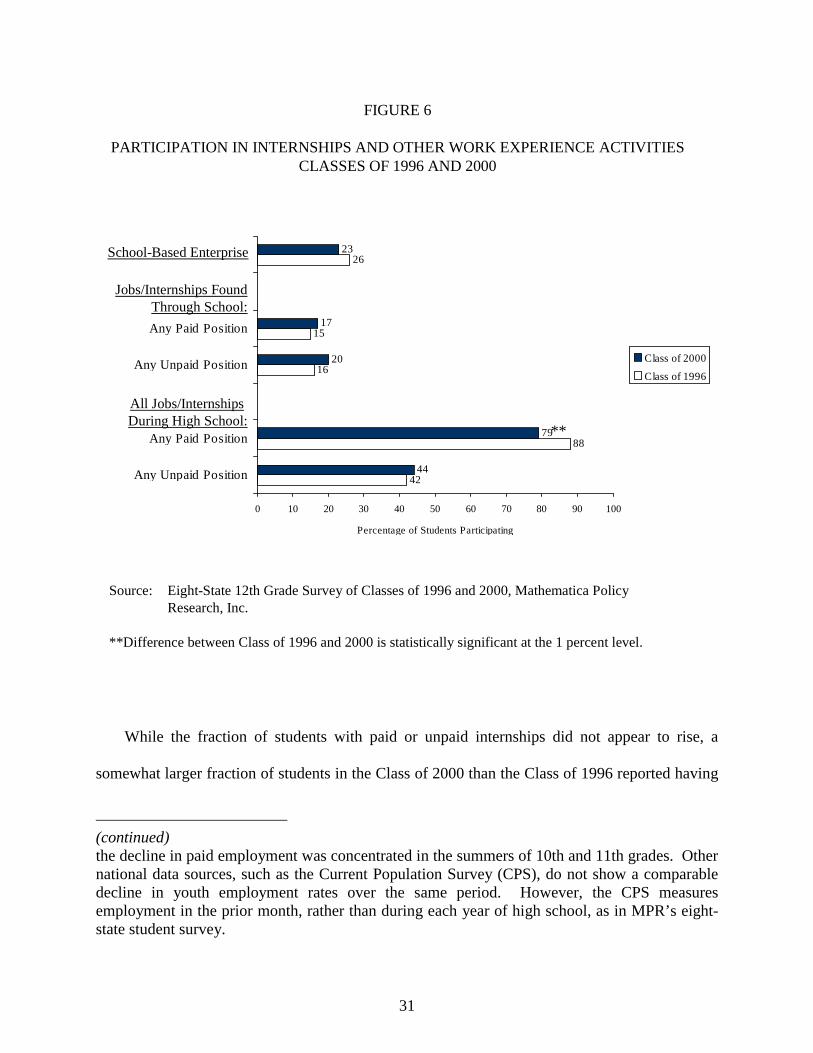
31
42
88
16
15
26
44
79
20
17
23
0 10 20 30 40 50 60 70 80 90 100
Any Unpaid Position
Any Paid Position
Any Unpaid Position
Any Paid Position
Percentage of Students Participating
Class of 2000
Class of 1996
FIGURE 6
PARTICIPATION IN INTERNSHIPS AND OTHER WORK EXPERIENCE ACTIVITIESCLASSES OF 1996 AND 2000
**
All Jobs/Internships During High School:
Jobs/Internships FoundThrough School:
Source: Eight-State 12th Grade Survey of Classes of 1996 and 2000, Mathematica PolicyResearch, Inc.
**Difference between Class of 1996 and 2000 is statistically significant at the 1 percent level.
School-Based Enterprise
While the fraction of students with paid or unpaid internships did not appear to rise, a
somewhat larger fraction of students in the Class of 2000 than the Class of 1996 reported having
(continued) the decline in paid employment was concentrated in the summers of 10th and 11th grades. Other national data sources, such as the Current Population Survey (CPS), do not show a comparable decline in youth employment rates over the same period. However, the CPS measures employment in the prior month, rather than during each year of high school, as in MPR’s eight-state student survey.

32
more than one unpaid internship. About 4.0 percent of the Class of 2000 reported having an
unpaid internship during more than one grade or summer, compared to only 1.8 percent of the
Class of 1996. Although internships continued to be concentrated toward the end of high school,
a growing fraction of students reported also having some unpaid experience during 9th or 10th
grade (Figure 7).
The expansion of unpaid internships during the early grades of high school may reflect
efforts by state and federal agencies to promote “service learning” activities—unpaid or
volunteer activities designed to develop civic skills and complement some part of the school’s
curriculum. The federal Learn and Serve program sponsored by the Corporation for National
Community Service expanded its efforts to promote community service among high school
students.26 Maryland—one of the eight states covered by MPR’s survey—now requires students
to perform some type of service learning during high school. The growth in the number of years
in which students have unpaid internship experiences suggests that these promotional efforts may
be engaging students somewhat earlier. However, these efforts did not seem to appreciably
expand the total fraction of students who ever have unpaid internships.
Expanding unpaid internships is probably easier for school staff than developing more paid
internships, since the former tend to be briefer and easier to schedule and monitor. Most school-
sponsored unpaid internship involve less than 8 hours per week at a worksite, considerably less
than the average school-sponsored paid internships, most of which require students to spend
more than 16 hours a week at a workplace. Given the growth in states’ academic requirements,
students may have difficulty finding enough time to devote to paid internships. Moreover, given
26One study indicated substantial growth in both high school and college service programs
from 1984 through 1997 and even faster growth in service learning programs linked to the curriculum (Shumer and Cook 1999).
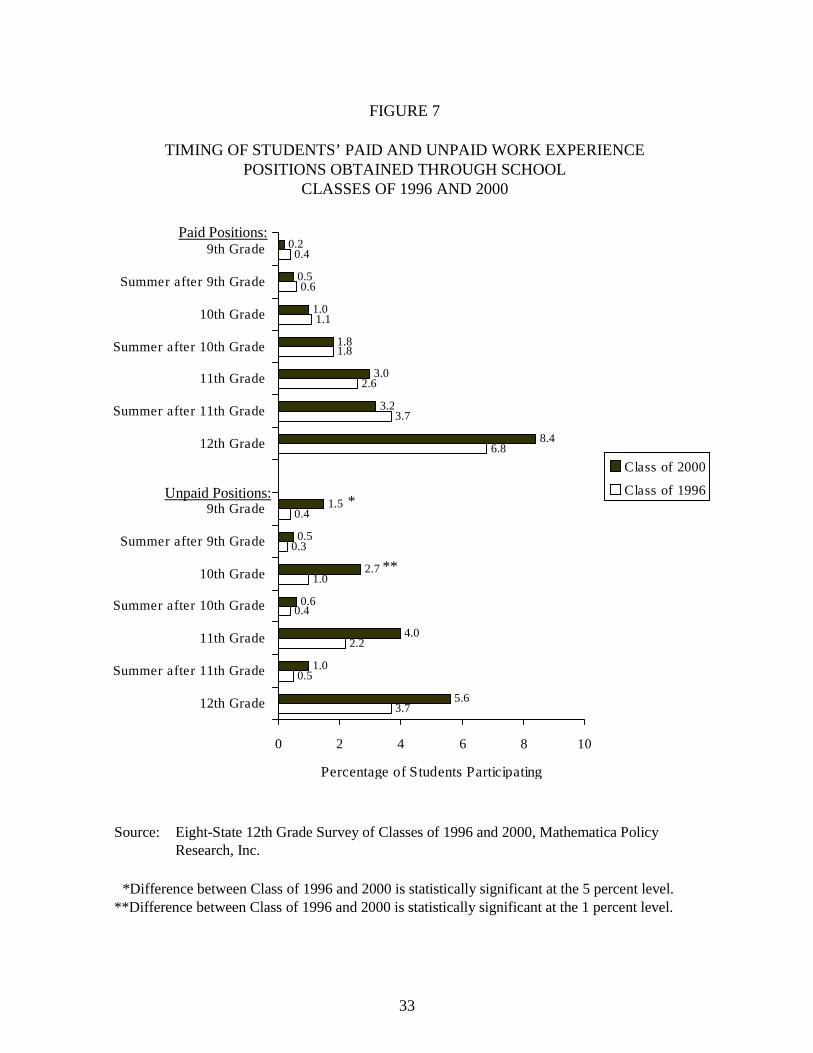
33
3.7
0.5
2.2
0.4
1.0
0.3
0.4
6.8
3.7
2.6
1.8
1.1
0.6
0.4
5.6
1.0
4.0
0.6
2.7
0.5
1.5
8.4
3.2
3.0
1.8
1.0
0.5
0.2
0 2 4 6 8 10
12th Grade
Summer after 11th Grade
11th Grade
Summer after 10th Grade
10th Grade
Summer after 9th Grade
9th Grade
12th Grade
Summer after 11th Grade
11th Grade
Summer after 10th Grade
10th Grade
Summer after 9th Grade
9th Grade
Percentage of Students Participating
Class of 2000
Class of 1996
FIGURE 7
TIMING OF STUDENTS’ PAID AND UNPAID WORK EXPERIENCEPOSITIONS OBTAINED THROUGH SCHOOL
CLASSES OF 1996 AND 2000
Paid Positions:
Unpaid Positions: *
**
Source: Eight-State 12th Grade Survey of Classes of 1996 and 2000, Mathematica PolicyResearch, Inc.
*Difference between Class of 1996 and 2000 is statistically significant at the 5 percent level.**Difference between Class of 1996 and 2000 is statistically significant at the 1 percent level.

34
unpaid internships’ brief duration and employers’ relatively low expectations, school staff do not
need to spend as much time monitoring unpaid internships as they do paid ones. A key challenge
remains creating unpaid internships that provide substantial learning opportunities—including
opportunities to learn about alternative careers—an issue we discuss in Chapter VI.

35
IV. MIX OF STUDENTS PARTICIPATING IN CAREER-FOCUSED ACTIVITIES
The federal legislation that has funded career-focused educational activities encourages
schools to provide all students with access to these activities. The Perkins 1998 legislation,
which provides funding to vocational and career development activities, requires states to ensure
that these activities are accessible to a variety of student populations. Similarly, the STWOA
encouraged schools to make career-focused activities available to all students.
At least four dimensions of access and diversity are important to educators. First, during the
past decade, many educators have sought to design or reconfigure career-focused programs so
that they attract not only those who plan to enter the labor market after graduation but also
college-bound students. Second, federal vocational education policies encourage schools to find
ways to overcome any racial or gender-based stereotypes that impede participation in particular
programs. Third, the Perkins vocational education legislation requires states to make programs
available to diverse students. States must report their success engaging special populations of
students—including students with disabilities.27 Finally, recognizing that low population
densities or depressed local economies sometimes make it harder for schools to offer students
workplace activities or other career-focused learning experiences, both Perkins and STWOA set
aside funds for programs in rural and depressed urban areas.
By examining the actual pattern of student participation in career-focused activities, one can
identify which segments of the student population have been attracted to specific activities. Our
27The other special populations are economically disadvantaged students, foster children,
female or male students preparing for nontraditional occupations, single parents, and displaced homemakers. Our survey did not contain sufficiently large samples of these groups to examine their participation rates.

36
analysis concentrates on groups defined by five variables: (1) students’ postsecondary education
plans, (2) gender, (3) race, (4) disability, and (5) the urbanicity of the student’s community.
• High school students with college plans are as likely as other student to participate in most activities but are somewhat less likely to take vocational classes and more likely to recall receiving career counseling.
While some career-focused programs, such as traditional vocational programs, are designed
primarily to prepare students for careers that do not require a college degree, other activities seek
to benefit a broader population. Previous national studies document that students who have no
plans for attending college are more likely than other students to take vocational courses
(Agodini et al. 2002).28 Some other career-focused activities—such as job shadowing and other
forms of career development—are designed to reach a broader cross-section of students.
Participation rates in many career development activities are high, suggesting that they may
attract students with diverse postsecondary education plans.
Overall, the rates of participation in most career-focused activities do not differ substantially
for the students who are and are not preparing for college, suggesting that it is feasible to engage
both in these activities (Tables 5, 6, and 7). Similarly, there are no substantial differences in
participation rates for students who completed a college-prep curriculum and those who did not.
Despite the fact that students preparing for college often have busy academic schedules, they are
clearly able to participate in career-focused activities.
28Using the national NELS survey data for the Class of 1992, Agodini et al. (2002) found
that this association between vocational classes and students’ college plans persists even after they controlled for students’ grades, socioeconomic background, and other background characteristics.

37
TA
BL
E 5
PA
RT
ICIP
AT
ION
IN
CA
RE
ER
DE
VE
LO
PM
EN
T A
CT
IVIT
IES
BY
ST
UD
EN
T S
UB
GR
OU
P
Jo
b Sh
adow
or
Wor
ksite
Tou
rs
R
ecei
ved
Car
eer
Cou
nsel
ing
Se
lect
ed C
aree
r A
rea
C
lass
of
1996
C
lass
of
2000
C
hang
e
Cla
ss o
f 19
96
Cla
ss o
f 20
00
Cha
nge
C
lass
of
1996
C
lass
of
2000
C
hang
e
All
Stud
ents
61
.5
70.2
8.
7
85.4
84
.0
-1.4
43.4
46
.9
3.5
Pla
ns to
Att
end
Col
lege
Aft
er H
igh
Scho
ol
H
ave
plan
s 59
.5**
69
.6
10.1
87.3
**
85.9
**
-1.4
39.4
43
.8
4.4
Hav
e no
pla
ns
66.2
71
.3
5.1
82
.0
79.3
-2
.7
45
.6
48.4
2.
8 C
ompl
eted
Col
lege
Pre
p C
urri
culu
m
C
ompl
eted
56
.5**
66
.5
10.0
89.6
85
.6
-4.0
46.9
48
.3
1.4
Did
not
com
plet
e 67
.1
71.5
4.
4
84.5
84
.4
-0.1
42.9
46
.4
3.5
Rac
e/E
thni
city
Afr
ican
Am
eric
an
61.2
74
.4
13.2
87.6
83
.5
-4.2
51.1
61
.7**
10
.5
His
pani
c 55
.8
72.1
16
.3
82
.9
86.1
3.
1
38.0
42
.8
4.8
Whi
te/O
ther
62
.3
69.4
7.
1
85.5
83
.8
-1.6
43.0
45
.2
2.2
Gen
der
M
ale
61.3
67
.5
6.2
83
.9*
81.5
**
-2.3
35.1
**
43.4
* 8.
3*
Fem
ale
61.7
72
.8
11.1
86.8
86
.3
-0.4
51.0
50
.2
-0.8
D
isab
ility
Has
dis
abili
ty
60.5
70
.0
6.5
86
.1
82.3
-3
.9
39
.0
47.7
8.
7 D
oes
not
61.6
69
.8
8.2
85
.3
84
-1.3
43.9
47
.3
3.4
Urb
anic
ity
U
rban
53
.2**
67
.9**
14
.7
84
.6
81.4
**
-3.2
38.7
49
.1*
10.4
Su
burb
an
62.1
65
.2
3.1
85
.3
83.3
-2
.1
41
.5
41.3
-0
.2
Rur
al
72.5
85
.4
13.0
86.7
89
.5
2.8
55
.2
57.0
1.
8 So
urce
: E
ight
-Sta
te 1
2th
Gra
de S
urve
y of
Cla
sses
of
1996
and
200
0, M
athe
mat
ica
Pol
icy
Res
earc
h, I
nc.
*
Dif
fere
nces
am
ong
subg
roup
s pa
rtic
ipat
ion
rate
s (o
r ch
ange
s in
par
ticip
atio
n ra
tes)
are
sta
tistic
ally
sig
nifi
cant
at t
he 5
per
cent
leve
l. **
Dif
fere
nces
am
ong
subg
roup
s pa
rtic
ipat
ion
rate
s (o
r ch
ange
s in
par
ticip
atio
n ra
tes)
are
sta
tistic
ally
sig
nifi
cant
at t
he 1
per
cent
leve
l.

38
TA
BL
E 6
PA
RT
ICIP
AT
ION
IN
CA
RE
ER
-FO
CU
SED
CL
ASS
ES
BY
ST
UD
EN
T S
UB
GR
OU
P
V
ocat
iona
l or
Tec
hnic
al C
lass
Aca
dem
ic A
ssig
nmen
t Rel
ated
to
Car
eer
Inte
rest
Aca
dem
ic C
lass
for
Tho
se in
C
aree
r A
rea
C
lass
of
1996
C
lass
of
2000
C
hang
e
Cla
ss o
f 19
96
Cla
ss o
f 20
00
Cha
nge
C
lass
of
1996
C
lass
of
2000
C
hang
e
All
Stud
ents
50
.4
54.1
3.
7
86.6
87
.1
0.5
17
.3
18.0
Pla
ns to
Att
end
Col
lege
Aft
er H
igh
Scho
ol
H
ave
plan
s 47
.6**
51
.9*
4.3
86
.5
89.0
* 2.
5
18.5
19
.2
0.7
Hav
e no
pla
ns
57.5
59
.1
1.6
86
.9
82.9
-4
.0
14
.8
15.6
0.
8 C
ompl
eted
Col
lege
Pre
p C
urri
culu
m
C
ompl
eted
43
.7**
47
.9
4.2
86
.9
88.0
1.
1
18.0
19
.4
1.4
Did
not
com
plet
e 54
.8
57.9
3.
1
87.0
84
.3
-2.7
18.8
17
.7
-1.1
R
ace/
Eth
nici
ty
A
fric
an A
mer
ican
56
.0
66.6
10
.6
93
.3**
92
.3
-1.0
22.8
29
.7**
6.
9 H
ispa
nic
47.8
64
.3
16.5
87.9
81
.8
-6.1
21.2
16
.1
-5.0
W
hite
/Oth
er
49.9
50
.8**
0.
9**
85
.5
87.1
* 1.
6
16.0
16
.3
0.3
Gen
der
M
ale
51.3
54
.8
3.5
89
.6**
90
.4**
0.
9
16.3
18
.2
1.9
Fem
ale
49.6
53
.4
3.8
83
.9
84.0
0.
1
18.2
17
.8
-0.4
D
isab
ility
Has
dis
abili
ty
53.9
55
.1
1.2
80
.8
84.8
4.
0
16.0
18
.3
2.3
Doe
s no
t 50
.0
53.6
3.
6
87.4
87
.1
-0.2
17.4
18
.1
0.6
Urb
anic
ity
U
rban
51
.7
63.3
* 11
.6*
88
.2
85.5
-2
.7
18
.8*
20.5
1.
7*
Subu
rban
48
.1
49.2
1.
1
85.4
87
.8
2.4
13
.5
16.5
3.
0 R
ural
54
.6
52.2
-2
.4
87
.6
88.1
0.
6
24.8
18
.0
-6.8
So
urce
: E
ight
-Sta
te 1
2th
Gra
de S
urve
y of
Cla
sses
of
1996
and
200
0, M
athe
mat
ica
Pol
icy
Res
earc
h, I
nc.
*
Dif
fere
nces
am
ong
subg
roup
s pa
rtic
ipat
ion
rate
s (o
r ch
ange
s in
par
ticip
atio
n ra
tes)
are
sta
tistic
ally
sig
nifi
cant
at t
he 5
per
cent
leve
l. **
Dif
fere
nces
am
ong
subg
roup
s pa
rtic
ipat
ion
rate
s (o
r ch
ange
s in
par
ticip
atio
n ra
tes)
are
sta
tistic
ally
sig
nifi
cant
at t
he 1
per
cent
leve
l.

39
TA
BL
E 7
PA
RT
ICIP
AT
ION
IN
WO
RK
AC
TIV
ITIE
S B
Y S
TU
DE
NT
SU
BG
RO
UP
P
aid
Job/
Inte
rnsh
ip F
ound
T
hrou
gh S
choo
l
Unp
aid
Job/
Inte
rnsh
ip F
ound
T
hrou
gh S
choo
l
Sch
ool-
Bas
ed E
nter
pris
e
C
lass
of
1996
C
lass
of
2000
C
hang
e
Cla
ss o
f 19
96
Cla
ss o
f 20
00
Cha
nge
C
lass
of
1996
C
lass
of
2000
C
hang
e
All
Stud
ents
15
.0
16.9
1.
9
16.3
20
.2
3.9
25
.5
22.7
-2
.8
Pla
ns to
Att
end
Col
lege
Aft
er H
igh
Scho
ol
H
ave
plan
s 14
.0
14.6
0.
6
17.0
21
.8*
4.8
25
.6
21.6
-4
.0
Hav
e no
pla
ns
16.5
21
.6
5.1
14
.5
16.6
2.
1
25.5
25
.8
0.2
Com
plet
ed C
olle
ge P
rep
Cur
ricu
lum
Com
plet
ed
11.0
**
12.6
1.
6
18.4
20
.6
2.2
24
.5
20.8
-3
.7
Did
not
com
plet
e 17
.0
22.1
5.
1
15.9
20
.3
4.4
28
.1
24.7
-3
.4
Rac
e/E
thni
city
Afr
ican
Am
eric
an
21.4
* 23
.3
1.9
18
.7
21.0
2.
3
30.2
22
.7
-7.5
H
ispa
nic
14.2
31
.4
17.2
16.3
24
.5
8.2
25
.4
22.0
-3
.3
Whi
te/O
ther
13
.7
14.0
0.
3
15.9
19
.3
3.4
24
.9
22.8
-2
.1
Gen
der
M
ale
14.0
17
.0
3.0
12
.4**
15
.3**
2.
8
24.0
23
.1
-0.9
Fe
mal
e 15
.7
16.7
1.
0
19.7
24
.8
5.1
26
.9
22.3
-4
.7
Dis
abili
ty
H
as d
isab
ility
21
.9**
9.
3 -1
2.6*
20.3
17
.3
-3.0
25.5
23
.9
-1.5
D
oes
not
14.0
17
.3
3.3
15
.8
20.1
4.
4
25.5
22
.1
-3.5
U
rban
icit
y
Urb
an
19.5
26
.6
7.1
17
.5
21.9
4.
4
24.4
**
22.7
**
-1.7
Su
burb
an
13.2
12
.9
-0.3
14.7
17
.5
2.7
23
.4
18.9
-4
.5
Rur
al
12.2
11
.9
-0.3
18.3
24
.1
5.9
32
.5
31.4
-1
.1
Sour
ce:
Eig
ht-S
tate
12t
h G
rade
Sur
vey
of C
lass
es o
f 19
96 a
nd 2
000,
Mat
hem
atic
a P
olic
y R
esea
rch,
Inc
. *
Dif
fere
nces
am
ong
subg
roup
s pa
rtic
ipat
ion
rate
s (o
r ch
ange
s in
par
ticip
atio
n ra
tes)
are
sta
tistic
ally
sig
nifi
cant
at t
he 5
per
cent
leve
l. **
Dif
fere
nces
am
ong
subg
roup
s pa
rtic
ipat
ion
rate
s (o
r ch
ange
s in
par
ticip
atio
n ra
tes)
are
sta
tistic
ally
sig
nifi
cant
at t
he 1
per
cent
leve
l.

40
Reflecting the national pattern, students in the MPR survey who had no plans of attending
college were somewhat more likely than college-bound students to take vocational classes during
11th and 12th grades (Table 6). In addition, the transcripts of the students reporting no plans to
attend college were more likely to indicate that they were “vocational concentrators”—that is,
they took at least three courses in a single occupational field. These findings echo other past
studies of vocational programs, and suggest that vocational programs in the case study states are
still more likely to attract students who plan to enter the labor market after high school than
college-bound students.
While many students with no plans to attend college participated in paid internships, these
students were less likely than college-bound students to have an unpaid internship (Table 7).
The higher rate of participation in unpaid internships among college-bound students could reflect
these students’ higher incomes or their interest in performing extracurricular activities valued by
some high school and college admissions staff.29
Students with no college plans were less likely than college-bound students to recall
receiving career counseling from school staff members. These differences may mean that
college-bound students are more engaged in school and have a better rapport with staff members
who provide career and postsecondary guidance. They could also reflect the fact that much of
the postsecondary guidance provided by school staff revolves around planning for college
(Rosenbaum 2001). Whatever the reasons for these differences, they may point to a need to
expand or enhance the career guidance provided to students with few postsecondary plans.
29Students with high grades in 9th grade are also more likely to participate in school-
sponsored unpaid internships, a pattern that may reflect these students’ engagement in school and willingness to participate in extracurricular activities that school staff value.

41
• Black students are more likely than white students to report taking classes related to careers and obtaining paid internships through school.
Black students responding to the eight-state survey were more likely to report that their
studies in high school involved some career focus. Specifically, black students were more likely
to say that they selected a career area for planning purposes and took at least one academic class
related to it. Both black and Hispanic students were more likely than whites to be aware of
taking a vocational class during 11th and 12th grade.30 These student survey results suggest that
black students may be more consciously seeking to prepare for jobs. This may reflect the fact
that, for economic and other reasons, they are more likely to seek full-time jobs shortly after they
graduate.
Relative to white students, black and Hispanic students were more likely to obtain paid
internships through school but less likely to report other kinds of paid employment during high
school. About 20 percent of black students and 16 percent of Hispanic students found positions
through school, compared to only 12 percent of white students.31 However, black and Hispanic
students were less likely to report finding paid jobs or other types of paid internships without
assistance from school staff. The fraction of black and Hispanic students with any paid job or
internship (including both school-sponsored internships and paid positions students find in other
ways) was significantly smaller than that of whites. Minority students’ high rate of participation
in internship programs may partly reflect these students’ greater need for assistance finding paid
positions, weaker local labor market conditions in their schools, and a lack of information about
30However, the transcript analysis suggests that minority students are not significantly more
likely to be vocational concentrators.
31However, only the difference between blacks and other students was statistically significant. The difference between Hispanics and whites was not statistically significant.

42
job opportunities. Alternatively, for economic reasons, minority students may have a greater
interest in taking advantage of programs designed to prepare students for jobs after high school.
Indeed, minority students with no college plans were most likely to participate in school-paid
internship programs, perhaps because these students planned to work full-time after they left
high school.32
• Female students are more likely than males to receive career counseling and participate in unpaid internships.
Differences between male and female participation in career-focused activities can be of
potential concern if they reflect or reinforce stereotypes that discourage students from taking
advantage of learning opportunities or pursuing certain careers. Some traditional vocational
programs tend to attract either mostly male or female students. For example, national transcript
studies indicate that, in 1998, males in high school were about six times as likely as their female
counterparts to take trade and industry vocational classes (which include manufacturing,
construction, and automotive repair), while females were about four times more likely than
males to take health occupations vocational classes (Levesque et al. 2000). In addition to
reducing stereotypes related to specific occupations, some educators are interested in identifying
whether and how differences between male and female students’ high school experiences may
contribute to the recent reversal in the postsecondary enrollment gender gap. As noted earlier, as
a result of the rapid growth in female college enrollment, female students now significantly
outnumber males. To the extent that female students are more likely to participate in specific
school-sponsored activities that contribute to their high rates of postsecondary enrollment,
32However, white students with no college plans were not substantially more likely to secure
paid internships. It is possible that these white students family networks or local communities offer more employment opportunities.

43
educators may want to explore whether there are ways to attract more male students to similar
activities or activities that offer similar learning opportunities.
Female students responding to the MPR survey were somewhat more likely than male
respondents to report participating in two types of career development activities that relate to
developing career plans. In particular, females were more likely to recall receiving career
counseling from school staff. Females were also more likely to report selecting a career major or
career area for purposes of developing plans during high school. These patterns may reflect
female students’ greater interest or willingness to seek career-related advice from school staff.
Even if this is the case, it may call for additional efforts on the part of guidance staff to reach
male students.
In addition, females were more likely to participate in unpaid internships during high school.
Females were more likely to participate in all types of unpaid activities—both those sponsored
by school staff and those that students found in other ways. This may reflect the tendency for
females to participate in community service at higher rates than males (Shumer and Cook 1999;
and Nolin et al. 1997). It may also reflect the fact that a large fraction of unpaid internship
opportunities are in schools and hospitals and relate to occupations—such as teaching and health
occupations—that attract more young women than young men.33 Schools might explore the
feasibility of expanding the diversity of unpaid internship opportunities in ways that could
increase their attraction to male students without reducing their appeal to females.
These differences in male and female participation rates probably also reflect, and perhaps
even contribute to, the emerging gender gap in college enrollment. Consistent with the national
33There are no significant differences in female and male students’ participation in either
paid internships sponsored by schools or paid jobs. Hence, it does not appear as though males are substituting paid for unpaid internships.

44
trends, female respondents were more likely than males to develop plans for attending college
and to enroll in college shortly after leaving high school. Career counseling, career planning,
and unpaid internships all attract students planning to attend colleges. For example, male
students who were planning to attend college were as likely as females to report receiving some
career counseling; however, since fewer males had college plans, a smaller fraction of males
overall received counseling.34 Educators should explore how involvement in career-focused high
school activities affects both male and female students’ preparation for college.
• Participation in internships arranged by schools has declined among students with disabilities.
The Perkins legislation indicates that vocational programs should be available to diverse
students, including those with disabilities. States are required to report the participation levels
and outcomes of these students. Partly in response to these federal policies some schools have
actively encouraged students with physical or mental disabilities to participate in vocational and
co-op programs.
In the schools MPR’s survey covered, students with disabilities were just as likely as other
students to participate in most school-based activities. For example, students with disabilities
were just as likely as other students to report taking vocational class or an academic class related
to their career goals (Table 6). Moreover, there were not significant changes between the
Classes of 1996 and 200 in the extent to which students with disabilities participated in most
school-based activities.
34While males with college plans were more likely than other males to obtain unpaid
internships through school, all groups of females—regardless of their postsecondary plans—had relatively high rates of involvement in school internship programs. This may be because schools have education- and health-related internships that are attractive to both college-bound and non-college-bound females.
45
However, the fraction of students with disabilities who participated in school-sponsored
internship programs declined substantially between the Classes of 1996 and 2000. In the Class
of 1996, the fraction of students with disabilities who had a paid internship (22 percent) was
significantly higher than that of other students (14 percent). Between the Classes of 1996 and
2000, disabled students’ participation rates declined to 9 percent, while the participation rate of
other students rose to 17 percent.35 Since Perkins funding supported some internship programs,
this trend may reflect the decreased emphasis of work-based programs under Perkins. This trend
could also reflect schools’ efforts to attract more diverse students to internship programs that in
the past had sought to involve many special education students or other students facing special
challenges. Educators may want to examine the extent to which disabled students’ involvement
in paid internships has declined in various communities and whether any changes in funding or
vocational policy have contributed to these trends.
• Perhaps reflecting efforts to overcome transportation challenges, students enrolled in rural schools are more likely to participate in school-based businesses and worksite tours and somewhat less likely to obtain internships.
Schools in areas with low population densities can face extra challenges developing certain
types of career-focused activities for students. In particular, these schools can have more
logistical difficulties arranging activities that involve students traveling to workplaces to explore
a career interest. A dispersed student population and a lack of diversity in the local economy can
make it harder to identify relevant employers and match students with internships or job-
shadowing experiences that students can easily get to.
35While the rate of participation of disabled students within the Class of 2000 appears to be
appreciably smaller than that of other students, the difference is not significantly different. However, the participation rate changes between the Classes of 1996 and 2000 are significantly different for disabled and other students.

46
Students in rural areas responding to MPR’s survey appeared to be somewhat less likely
than students in suburban and urban areas to participate in school-sponsored paid internships.
However, the difference between rural and urban students’ rate of participation was not
statistically significant. In addition, there were no appreciable differences in the extent to which
rural, urban, and suburban students took advantage of unpaid internships. Perhaps unpaid
internships are easier for rural schools to develop in part because they do not last very long and
often take place within a school or local hospital.
Students in rural schools were substantially more likely than students in more densely
populated communities to participate in worksite tours and school-based enterprises, activities
that are easier for rural school staff to arrange than paid internships. Approximately 77 percent
of rural students participated in workplace tours, compared to 63 percent of students in urban
areas and 56 percent in suburban areas. It is easier for schools to transport a group of students to
a workplace than it is to help individual students get to internships. Similarly, students in rural
areas were more likely to report participating in school-based enterprises. These enterprises can
provide opportunities for rural students to perform a range of tasks without traveling to any
workplace outside of the school.
While workplace tours and school-based enterprises may provide valuable learning
opportunities to students in rural areas, the lack of individualized workplace experiences may
limit the learning opportunities available to rural students in certain ways. As discussed in the
last chapter of this report, in follow-up surveys, students generally indicate that job shadowing
and internships were particularly helpful in clarifying their career goals and substantially more so
than group worksite tours and school-based enterprises. Nonetheless, the transportation hurdles
and scarcity of internship options in rural areas may be a challenge that school staff cannot easily
overcome. For these reasons, school staff in some rural schools have understandably sought to
enhance and diversify positions in school-based enterprises.
47
V. QUALITATIVE FEATURES OF VOCATIONAL CLASSES AND INTERNSHIPS
During the past decade, policymakers and educators have been seeking to modify and
enhance the quality of career-focused activities in several ways. Some of these new policies
have concentrated on strengthening the quality of two of the more intensive career-focused
activities that schools have made available to students for many decades: (1) vocational classes,
and (2) paid and unpaid work experience programs. Both STWOA and recent versions of the
Perkins Act emphasized the importance of enhancing the academic content of vocational
programs so that students participating in these programs can meet schools’ academic standards.
STWOA also encouraged schools to develop high-quality work experience activities that
reinforce and complement the skills students develop in the classroom. While the Perkins
legislation does not contain many provisions relating to work experiences programs, it continues
to support co-op internships designed to complement students’ school curriculum.
The 12th-grade surveys provide a basis for gauging the extent to which the qualitative
features of students’ vocational classes and internship experiences correspond to some of the
reform objectives defined by Perkins and STWOA. Comparisons of the experiences of students
in the Classes of 1996 and 2000 also shed light on the extent to which vocational classes and
internships are changing in ways that are consistent with some of these objectives. In particular,
we analyze the extent to which students in each of these cohorts (1) applied academic skills in
vocational classes, and (2) obtained internships providing substantial learning opportunities.
• Students in vocational classes are increasingly likely to report working on tasks involving math, writing, and presentation skills.
During the past decade, vocational educators have been seeking to expand the academic
content of career-focused classes. The MPR survey had several questions designed to gauge the

48
extent and ways in which students applied academic skills in vocational courses. Specifically,
students who reported participating in vocational classes during their junior or senior year were
asked to indicate the number of times in these classes they had (1) made a presentation or written
an essay about a career interest; (2) made a presentation or written an essay about something they
learned in a job; (3) worked on an assignment that used math skills; and (4) had a vocational
class assignment graded by other teachers such as an English, math, or science teacher.
Comparisons of the Class of 1996 and Class of 2000 survey results suggest that these kinds
of efforts to enhance the academic content of vocational curriculum have become increasingly
common. All four of the ways students could report applying academic skills in vocational
classes expanded significantly between the Class of 1996 and Class of 2000 (Table 8). In
addition, a substantial and growing fraction of students indicated that they applied academic
skills repeatedly (three or more times) during their junior- and senior-year vocational classes,
suggesting that such instructional strategies may be becoming more routine in vocational
programs.
Of course, it remains to be seen whether these changes in vocational curricula will reinforce
students’ academic skills and enhance their ability to apply these skills in workplace settings.
Although some studies have sought to evaluate the effects of efforts to integrate academic and
vocational curricula, no definitive study has concentrated specifically on these types of
curriculum strategies (Kemple et al. 2001). Moreover, some of this research draws on student
data collected well before many states introduced new academic standards, which could change
the ways vocational teachers seek to reinforce academic learning (Agodini et al. 2003).
Nonetheless, these findings suggest that vocational instructors in some schools are
increasing the emphasis they place on academic learning, and these efforts have changed
students’ experience of vocational courses. These changes are noteworthy, given the challenges

49
TABLE 8
PARTICIPATION IN APPLIED ACADEMIC ACTIVITIES IN VOCATIONAL CLASSES STUDENTS IN CLASS OF 1996 AND 2000
(Percentage)
Class of 1996
Class of 2000 Change
Reported taking Vocational Class in 11th or 12th Grade 50.4 54.1 3.7 Activities in 11th and 12th Grade Vocational Classes (Among Those Who Took These Classes): Made Presentation or Wrote Essay About Career of Interest
Ever 47.3 64.0 16.7** Three or more times 13.9 22.1 8.2*
Made Presentation or Wrote Essay About What Learning on a Job
Ever 42.1 55.7 13.6** Three or more times 11.2 18.3 7.1**
Used Math Skills to Complete an Assignment
Ever 68.7 74.7 6.0* Three or more times 41.1 47.2 6.1*
Completed Assignment Graded by Another Teacher
Ever 44.0 58.7 14.7** Three or more times 21.5 29.1 7.6**
Sample Size 1,110 1,149 Source: Eight-State 12th Grade Survey of Classes of 1996 and 2000, Mathematica Policy
Research, Inc. *Change between Classes of 1996 and 2000 is statistically significant at the 5 percent level. **Change between Classes of 1996 and 2000 is statistically significant at the 1 percent level.

50
schools sometimes face making changes in the curriculum so they are perceptible to students and
reflected in their responses to broad questions in student surveys. For example, even in schools
where school staff embraces the goal of enhancing the academic content of vocational
curriculum, teachers sometimes have difficulty finding the time to substantially modify their
lesson plans (Kemple et al. 2001). The trends identified in MPR’s student survey suggest that
some schools may be overcoming these challenges.
• The internships students find through school appear to offer more structured learning opportunities than the positions students find on their own, although the qualitative differences between these two types of positions do not appear to have changed appreciably over time.
A central goal of school internship and work experience programs is to provide students
with jobs that provide more and better learning opportunities than the jobs they can obtain on
their own. As noted above, most students work at some point during high school, and most find
their own jobs. Although students can potentially learn something from nearly any work
experience—if only about employers’ expectations—the jobs teenagers obtain on their own often
are brief, have little relation to their career interests or school program, and provide few
structured learning opportunities. Schools sometimes seek to identify paid or unpaid positions
that offer students greater learning opportunities or chances to explore their interests.
Sometimes, to provide students with a concrete sense of the value and application of skills,
school staff try to place students in positions that allow them to make connections between what
they are learning at school and tasks performed at work.
The analysis of the student survey suggests that the paid and unpaid internships that students
obtain through schools have several of these qualitative advantages over the positions students

51
find on their own (Figure 8).36 First, the paid positions students obtain through school staff are in
much more diverse occupations and industries, suggesting that individual students may have
greater opportunities to find jobs relevant to their specific career interests. In particular, paid
positions that schools develop are less likely than jobs students find on their own to be confined
to the retail or restaurant sectors and are more likely to be in public, legal, and social services;
health services; and education—industries of interest to many students. The unpaid internships
that students obtain through school are in less diverse settings: more than 40 percent of these
36The above analysis of the advantages of schools’ internships is based on simple
comparisons with the positions students report finding on their own. However, magnitude and significance of the qualitative differences between the positions students obtain through school and those they find on their own remain the same even after one controls for students’ background characteristics and 9th-grade grade point average.
42
74
69
64
54
31
77
24
45
42
62
37
16
37
0 20 40 60 80 100
52
70
48
41
44
39
94
32
47
28
28
36
24
94
0 20 40 60 80 100
FIGURE 8
QUALITATIVE ADVANTAGES OF POSITIONS HIGH SCHOOL STUDENTSOBTAIN THROUGH SCHOOL
CLASS OF 2000
Percentage of Paid Positions Percentage of Unpaid Positions
**
** **
*
Obtained Outside SchoolObtained Through School
Source: Eight-State 12th Grade Student Survey, Class of 2000, Mathematica Policy Research, Inc.
*The difference between the positions obtained outside school and through school is significant at the 5 percent level, two-tailed test.**The difference between the positions obtained outside school and through school is significant at the 1 percent level, two-tailed test.
*
**
**
**
**
**
**
**
Position Not in Retail
Spent at Least Half Timeat Worksite in Training
Discussed PossibleCareers with Employers
Received PerformanceEvaluation from Employers
Work Drew on SkillsDeveloped in Class
Discussed Workwith School Staff
Drew on Work inSchool Assignment

52
positions are in schools. However, students responding to the survey indicated that their
volunteer jobs within schools were varied and included tutoring students, completing
administrative tasks, and helping to manage sports teams or events.
Second, the positions students obtain through school appear to provide more structured
learning opportunities. Students were asked to estimate the fraction of the time at their
workplaces they spent “doing regular work” and the fraction they spent “being trained or
practicing skills.” The student responses indicated that they were more likely to spend at least
half their time in training if they had found their position through school. Those who obtained a
position through school were also more likely to say they discussed career options with some
employees and secured feedback from a supervisor on their worksite performance.
Third, students who had obtained positions through school often make some substantive
connection between their studies and work experience. For example, compared with those who
found their own position, students in school-arranged internships more often reported that
workplace tasks used academic or technical skills they had learned in school. They also were
more likely to draw on their work experiences while completing school assignments, participate
in discussions about their work at school, and receive some grade relating to their work.
Comparisons of the Classes of 1996 and 2000 point to two shifts in the experiences of
students obtaining positions through school. First, there are signs that the unpaid positions
students obtain through school may be less likely to provide opportunities to learn about careers
than was true previously. Specifically, students in the Class of 2000 who obtained unpaid
positions through school were somewhat less likely than those in the Class of 1996 to say that
they had discussed career issues with employer staff. There also appears to have been a decline
in the fraction of students in unpaid internships who receive an evaluation on their work
performance from school staff. While the magnitude of these two changes is fairly substantial,
53
they are not statistically significant. One potential explanation for this trend—assuming it is a
real trend—is that high school unpaid internship programs are encouraging participants to
provide community service and perhaps learn about social or civic issues but are less likely to
encourage them to learn about career opportunities or develop work-related skills than in the
past.
Second, whether as a result of improvements in traditional co-op programs or other efforts to
support workplace experiences, students in the Class of 2000 were somewhat more likely to
discuss their workplace experiences with school staff. This shift was evident among those
obtaining paid positions through school, as well as all students with unpaid work experience,
whether or not they found that position through school. This shift may reflect school efforts to
ensure that students are deriving some benefits from their workplace experiences. However, it
does not appear to have translated into other substantial improvements in the qualitative features
of students’ workplace experiences.
Since the academic demands of high school are growing, school staff developing internship
programs may perceive a need to further enhance or modify internship opportunities so that they
complement students’ academic studies. This could be done in a variety of ways. Schools could
try to provide students with more opportunities to explore a career that relates to a class they are
currently taking. In addition, students could be asked to collect information during or after work
that could provide the basis for research reports or papers. Finally, schools may need to make
sure that internship opportunities do not last too long so that they do not interfere with students’
studies. In the Class of 2000, approximately 36 percent of paid internships involved more than
20 hours of work per week, and 16 percent involved more than 30 hours. Even when students
perceive a need to earn wages, developing long internships can limit students’ opportunities to
study or undermine support for internship programs among other school staff and educators.

55
VI. GRADUATES’ ASSESSMENT AND USE OF HIGH SCHOOL ACTIVITIES
As students leave high school and take the first few steps on their career path, they draw
upon what they have learned, both in and out of school. Their ability to make informed
employment and educational choices depends upon many factors, such as the clarity of their
goals and the guidance they have received.
Young adults’ postsecondary experiences, and their views about which high school activities
were most helpful in developing career goals, can provide insights into both the value and the
limitations of specific high school activities. Though these views are subjective, even where
students do not realize or appreciate the value of a specific activity, their views may point to
important issues. For example, if they do not recognize the value of a learning activity in which
they participated, then they may be less motivated to engage in similar activities in the future or
have difficulty knowing when and how to apply their knowledge.
Using information from the follow-up survey, this chapter examines the extent to which
graduates draw upon their high school career-focused learning experiences. Most of this analysis
concentrates on career-focused activities, rather than on the full range of high school learning
experiences. Moreover, the specific dimensions along which we assess students’ use of career-
focused activities are shaped to a large degree by the topics covered by the eight-state follow-up
surveys.
We highlight four specific ways students may value and use these activities. First, nearly all
career-focused activities seek to help students clarify their goals. Drawing upon the survey, we
examine which specific activities graduates view in retrospect as most helpful in figuring out
what they wanted to do in a career. Second, some high school programs—such as Tech Prep—
allow students to earn college credit during high school by taking vocational programs. We

56
examine the extent to which graduates use credits earned through high school courses, including
credits earned in vocational classes. Third, both academic and vocational classes can help
students develop skills that students can use in their jobs. We analyze the views of employed
young adults concerning the extent to which their jobs use skills learned in specific high school
classes. Fourth, students’ school-arranged internships and jobs can lead to jobs after high school.
We examine the extent to which students find jobs after high school with help from high school
staff or through school-arranged internships or jobs they held during high school. We also
examine whether the jobs students find with the help of high school staff have more appealing
characteristics than positions they find in other ways.
• Young adults report that workplace activities providing one-on-one contact with employer staff and career-focused academic and vocational classes were particularly helpful in clarifying their career goals.
One way to gauge how helpful specific activities were in clarifying students’ goals is to ask
those who participated in those activities. The eight-state follow-up survey conducted about a
year and a half after students graduated asked them whether they recalled participating during
high school in various career-focused activities. Students who said they had participated in a
particular activity were asked how helpful it was in “figuring out what you want to do or don’t
want to do in a career.” Presumably, students’ responses take into account the way their goals
changed both during and shortly after high school. These data should be interpreted with caution
because some students may not know whether they would have chosen the same career goal had
they not participated in a particular activity. Furthermore, students were only asked how these
activities helped them to develop career goals. Clearly, some of these activities may have been
useful in other ways, such as in developing skills. Nonetheless, most students may have a sense
of how various experiences were useful in formulating goals.

57
Students gave high ratings to workplace activities that provide one-on-one contacts with
employer staff. Specifically, 71 percent of students participating in job-shadowing experiences
and 61 percent of those finding a paid job or internship through school reported that these
activities were “very helpful” in clarifying their career goals (Table 9). By contrast, students
gave much lower ratings to group worksite tours and school-based enterprises. These findings
suggest that students prefer individualized workplace experiences as ways to explore careers and
clarify their goals.
In addition, many students gave high ratings to vocational classes and academic classes
designed for students with their career interests (Table 9). Like paid internships, career-focused
classes may help give students a sense of the kinds of tasks employees in particular fields
perform and whether they enjoy performing those tasks.
Even students who change their career goals after high school appear to find value in many
of these career-related activities. In fact, as the last two columns of Table 9 illustrate, there are
only small differences between the ratings of those who change their career goals and those who
do not. This suggests that a lack of persistence in career goals does not necessarily mean that
students did not benefit from career-focused activities. Students who change their goals after
they graduate may still draw upon these high school experiences to at least narrow the range of
careers they are considering. For example, a vocational class or internship may help students
discover that they like solving problems with computers, leading them to consider fields like
computer programming. Even if the students subsequently change their goals from
programming to engineering, they may still perceive that the high school class or internship was
helpful in providing them with some career direction. This suggests that educators should be
cautious about assessing the value of individual high school career-focused activities based upon
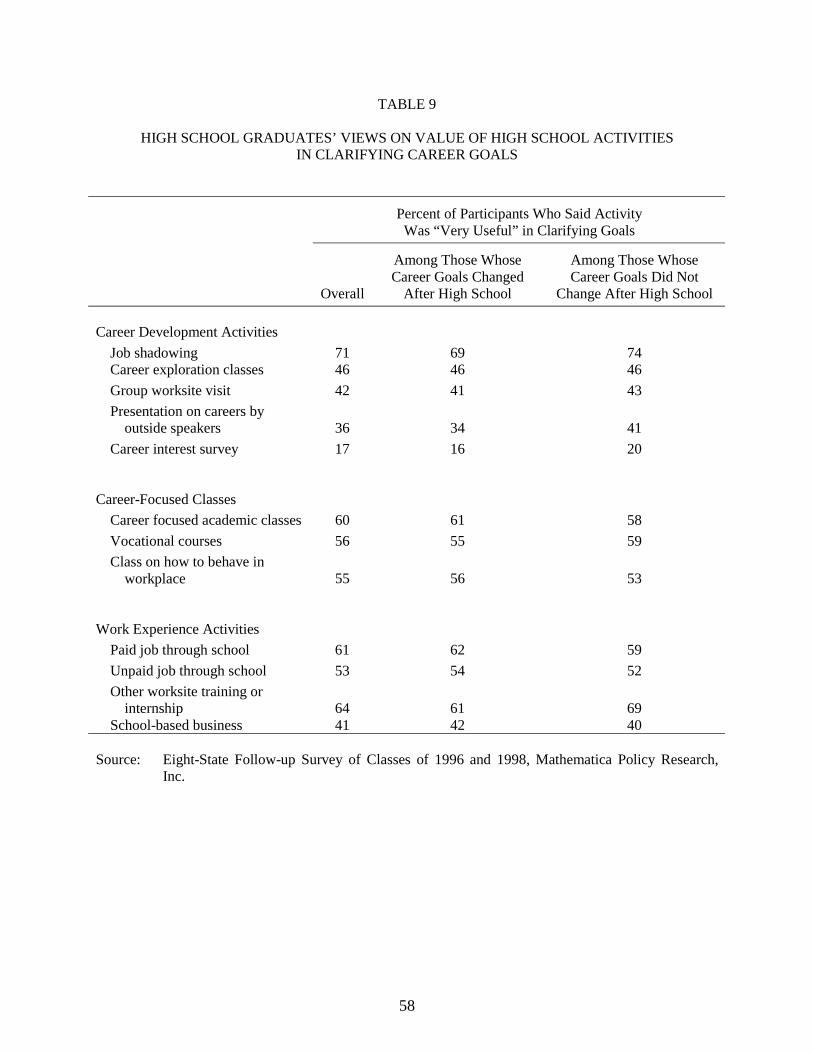
58
TABLE 9
HIGH SCHOOL GRADUATES’ VIEWS ON VALUE OF HIGH SCHOOL ACTIVITIES IN CLARIFYING CAREER GOALS
Percent of Participants Who Said Activity Was “Very Useful” in Clarifying Goals
Overall
Among Those Whose Career Goals Changed
After High School
Among Those Whose Career Goals Did Not
Change After High School
Career Development Activities
Job shadowing 71 69 74 Career exploration classes 46 46 46
Group worksite visit 42 41 43
Presentation on careers by outside speakers 36 34 41
Career interest survey 17 16 20 Career-Focused Classes
Career focused academic classes 60 61 58
Vocational courses 56 55 59
Class on how to behave in workplace 55 56 53
Work Experience Activities
Paid job through school 61 62 59
Unpaid job through school 53 54 52
Other worksite training or internship 64 61 69
School-based business 41 42 40 Source: Eight-State Follow-up Survey of Classes of 1996 and 1998, Mathematica Policy Research,
Inc.
59
the extent to which participating students report changing their career goals after they leave high
school.
• Many students do not use college credits they earned through high school classes.
As part of efforts to help students prepare for and succeed in postsecondary education, some
high schools have been seeking to expand opportunities to earn postsecondary credits during
high school. In the past, the most common type of high school class providing postsecondary
credits was Advanced Placement, typically an academic class designed for high-achieving
students planning to enroll in a four-year college. More recently, educators have sought to
expand the range of opportunities to earn college credit during high school. In particular, with
support from the federally funded Tech Prep initiative, many high schools and colleges have
developed articulation agreements that allow students taking vocational courses to earn credit
toward a two-year college degree.
These efforts have sought to expand the number and range of students who are prepared for
and succeed in postsecondary programs. High school classes providing postsecondary credits
can help students prepare for postsecondary programs in several ways. They can provide
students with the skills needed by postsecondary programs. They can also reduce the financial
burden of postsecondary education by reducing the total number of classes students need to take
to earn a postsecondary certificate or degree. In addition, by allowing students to fulfill specific
prerequisites, they can allow students to more quickly take classes that closely correspond with
their interests and goals.
The MPR 12th-grade surveys suggest that efforts to expand high school classes offering
college credit in the eight survey states did not result in any noticeable growth in the fraction of
students who take these classes. Between the Classes of 1996 and 2000, there was no change in

60
the extent to which respondents to the 12th-grade surveys said they had enrolled in such classes.
Just under a third (32 percent) of the Class of 2000 indicated that they had taken such a class
during high school, the same percentage as among the Class of 1996.
High school vocational classes are the source of a substantial fraction of the college credits
students earn during high school. About five percent of those enrolled in postsecondary
education said they had credits recorded on their transcript from high school vocational or
technical courses. This group represents about a third of the 16 percent who earned and used
credits earned in any kind of class in high school.37 This suggests that Tech Prep and related
initiatives may have helped some students earn postsecondary credits during high school, making
it easier for them to complete a postsecondary degree.
Many students appear to have difficulty making use of credits earned in high school. About
80 percent of young adults enrolled in at least one postsecondary education program 18 months
after high school. Most of these students enroll in either a two- or four-year college program.38
Even among students who reported that they had taken a high school course offering
postsecondary credit and had enrolled in some postsecondary program, only about 43 percent (or
16 percent of all postsecondary enrollees) said that those credits had been recorded on their
37Among students who were vocational concentrators in high school and who were enrolled
in a postsecondary program, about eight percent had credits recorded on their transcript from a high school vocational/technical course.
38Tabulations from the NELS suggest that the fact that the eight-state follow-up survey excludes most high school dropouts and GED holders substantially increases our estimate of the percentage of all students who enroll in postsecondary education (80 percent). Specifically, the NELS shows that 78 percent of high school graduates enroll in at least one postsecondary institution after two years, but that only 65 percent of all students (including dropouts) enroll in a postsecondary institution after two years. Since the eight-state sample was selected toward the end of 12th grade only about 1.4 percent are students who do not graduate from high school.

61
Took no classes offering
college credit
63%
Did not use credits
21%
Used Credits From
Vocational Classes
5%
Used credits from other
classes
11%
FIGURE 9
POSTSECONDARY STUDENTS USE OF CREDITSEARNED IN HIGH SCHOOL CLASSES
Source: Eight-State Follow-up Survey of Class of 1998, Mathematica Policy Research, Inc.
transcript (Figure 9).39 Tech Prep consortia staff suggest that some students do not use college
credits earned during high school in part because they can only use these credits in a limited
number of community colleges. The fact that not all colleges accept these credits may impede
their use.
Some states are trying to help more students use college credits earned in high school. For
example, Texas and Florida have developed statewide articulation programs that encourage two-
year colleges in the state to accept credit from any high school that offers certain courses. State
staff help colleges participate by documenting that specific high school classes meet collegiate
standards, providing training to college staff about how articulation works, and creating a
39Only the follow-up survey to the 1998 cohort asks questions about which high school
classes were the source of the postsecondary credits recorded on students’ transcripts. Thus, the analysis in the rest of this paragraph and the next is restricted to the 1998 cohort.
62
standardized high school and college course numbering system. While it is too early to
determine whether these statewide initiatives have been effective in expanding articulation
agreements, these efforts may ultimately make it easier for students to use college credits earned
during high school.
• A majority of employed young adults say they are not able to draw on skills learned in high school classes, but those who do perceive that they make greater use of vocational than academic classes.
The types of jobs students are able to obtain shortly after high school depend in part on their
skills and their ability to apply those skills. Employers will be more willing to assign
challenging tasks to students who can demonstrate they have some skills and know how to apply
them. Students who get to perform challenging tasks will advance their skills and enhance their
resumes. While applying skills in a job is important for all young adults, it can be particularly
important for those who do not enroll in postsecondary education, since they have few other
ways to develop and demonstrate their skills. Since nearly all young adults are employed shortly
after high school, most are likely to have some opportunities to apply skills, including potentially
some skills they developed in high school classes.
The eight-state follow-up survey included questions about whether respondents made use of
skills learned in high school classes in specific jobs held after they graduated. In particular, the
survey asked whether students’ work made use of any skills developed in high school classes
and, if so, which types of classes. It is important to interpret these results cautiously, since many
skills learned in high school may not be applicable in the jobs students hold during the
18 months after graduation but may have significant value later in life. Moreover, students may
not be fully aware of which skills they developed during high school and which ones they are
using in their jobs.

63
Overall, only about a third (32 percent) of young adults reported that they obtained any job
during the 18 months after high school that drew upon some skills learned in high school
(Figure 10). This was somewhat more common for young adults who were not enrolled in
postsecondary education 18 months after high school (35 percent) than for those enrolled in a
four-year college (27 percent). While many students may not be aware of the extent to which
they draw on skills learned in high school, the fact that two-thirds do not see the relevance of any
skills they developed in school is somewhat troubling. This finding suggests that at least one and
perhaps more of the following three problems exist: (1) some may not be learning relevant skills
in high school, (2) some may be unable to find jobs that use many skills, and (3) some may be
unaware of the connection between the skills they posses and their workplace performance.
Do Not Draw on High
School Skills
68%
Draw on Vocational Skills
18%
Draw on Math Skills
6%
Draw on English Skills
4%
Draw on Other Skills
4%
FIGURE 10
EXTENT TO WHICH YOUNG ADULTS DRAW ON SKILLS LEARNED IN HIGH SCHOOL IN ANY OF THEIR POSTSECONDARY JOBS
Source: Eight-State Follow-up Survey of Classes of 1996 and 1998, Mathematica Policy Research, Inc.

64
For those who do report that skills learned in high school were relevant to their
postsecondary jobs, they most often say that vocational courses were the source of those skills.
Specifically, among those who reported drawing on high school skills in a job, 55 percent said
those skills came from a vocational course. This compares to 20 percent from math, 11 percent
from English, and 6 percent from science. Young adults who do not enroll in postsecondary
education are significantly more likely to draw upon skills from vocational courses than those
enrolled in a four-year program—60 versus 49 percent.40 The fact that students often identify
vocational courses as a source of job-related skills suggests that these courses may be useful to at
least some employed students.
However, skills learned in academic classes may also have value that is not as easily
identified by students due to the general nature of academic skills. For example, a young adult
may not fully recognize that writing a report about Shakespeare develops writing skills that
employers value. In addition, some academic skills may not pay off appreciably unless or until
students obtain a job involving tasks that draw upon some communication or problem-solving
competencies. Nonetheless, the findings from the student survey suggest that academic teachers
may need to work harder to demonstrate to students the economic value of the skills their classes
are designed to cultivate.
• While few students are employed after high school in jobs obtained with help from school staff, these jobs appear to have several advantages over the positions they find in other ways.
Sometimes high school staff try to connect students with employment opportunities or
internships that can lead to paid positions after they graduate. Since most students are able to
40Of those enrolled in a two-year program, 54 percent report drawing on skills from a high
school vocational class.

65
find some paid work on their own, the value of these efforts often depends upon schools’ ability
to help students find positions that are more attractive than the jobs they can find on their own.
As noted above, the internships students find during high school with help from school staff have
several qualitative advantages. However, these positions may or may not lead to any paid
position after students leave high school. The quality of the jobs young adults hold after leaving
high school can be assessed on many dimensions, including the extent to which they correspond
to students’ career interests, whether the employer provides much training, and the wages and
fringe benefits employers offer. Based on the follow-up survey, we examined the extent to
which graduates are employed in positions they found with help from school staff. We also
compared the qualitative features of these positions with other jobs graduates obtain or retain
shortly after high school.
Overall, only a small fraction—4.6 percent—of the high school graduates from the
Classes of 1996 and 1998 worked in jobs that they found through high school staff. Another
2.8 percent of students found positions through a postsecondary program. The most common
method for finding their first jobs after high school was referrals from family or friends
(Figure 11). Others reported finding jobs through the classifieds or by directly contacting
employers.
An even smaller fraction of students worked in school-arranged internships during high
school that led to a full-time position. Overall, about 27 percent of students in the Classes of
1996 and 1998 had some school-arranged paid or unpaid internship during high school.

66
3 510
16
50
16
0
10
20
30
40
50
60
70
80
90
100
Postsecondary
Program Staff
High School
Staff
Classifieds Contacted
Employer
Directly
Friends and
Family
Other
FIGURE 11
HOW HIGH SCHOOL GRADUATES FOUND THEIR FIRST JOB
Percent of Survey Respondents
Source: Eight-State Follow-up Survey of Classes of 1996 and 1998, Mathematica Policy Research, Inc.
However, only 3.2 percent of all students obtained a school-arranged position that started before
they graduated and continued after they left school.41
Although some efforts to place students in jobs focus on non-college-bound youth, these
students were not significantly more likely than other students to find jobs with the help of
school staff. Only about five percent of those not currently in a two- or four-year college at the
time of the survey had found their first job with the help of high school staff. In fact, the fraction
of students who obtain jobs through high school staff does not appear to depend much upon
41This implies that about 12 percent (3.2/27) of those with at least one school-arranged
position during high school ultimately obtained or retained a job after high school with the same employer. However, it is possible that some students who reported that they had found their own job or found a job with help from an employer had in fact had a high school internship that led to that paid position.

67
students’ background characteristics—such as students’ race, gender, or the urbanicity of their
community. Even among vocational concentrators—who tend to have higher rates of
participation in co-op work experience programs—only about six percent reported that they
found their first job through school.
While only a small fraction of students find positions with help from school staff, these
positions appear to have many attractive features. Comparisons of the jobs high school
graduates obtained through school with the other positions secured by recent high school
graduates suggest that the former often have three distinct advantages. First, the jobs high school
graduates find through school tend to provide more intensive training. According to respondents
of the follow-up survey, nearly 70 percent of jobs found through high school or postsecondary
school offer some training, compared to 61 percent of the positions they found in other ways.
Furthermore, about 32 percent of respondents said they spent at least half time in training in jobs
found through either high school or postsecondary school staff, compared to 18 percent of jobs
found in other ways. Second, more than 40 percent of the jobs high school graduates found with
help from school staff correspond to their career goals, compared to less than a quarter of those
they found in other ways (see Table 10). Third, jobs found through school are more likely to
offer to pay for employees’ educational tuition. However, the average pay and most other fringe
benefits are about the same for jobs students find through school and other jobs (Table 10).
The results of linear regression models indicate that these advantages persist even after
controlling for differences in the observable characteristics of students who find jobs through
school and those who find jobs in other ways. It is conceivable that students who find jobs with
help from school staff tend to have greater assets and hence might obtain relatively high-quality
jobs even if they found their own positions. We tested this hypothesis by estimating regression

68
TABLE 10
CHARACTERISTICS OF FIRST POSTSECONDARY JOBS: DIFFERENCES BETWEEN POSITIONS FOUND THROUGH SCHOOL AND OTHER POSITIONS
Job Characteristics
First Job Found Through
High School
First Job Found Through
Postsecondary School
First Job Found Through
Other Means
Percentage of Jobs that:
Provide at least some training 70.3 70.0 61.5**
Correspond to career goals 43.1 48.5 23.3**
Helps pay tuition 20.7 14.3 10.2**
Average Hourly Wage $7.40 $7.43 $7.33 Source: Eight-State Follow-up Survey of Classes of 1996 and 1998, Mathematica Policy
Research, Inc. Note: This analysis includes only young adults’ first postsecondary job.
**The differences among jobs found through high school, postsecondary school, and other means are statistically significant at the 1 percent level.
models that controlled for students characteristics.42 Even after controlling for students’
performance in school and background characteristics, it appears that the jobs students find with
help from school staff provide substantially more training, are more likely to match students’
career goals, and are more likely to offer tuition reimbursement. However, regression models do
42We estimated logistic regression models that controlled for students race, parents’
education, gender, whether or not they were a vocational concentrator in high school, and their cumulative high school grade point average.
69
not allow us to control for unobserved differences between students who find jobs with help
from school staff and those who find jobs in other ways.43
The qualitative features of jobs found through high school suggest that students may benefit
from expanded efforts on the part of high schools to place students in jobs. Since nearly all
students seek some type of job after leaving high school, and many students work near their
former high school, schools could potentially widen the employment opportunities available to
many students. However, given the small number of students who currently find jobs through
high school, it is difficult to know what additional resources would be required to substantially
expand schools’ job placement efforts. Furthermore, it is not clear how many students have
sufficient motivation and qualifications for jobs that relate to their career interests and provide
substantial training.
43For example, if students who find jobs through high school are more motivated and have a
better attitude toward work, then they might get better jobs because of their better attitude, not because they found the job through high school staff.

70
In summary, the perceptions and experiences of young adults leaving high school suggest
that some career-focused high school experiences were helpful to them. Many report that they
were able to clarify their career goals by participating in career-focused academic and vocational
classes and workplace experiences providing one-on-one contact with employer staff. While
only 15 percent of those enrolled in postsecondary programs use college credits earned in high
school, vocational courses now represent about a third of all such credits used. Only five percent
of graduating students find a postsecondary job through school staff, but these jobs appear to be
more attractive than the positions they find in other ways.
Though these findings suggest that some students may benefit from career-related activities
in high school, many uncertainties remain. We do not know yet whether any of these activities
really help students make better choices of postsecondary education and jobs. Researchers need
to determine the impacts of these activities on students’ ability to enter and succeed in a chosen
career, taking into account all of the preexisting differences between those who participate in
these activities and those who do not. Before expanding career-focused activities, educators
should also consider whether the students who currently make less use of specific activities may
not be interested or may face different challenges calling for some distinct approach.
Furthermore, high schools clearly have a variety of priorities and demands on their resources,
which can limit their capacity to develop or expand career-related activities. If some career-
focused activities can improve students’ long-term outcomes, educators need to determine how
these activities compare to other activities, such as academics, that might have an even greater
impact on students’ outcomes. Schools may also need to identify public or private funding
sources to support some career-focused activities. Addressing these issues could help more
students prepare for productive careers.

71
REFERENCES
Agodini, Roberto, John Deke, Stacey Uhl, and Timothy Novak. Princeton, NJ: Mathematica Policy Research, Inc., forthcoming 2003.
Agodini, Roberto, Stacey Uhl, and Timothy Novak. “Factors That Influence Participation in Secondary Vocational Education.” Princeton, NJ: Mathematica Policy Research, Inc., April 2002.
Hershey, Alan, Paula Hudis, Marsha Silverberg, and Joshua Haimson. “Partners in Progress: Early Steps in Creating School-to-Work Systems.” Princeton, NJ: Mathematica Policy Research, Inc., April 1997.
Kemple, James. “Career Academies: Impacts on Students’ Initial Transitions to Post-Secondary Education and Employment.” New York: Manpower Demonstration Research Corporation, December 2001.
Levesque, Karen, Doug Lauen, Peter Teitelbaum, Martha Alt, and Sally Librera. “Vocational Education in the United States: Toward the Year 2000.” Washington, DC: National Center for Education Statistics, February 2000.
Nolin, Mary Jo, Bradford Chaney, Chris Chapman, and Kathryn Chandler. “Student Participation in Community Service Activity.” Washington, DC: National Center for Education Statistics, April 1997.
Rosenbaum, James. “Beyond College for All: Career Paths for the Forgotten Half.” New York: Russell Sage Foundation, 2001.
Shumer, R.C. Cook. “The Status of Service Learning in the United States: Some Facts and Figures.” Minneapolis: National Service-Learning Clearinghouse, University of Minnesota, 1999.
Silverberg, Marsha, Elizabeth Warner, David Goodwin, and Michael Fong. “National Assessment of Vocational Education, Interim Report to Congress.” Washington, DC: U.S. Department of Education, September 2002.
Wirt, John, Barbara Kridl, and Andrea Livingston (eds.). “The Condition of Education 2001.” Publication no. NCES 2001-072. Washington DC: U.S. Department of Education, Office of Educational Research and Improvement, National Center for Education Statistics, 2001.
