preparing for changing climate risk
TRANSCRIPT

4/17/18
1
Professor David Karoly, Earth Systems and Climate Change HubNational Environmental Science Program, CSIRO
Preparing for changing climate risk
Observed global climate changeWMO, 2017
SoC, 2016
SoC, 2016

4/17/18
2
Observed changes in extremes
IPCC AR5 WG1 Fig FAQ2.2
Observed Australian climate change
April-Oct rain deciles 1996-2015 Oct-April rain deciles 1996-2015
SoC, 2016

4/17/18
3
Projected climate change
Fig SPM.6, IPCC AR5 Synthesis Report
Two paths for global warming, depending on emissions.Very low emissions gives >50% chance of warming less than 2°C
Sea level rise in 2050: ~15-35cmContinues to rise for centuries after surface temperature stabilises
Projected changes in Australian climate
SoC, 2016

4/17/18
4
Australian climate projectionsAnnual days above 35°C at capital cities
City 1981-2010 average
Current average 2006-15
CCIA 2015 (projection to 2030)
CCIA 2015 (high emissions 2090)
Adelaide 20.7 25.6 26 (24 to 29) 47 (38 to 57)
Brisbane 13.7 12.5 18 (15 to 22) 55 (37 to 80)
Darwin 11 15.4 43 (25 to 74) 265 (180 to 322)
Hobart 1.6 1.8 2.0 (1.9 to 2.1) 4.2 (3.2 to 6.3)
Melbourne 11 13 13 (12 to 15) 24 (19 to 32)
Perth 28.8 35.4 36 (33 to 39) 63 (50 to 72)
Sydney 3.1 3.0 4.3 (4.0 to 5.0) 11 (8.2 to 15)
CCIA: Projections for selected Australian cities (2015)
Australian climate projectionsWinter rainfall change (%) at capital cities
CityCurrent change
relative to 1986-2005 (%)
CCIA 2015 (projection to 2030) (%)
CCIA 2015 (projection to 2090, high
emiss.) (%)
Adelaide -18 (-26 to -10) -6 (-16 to 6) -19 (-43 to -3)
Brisbane 8 (-26 to 42) -5 (-27 to 8) -17 (-49 to +18)
Darwin 7 (-126 to 140) -5 (-35 to 19) -4 (-45 to +44)
Hobart -2 (-10 to 6) +1 (-6 to 10) +6 (-11 to +19)
Melbourne -10 (-24 to 4) -3 (-10 to 7) -10 (-25 to +6)
Perth -21 (-35 to -8) -7 (-18 to 4) -29 (-44 to -15)
Sydney 23 (0 to 45) -1 (-19 to 12) -17 (-31 to +1)
CCIA: Projections for selected Australian cities (2015)

4/17/18
5
Marked increases in number of heatwave days and peak intensity, ~50% more than mean warming
From Perkins-Kirkpatrick, 2017
Changes in heatwavesfor different levels of
future global warming
Significant trends towards more
dangerous conditions in SE
Australia
Ø Earlier start to the fire season in
many parts of Australia
Fire weatherDJF
MAM
JJA
SON
From Dowdy (2017), JAMC
Long-term change:
days > 90th percentile
(from 1983-99 to
2000-16)

4/17/18
6
Significant trends towards
more dangerous conditions in NSW
Ø Many recent events are worse
than conditions experienced
previously.
Fire weatherFFDI deciles for Feb 2017
Sea-level rise and flood frequency
• Impacts of sea-level rise are felt strongly during extreme events
• Sea levels have risen by ~ 0.1 m since 1970
• Projected sea-level rise for RCP 8.5 relative to 1986-2005
2050 : 0.24 [0.15-0.32] m2100 : 0.44 [0.44-0.96] m
Data sources: McInnes et al, 2015

4/17/18
7
Frequency of inundation will increase with sea-level rise
• Change in frequency depends on the characteristics of extreme events at a given location
• For Williamstown, a 0.5 m sea-level rise is expected to increase the frequency of exceedances by a factor of ~ 130 times
• i.e. a 1-in-100 year event will occur more than once per year under a 0.5 m sea-level rise
Data source: IPCC AR5, Chapter 13, Figure 13.25
Severity of inundation will increase with sea-level rise2100 inundation from extreme event (1-in-100 year stormtide = 1.09 m) + median SLR for RCP 8.5 = 0.69 m SLR
2100 inundation from extreme event (1-in-100 year stormtide = 1.09 m) + upper SLR for RCP 8.5 = 0.96 m SLR
http://coastalrisk.com.au/viewerData sources: http://www.climatechangeinaustralia.gov.au/en/

4/17/18
8
• Climate change has already led to significant changes in climate risks and will continue to do so for the next 30-100 years or more
• Most confident projected changes are for increases in heat waves, severe fire weather and coastal flooding, less certainty in many other extremes
• For cities in southern Australia, observed changes to 2006-2015 in winter rainfall and days above 35C are already at or above the median changes for 2030. This suggests that hotter and drier projections agree better with recent observed changes than the model median for this region
Summary
The Earth Systems and Climate Change Hub is funded by the Australian Government’s National Environmental Science Program, with co-investment from the following partner agencies
www.nespclimate.com.au
FOR MORE INFORMATIONProf David [email protected]
4/17/18
9
References• Bureau of Met/CSIRO State of the Climate 2016 www.bom.gov.au/state-of-
the-climate
• IPCC AR5 Climate Change 2013: The Physical Science Basis, IPCC AR5 Climate Change 2014: Synthesis Reportwww.ipcc.ch
• Climate change in Australia: Projections for selected Australian cities, CSIRO, 2016 https://www.climatechangeinaustralia.gov.au/en/
• McInnes, K.L., et al., 2015: Sea-level rise projections for Australia: Information for impact and adaptation planning. AMOJ, 65, 127–149.
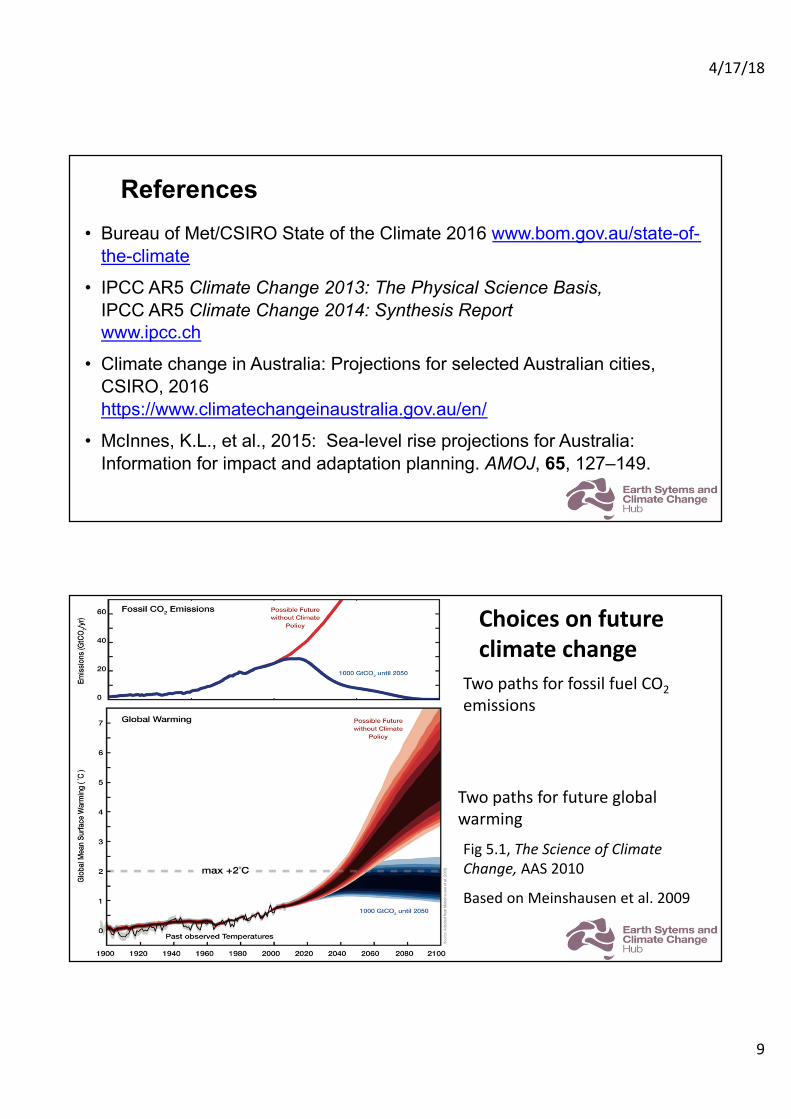
Choices on future climate change
Fig 5.1, The Science of Climate Change, AAS 2010
Based on Meinshausen et al. 2009
Two paths for fossil fuel CO2emissions
Two paths for future global warming

4/17/18
10
From The Age 31/10/17