prepared for state of louisiana louisiana economic development
TRANSCRIPT
20 E . Ja ckson Bou l eva rd , Su i t e 1200
Ch i cago , I L 60604
312 .427 . 3855 FAX 312 . 427 . 3660 www. econres . com
Los Ange l es San F ranc i s co San D i ego Denver New
Yo rk Ch i cago Wash i ngton D . C . London Hong Kong
Project Report
Louisiana Motion Picture, Sound Recording and Digital Media Industries
Prepared for
State of Louisiana Louisiana Economic Development Baton Rouge, Louisiana
Submitted by
Economics Research Associates
February 2009
ERA Project No. 18014
Economics Research Associates Project No. 18014 Page i
Table of Contents Executive Summary ............................................................................................................. 1
Motion Picture Industry ........................................................................................................... 1 Sound Recording Industry .......................................................................................................2 Digital Media Industry ............................................................................................................. 3
I. Introduction and Methodology ................................................................................... 4 Employment Trends ................................................................................................................ 5 Location Quotients.................................................................................................................. 6 Economic Impact Analysis .......................................................................................................7 Interviews ............................................................................................................................... 9
II. Overview of the Motion Picture Industry................................................................... 10 Structure of the Industry ....................................................................................................... 10 Main Products....................................................................................................................... 11 Trends in the Feature Film Industry ........................................................................................ 12 Trends in the Television Production Industry .......................................................................... 14 Trends in the Commercial Production Industry ....................................................................... 16 Other Production Trends ....................................................................................................... 18 Economic Significance of Motion Picture Production.............................................................. 21
III. Louisiana’s Motion Picture Industry........................................................................... 27 Employment Trends ..............................................................................................................28 Economic Impact of Louisiana’s Motion Picture Industry ........................................................ 31 Cost Benefit Analysis ............................................................................................................. 34 Regional Interviews ............................................................................................................... 35
IV. Overview of Music Industry ....................................................................................... 37 Industry Trends ..................................................................................................................... 37 Genre ................................................................................................................................... 40 Consumer Demographics ...................................................................................................... 41
V. Louisiana’s Music Industry ......................................................................................... 43 Employment Trends ..............................................................................................................43 Economic Impact of Louisiana’s Music Industry ..................................................................... 45 Cost Benefit Analysis ............................................................................................................. 47 Regional Interviews ............................................................................................................... 48
VI. Overview of the Digital Media Industry..................................................................... 49 State of the Video Game Industry .......................................................................................... 51 Employment Trends ..............................................................................................................53 Workforce Development Efforts............................................................................................. 54 Gamers ................................................................................................................................. 55 Future of the Industry............................................................................................................ 56
VII. Louisiana’s Digital Media Industry............................................................................. 57 Employment Trends ..............................................................................................................57 Economic Impact of Louisiana’s Digital Media Industry .......................................................... 60 Cost Benefit Analysis ............................................................................................................. 64 Regional Interviews ............................................................................................................... 65
Economics Research Associates Project No. 18014 Page ii
VIII. Infrastructure Development in Louisiana................................................................... 66 Current Infrastructure............................................................................................................ 66 Proposed Infrastructure Development.................................................................................... 67 Economic Impact of Louisiana’s Infrastructure Development .................................................. 68 Cost Benefit Analysis ............................................................................................................. 70 Regional Interviews ............................................................................................................... 71
IX. Entertainment Industry Incentive Programs.............................................................. 72 Types of Incentives for Film Production .................................................................................. 72 Current U.S. Production Incentives......................................................................................... 74 States with Aggressive Film Incentive Programs...................................................................... 77 The Effectiveness of Film Incentives........................................................................................ 80 Other Incentives .................................................................................................................... 82
Appendix A – Overview of Louisiana’s Entertainment Legislation.................................... 85 Appendix B – Motion Picture Productions in Louisiana .................................................... 87
Economics Research Associates Project No. 18014 Page iii
Index of Tables Table 1 – Studio Production and Marketing Costs per Film (millions) ............................................. 13 Table 2 – Mini-Major Production and Marketing Costs per Film (millions) ...................................... 14 Table 3 – Non-Traditional Advertising Projects............................................................................... 17 Table 4 – Percent of Shooting Days by Domestic Location, 2002-2006 .......................................... 18 Table 5 – U.S. Motion Picture and Sound Recording Industry Employment (in thousands).............. 23 Table 6 – Mean Hourly Wage for Select Occupations in the U.S. Motion Picture Industry, 2007 ..... 23 Table 7 – Motion Picture Industry (NAICS 51211, 51212, 51219 and 7115) .................................. 29 Table 8 – Average Annual Employment in Motion Picture Industry in Louisiana ............................. 29 Table 9 – Employment Share and Location Quotients in Film Industry for Largest States, 2007 ...... 30 Table 10 – Top Location Quotients by State for Film Industry, 2007 .............................................. 31 Table 11 –Productions in Louisiana, 2002-2007 ............................................................................ 32 Table 12 – Summary of Motion Picture Projects in Louisiana.......................................................... 32 Table 13 – Certified and Non-Certified Spending on Motion Picture Productions in Louisiana......... 33 Table 14 – Benefits and Costs of the Motion Picture Tax Credits .................................................... 35 Table 15 – Music Sales by Format ................................................................................................. 37 Table 16 – U.S. Sales of Recorded Music (millions) ........................................................................ 38 Table 17 – Physical and Internet Sales in the U.S. .......................................................................... 39 Table 18 – U.S. Sales by Retail Outlet ............................................................................................ 40 Table 19 – Consumer Music Preference......................................................................................... 41 Table 20 – Consumer Demographics............................................................................................. 42 Table 21 – Music Industry (NAICS 5122 and 71113) ..................................................................... 44 Table 22 – Concentration of Employment in Music Industry, 2007 ................................................ 44 Table 23 – Top Location Quotients for Music Industry, 2007 ......................................................... 45 Table 24 – Certified Spending in Louisiana for Music Production ................................................... 46 Table 25 – Economic Impact of Louisiana’s Music Production Industry .......................................... 47 Table 26 – Benefits and Costs of the Sound Recording Tax Credit Program .................................... 48 Table 27 – Economic Impact of the Entertainment Software Industry in Select States, 2006........... 54 Table 28 – Digital Media Industry (NAICS 5112 and 541511) ........................................................ 59 Table 29 – Concentration of Employment in Digital Media, 2007 .................................................. 60 Table 30 – Top Location Quotients for Digital Media, 2007........................................................... 60 Table 31 – Approved Digital Media Tax Credits.............................................................................. 61 Table 32 – Pending Digital Media Tax Credits ................................................................................ 62 Table 33 – NAICS Classification of Companies Applying for Digital Media Tax Credits .................... 62 Table 34 – Economic Impacts of Spending Associated with Digital Media Tax Credits .................... 64 Table 35 – Benefits and Costs of the Digital Media Tax Credits ...................................................... 65 Table 36 – Film Production Facilities in Louisiana........................................................................... 66 Table 37 – Sound Recording Studios in Louisiana.......................................................................... 67 Table 38 – Proposed Infrastructure Development .......................................................................... 68 Table 39 – Certified Infrastructure Projects in Louisiana ................................................................. 69 Table 40 – Economic Impacts of Certified Physical Infrastructure Projects....................................... 70 Table 41 – Benefits and Costs of the Infrastructure Tax Credits ...................................................... 71 Table 42 – Types of Direct Film Production Incentives .................................................................... 73 Table 43 – Current State Incentive Programs ................................................................................. 75 Table 44 – U.S. States with Aggressive Film Incentives................................................................... 77 Table 45 – Strengths and Constraints of Aggressive Film Incentives ............................................... 79 Table 46 – Summary of Existing U.S. Film Incentive Programs, 2008.............................................. 81 Table 47 – U.S. States with Digital Media and Music Related Incentives ......................................... 83
Economics Research Associates Project No. 18014 Page iv
Index of Figures Figure 1 – Feature Films Released in the U.S., 1990-2007.............................................................. 13 Figure 2 – Home Video Game and Toy Sales in the U.S., 1980-1999 ............................................. 50 Figure 3 – U.S. Computer and Video Game Sales, 1996-2007 ....................................................... 52 Figure 4 – Sales in the Video Game Industry, 2007........................................................................ 52 Figure 5 – Film Tax Incentives by State .......................................................................................... 82
Economics Research Associates Project No. 18014 Page v
General & Limiting Conditions
Every reasonable effort has been made to ensure that the data contained in this report are accurate
as of the date of this study; however, factors exist that are outside the control of Economics
Research Associates and that may affect the estimates and/or projections noted herein. This study
is based on estimates, assumptions and other information developed by Economics Research
Associates from its independent research effort, general knowledge of the industry and information
provided by and consultations with the client and the client's representatives. No responsibility is
assumed for inaccuracies in reporting by the client, the client's agent and representatives, or any
other data source used in preparing or presenting this study.
This report is based on information that was current as of January 2009 and Economics Research
Associates has not undertaken any update of its research effort since such date.
Because future events and circumstances, many of which are not known as of the date of this study,
may affect the estimates contained therein, no warranty or representation is made by Economics
Research Associates that any of the projected values or results contained in this study will actually
be achieved.
Possession of this study does not carry with it the right of publication thereof or to use the name of
"Economics Research Associates" in any manner without first obtaining the prior written consent of
Economics Research Associates. No abstracting, excerpting or summarization of this study may be
made without first obtaining the prior written consent of Economics Research Associates. This
report is not to be used in conjunction with any public or private offering of securities, debt, equity, or
other similar purpose where it may be relied upon to any degree by any person other than the client,
nor is any third party entitled to rely upon this report, without first obtaining the prior written consent
of Economics Research Associates. This study may not be used for purposes other than that for
which it is prepared or for which prior written consent has first been obtained from Economics
Research Associates.
This study is qualified in its entirety by and should be considered in light of, these limitations,
conditions and considerations.
Economics Research Associates Project No. 18014 Page 1
Executive Summary
The Louisiana Economic Development Department (LED) hired Economics Research Associates
(ERA) in Chicago, an AECOM company, to conduct an analysis of the State’s motion picture, sound
recording and digital media incentive programs and related economic development. Over the course
of this analysis, ERA evaluated national and international trends in the target industries, reviewed
similar incentive packages and structures of other states, estimated, with input from LED and the
State’s Legislative Fiscal Office Chief Economist, the impacts and costs of the incentive programs,
conducted interviews of state and regional film offices within Louisiana and provided insights into the
level of infrastructure development in the state.
In general, Louisiana’s film incentive program, enacted in 2002, appears to be growing apace with
recent historical trends. Previous efforts at workforce and infrastructure development are beginning
to pay dividends, and new businesses have been founded and are moving to the state from
elsewhere. Independent films and low budget features are a valuable product of emphasis and high
budget commercial productions are being pursued by some regional film offices. In ERA’s
experience, television and cable shows have the potential to generate significant economic impacts
due to their steady and intensive use of local resources.
The digital media and sound recording industries are in earlier stages of development compared to
the state’s film industry. Current efforts in both are oriented towards the early stage workforce and
infrastructure development issues which met with success in supporting the film industry. The
ultimate evolution of these industries in the state will be heavily influenced by regional business
development focus and efforts.
Motion Picture Industry
Since the State has enacted the Motion Picture Incentive Act in 2002, growth in this segment of the
economy has been robust. Since the program began through 2008, there have been 185 projects
produced in Louisiana. This report focused on expenditures associated with these productions that
occurred from 2005 through 2007. In 2007, ERA estimates that these expenditures were
approximately $429 million resulting in a total economic impact to the state of $763 million.
In ERA’s regional interviews a series of questions relating to current trends and performance of the
film industry revealed that throughout most regions of the state, movie of the week (MOW)
Economics Research Associates Project No. 18014 Page 2
production seems to be less active recently than historically. Current trends tend to favor low
budget features and independent productions – a niche which can remain competitive for the state,
and may be a valuable area of focus moving forward. Many of the interviewees and film office
managers indicated that relatively high budget commercial productions, and to some extent
television, are potential areas of focus and emphasis moving forward.
Several areas of the state (most noticeably the northwest and south/ southeast portions) have
experienced an influx of new and relocated businesses from outside of Louisiana. While some of
these businesses are production based, most are supportive to the production process and provide
ancillary services. Additionally, businesses which cater primarily to local markets (food services,
consumer services, etc.) have learned to package their products and service to the needs of
productions have experienced a notable increase in business volume.
Recent improvements in film infrastructure have been significant throughout the state and the recent
infrastructure tax credit appears to have been a primary enabler of these improvements. Shreveport
likely experienced the most dramatic improvement in infrastructure and Baton Rouge has also
benefited noticeably. In the New Orleans area there are currently several new soundstages under
development according to the Louisiana Economic Development Department – two of which are
purpose built. In addition, there are other projects (studios and post production facilities) which were
in the conceptual stage but unable to meet the sunset provision for infrastructure tax credits.
Sound Recording Industry
After the documented success of state incentive programs to grow and develop the film industry, a
similar package was created to jumpstart the sound recording industry. Though still much smaller
than the motion picture industry, there are proven results of the success of this program in the state
as well. In 2006, there was only one certified project in Louisiana but that increased to 5 in 2007 and
15 in 2008. The $340,300 spent on 5 certified sound recording productions in Louisiana during 2007
generated a total economic impact of more than $576,700 throughout the state economy. According
to the LED, preliminary estimates for 2008 indicate significant growth in the industry.
Generally there are fewer resources, efforts and organized processes focused on the current music
incentive program throughout the various regions of the state when compared to the motion picture
incentive program. The recent tax credit program does seem to have enabled some growth in the
Economics Research Associates Project No. 18014 Page 3
industry which may not have been achievable otherwise, however, for most involved in the industry
live performance is the most significant contribution to personal income. Thus, it is generally
believed that a program to support live music performance could have a more direct and significant
impact on personal and industry wages. The recent live performance legislation passed by the State
has the potential to address this issue.
Digital Media Industry
The intention of the Digital Interactive Media Act, enacted in 2005, is to grow and develop the video
game industry in Louisiana. As of January 2009, 7 companies have applied for the credits and four
applications have been approved and certified. The $1.2 million in Louisiana spending on qualified
projects during 2007 yielded a total economic impact of $2.1 million in the state.
While the digital media credit and focus in Louisiana is new compared to the State’s film program,
there are emerging initiatives targeted to this segment. Focus products at this time are generally
geared towards video games and interactive professional software applications (GIS, oil and gas
exploration applications, etc.). An important emphasis in current efforts related to digital media are
workforce and program development. Much like previous efforts in film crew base development, it
is well recognized that digital media will require a similar effort in workforce and infrastructure
development.
An important and visible success in this area has been the agreement of Entertainment Arts (EA)
Sports to partner with Louisiana State University (LSU) in Baton Rouge to create a new testing
facility, with the potential for an expanded relationship in the future. This sort of relationship is a
highly beneficial use of the existing tax credit program, and one that offers the potential for mutual
benefit between the city of Baton Rouge, LSU and EA Sports.
Economics Research Associates Project No. 18014 Page 4
I. Introduction and Methodology
Economics Research Associates (ERA), an AECOM company, was contracted by the Louisiana
Economic Development Department (LED) to define and measure the economic impact of various
entertainment industries receiving economic incentives in Louisiana, as well as review trends in the
film, music and digital media industries. ERA researched available data on the industries in Louisiana
and nationally and conducted interviews to supplement research data and information. In this
section, we detail the data sources and methodologies used in this process.
ERA’s first task was to identify the distinct segments of Louisiana’s entertainment industry.
Louisiana is targeting the development of the motion picture, sound recording and digital media
industries through tax credit incentive packages. A summary of the legislative history can be found
in Appendix A. Each of the profiled industries is defined below using the North American Industry
Classification System (NAICS). These industry definitions differ from those used in ERA’s previous
analysis when the film industry was the sole focus of study. Given some overlapping NAICS
definitions between motion picture, sound recording and digital media, some NAICS codes which
were previously identified as part of the film industry are now assigned to the digital media or music
industries if the core classification was better aligned with that industry than film. This will yield
slightly different numbers from the previous analysis.
Film Industry
NAICS 51211 Motion Picture and Video Production
This industry comprises establishments primarily engaged in producing, or producing and
distributing motion pictures, videos, television programs or television commercials.
NAICS 51212 Motion Picture and Video Distribution
This industry comprises establishments primarily engaged in acquiring distribution rights and
distributing film and video productions to motion picture theaters, television networks and
stations and exhibitors.
NAICS 51219 Postproduction Services and Other Motion Picture and Video Industries
This industry comprises establishments primarily engaged in providing postproduction services
and other services to the motion picture industry, including specialized motion picture or video
postproduction services, such as editing, film/tape transfers, titling, subtitling, credits, closed
captioning and computer-produced graphics, animation and special effects, as well as developing
and processing motion picture film.
Economics Research Associates Project No. 18014 Page 5
NAICS 7115 Independent Artists, Writers and Performers
This industry comprises independent (i.e., freelance) individuals primarily engaged in performing
in artistic productions, in creating artistic and cultural works or productions, or in providing
technical expertise necessary for these productions. This industry also includes athletes and
other celebrities exclusively engaged in endorsing products and making speeches or public
appearances for which they receive a fee.
Music Industry
NAICS 5122 Sound Recording Industries
This industry group comprises establishments primarily engaged in producing and distributing
musical recordings, in publishing music, or in providing sound recording and related services.
NAICS 71113 Musical Groups and Artists
This industry comprises groups primarily engaged in producing live musical entertainment
(except theatrical musical or opera productions) as well as independent (i.e., freelance) artists
primarily engaged in providing live musical entertainment. Musical groups and artists may
perform in front of a live audience or in a studio and may or may not operate their own facilities
for staging their shows.
Digital Media Industry
NAICS 5112 Software Publishers
This industry comprises establishments primarily engaged in computer software publishing or
publishing and reproduction. Establishments in this industry carry out operations necessary for
producing and distributing computer software, such as designing, providing documentation,
assisting in installation and providing support services to software purchasers. These
establishments may design, develop and publish, or publish only.
NAICS 541511 Custom Computer Programming Services
This industry comprises establishments primarily engaged in writing, modifying, testing and
supporting software to meet the needs of a particular customer.
Employment Trends
There are several ways to measure the size of an industry, but perhaps the simplest is through
employment. However, due to the elastic nature of employment in the entertainment industries,
getting a precise measure of how many people are working in each profiled industry during the year
Economics Research Associates Project No. 18014 Page 6
is difficult. Motion picture production in particular is characterized by a high level of contingent and
transient employment. Therefore, to best understand employment trends in Louisiana’s
entertainment industries, ERA used data from the Quarterly Census of Employment and Wages
(QCEW). This data, formerly known as ES202 data, is used by the Bureau of Labor Statistics and
Bureau of Economic Analysis to provide accurate and comprehensive reporting for virtually every
segment of the economy. These data are collected in a uniform manner as required by federal law
and reported monthly. State and local governments use this data set to compute rates, project
income tax revenues, study employment history and labor markets.
The QCEW data includes employment for the entire industry for every worker who receives a
paycheck during the pay period that includes the 12th of the month, which generates a W-2 form and
is therefore covered by unemployment insurance. Typically, between 85 and 95 percent of all
employees are covered by unemployment insurance in a given state. This includes part-time,
temporary and contingent workers. However, individuals who are owners or proprietors of a
business enterprise, who are paid through distribution of payments or through operation of an
unincorporated business, will not be covered by QCEW.
The QCEW data includes the number of firms, monthly employment and total wages organized by
North American Industry Classification System (NAICS). Data may be suppressed for a detailed
industry group if there are less than three firms reporting information in that particular NAICS or if 80
percent of total employment comes from one or more unit.
Location Quotients
In addition to employment trends, ERA examined the strength of these industries relative to other
states using location quotients. Location quotients compare the distribution of industry in a state
relative to its overall employment distribution. It assumes that employment in each industry is
distributed in the same representation as the overall state. For example, in 2007, 1.3 percent of the
entire national workforce was employed in Louisiana. If employment in a particular industry is
allocated in the same manner, then the location quotient for that industry in Louisiana would be 1. If
there is an overrepresentation of an industry in Louisiana (more than 1.3% of total national
employment in that industry during 2007), the associated location quotient would be greater than 1.
Therefore, location quotients measure the relative concentration of different industries in specific
localities relative to the national total. The meaning of location quotient values follows:
Economics Research Associates Project No. 18014 Page 7
LQ > 1.0 means than an industry is more concentrated in the state than in the nation.
LQ = 1.0 means that an industry is equally concentrated in the state as in the nation.
LQ < 1.0 means an industry is less concentrated in the state than in the nation.
A concentrated (high) location quotient means that a given industry is represented more in the home
state than one would expect, given its total level of employment.
Economic Impact Analysis
Although employment is a valid measure of industry size, it does not capture the full economic
impact of an industry on the economy as a whole. The U.S. economy functions as an interlocking
system where changes in supply and demand for one industry affect supply and demand in others.
Economic impact analysis is the tool used to measure the economic activity occurring within a
defined geographic region as a result of an initial change in the economy. The initial economic
stimulus is referred to as the direct impact. The indirect impacts are generated as a result of the
purchases of the identified industry. Finally, the induced impacts occur when employees spend their
earnings in the economy on goods and services. For example, a motion picture production company
comes to Louisiana to make a movie. The direct impact includes all the expenditures by the motion
picture production company while filming in Louisiana on things like supplies, rent, technology and
the like. Companies supplying those things to the production company in turn buy goods and
services from other companies. This is the indirect impact which acts as a further economic
stimulus. In addition, the individuals earning wages will have additional spending power, as they re-
spend part of their wages on goods and services in state. This is the induced impact.
The results of an economic impact analysis are reported in the following ways:
Output: This is the total value of goods and services produced across all industry sectors and all
stages of production within a defined geographic region.
Employment: This represents the number of jobs needed to support the given economic activity
across all sectors, often referred to as “jobs created.” It includes all wage and salary employees,
both part- and full-time, as well as self-employed jobs. It is measured in annual average jobs.
Earnings: The total payroll costs (including benefits) of each industry. It includes the wages and
salaries of workers who are paid by employers, as well as benefits such as health and life
insurance, retirement payments and non-cash compensation. It also includes proprietary income
received by self-employed individuals.
Economics Research Associates Project No. 18014 Page 8
Total Value Added: Value added refers to that portion of the value of total output that was
actually created by the economic activity in an area and/or industry. It is the difference between
the value of goods produced and the cost of materials and or supplies that are used in producing
them. It includes wages, proprietary income, other property type income and indirect business
taxes. Other property type income is comprised of rents, royalties, dividends and profits.
Indirect business taxes include excise taxes, property taxes, fees, licenses and sales taxes paid
by businesses that occur during the normal operation of businesses but do not include taxes on
profit or income.
Fiscal Impacts: These are the revenues, both taxes and fees, generated at the federal, state and
local levels resulting from the economic activity.
ERA measured the economic impact of the entertainment industry in Louisiana using IMPLAN, a
software program produced by the Minnesota Implan Group and first developed by the USDA
Forestry Service to perform impact analysis for planning. IMPLAN’s database includes state-level
data for 528 industrial sectors and the ways in which those sectors interact with each other,
households and government agencies. IMPLAN is widely used across the United States by
government and private entities to prepare location-specific economic impact analysis. The
economic multipliers found in IMPLAN are developed using Input-Output tables that provide
information on all production activities and transactions between producers and consumers in an
economy. The multipliers measure the re-spending of dollars in an economy and are used to
calculate direct and induced impacts, the ‘multiplier effect.’ Data specific to Louisiana was used in
this analysis.
To determine the economic impact of the profiled entertainment industries, ERA uses data from the
Office of Entertainment Industry Development (OEID), within the Louisiana Department of Economic
Development (LED). This office tracks the amount of money spent in Louisiana by companies that
have applied for state incentives for film, music or digital media production. Only the dollars spent in
Louisiana are considered the economic stimulus. Only after these dollars are certified independently
are tax credits awarded. The impacts from 2005 through 2007 are presented in this report. The
2008 certification information for Louisiana productions is incomplete, therefore the associated
impacts have not been included in this report.
Finally, it should be noted that economic impact results in this report differ from previously reported
estimates for a few reasons. As discussed above, ERA redefined the industries and separated the
associated impacts. Also, inaccuracies resulted from incorrect input information provided by
Economics Research Associates Project No. 18014 Page 9
previous entertainment office leadership. In economic impact analysis, it is important to include only
those expenditures that occurred in the region being studied. Unfortunately, because previous data
provided to ERA represented all production budget spending as opposed to just Louisiana spending,
reported expenditures were incorrect. As a result, the associated economic impacts, including the
reported number of jobs, were inflated since only a portion of the total production budgets were
spent in the state. For this report, ERA and LED staff have worked very closely to provide a revised,
accurate history for project spending and associated impacts within the state from 2005 through
2007. This analysis is the latest and best assessment from that collaborative effort. It should be
noted that the economic impacts for 2005 are lower than those previously reported.
Interviews
And lastly, as part of the analytical process ERA conducted a series of interviews with the purpose of
detailing recent trends, marketing and operational emphasis of different incentive programs and
other issues such as workforce development and infrastructure capacity. ERA interviews were
focused on 1) regional film, music and digital media offices and participating organizations within the
State and 2) film offices from other states around the country with aggressive film incentive
programs.
Economics Research Associates Project No. 18014 Page 10
II. Overview of the Motion Picture Industry
To assess Louisiana’s competitive position in the motion picture industry, it is first necessary to look
at relevant trends in the national industry. The “motion picture industry” is a broad term that
includes feature film and television product, as well as music videos, commercials, business,
industrial and government films. More recently, it includes short film products made for distribution
on the Internet and other mobile technology (i.e., cell phones, video iPods, etc.). The purpose of this
section is to evaluate the characteristics of film, television, video and commercial industries and
other technologies, with the intention of pinpointing those trends that enhance the potential of the
industry to grow in Louisiana. The following section will discuss the economic relevance and
impacts, both direct and indirect, of the motion picture industry in Louisiana.
Structure of the Industry
The motion picture industry has historically been dominated by several large studios based primarily
in Los Angeles. These studios have produced much of the world’s film and television product.
Today, with the growth in other mediums of entertainment such as cable television and the Internet,
many independent small and medium-sized companies have been established to meet this growing
demand in areas outside of Los Angeles and New York.
The studio majors consist of six diversified media conglomerates:
Sony/Sony Pictures
New Corporation/Fox Filmed Entertainment (20th Century Fox)
The Walt Disney Company/Walt Disney and Touchstone Pictures
Time Warner/Warner Bros.
Viacom/Paramount Pictures
General Electric/NBC Universal
The majority of today’s “Big Six” companies include formerly independent companies that have
been acquired under the corporate umbrella. The majors have also established specialty divisions to
concentrate on art house pictures. Examples include Paramount Vantage and Fox Atomic.
The major studios today are primarily backers and distributors of films whose actual production is
largely handled by independent companies. There are thousands of small, independent production
and/or distribution companies throughout the U.S. The two largest independent
Economics Research Associates Project No. 18014 Page 11
producers/distributors are Lionsgate and The Weinstein Company, which are sometimes referred to
as “mini-majors.”
Main Products
The following is a brief overview of relevant trends in the visual (film, television, commercials, etc.)
production industry. Broadly speaking, there are five to six types of products which are part and
parcel of three main production and distribution processes. The following are the most common
products created in the visual production process. With the exception of feature films, industry wide
data on television and industrial products, such as total volume of productions produced each year, is
not available:
Feature Films can be divided into higher budget “blockbuster” films and lower budget feature
films. Blockbusters have budgets typically ranging from $30 million to $100+ million, whereas
smaller budget features have budgets closer to a $2 to $20 million range per film. Daily shooting
rates run as high as several thousand (or tens of thousands) of dollars per day. Both feature film
products are typically intended for theatrical distribution (either small, or large-scale), though they
derive significant income from repurposing for T.V., DVD and other sales;
Movies of the Week (MOWs) are “made for T.V.” movies. They are more cost sensitive than
most other types of film product and typically have modest budgets ranging from several
hundred thousand dollars to a few million dollars. In many ways, MOW productions are similar
to low budget features in their cost sensitivity and common production expenditures;
Television Series are perhaps the best source of steady income in the industry. Each half-hour
episode takes an average of four days to shoot, while a weekly hour series takes approximately
one week of shooting time, part of which is spent on location. The average price of an hour-long
network series ranges as much as $2 million per episode and one-half-hour sitcoms can cost as
much as $1 million per episode. A television series consists of 26 episodes. A single television
series could be expected to use 150+ days per year in the location where it is produced;
Television Pilots for prospective series are similar to MOWs. Since their budgets are low, they
are extra-sensitive to costs;
Music Videos/Short Form also have very low budgets and thus are sensitive to costs; as new
distribution platforms emerge (e.g., Internet, iPods), the demand for these types of productions
is likely to increase. Production costs typically range from several thousand to several hundred
thousand dollars;
Economics Research Associates Project No. 18014 Page 12
Industrial (Commercials & Communications/Training Videos) have smaller budgets, but for local
businesses, can produce higher margin returns per unit of production. Commercials are typically
shot in areas with high concentrations of industry (e.g. Los Angeles, New York, etc.), though
regional commercials are shot throughout the U.S. for local/regional companies. Product costs
are typically in the range of a few hundred thousand dollars.
These types of products are usually created for one of two main purposes – theater distribution or
television. Films released to theaters are often later repurposed and sold in television and home
entertainment markets (DVD, etc.). The television market, which includes shows, commercials,
music videos, etc., is supported by advertising sales and subscription costs.
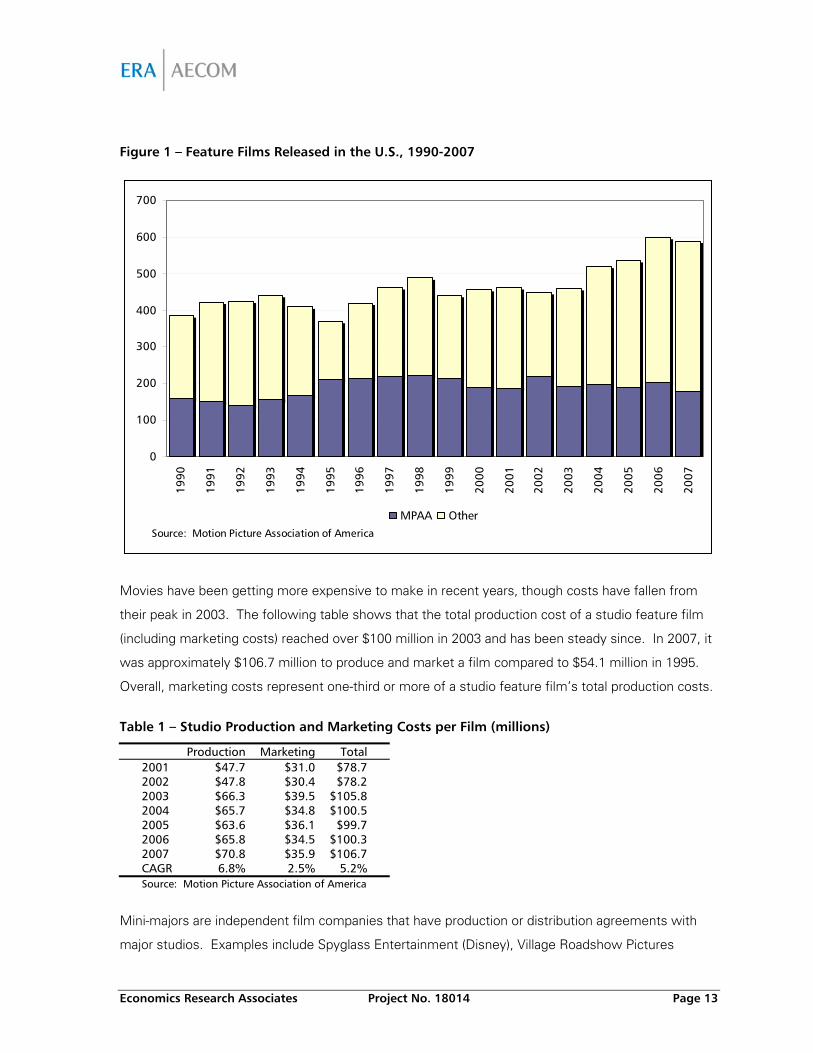
Trends in the Feature Film Industry
The movie industry is experiencing some growing pains. As independent films become more
popular and as DVDs penetrate into more and more households, major studios’ core business is not
threatened, however substantial operational changes may be needed to remain competitive. As
shown in the chart below, the number of new films being released by major Hollywood Studios
(referred to as “MPAA” studios) as compared to other feature releases, has stayed relatively flat
since 2000, with the exception of 2002 (220 films). Comparing growth in the number of studio
(“MPAA”) versus other feature films between 1990 and 2007, growth has been in “other features” –
which in this case is both mini-majors (owned by the studios) and independent films. Over this
period, the number of studio films increased by only 13 percent, compared to 81 percent for other
features. These other features often have different production and distribution characteristics than
larger ‘blockbuster’ movies. Overall compound annual growth (CAGR) in total released features
between 1990 and 2007 is 2.5 percent, with MPAA features registering annual growth of under 1
percent and smaller, non-MPAA and independent features growing at an annual rate of
approximately 3.6 percent.
Economics Research Associates Project No. 18014 Page 13
Figure 1 – Feature Films Released in the U.S., 1990-2007
0
100
200
300
400
500
600
700
1990
1991
1992
1993
1994
1995
1996
1997
1998
1999
2000
2001
2002
2003
2004
2005
2006
2007
Source: Motion Picture Association of America
MPAA Other
Movies have been getting more expensive to make in recent years, though costs have fallen from
their peak in 2003. The following table shows that the total production cost of a studio feature film
(including marketing costs) reached over $100 million in 2003 and has been steady since. In 2007, it
was approximately $106.7 million to produce and market a film compared to $54.1 million in 1995.
Overall, marketing costs represent one-third or more of a studio feature film’s total production costs.
Table 1 – Studio Production and Marketing Costs per Film (millions)
Production Marketing Total 2001 $47.7 $31.0 $78.7 2002 $47.8 $30.4 $78.2 2003 $66.3 $39.5 $105.8 2004 $65.7 $34.8 $100.5 2005 $63.6 $36.1 $99.7 2006 $65.8 $34.5 $100.3 2007 $70.8 $35.9 $106.7 CAGR 6.8% 2.5% 5.2%
Source: Motion Picture Association of America
Mini-majors are independent film companies that have production or distribution agreements with
major studios. Examples include Spyglass Entertainment (Disney), Village Roadshow Pictures
Economics Research Associates Project No. 18014 Page 14
(Warner Bros.) and the Weinstein Company (MGM). Marketing costs for these productions are
taking up an increasing share of the total costs to produce the film as shown in the table below. In
2001, marketing accounted for 23 percent of a mini-major film’s budget (compared to 39 percent for
a studio feature). In 2007, that figure reached 34 percent, which is comparable for that of a studio-
produced feature. Thus, non-studio films now appear to have a similar share devoted to marketing,
as do films produced by the major studios, which is likely due to the increasingly competitive nature
of the industry, especially with respect to securing theatrical distribution.
Table 2 – Mini-Major Production and Marketing Costs per Film (millions)
Production Marketing Total 2001 $31.5 $9.5 $41.0 2002 $34.0 $11.2 $45.2 2003 $46.9 $15.1 $62.0 2004 $29.0 $11.4 $40.4 2005 $23.5 $15.2 $38.7 2006 $30.7 $17.8 $48.5 2007 $49.2 $25.7 $74.9 CAGR 7.7% 18.0% 10.6%
Source: Motion Picture Association of America
The broader implications of rising production and marketing costs mean that studios and producers
alike are constantly looking for ways to cut production costs. This, in turn, has led to the creation of
film incentives in various U.S. states, particularly within the past two years. Also, the recent
devaluation of the U.S. dollar has made former production centers such as Canada and the United
Kingdom less attractive to producers from an economic standpoint.
In the past, independent filmmakers have struggled to finance new productions and pay for a film’s
distribution, because they compete with large motion picture production companies. However, as
will be discussed further, digital technology is lowering the barriers to entry.
Trends in the Television Production Industry
The TV production and distribution industry in the U.S. includes approximately 500 companies with
combined annual revenue of $13 billion. Major companies include NBC Universal, CBS Paramount,
Disney-ABC, Fox Television Studios, Warner Bros. Television Group and Sony Pictures Television.
As a result, the television industry is highly concentrated, with the 50 largest companies accounting
for 80 percent of the industry revenue. Most firms, however, are small, privately held production
Economics Research Associates Project No. 18014 Page 15
companies. Producing television shows is expensive and costs occur well in advance of revenue.
An hour-long television network show can cost between $1 and $2 million to produce.
In addition to the recent writer’s strike which shut down scripted television for 100 days in 2008,
several major trends have influenced the volume and patterns of television production in recent
years, namely the demise of the movie-of-the-week (“MOW”) genre, the rise of specialty cable
television and the proliferation of reality television.
The Decline of the MOW Genre
Fewer numbers of television movies of the week (MOWs) are being produced throughout North
America. Many U.S. networks have cut back their TV movie orders and some like Showtime have
revised their programming strategies to funnel more resources into TV series. In recent years, the
MOW has been replaced by the emergence of reality television (see below). These types of
productions are low, unscripted programs that are frequently shot in either Los Angeles or an exotic
location. Operating profit from the entertainment sector of Time Warner declined significantly from
80 percent of the total in 2004 to only 44 percent in 2007. The reason for the decline of interest in
MOWs is speculative. One such explanation is involves changing viewer attitudes, in addition to
habits toward formats (i.e. attention span). Yet at this point it is difficult to determine whether this
genre is dead or in a period of dormancy.
The Rise of Specialty Cable
The rise of specialty cable has increased the demand for television product. According to the
National Cable & Telecommunications Association (NCTA), there are just under 400 cable networks
throughout the U.S. Some of these networks produce their own product, but the majority of them
purchase some or most of their shows from outside producers. Since cable programming services
can no longer just showcase movies that have already been on home video and in pay-per-view,
cable television channels are now spending heavily on original programming in their efforts to attract
audiences on the increasingly crowded cable systems. The number of digital cable subscribers has
grown at a rapid rate. According to the NCTA, the number of digital cable customers increased from
12.2 million during the second quarter of 2001 to 38.3 million in 2008. This represents an increase of
over 200 percent in almost 7 years.
Reality Television
In 2000, the success of the reality series, Survivor and subsequent contest-style reality series directly
influenced the current trend toward reality programming. A typical one-hour drama on one of the six
Economics Research Associates Project No. 18014 Page 16
American commercial television networks averages around $2 million an episode. Studios often lose
money on the first run of a show, but recoup that cost by selling the show for syndication. The
appeal of reality television is that the shows are relatively inexpensive compared to regular dramas.
Reality TV shows can be produced for considerably less, approximately $400,000 to $1 million per
one-hour episode. The reasons are simple, namely such shows have no regular cast to pay and
often have a minimal writing staff. In addition, they can sometimes save on other production costs
by using preexisting homes or other means to avoid expensive set construction and labor costs. The
downside is that reality programs have no real syndication potential.
Reality television has also impacted secondary production centers throughout North America,
especially “traveling shows” that shoot various episodes outside of the major production centers on
location in areas like Louisiana. Many of these shows bring their own crew base, but some will hire
local crew as well. Reality television shows that are shot on soundstages, however, are still largely
filmed in Los Angeles. According to FilmL.A., Inc., an organization that coordinates and processes
permits for on-location production in the Los Angeles region, among television programs produced in
the metro are, more than half of all permitted production days for television programming were spent
on reality television shows in 2007.
Television Networks as Feature Film Producers
In recent years, television networks have become increasingly involved in the feature film business.
As an example, MSNBC just announced that they are creating a special division, MSNBC Films,
which will serve as a financing vehicle for feature-length documentaries. MSNBC now commissions
dock-style programming.
Trends in the Commercial Production Industry
In comparison to film and television productions, a far greater number of commercial productions are
produced each year. Actual or estimates of the number of commercial productions made by U.S.
companies/producers are not available. But to demonstrate the scale of commercial production in
the U.S. compared to film and television production, the MPAA reported a total of 520 total feature
films produced in 2004. That same year, the American Association of Advertising Agencies (AAAA)
reported the findings of nearly 1,282 national commercials (excluding local and regional ones) among
only twenty agencies and branch offices that participated in their survey. This figure excludes
thousands of regional and local commercials as well, in addition to national commercials produced by
Economics Research Associates Project No. 18014 Page 17
agencies that did not participate. In other words, the number of total commercial productions made
by U.S. companies at both the national, regional and local levels, is likely in the many thousands.
Types of Commercial Productions
At this time, broadcast television remains the dominant medium for advertising, constituting an
estimated $9 billion annual market. The average cost of a 30-second TV commercial production is
approximately $300,000. This represents a 12 percent decline from the average cost in 2005.
The advertising landscape and commercial production are changing rapidly, with traditional 30-second
television spots and print campaigns being replaced by other forms of advertising. The Association
of Independent Commercial Producers (AICP), a group of commercial production companies whose
members account for approximately 85 percent of all domestic commercials aired nationally, has
commissioned member studies to track trends in commercial production in years 2002, 2003, 2005,
2006 and 2007. An on-line survey was conducted in August 2007, in which 155 members completed
an interview. The AICP reports that approximately 67 percent of surveyed members produced “non-
traditional advertising” outside of traditional television commercials, with the most common format
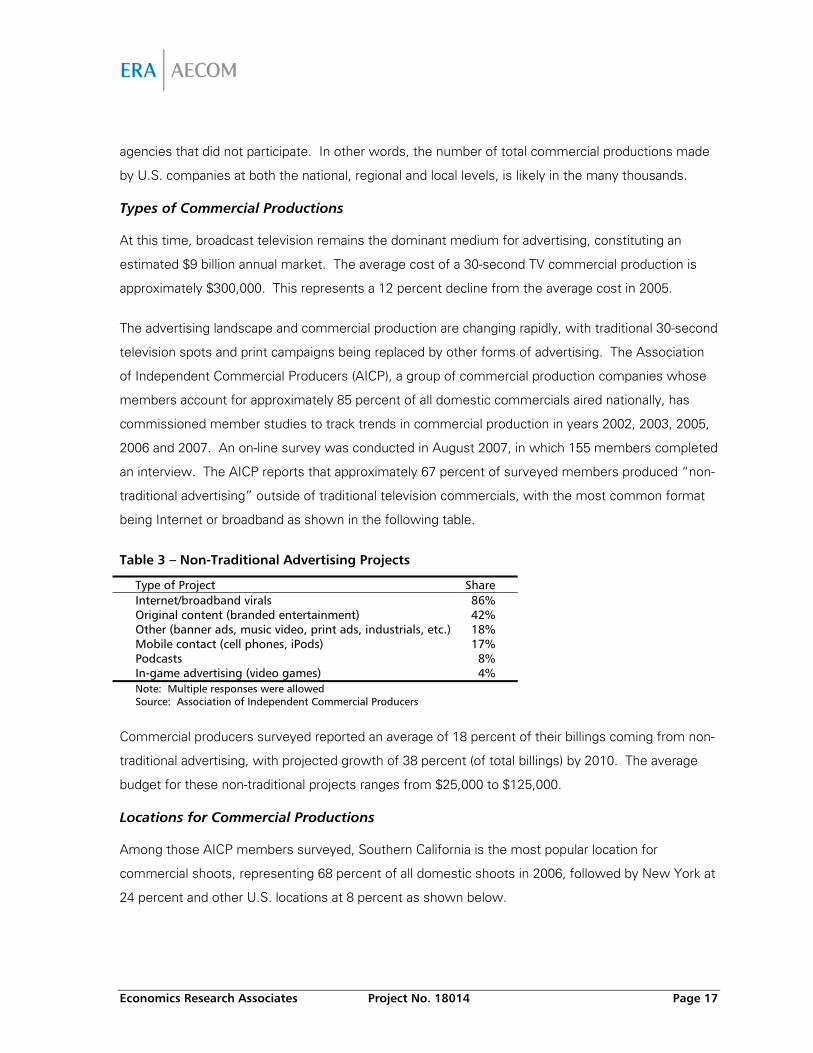
being Internet or broadband as shown in the following table.
Table 3 – Non-Traditional Advertising Projects
Type of Project Share Internet/broadband virals 86% Original content (branded entertainment) 42% Other (banner ads, music video, print ads, industrials, etc.) 18% Mobile contact (cell phones, iPods) 17% Podcasts 8% In-game advertising (video games) 4% Note: Multiple responses were allowed
Source: Association of Independent Commercial Producers
Commercial producers surveyed reported an average of 18 percent of their billings coming from non-
traditional advertising, with projected growth of 38 percent (of total billings) by 2010. The average
budget for these non-traditional projects ranges from $25,000 to $125,000.
Locations for Commercial Productions
Among those AICP members surveyed, Southern California is the most popular location for
commercial shoots, representing 68 percent of all domestic shoots in 2006, followed by New York at
24 percent and other U.S. locations at 8 percent as shown below.
Economics Research Associates Project No. 18014 Page 18
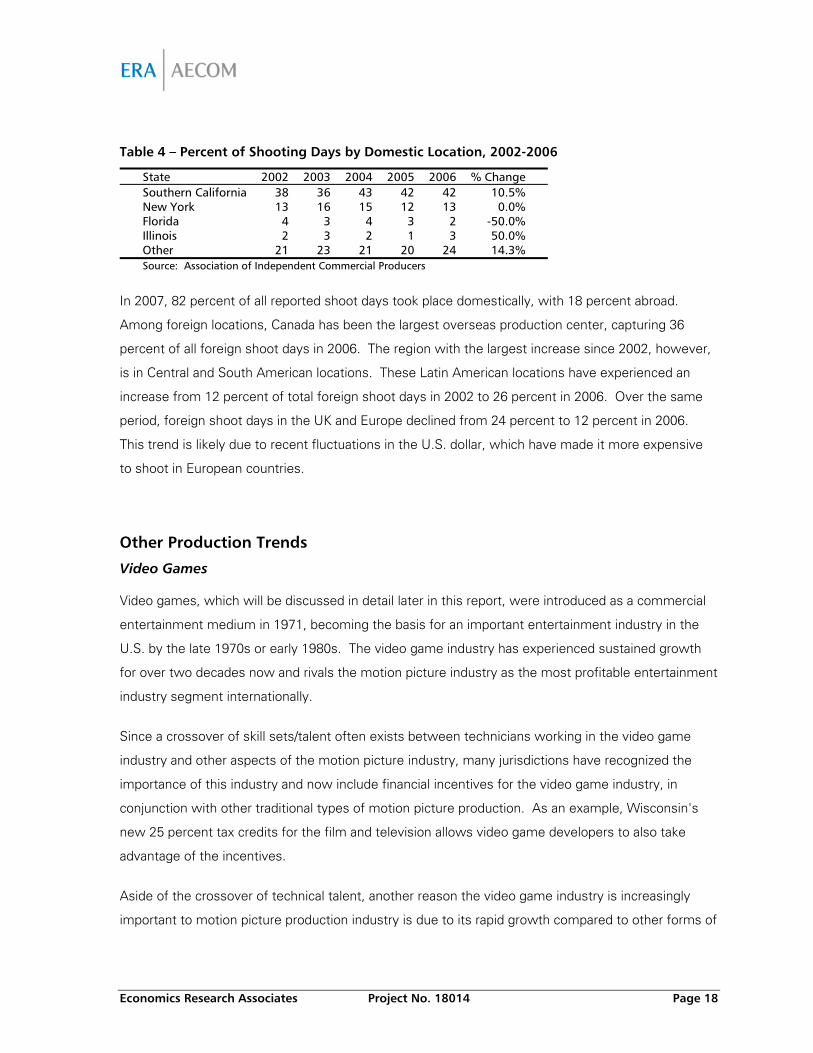
Table 4 – Percent of Shooting Days by Domestic Location, 2002-2006
State 2002 2003 2004 2005 2006 % Change Southern California 38 36 43 42 42 10.5% New York 13 16 15 12 13 0.0% Florida 4 3 4 3 2 -50.0% Illinois 2 3 2 1 3 50.0% Other 21 23 21 20 24 14.3% Source: Association of Independent Commercial Producers
In 2007, 82 percent of all reported shoot days took place domestically, with 18 percent abroad.
Among foreign locations, Canada has been the largest overseas production center, capturing 36
percent of all foreign shoot days in 2006. The region with the largest increase since 2002, however,
is in Central and South American locations. These Latin American locations have experienced an
increase from 12 percent of total foreign shoot days in 2002 to 26 percent in 2006. Over the same
period, foreign shoot days in the UK and Europe declined from 24 percent to 12 percent in 2006.
This trend is likely due to recent fluctuations in the U.S. dollar, which have made it more expensive
to shoot in European countries.
Other Production Trends
Video Games
Video games, which will be discussed in detail later in this report, were introduced as a commercial
entertainment medium in 1971, becoming the basis for an important entertainment industry in the
U.S. by the late 1970s or early 1980s. The video game industry has experienced sustained growth
for over two decades now and rivals the motion picture industry as the most profitable entertainment
industry segment internationally.
Since a crossover of skill sets/talent often exists between technicians working in the video game
industry and other aspects of the motion picture industry, many jurisdictions have recognized the
importance of this industry and now include financial incentives for the video game industry, in
conjunction with other traditional types of motion picture production. As an example, Wisconsin's
new 25 percent tax credits for the film and television allows video game developers to also take
advantage of the incentives.
Aside of the crossover of technical talent, another reason the video game industry is increasingly
important to motion picture production industry is due to its rapid growth compared to other forms of
Economics Research Associates Project No. 18014 Page 19
entertainment. The U.S. computer and video game industry’s annual growth rate from 2003 to 2006
exceeded 17 percent, according to the Entertainment Software Association.
In a recent report, PricewaterhouseCoopers projects the industry to grow from $41.9 billion in global
sales in 2007 to an estimated $68.3 billion by 2012 with the largest projected growth for online and
mobile games. Both categories are projected to increase by over 100 percent by 2012. Key factors
in the growth of the video game industry include: an increase in the number of mobile phones
capable of displaying games and an increase in the number of broadband households in the U.S.
Despite the tremendous growth in the video game industry, the business remains a risky one from a
producer’s standpoint. A high-quality video game will cost between $15 and $30 million to develop
and publish. Unlike the movie business, in which producers and distributors can recoup their costs
over the long-term via DVD sales, pay-per-view and other ancillary markets, video games have one
shot at making money via retail sales. The retail price of a quality video game can range between
approximately $40 to $60, making it unaffordable for some households. Also the success of a game
can be determined quickly as the majority make their money within the first six to nine months after
release.
Mobile Content
Though this trend is still in its infancy in North America, television makers are beginning to program
content for the mobile phone user. Mobile content offers many potential rewards, including creating
synergy among platforms, reinforcing loyalty to TV programs and extending brands. Of course legal
issues need to be resolved with this new technology, including who will be responsible for paying
guild residuals. Hollywood studios and other global companies are setting up new divisions to cater
to this programming outlet. The target user for mobile delivery is typically the 12- to 24-year-old. In
this regard, companies are moving into the original content arena, which differs from the high-
budget, studio-backed feature films and traditional hour-long episodic TV shows for international
consumption. Some studios, however, are even making feature films available for mobile
consumption. As an example, Sony Pictures Digital has made Ghostbusters and Spider-Man 2
available for mobile consumption.
Since mobile content is so new, there is no absolute formula for success as yet. Therefore, one
cannot draw conclusions as to it impact on the film and television industry other than to speculate
that it can only help it since production costs are likely to be lower for productions that are produced
Economics Research Associates Project No. 18014 Page 20
specifically as mobile content and mobile content is more likely to adapt genres such as shorts and
videos.
Changing Technology and Distribution Models
The history of motion picture and television production is highly correlated with technological change.
Much of the proliferation of film production is a direct result of technological advances such as digital
filmmaking and mobile broadcasting. Similar to other industries, advances in technology have
impacted the nature of film production by allowing filmmakers to take their productions to foreign
locations. Technological advances are also driving the globalization of production, making it easier for
filmmakers to take their projects to distant locales. Final Cut Pro, a computer software editing
package from Apple Computer Inc., is one of several technological innovations that is leading a
democratization of the movie and television industry. In this respect, it is similar to the desktop
publishing revolution of more than a decade ago.
Impact on Film Production
Technology has provided filmmakers with more choices and flexibility regarding the location for
principal photography during a film shoot. This new technology also is having an effect on location
production. Location shooting is now more feasible since cameras, sound and lighting equipment is
much lighter. There are two countervailing forces at work that need to be resolved before any clear
trend can be delineated. First, new technology will allow for the creation of so-called “virtual
locations.” The improved ability for digital masking and special effects may lead to an overall
reduction in location filming as filmmakers are more realistically able to portray a scene without
having to be physically present. This is frequently an imperative in low cost productions where
reality images are less important. However, as a countervailing tendency, this new technology is
reducing the overall cost of production and is having the net effect of luring more entrants into the
film industry. Many observers see an opening of the industry in coming years spurred by
technological advances. This may support the rise of regional industries, which would have
increasing need for on-location production.
New Distribution Models
The studio model of celluloid is fast disappearing. Under this traditional business model, particular
physical infrastructure was necessary to support and develop an industry. Today, however, the
entertainment industry is moving into the digital age. As high-definition and on-demand technologies
propagate, that mix will continue to shift away from cinemas and even DVDs. Now the situation is
one of extending programming to multiple platforms.
Economics Research Associates Project No. 18014 Page 21
The entertainment industry is also experiencing a major shift in the way that entertainment is
distributed. New distribution channels such as broadband, Internet access and mobile (wireless)
technology will drive significant growth in the industry. The Internet is still viewed as the most
promising medium of the future. The NCTA reports that the number of residential high speed data
subscribers increased from 5.5 million in Q2 2001 to 37.0 million in Q1 2008. This represents an
increase of nearly 600 percent, which is nearly three times the increase in the number of digital cable
subscribers. To date, there is no common commercial model for optimizing the distribution of
content over the Internet. Internet distribution is often sponsored by advertising, subscription fees,
pay-as-you-go product sales or some combination of the three.
Economic Significance of Motion Picture Production
Having discussed the changing nature of the motion picture production industry, or film industry, it is
also important to discuss its economic significance to local economies. As noted, the film production
business is comprised of entities producing movies, videos, television programs, industrials and
commercials. Local sectors that benefit from production include: labor, transportation, lodging, car
and truck rentals, gas stations, food and beverage establishments, other retail, construction and
repair, equipment rentals, personal, business and government services, as well as other location
expenses.
When discussing the “film industry,” it is important to note that the “industry” consists of two
separate, but often mutually supportive, halves:
The local or “indigenous” industry, which consists of locally-based or out-of-state companies
with local offices. These include local production companies, television stations and affiliates,
suppliers, etc. In some instances, these local companies may perform a fair share of business
on location in other cities and states. At present, the majority of production activity occurring in
the state of Louisiana is indigenous. For instance, a locally-based production company
specializing in commercial production might spend a considerable amount of the year filming on
location out of state.
The external or “exogenous” industry, which refers to outside producers (e.g., based out-of-
state) who shoot their productions locally. Hollywood productions fall into this category. A
majority of their expenditures represent new money to the state, as it is spent by non-residents.
Economics Research Associates Project No. 18014 Page 22
The film industry is therefore an “export” base industry which provides an injection of new
business into the state’s economy.
A healthy film industry is one that actively supports both types of productions. In general, more
production activity increases the talent pool, which is beneficial to both external and internal
production.
Direct Impacts of Film Production
Among the direct impacts of the film industry are:
The employment of a local workforce
The need for local materials and supplies
The generation of room nights at area hotels (exogenous production)
Increased restaurant and retail revenues (exogenous production)
To provide an example of the impact of film production, a report from the California Film Commission
(August 2005) analyzed a number of theatrical and television productions of various budgets and
concluded that mid-level projects budgeted at $17 million that shot outside of California for 40 days
cost the state of California $1.8 million in lost state tax revenues and the equivalent of 304 full-time
jobs. Even lower budget features in the $2 million range that shot for 16 days outside of California
cost the state $215,000 in potential lost tax revenues and the equivalent of 59 full-time jobs. In
general, episodic television contributes more as a long-term source of revenue and employment. For
instance, the former television series, Dawson’s Creek, spent more than $1 million locally per
episode in the Wilmington, North Carolina, area where it was filmed.
Impact on Employment
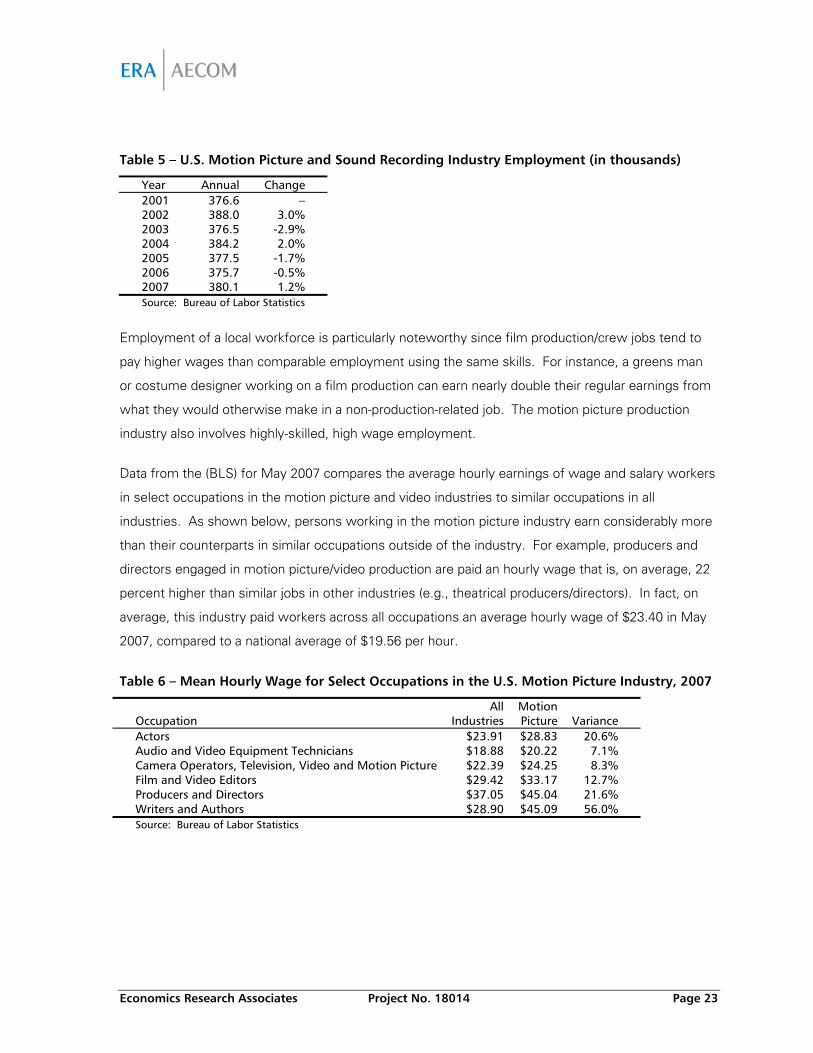
According to the U.S. Department of Labor, Bureau of Labor Statistics (BLS), the motion picture and
sound recording industry (NAICS 512) employed 380,000 persons in 2007. This represents a slight
increase of 1.2 percent from 2006, however it is still below the 2002 peak of nearly 388,000 people.
It should be noted that many individuals work in the motion picture and video industries on a
freelance, contractual, or part-time basis. In general, the motion picture industry depends on
contingent labor. Further, some motion picture and video establishments employ fewer than 5
workers.
Economics Research Associates Project No. 18014 Page 23
Table 5 – U.S. Motion Picture and Sound Recording Industry Employment (in thousands)
Year Annual Change 2001 376.6 – 2002 388.0 3.0% 2003 376.5 -2.9% 2004 384.2 2.0% 2005 377.5 -1.7% 2006 375.7 -0.5% 2007 380.1 1.2%
Source: Bureau of Labor Statistics
Employment of a local workforce is particularly noteworthy since film production/crew jobs tend to
pay higher wages than comparable employment using the same skills. For instance, a greens man
or costume designer working on a film production can earn nearly double their regular earnings from
what they would otherwise make in a non-production-related job. The motion picture production
industry also involves highly-skilled, high wage employment.
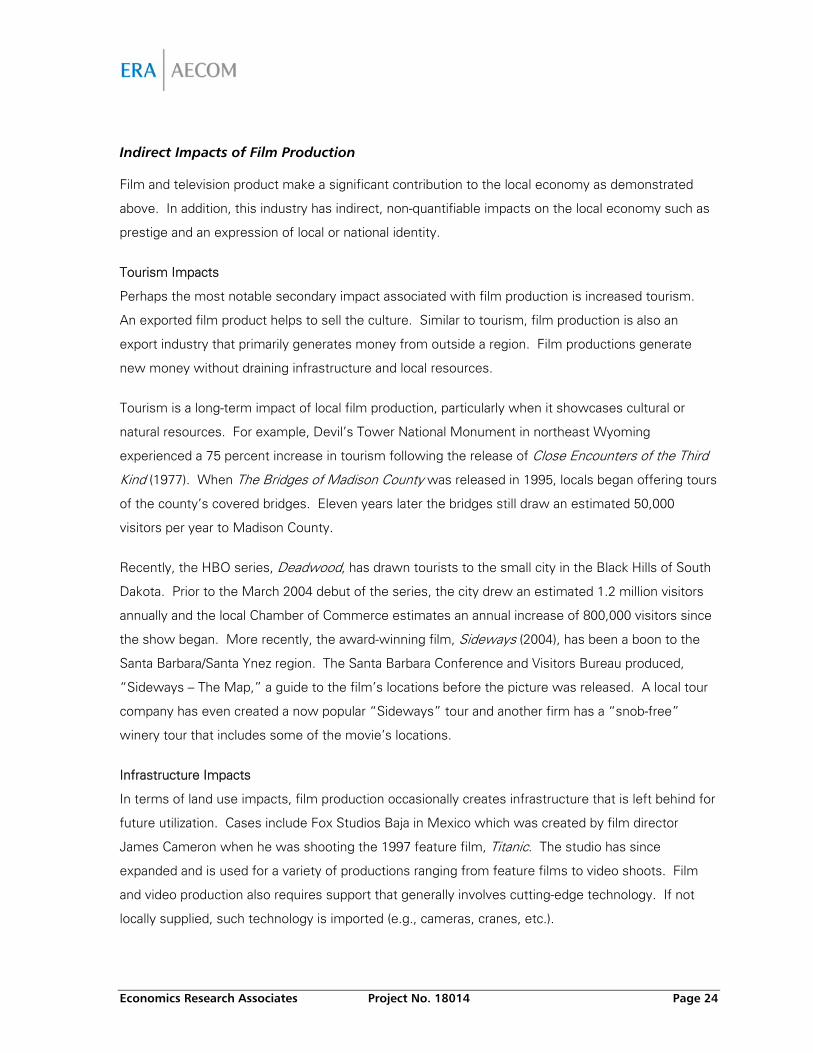
Data from the (BLS) for May 2007 compares the average hourly earnings of wage and salary workers
in select occupations in the motion picture and video industries to similar occupations in all
industries. As shown below, persons working in the motion picture industry earn considerably more
than their counterparts in similar occupations outside of the industry. For example, producers and
directors engaged in motion picture/video production are paid an hourly wage that is, on average, 22
percent higher than similar jobs in other industries (e.g., theatrical producers/directors). In fact, on
average, this industry paid workers across all occupations an average hourly wage of $23.40 in May
2007, compared to a national average of $19.56 per hour.
Table 6 – Mean Hourly Wage for Select Occupations in the U.S. Motion Picture Industry, 2007
Occupation
All Industries
Motion Picture Variance
Actors $23.91 $28.83 20.6% Audio and Video Equipment Technicians $18.88 $20.22 7.1% Camera Operators, Television, Video and Motion Picture $22.39 $24.25 8.3% Film and Video Editors $29.42 $33.17 12.7% Producers and Directors $37.05 $45.04 21.6% Writers and Authors $28.90 $45.09 56.0% Source: Bureau of Labor Statistics
Economics Research Associates Project No. 18014 Page 24
Indirect Impacts of Film Production
Film and television product make a significant contribution to the local economy as demonstrated
above. In addition, this industry has indirect, non-quantifiable impacts on the local economy such as
prestige and an expression of local or national identity.
Tourism Impacts
Perhaps the most notable secondary impact associated with film production is increased tourism.
An exported film product helps to sell the culture. Similar to tourism, film production is also an
export industry that primarily generates money from outside a region. Film productions generate
new money without draining infrastructure and local resources.
Tourism is a long-term impact of local film production, particularly when it showcases cultural or
natural resources. For example, Devil’s Tower National Monument in northeast Wyoming
experienced a 75 percent increase in tourism following the release of Close Encounters of the Third
Kind (1977). When The Bridges of Madison County was released in 1995, locals began offering tours
of the county’s covered bridges. Eleven years later the bridges still draw an estimated 50,000
visitors per year to Madison County.
Recently, the HBO series, Deadwood, has drawn tourists to the small city in the Black Hills of South
Dakota. Prior to the March 2004 debut of the series, the city drew an estimated 1.2 million visitors
annually and the local Chamber of Commerce estimates an annual increase of 800,000 visitors since
the show began. More recently, the award-winning film, Sideways (2004), has been a boon to the
Santa Barbara/Santa Ynez region. The Santa Barbara Conference and Visitors Bureau produced,
“Sideways – The Map,” a guide to the film’s locations before the picture was released. A local tour
company has even created a now popular “Sideways” tour and another firm has a “snob-free”
winery tour that includes some of the movie’s locations.
Infrastructure Impacts
In terms of land use impacts, film production occasionally creates infrastructure that is left behind for
future utilization. Cases include Fox Studios Baja in Mexico which was created by film director
James Cameron when he was shooting the 1997 feature film, Titanic. The studio has since
expanded and is used for a variety of productions ranging from feature films to video shoots. Film
and video production also requires support that generally involves cutting-edge technology. If not
locally supplied, such technology is imported (e.g., cameras, cranes, etc.).
Economics Research Associates Project No. 18014 Page 25
Creation of Industry Clusters
The film industry depends on the synergistic relationship of creative arts professionals and skilled
technicians working in highly specialized crafts. For example, writers, painters, actors, directors,
etc., all benefit by working on a production or merely being close to it. Workers in the arts are
typically accustomed to working in contingent labor occupations and often work in multiple jobs. In
many important aspects, the organization of a labor force in a regime of flexible specialization closely
mirrors the organization of traditional craft industries. Individual artists and crafts persons often
maintain their affiliations with their regular sources of employment while working on a production.
This is especially true in the smaller production centers outside of New York and Los Angeles, such
as Louisiana, where the nature of production activity is sporadic at best. The ability to move in and
out of employment in the entertainment industries while still maintaining a working income can
serve as a key “shock absorber” that could potentially allow for the development of a fully articulated
entertainment industry labor force.
A recent study by the Entertainment Economy Institute (2005) reported that about one half of all
motion picture and television workers in California earn a significant portion of their annual income
from jobs outside the industry. These findings suggested that there might be a “cross-over”
between skills that allow entertainment workers to successfully compete for jobs in other industries,
particularly for non-industry specific skills such as computer programming. The film and television
production industry is increasingly making use of digital and computer technologies.
Many digital artists also work in the fast-growing video game industry. As such, synergies and
opportunities may exist between related industries such as computer gaming and the internet/e-
commerce, which support development of a cluster of highly skilled and creative technology-driven
industry.
There is a strong, statistically significant correlation between vibrant and creative city milieus and the
presence of high-paying knowledge intensive industries such as high technology. Examples include
Austin, Texas and San Francisco, California. Increasingly, the quality of place and quality of life are
key determinants of economic growth in a globalized knowledge economy. Such correlations are
only likely to increase as we enter the digital age and the “democratization” of film production and
new distribution modes increase.
In terms of economic development, regional economic growth is powered by creative people and
cultural vitality makes these places attractive to members of the “creative class,” which includes,

Economics Research Associates Project No. 18014 Page 26
professionals, managers, entrepreneurs and analysts. Another sub-group within the creative class
includes the “super-creative core,” which includes many of those who work in entertainment and
creative industries. This includes filmmakers, writers, entertainers, actors, designers, architects,
editors, engineers, scientists and university professors. This creative talent is attracted to quality of
place and further contributes to this quality of place via their contributions to cultural vitality in the
places in which they choose to live and work.
Economics Research Associates Project No. 18014 Page 27
III. Louisiana’s Motion Picture Industry
Louisiana is a scenic state rich in history and culture. Swamps, lakes, bayous, hills, plantations,
historic homes and New Orleans’ French Quarter – among other places - are popular backdrops to
feature films, television shows and commercials. Filming in Louisiana is cost effective given the
State’s incentive program. These lower costs mean producers are able to better stretch their film
budgets in Louisiana as opposed to New York or California. Lower costs translate directly the
bottom line of film productions and impact everything from production studio rent to labor costs. It
has been reported that the movie, The Curious Case of Benjamin Button was originally to be filmed
in Baltimore. However producers changed their mind when the realized that they could save money
if they moved production to Louisiana. The falling value of the U.S. dollar also encouraged producers
to reconsider filming in the U.S. rather than Toronto, Vancouver or other popular spots in Canada or
other countries.
According to the Internet Movie Database (IMDb) website, there have been 426 productions that
took place in Louisiana from 2002 through 2008. Their database includes feature films, television
(TV) episodes, made for TV movies, TV series, direct to video movies and live action video games.
TV shows such as Dawson’s Creek, K-Ville and Varsity, Inc. have filmed in the state as well as reality
shows such as American Idol and Newlyweds: Nick and Jessica. Documentaries such as After
Katrina: Rebuilding St. Bernard Parish, ReNew Orleans and When the Levees Broke featured the
devastation and rebuilding of New Orleans after Hurricane Katrina. Popular feature films include All
the King’s Men, Big Momma’s House 2, Dukes of Hazard, Ray and most recently, W. and The
Curious Case of Benjamin Button. It should be noted that not all 426 of the productions listed on
IMDb applied for tax credits through Louisiana’s incentive programs. A complete list of those
productions can be found in Appendix B. Feature films, by year of production include:
2005 All the Kings Men Big Momma’s House II Deal Failure to Launch Flakes Just My Luck Local Colour Lubu Stay Alive The Last Time Three Days to Vegas (Retirement)
2006 Bug Déjà vu Hatchet Kill Theory (Last Resort) Pride (PDR) Solstice
Economics Research Associates Project No. 18014 Page 28
2007 American Summer American Violet (American Inquisition) Black Water Transit Bolden College 2007 In the Electric Mist Meet the Spartans Non Fiction Spring Break ’83 The Curious Case of Benjamin Button Waking Madison Welcome to Academia Yellow Handkerchief
2008 12 Rounds Bad Lieutenant Chess Cirque du Freak Family that Preys Final Destination 4 Hurricane Season I Love You Phillip Morris Mardi Gras My Very Own Love Song Night of the Demons Robosapien: Rebooted Welcome to the Reillys
Employment Trends
The film industry in Louisiana has undergone substantial growth since 2001, far outpacing national
averages. Employment in Louisiana’s film industry increased at a compound annual growth rate
(CAGR) of 22 percent from 2001 to 2007. This compares to a national growth rate of 1.8 percent
annually over the same time period. Although the average wages are lower than the national levels,
they have increased at an average annual rate of 8.2 percent, much faster than inflation. The lower
wages reflect both the lower cost of living in Louisiana as well as the fact that higher industry
earners live outside of the state. The film industry expanded most rapidly from 2002 to 2003, in
large part as a result of the incentive programs. When such an expansion occurs, often part-time,
temporary and contract workers are used to support the growth. This can explain the lower average
wage also experienced in 2003. As the industry has developed, both employment and wages have
stabilized. By 2007, people in the motion picture industry in Louisiana earned an average wage of
$37,209. Recall that many jobs in this industry are often characterized by seasonal, short-term
projects in Louisiana, not traditional full-time, year-round employment as in other parts of the country
which explains, in part, the difference from national average annual wages.
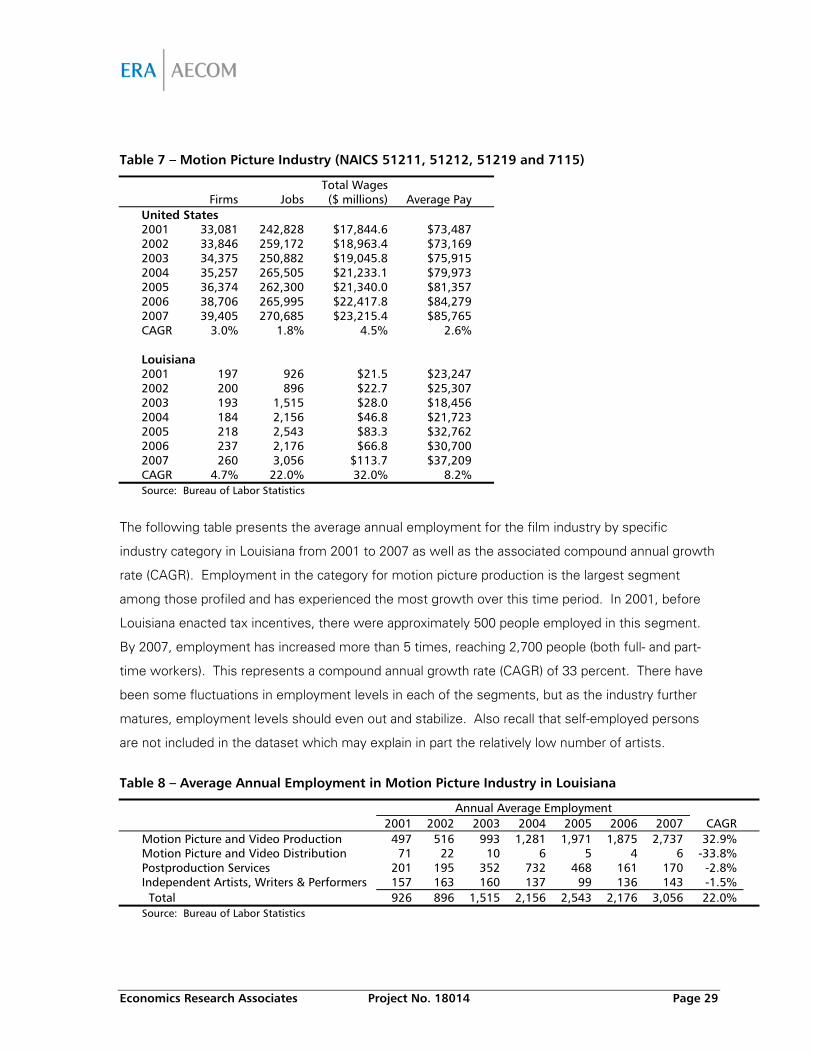
Economics Research Associates Project No. 18014 Page 29
Table 7 – Motion Picture Industry (NAICS 51211, 51212, 51219 and 7115)
Firms Jobs
Total Wages ($ millions) Average Pay
United States 2001 33,081 242,828 $17,844.6 $73,487 2002 33,846 259,172 $18,963.4 $73,169 2003 34,375 250,882 $19,045.8 $75,915 2004 35,257 265,505 $21,233.1 $79,973 2005 36,374 262,300 $21,340.0 $81,357 2006 38,706 265,995 $22,417.8 $84,279 2007 39,405 270,685 $23,215.4 $85,765 CAGR 3.0% 1.8% 4.5% 2.6% Louisiana 2001 197 926 $21.5 $23,247 2002 200 896 $22.7 $25,307 2003 193 1,515 $28.0 $18,456 2004 184 2,156 $46.8 $21,723 2005 218 2,543 $83.3 $32,762 2006 237 2,176 $66.8 $30,700 2007 260 3,056 $113.7 $37,209 CAGR 4.7% 22.0% 32.0% 8.2% Source: Bureau of Labor Statistics
The following table presents the average annual employment for the film industry by specific
industry category in Louisiana from 2001 to 2007 as well as the associated compound annual growth
rate (CAGR). Employment in the category for motion picture production is the largest segment
among those profiled and has experienced the most growth over this time period. In 2001, before
Louisiana enacted tax incentives, there were approximately 500 people employed in this segment.
By 2007, employment has increased more than 5 times, reaching 2,700 people (both full- and part-
time workers). This represents a compound annual growth rate (CAGR) of 33 percent. There have
been some fluctuations in employment levels in each of the segments, but as the industry further
matures, employment levels should even out and stabilize. Also recall that self-employed persons
are not included in the dataset which may explain in part the relatively low number of artists.
Table 8 – Average Annual Employment in Motion Picture Industry in Louisiana
Annual Average Employment 2001 2002 2003 2004 2005 2006 2007 CAGR Motion Picture and Video Production 497 516 993 1,281 1,971 1,875 2,737 32.9% Motion Picture and Video Distribution 71 22 10 6 5 4 6 -33.8% Postproduction Services 201 195 352 732 468 161 170 -2.8% Independent Artists, Writers & Performers 157 163 160 137 99 136 143 -1.5% Total 926 896 1,515 2,156 2,543 2,176 3,056 22.0%
Source: Bureau of Labor Statistics
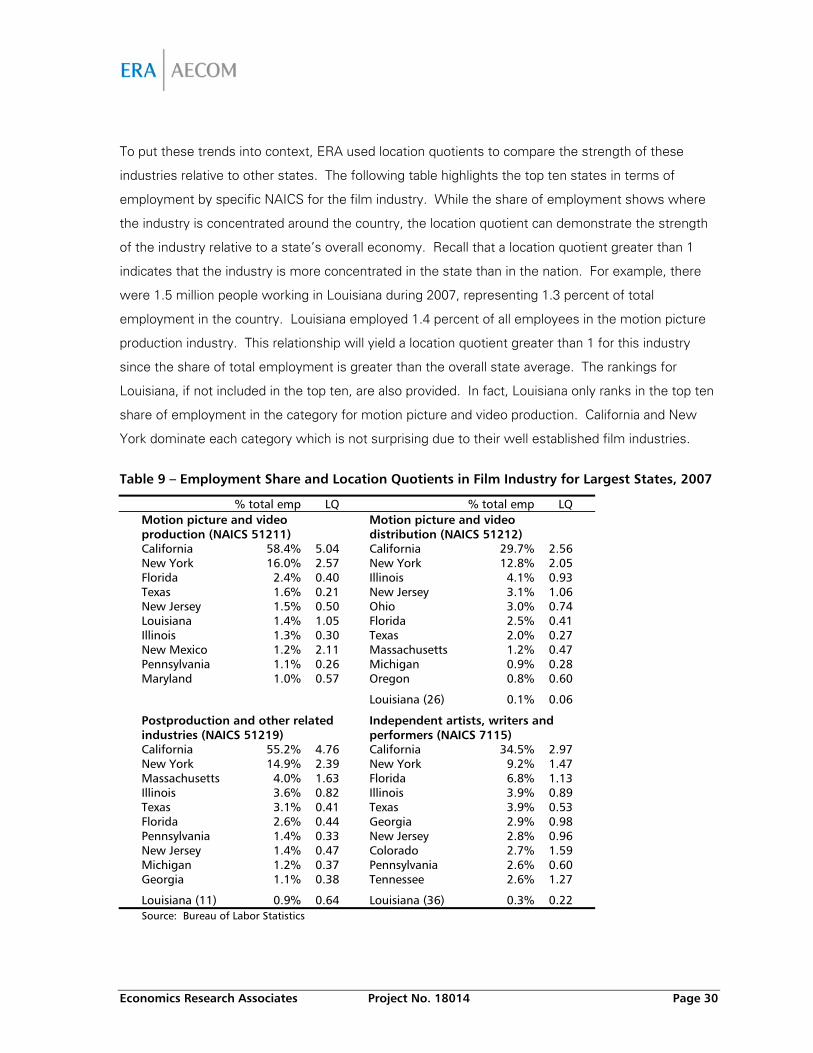
Economics Research Associates Project No. 18014 Page 30
To put these trends into context, ERA used location quotients to compare the strength of these
industries relative to other states. The following table highlights the top ten states in terms of
employment by specific NAICS for the film industry. While the share of employment shows where
the industry is concentrated around the country, the location quotient can demonstrate the strength
of the industry relative to a state’s overall economy. Recall that a location quotient greater than 1
indicates that the industry is more concentrated in the state than in the nation. For example, there
were 1.5 million people working in Louisiana during 2007, representing 1.3 percent of total
employment in the country. Louisiana employed 1.4 percent of all employees in the motion picture
production industry. This relationship will yield a location quotient greater than 1 for this industry
since the share of total employment is greater than the overall state average. The rankings for
Louisiana, if not included in the top ten, are also provided. In fact, Louisiana only ranks in the top ten
share of employment in the category for motion picture and video production. California and New
York dominate each category which is not surprising due to their well established film industries.
Table 9 – Employment Share and Location Quotients in Film Industry for Largest States, 2007
% total emp LQ % total emp LQ
Motion picture and video production (NAICS 51211)
Motion picture and video distribution (NAICS 51212)
California 58.4% 5.04 California 29.7% 2.56 New York 16.0% 2.57 New York 12.8% 2.05 Florida 2.4% 0.40 Illinois 4.1% 0.93 Texas 1.6% 0.21 New Jersey 3.1% 1.06 New Jersey 1.5% 0.50 Ohio 3.0% 0.74 Louisiana 1.4% 1.05 Florida 2.5% 0.41 Illinois 1.3% 0.30 Texas 2.0% 0.27 New Mexico 1.2% 2.11 Massachusetts 1.2% 0.47 Pennsylvania 1.1% 0.26 Michigan 0.9% 0.28 Maryland 1.0% 0.57 Oregon 0.8% 0.60
Louisiana (26) 0.1% 0.06
Postproduction and other related industries (NAICS 51219)
Independent artists, writers and performers (NAICS 7115)
California 55.2% 4.76 California 34.5% 2.97 New York 14.9% 2.39 New York 9.2% 1.47 Massachusetts 4.0% 1.63 Florida 6.8% 1.13 Illinois 3.6% 0.82 Illinois 3.9% 0.89 Texas 3.1% 0.41 Texas 3.9% 0.53 Florida 2.6% 0.44 Georgia 2.9% 0.98 Pennsylvania 1.4% 0.33 New Jersey 2.8% 0.96 New Jersey 1.4% 0.47 Colorado 2.7% 1.59 Michigan 1.2% 0.37 Pennsylvania 2.6% 0.60 Georgia 1.1% 0.38 Tennessee 2.6% 1.27
Louisiana (11) 0.9% 0.64 Louisiana (36) 0.3% 0.22
Source: Bureau of Labor Statistics
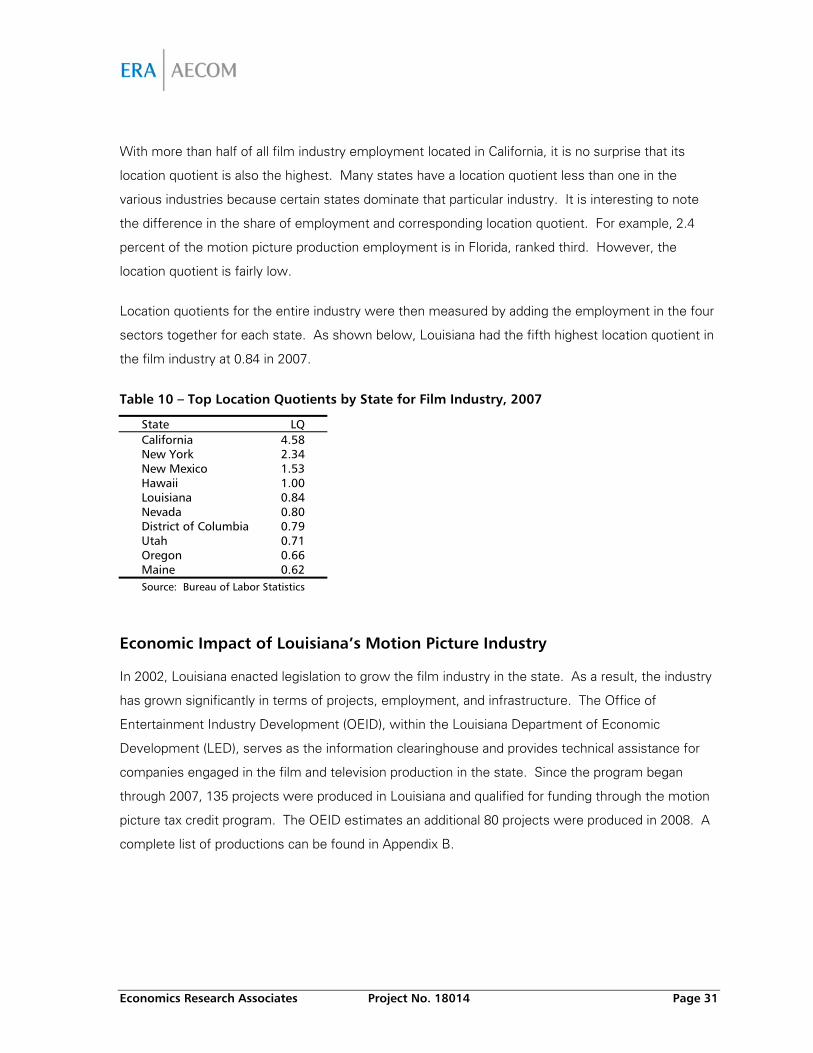
Economics Research Associates Project No. 18014 Page 31
With more than half of all film industry employment located in California, it is no surprise that its
location quotient is also the highest. Many states have a location quotient less than one in the
various industries because certain states dominate that particular industry. It is interesting to note
the difference in the share of employment and corresponding location quotient. For example, 2.4
percent of the motion picture production employment is in Florida, ranked third. However, the
location quotient is fairly low.
Location quotients for the entire industry were then measured by adding the employment in the four
sectors together for each state. As shown below, Louisiana had the fifth highest location quotient in
the film industry at 0.84 in 2007.
Table 10 – Top Location Quotients by State for Film Industry, 2007
State LQ California 4.58 New York 2.34 New Mexico 1.53 Hawaii 1.00 Louisiana 0.84 Nevada 0.80 District of Columbia 0.79 Utah 0.71 Oregon 0.66 Maine 0.62 Source: Bureau of Labor Statistics
Economic Impact of Louisiana’s Motion Picture Industry
In 2002, Louisiana enacted legislation to grow the film industry in the state. As a result, the industry
has grown significantly in terms of projects, employment, and infrastructure. The Office of
Entertainment Industry Development (OEID), within the Louisiana Department of Economic
Development (LED), serves as the information clearinghouse and provides technical assistance for
companies engaged in the film and television production in the state. Since the program began
through 2007, 135 projects were produced in Louisiana and qualified for funding through the motion
picture tax credit program. The OEID estimates an additional 80 projects were produced in 2008. A
complete list of productions can be found in Appendix B.
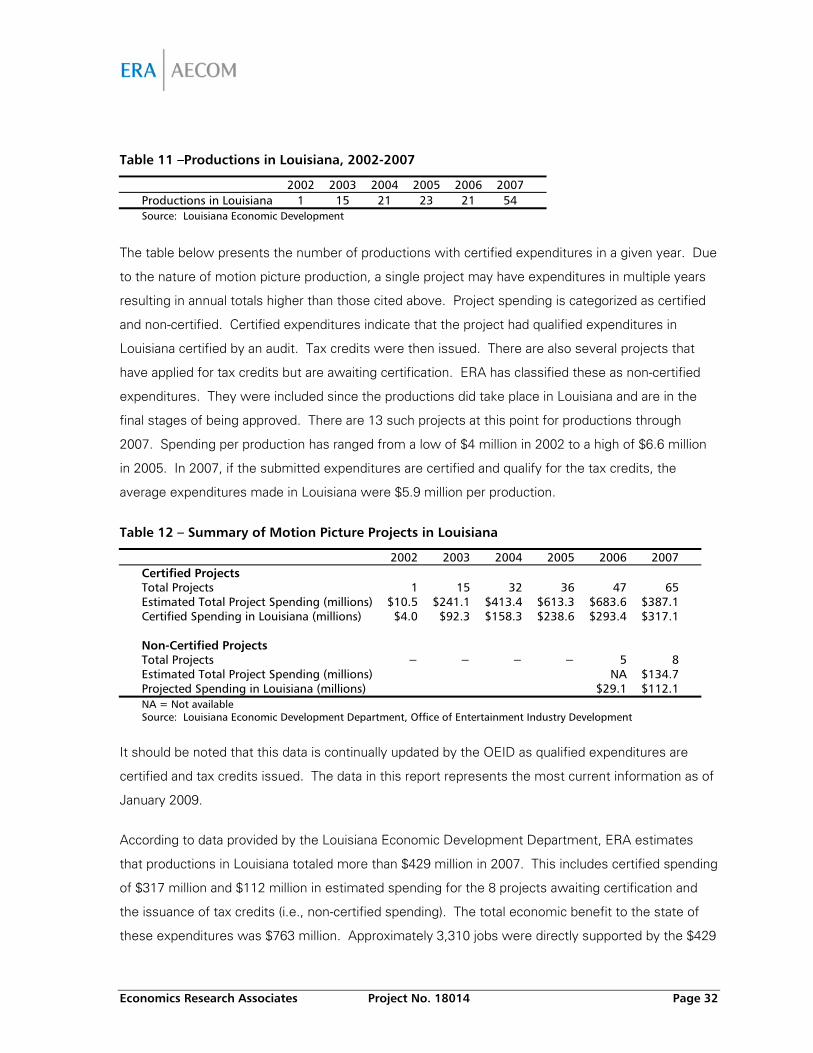
Economics Research Associates Project No. 18014 Page 32
Table 11 –Productions in Louisiana, 2002-2007
2002 2003 2004 2005 2006 2007 Productions in Louisiana 1 15 21 23 21 54 Source: Louisiana Economic Development
The table below presents the number of productions with certified expenditures in a given year. Due
to the nature of motion picture production, a single project may have expenditures in multiple years
resulting in annual totals higher than those cited above. Project spending is categorized as certified
and non-certified. Certified expenditures indicate that the project had qualified expenditures in
Louisiana certified by an audit. Tax credits were then issued. There are also several projects that
have applied for tax credits but are awaiting certification. ERA has classified these as non-certified
expenditures. They were included since the productions did take place in Louisiana and are in the
final stages of being approved. There are 13 such projects at this point for productions through
2007. Spending per production has ranged from a low of $4 million in 2002 to a high of $6.6 million
in 2005. In 2007, if the submitted expenditures are certified and qualify for the tax credits, the
average expenditures made in Louisiana were $5.9 million per production.
Table 12 – Summary of Motion Picture Projects in Louisiana
2002 2003 2004 2005 2006 2007 Certified Projects Total Projects 1 15 32 36 47 65 Estimated Total Project Spending (millions) $10.5 $241.1 $413.4 $613.3 $683.6 $387.1 Certified Spending in Louisiana (millions) $4.0 $92.3 $158.3 $238.6 $293.4 $317.1 Non-Certified Projects Total Projects − − − − 5 8 Estimated Total Project Spending (millions) NA $134.7 Projected Spending in Louisiana (millions) $29.1 $112.1
NA = Not available Source: Louisiana Economic Development Department, Office of Entertainment Industry Development
It should be noted that this data is continually updated by the OEID as qualified expenditures are
certified and tax credits issued. The data in this report represents the most current information as of
January 2009.
According to data provided by the Louisiana Economic Development Department, ERA estimates
that productions in Louisiana totaled more than $429 million in 2007. This includes certified spending
of $317 million and $112 million in estimated spending for the 8 projects awaiting certification and
the issuance of tax credits (i.e., non-certified spending). The total economic benefit to the state of
these expenditures was $763 million. Approximately 3,310 jobs were directly supported by the $429
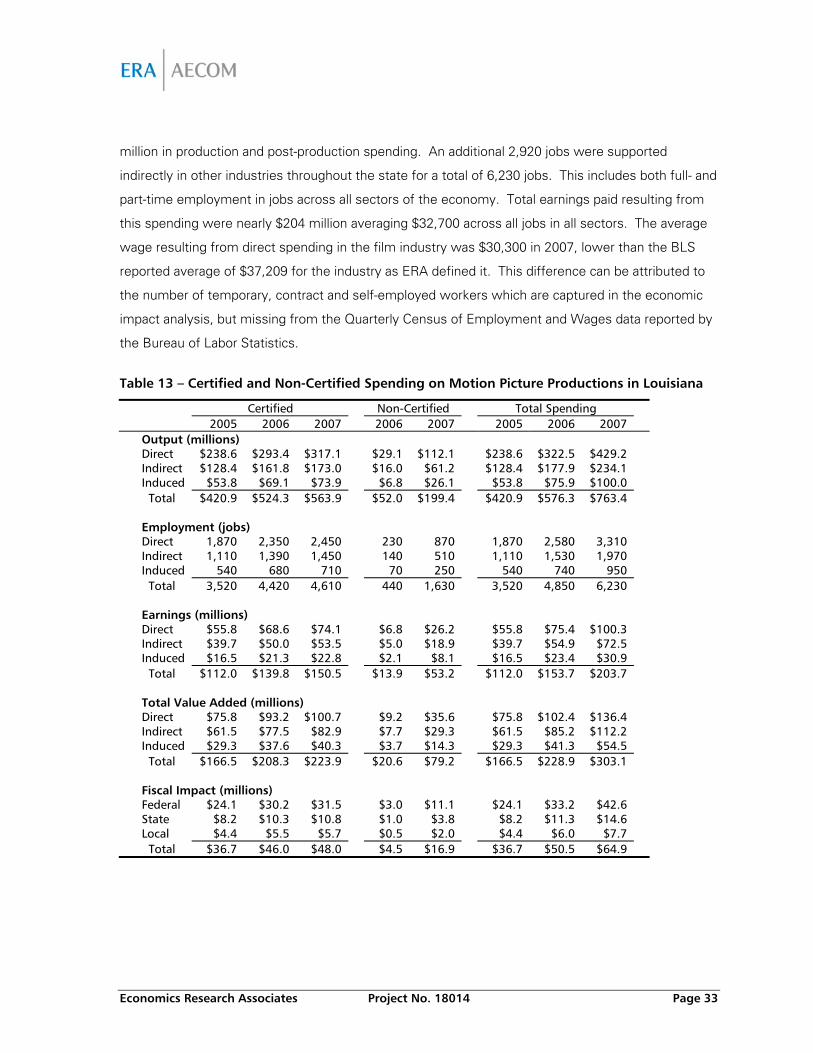
Economics Research Associates Project No. 18014 Page 33
million in production and post-production spending. An additional 2,920 jobs were supported
indirectly in other industries throughout the state for a total of 6,230 jobs. This includes both full- and
part-time employment in jobs across all sectors of the economy. Total earnings paid resulting from
this spending were nearly $204 million averaging $32,700 across all jobs in all sectors. The average
wage resulting from direct spending in the film industry was $30,300 in 2007, lower than the BLS
reported average of $37,209 for the industry as ERA defined it. This difference can be attributed to
the number of temporary, contract and self-employed workers which are captured in the economic
impact analysis, but missing from the Quarterly Census of Employment and Wages data reported by
the Bureau of Labor Statistics.
Table 13 – Certified and Non-Certified Spending on Motion Picture Productions in Louisiana
Certified Non-Certified Total Spending 2005 2006 2007 2006 2007 2005 2006 2007 Output (millions) Direct $238.6 $293.4 $317.1 $29.1 $112.1 $238.6 $322.5 $429.2 Indirect $128.4 $161.8 $173.0 $16.0 $61.2 $128.4 $177.9 $234.1 Induced $53.8 $69.1 $73.9 $6.8 $26.1 $53.8 $75.9 $100.0 Total $420.9 $524.3 $563.9 $52.0 $199.4 $420.9 $576.3 $763.4 Employment (jobs) Direct 1,870 2,350 2,450 230 870 1,870 2,580 3,310 Indirect 1,110 1,390 1,450 140 510 1,110 1,530 1,970 Induced 540 680 710 70 250 540 740 950 Total 3,520 4,420 4,610 440 1,630 3,520 4,850 6,230 Earnings (millions) Direct $55.8 $68.6 $74.1 $6.8 $26.2 $55.8 $75.4 $100.3 Indirect $39.7 $50.0 $53.5 $5.0 $18.9 $39.7 $54.9 $72.5 Induced $16.5 $21.3 $22.8 $2.1 $8.1 $16.5 $23.4 $30.9 Total $112.0 $139.8 $150.5 $13.9 $53.2 $112.0 $153.7 $203.7 Total Value Added (millions) Direct $75.8 $93.2 $100.7 $9.2 $35.6 $75.8 $102.4 $136.4 Indirect $61.5 $77.5 $82.9 $7.7 $29.3 $61.5 $85.2 $112.2 Induced $29.3 $37.6 $40.3 $3.7 $14.3 $29.3 $41.3 $54.5 Total $166.5 $208.3 $223.9 $20.6 $79.2 $166.5 $228.9 $303.1 Fiscal Impact (millions) Federal $24.1 $30.2 $31.5 $3.0 $11.1 $24.1 $33.2 $42.6 State $8.2 $10.3 $10.8 $1.0 $3.8 $8.2 $11.3 $14.6 Local $4.4 $5.5 $5.7 $0.5 $2.0 $4.4 $6.0 $7.7 Total $36.7 $46.0 $48.0 $4.5 $16.9 $36.7 $50.5 $64.9
Economics Research Associates Project No. 18014 Page 34
The reason for examining “total value added” is that it represents the degree to which the state
economy is enriched by a given activity. The largest component of total value added is wages. It
also includes such things as rents, royalties dividends and profits as well as indirect business taxes
that were incurred. It does not include taxes on profit or income which are included in the fiscal
impacts. It includes payments made to individuals (employee compensation), business owners
(proprietary income or corporate profits), investors (dividends, economic rents and royalties) and
governments (sales and excise taxes). In 2007, the total value added as a result of qualified
spending on motion picture productions was $303.1 million.
Economic activity like wages, sales and profits generate tax revenue for federal, state and local
governments. In addition to income, sales and property taxes, this includes fees paid to
governments, including motor vehicle licensing fees, fines and payments for permits. Motion picture
projects that received state tax credits generated $26.4 million in state and local tax revenue during
2007, of which approximately two-thirds ($14.6 million) went to the State of Louisiana.
Cost Benefit Analysis
In this section, ERA estimates of the costs and benefits to the State as well as the benefits to the
overall economy as a result of the motion picture production tax credit program. Productions that
have applied for tax credits must be approved by the State and their in-state expenses must be
certified. Tax credits are then issued only on qualified expenditures made in the State of Louisiana.
For qualified film productions, there is also a wage credit for state residents employed on the project.
As shown in the following table, the State of Louisiana will issue an estimated $115 million in tax
credits for projects with certified and estimated expenditures incurred during 2007. Combined these
projects had an estimated $429 million in qualified expenditures which generated a total economic
benefit to the State of $763 million. This represents an economic stimulus of $6.64 for every $1 in
tax credits issued for qualifying motion picture expenditures during 2007. This has grown 4.6
percent since 2005. The $115 million in tax credits supported the creation of 6,230 jobs (direct +
indirect) throughout the state. These jobs paid an average annual salary of $32,690 at the cost of
$18,460 in tax credits each during 2007. The State of Louisiana directly received $14.6 million in
taxes and fees resulting for the $763 million in economic output.
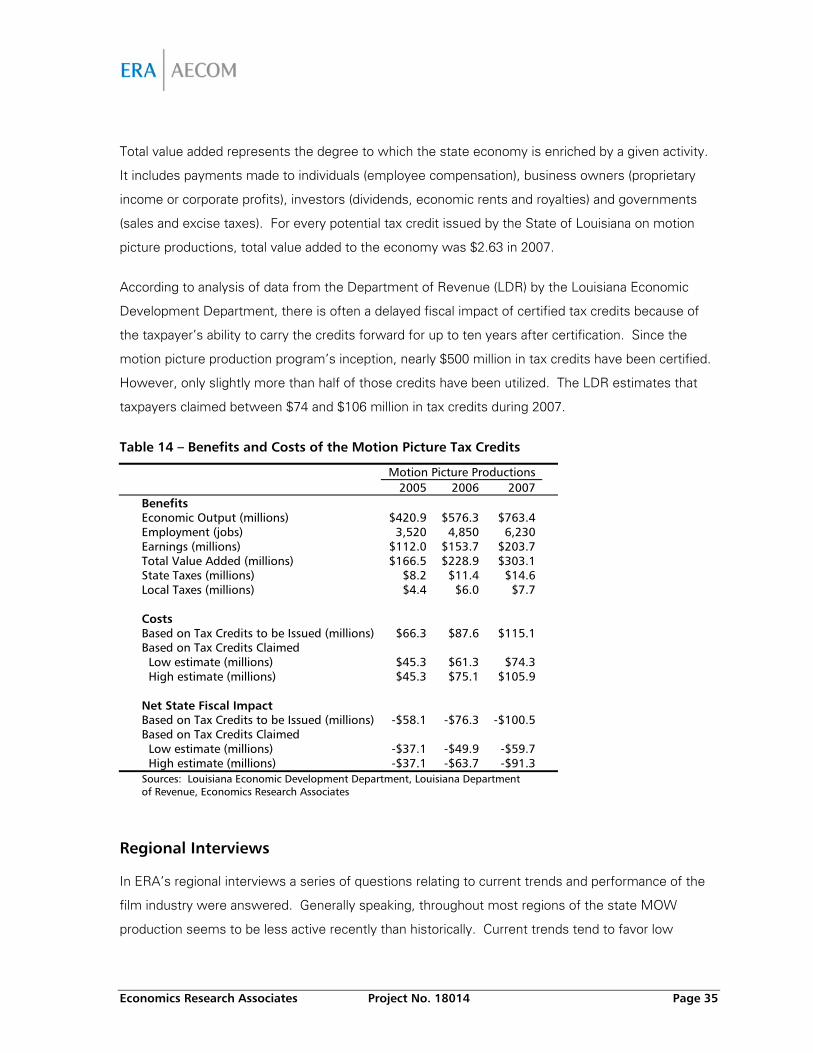
Economics Research Associates Project No. 18014 Page 35
Total value added represents the degree to which the state economy is enriched by a given activity.
It includes payments made to individuals (employee compensation), business owners (proprietary
income or corporate profits), investors (dividends, economic rents and royalties) and governments
(sales and excise taxes). For every potential tax credit issued by the State of Louisiana on motion
picture productions, total value added to the economy was $2.63 in 2007.
According to analysis of data from the Department of Revenue (LDR) by the Louisiana Economic
Development Department, there is often a delayed fiscal impact of certified tax credits because of
the taxpayer’s ability to carry the credits forward for up to ten years after certification. Since the
motion picture production program’s inception, nearly $500 million in tax credits have been certified.
However, only slightly more than half of those credits have been utilized. The LDR estimates that
taxpayers claimed between $74 and $106 million in tax credits during 2007.
Table 14 – Benefits and Costs of the Motion Picture Tax Credits
Motion Picture Productions 2005 2006 2007 Benefits Economic Output (millions) $420.9 $576.3 $763.4 Employment (jobs) 3,520 4,850 6,230 Earnings (millions) $112.0 $153.7 $203.7 Total Value Added (millions) $166.5 $228.9 $303.1 State Taxes (millions) $8.2 $11.4 $14.6 Local Taxes (millions) $4.4 $6.0 $7.7 Costs Based on Tax Credits to be Issued (millions) $66.3 $87.6 $115.1 Based on Tax Credits Claimed Low estimate (millions) $45.3 $61.3 $74.3 High estimate (millions) $45.3 $75.1 $105.9 Net State Fiscal Impact Based on Tax Credits to be Issued (millions) -$58.1 -$76.3 -$100.5 Based on Tax Credits Claimed Low estimate (millions) -$37.1 -$49.9 -$59.7 High estimate (millions) -$37.1 -$63.7 -$91.3 Sources: Louisiana Economic Development Department, Louisiana Department
of Revenue, Economics Research Associates
Regional Interviews
In ERA’s regional interviews a series of questions relating to current trends and performance of the
film industry were answered. Generally speaking, throughout most regions of the state MOW
production seems to be less active recently than historically. Current trends tend to favor low
Economics Research Associates Project No. 18014 Page 36
budget features and independent productions – a niche which can remain competitive for the state.
Many of the interviewees and film office managers indicated that relatively high budget commercial
productions, and to some extent television, are potential areas of focus and emphasis moving
forward.
Several areas of the state (most noticeably the northwest and south/ southeast portions) have
experienced an influx of new and relocated businesses from outside of Louisiana. While some of
these business are production based, most are supportive to the production process and provide
ancillary services. Additionally, businesses which cater primarily local markets (food services,
consumer services, etc.) but have learned to package their products and service to the needs of
productions have experienced a notable increase in business volume.
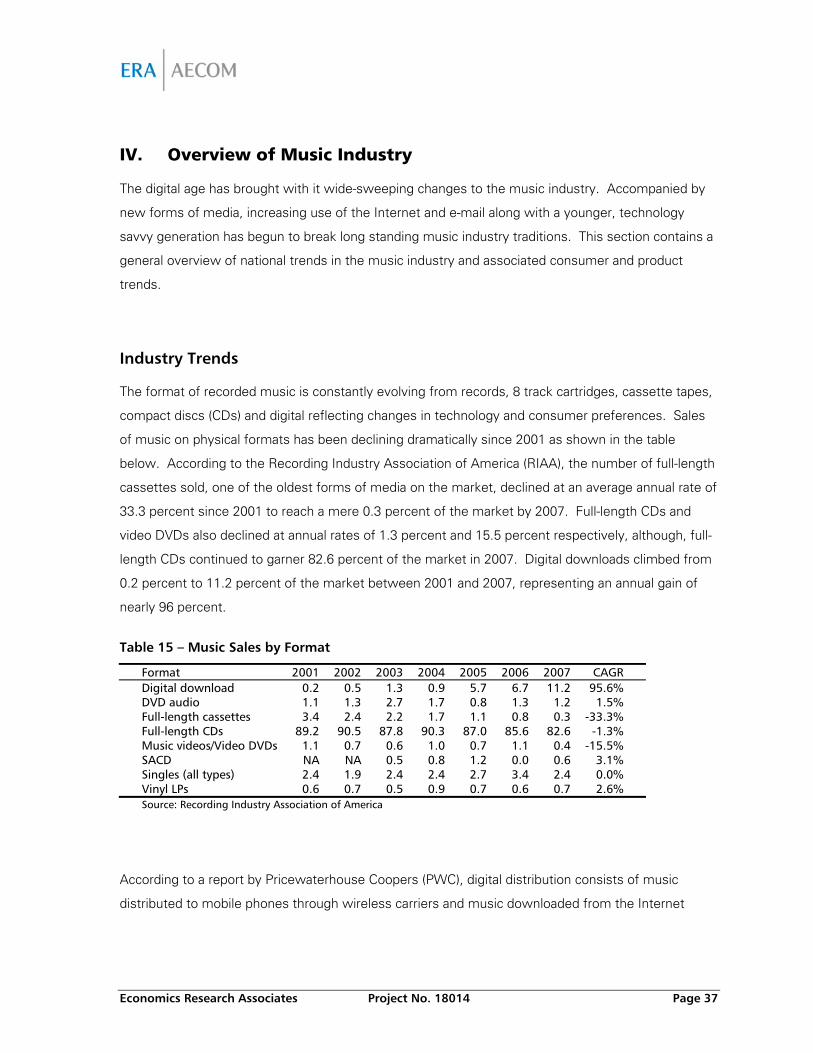
Economics Research Associates Project No. 18014 Page 37
IV. Overview of Music Industry
The digital age has brought with it wide-sweeping changes to the music industry. Accompanied by
new forms of media, increasing use of the Internet and e-mail along with a younger, technology
savvy generation has begun to break long standing music industry traditions. This section contains a
general overview of national trends in the music industry and associated consumer and product
trends.
Industry Trends
The format of recorded music is constantly evolving from records, 8 track cartridges, cassette tapes,
compact discs (CDs) and digital reflecting changes in technology and consumer preferences. Sales
of music on physical formats has been declining dramatically since 2001 as shown in the table
below. According to the Recording Industry Association of America (RIAA), the number of full-length
cassettes sold, one of the oldest forms of media on the market, declined at an average annual rate of
33.3 percent since 2001 to reach a mere 0.3 percent of the market by 2007. Full-length CDs and
video DVDs also declined at annual rates of 1.3 percent and 15.5 percent respectively, although, full-
length CDs continued to garner 82.6 percent of the market in 2007. Digital downloads climbed from
0.2 percent to 11.2 percent of the market between 2001 and 2007, representing an annual gain of
nearly 96 percent.
Table 15 – Music Sales by Format
Format 2001 2002 2003 2004 2005 2006 2007 CAGR Digital download 0.2 0.5 1.3 0.9 5.7 6.7 11.2 95.6% DVD audio 1.1 1.3 2.7 1.7 0.8 1.3 1.2 1.5% Full-length cassettes 3.4 2.4 2.2 1.7 1.1 0.8 0.3 -33.3% Full-length CDs 89.2 90.5 87.8 90.3 87.0 85.6 82.6 -1.3% Music videos/Video DVDs 1.1 0.7 0.6 1.0 0.7 1.1 0.4 -15.5% SACD NA NA 0.5 0.8 1.2 0.0 0.6 3.1% Singles (all types) 2.4 1.9 2.4 2.4 2.7 3.4 2.4 0.0% Vinyl LPs 0.6 0.7 0.5 0.9 0.7 0.6 0.7 2.6%
Source: Recording Industry Association of America
According to a report by Pricewaterhouse Coopers (PWC), digital distribution consists of music
distributed to mobile phones through wireless carriers and music downloaded from the Internet
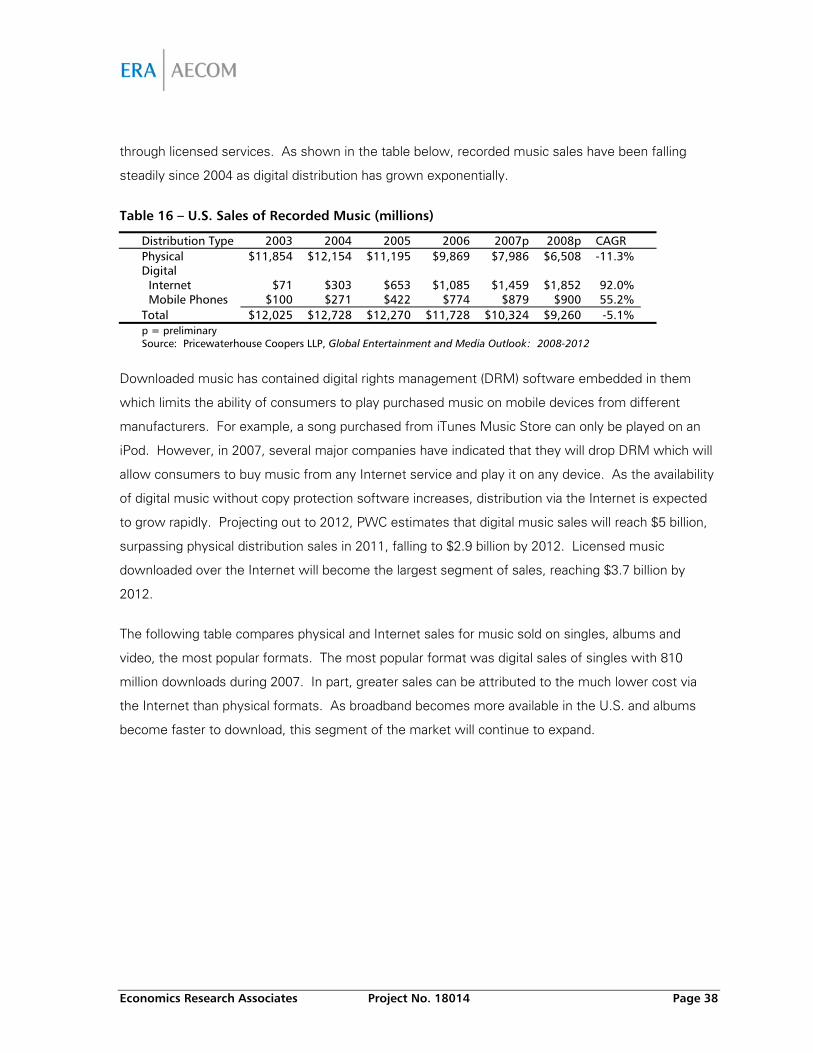
Economics Research Associates Project No. 18014 Page 38
through licensed services. As shown in the table below, recorded music sales have been falling
steadily since 2004 as digital distribution has grown exponentially.
Table 16 – U.S. Sales of Recorded Music (millions)
Distribution Type 2003 2004 2005 2006 2007p 2008p CAGR Physical $11,854 $12,154 $11,195 $9,869 $7,986 $6,508 -11.3% Digital Internet $71 $303 $653 $1,085 $1,459 $1,852 92.0% Mobile Phones $100 $271 $422 $774 $879 $900 55.2% Total $12,025 $12,728 $12,270 $11,728 $10,324 $9,260 -5.1%
p = preliminary Source: Pricewaterhouse Coopers LLP, Global Entertainment and Media Outlook: 2008-2012
Downloaded music has contained digital rights management (DRM) software embedded in them
which limits the ability of consumers to play purchased music on mobile devices from different
manufacturers. For example, a song purchased from iTunes Music Store can only be played on an
iPod. However, in 2007, several major companies have indicated that they will drop DRM which will
allow consumers to buy music from any Internet service and play it on any device. As the availability
of digital music without copy protection software increases, distribution via the Internet is expected
to grow rapidly. Projecting out to 2012, PWC estimates that digital music sales will reach $5 billion,
surpassing physical distribution sales in 2011, falling to $2.9 billion by 2012. Licensed music
downloaded over the Internet will become the largest segment of sales, reaching $3.7 billion by
2012.
The following table compares physical and Internet sales for music sold on singles, albums and
video, the most popular formats. The most popular format was digital sales of singles with 810
million downloads during 2007. In part, greater sales can be attributed to the much lower cost via
the Internet than physical formats. As broadband becomes more available in the U.S. and albums
become faster to download, this segment of the market will continue to expand.
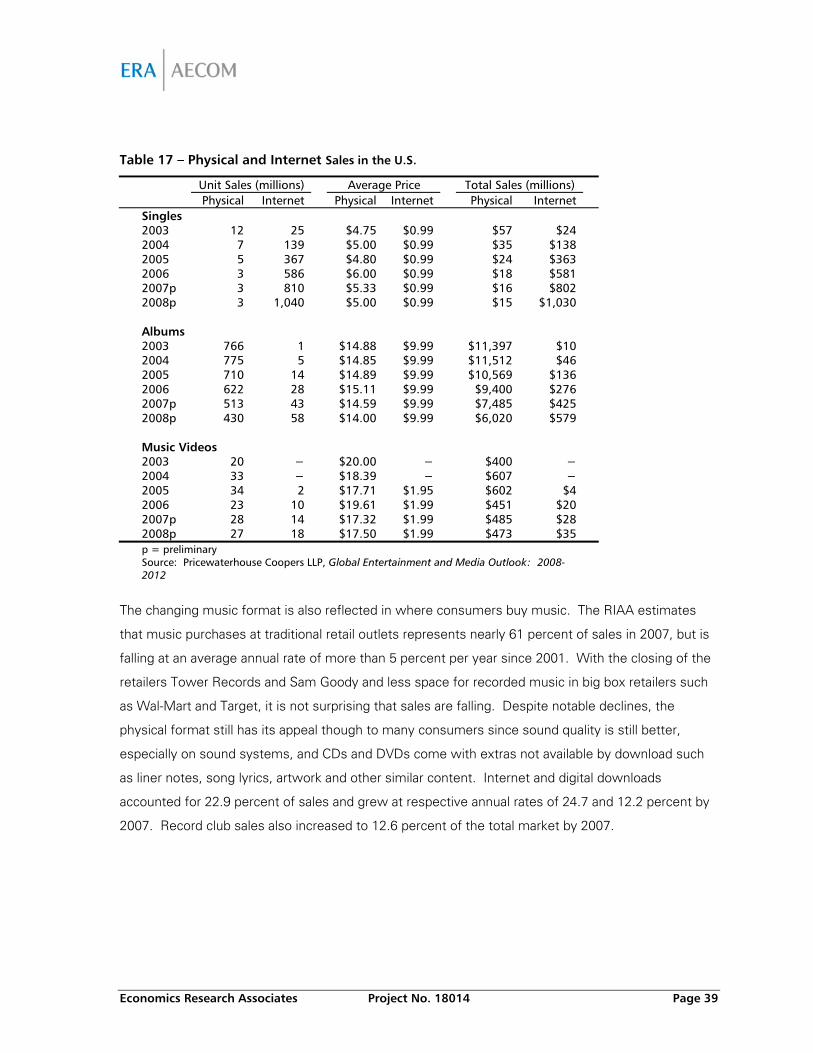
Economics Research Associates Project No. 18014 Page 39
Table 17 – Physical and Internet Sales in the U.S.
Unit Sales (millions) Average Price Total Sales (millions) Physical Internet Physical Internet Physical Internet Singles 2003 12 25 $4.75 $0.99 $57 $24 2004 7 139 $5.00 $0.99 $35 $138 2005 5 367 $4.80 $0.99 $24 $363 2006 3 586 $6.00 $0.99 $18 $581 2007p 3 810 $5.33 $0.99 $16 $802 2008p 3 1,040 $5.00 $0.99 $15 $1,030 Albums 2003 766 1 $14.88 $9.99 $11,397 $10 2004 775 5 $14.85 $9.99 $11,512 $46 2005 710 14 $14.89 $9.99 $10,569 $136 2006 622 28 $15.11 $9.99 $9,400 $276 2007p 513 43 $14.59 $9.99 $7,485 $425 2008p 430 58 $14.00 $9.99 $6,020 $579 Music Videos 2003 20 − $20.00 − $400 − 2004 33 − $18.39 − $607 − 2005 34 2 $17.71 $1.95 $602 $4 2006 23 10 $19.61 $1.99 $451 $20 2007p 28 14 $17.32 $1.99 $485 $28 2008p 27 18 $17.50 $1.99 $473 $35
p = preliminary Source: Pricewaterhouse Coopers LLP, Global Entertainment and Media Outlook: 2008-2012
The changing music format is also reflected in where consumers buy music. The RIAA estimates
that music purchases at traditional retail outlets represents nearly 61 percent of sales in 2007, but is
falling at an average annual rate of more than 5 percent per year since 2001. With the closing of the
retailers Tower Records and Sam Goody and less space for recorded music in big box retailers such
as Wal-Mart and Target, it is not surprising that sales are falling. Despite notable declines, the
physical format still has its appeal though to many consumers since sound quality is still better,
especially on sound systems, and CDs and DVDs come with extras not available by download such
as liner notes, song lyrics, artwork and other similar content. Internet and digital downloads
accounted for 22.9 percent of sales and grew at respective annual rates of 24.7 and 12.2 percent by
2007. Record club sales also increased to 12.6 percent of the total market by 2007.
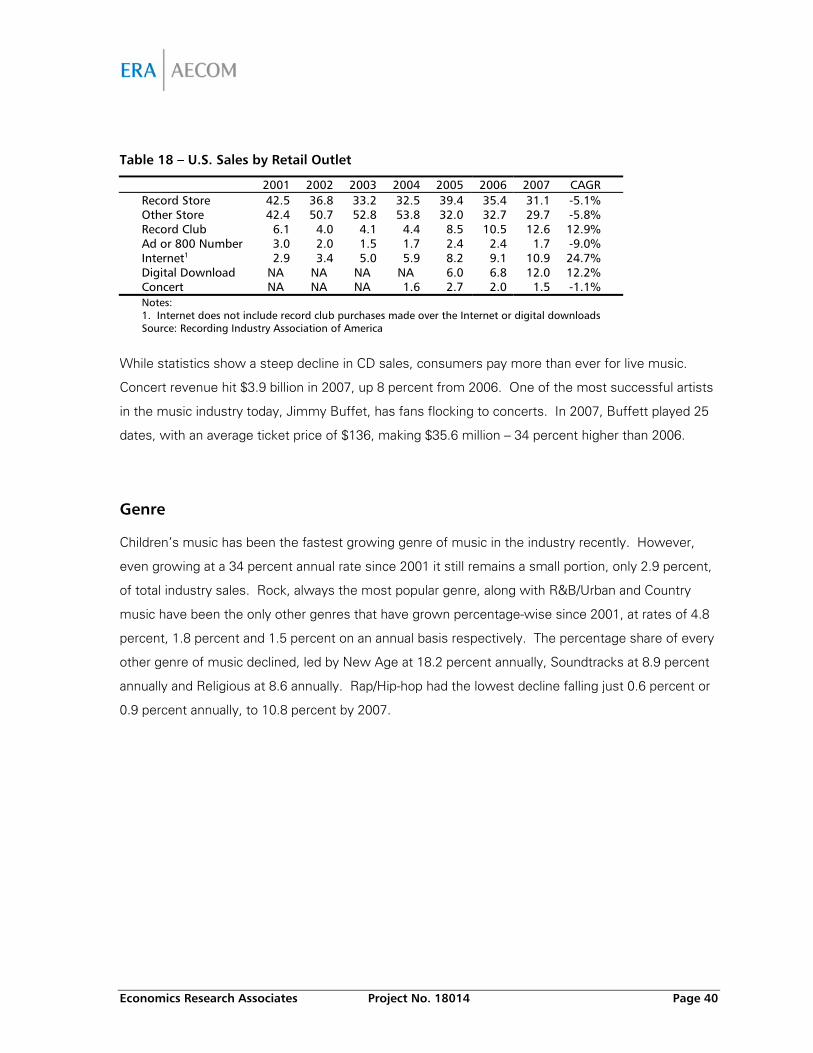
Economics Research Associates Project No. 18014 Page 40
Table 18 – U.S. Sales by Retail Outlet
2001 2002 2003 2004 2005 2006 2007 CAGR Record Store 42.5 36.8 33.2 32.5 39.4 35.4 31.1 -5.1% Other Store 42.4 50.7 52.8 53.8 32.0 32.7 29.7 -5.8% Record Club 6.1 4.0 4.1 4.4 8.5 10.5 12.6 12.9% Ad or 800 Number 3.0 2.0 1.5 1.7 2.4 2.4 1.7 -9.0% Internet1 2.9 3.4 5.0 5.9 8.2 9.1 10.9 24.7% Digital Download NA NA NA NA 6.0 6.8 12.0 12.2% Concert NA NA NA 1.6 2.7 2.0 1.5 -1.1%
Notes: 1. Internet does not include record club purchases made over the Internet or digital downloads Source: Recording Industry Association of America
While statistics show a steep decline in CD sales, consumers pay more than ever for live music.
Concert revenue hit $3.9 billion in 2007, up 8 percent from 2006. One of the most successful artists
in the music industry today, Jimmy Buffet, has fans flocking to concerts. In 2007, Buffett played 25
dates, with an average ticket price of $136, making $35.6 million – 34 percent higher than 2006.
Genre
Children’s music has been the fastest growing genre of music in the industry recently. However,
even growing at a 34 percent annual rate since 2001 it still remains a small portion, only 2.9 percent,
of total industry sales. Rock, always the most popular genre, along with R&B/Urban and Country
music have been the only other genres that have grown percentage-wise since 2001, at rates of 4.8
percent, 1.8 percent and 1.5 percent on an annual basis respectively. The percentage share of every
other genre of music declined, led by New Age at 18.2 percent annually, Soundtracks at 8.9 percent
annually and Religious at 8.6 annually. Rap/Hip-hop had the lowest decline falling just 0.6 percent or
0.9 percent annually, to 10.8 percent by 2007.
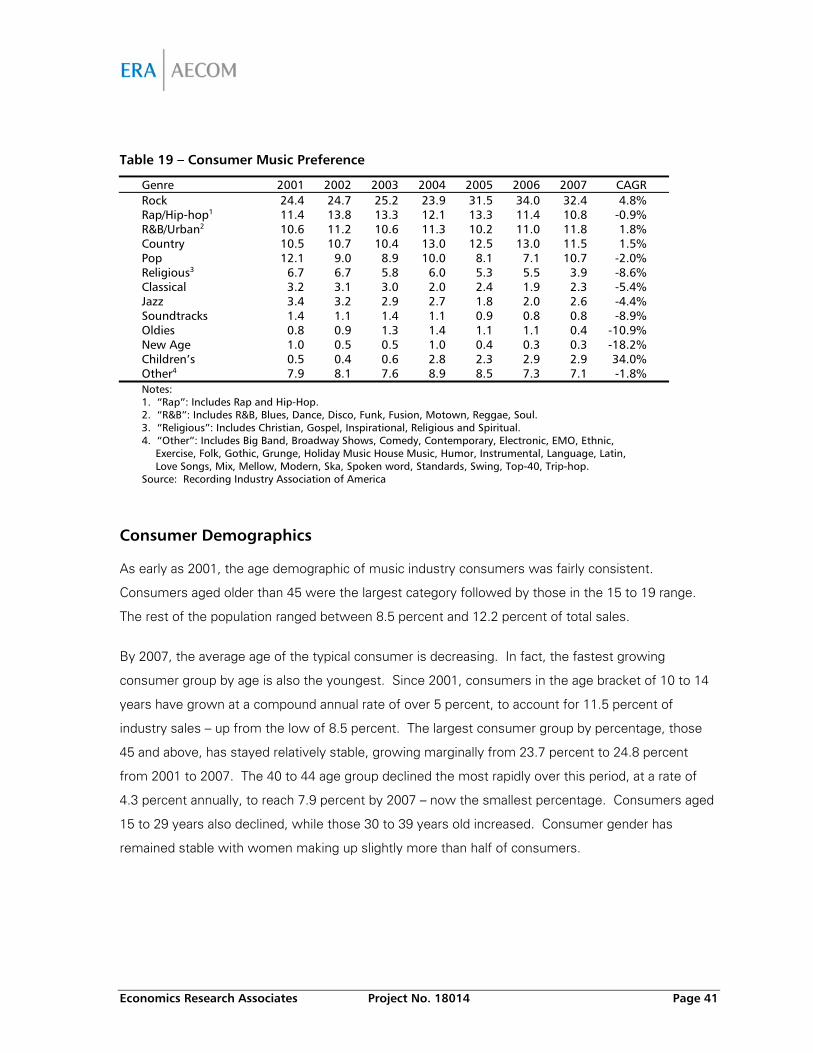
Economics Research Associates Project No. 18014 Page 41
Table 19 – Consumer Music Preference
Genre 2001 2002 2003 2004 2005 2006 2007 CAGR Rock 24.4 24.7 25.2 23.9 31.5 34.0 32.4 4.8% Rap/Hip-hop1 11.4 13.8 13.3 12.1 13.3 11.4 10.8 -0.9% R&B/Urban2 10.6 11.2 10.6 11.3 10.2 11.0 11.8 1.8% Country 10.5 10.7 10.4 13.0 12.5 13.0 11.5 1.5% Pop 12.1 9.0 8.9 10.0 8.1 7.1 10.7 -2.0% Religious3 6.7 6.7 5.8 6.0 5.3 5.5 3.9 -8.6% Classical 3.2 3.1 3.0 2.0 2.4 1.9 2.3 -5.4% Jazz 3.4 3.2 2.9 2.7 1.8 2.0 2.6 -4.4% Soundtracks 1.4 1.1 1.4 1.1 0.9 0.8 0.8 -8.9% Oldies 0.8 0.9 1.3 1.4 1.1 1.1 0.4 -10.9% New Age 1.0 0.5 0.5 1.0 0.4 0.3 0.3 -18.2% Children’s 0.5 0.4 0.6 2.8 2.3 2.9 2.9 34.0% Other4 7.9 8.1 7.6 8.9 8.5 7.3 7.1 -1.8%
Notes: 1. “Rap”: Includes Rap and Hip-Hop. 2. “R&B”: Includes R&B, Blues, Dance, Disco, Funk, Fusion, Motown, Reggae, Soul. 3. “Religious”: Includes Christian, Gospel, Inspirational, Religious and Spiritual. 4. “Other”: Includes Big Band, Broadway Shows, Comedy, Contemporary, Electronic, EMO, Ethnic,
Exercise, Folk, Gothic, Grunge, Holiday Music House Music, Humor, Instrumental, Language, Latin, Love Songs, Mix, Mellow, Modern, Ska, Spoken word, Standards, Swing, Top-40, Trip-hop.
Source: Recording Industry Association of America
Consumer Demographics
As early as 2001, the age demographic of music industry consumers was fairly consistent.
Consumers aged older than 45 were the largest category followed by those in the 15 to 19 range.
The rest of the population ranged between 8.5 percent and 12.2 percent of total sales.
By 2007, the average age of the typical consumer is decreasing. In fact, the fastest growing
consumer group by age is also the youngest. Since 2001, consumers in the age bracket of 10 to 14
years have grown at a compound annual rate of over 5 percent, to account for 11.5 percent of
industry sales – up from the low of 8.5 percent. The largest consumer group by percentage, those
45 and above, has stayed relatively stable, growing marginally from 23.7 percent to 24.8 percent
from 2001 to 2007. The 40 to 44 age group declined the most rapidly over this period, at a rate of
4.3 percent annually, to reach 7.9 percent by 2007 – now the smallest percentage. Consumers aged
15 to 29 years also declined, while those 30 to 39 years old increased. Consumer gender has
remained stable with women making up slightly more than half of consumers.
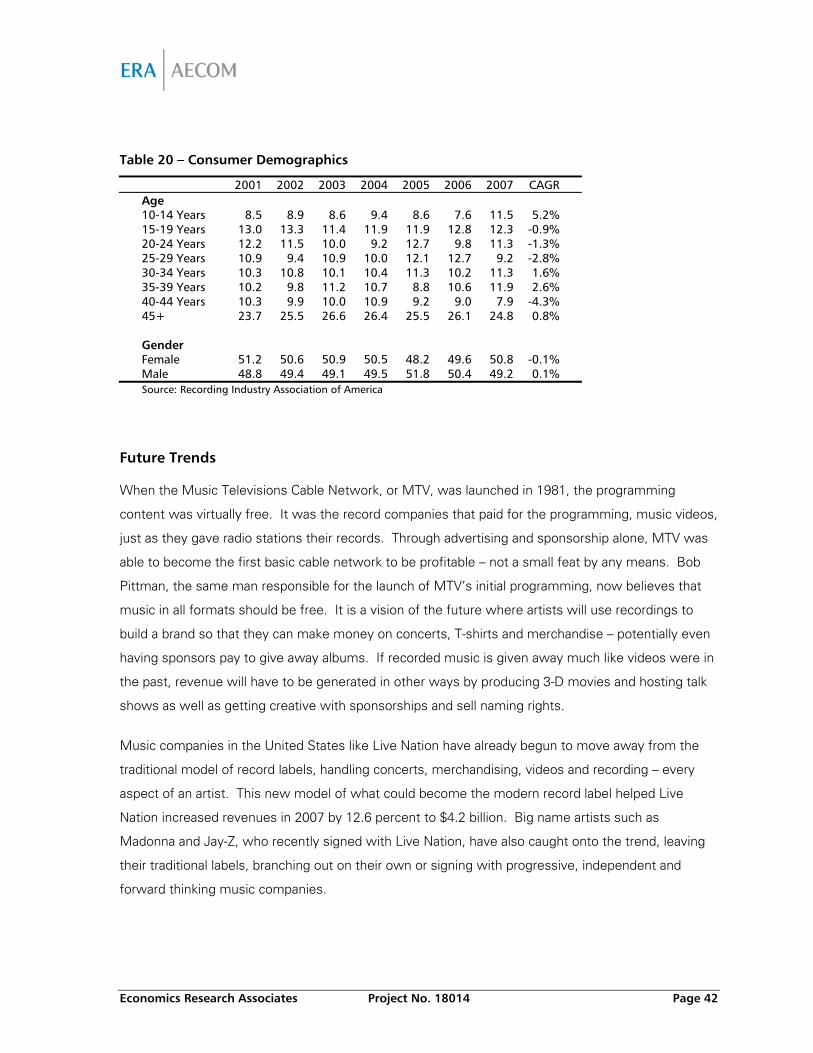
Economics Research Associates Project No. 18014 Page 42
Table 20 – Consumer Demographics
2001 2002 2003 2004 2005 2006 2007 CAGR Age 10-14 Years 8.5 8.9 8.6 9.4 8.6 7.6 11.5 5.2% 15-19 Years 13.0 13.3 11.4 11.9 11.9 12.8 12.3 -0.9% 20-24 Years 12.2 11.5 10.0 9.2 12.7 9.8 11.3 -1.3% 25-29 Years 10.9 9.4 10.9 10.0 12.1 12.7 9.2 -2.8% 30-34 Years 10.3 10.8 10.1 10.4 11.3 10.2 11.3 1.6% 35-39 Years 10.2 9.8 11.2 10.7 8.8 10.6 11.9 2.6% 40-44 Years 10.3 9.9 10.0 10.9 9.2 9.0 7.9 -4.3% 45+ 23.7 25.5 26.6 26.4 25.5 26.1 24.8 0.8% Gender Female 51.2 50.6 50.9 50.5 48.2 49.6 50.8 -0.1% Male 48.8 49.4 49.1 49.5 51.8 50.4 49.2 0.1%
Source: Recording Industry Association of America
Future Trends
When the Music Televisions Cable Network, or MTV, was launched in 1981, the programming
content was virtually free. It was the record companies that paid for the programming, music videos,
just as they gave radio stations their records. Through advertising and sponsorship alone, MTV was
able to become the first basic cable network to be profitable – not a small feat by any means. Bob
Pittman, the same man responsible for the launch of MTV’s initial programming, now believes that
music in all formats should be free. It is a vision of the future where artists will use recordings to
build a brand so that they can make money on concerts, T-shirts and merchandise – potentially even
having sponsors pay to give away albums. If recorded music is given away much like videos were in
the past, revenue will have to be generated in other ways by producing 3-D movies and hosting talk
shows as well as getting creative with sponsorships and sell naming rights.
Music companies in the United States like Live Nation have already begun to move away from the
traditional model of record labels, handling concerts, merchandising, videos and recording – every
aspect of an artist. This new model of what could become the modern record label helped Live
Nation increased revenues in 2007 by 12.6 percent to $4.2 billion. Big name artists such as
Madonna and Jay-Z, who recently signed with Live Nation, have also caught onto the trend, leaving
their traditional labels, branching out on their own or signing with progressive, independent and
forward thinking music companies.
Economics Research Associates Project No. 18014 Page 43
V. Louisiana’s Music Industry
Compared to the film industry, Louisiana’s music industry is significantly smaller. However, after the
documented success of state incentive programs to grow and develop the film industry, a similar
package was created to jumpstart the sound recording industry. Sound recordings include the
production of new master recordings of music released on CDs, digital downloads, soundtracks for
film or TV or part of a commercial or video game.
Employment Trends
The following table documents the size of the overall music industry in the United States and
Louisiana. The overall trend appears to be one of consolidation with fewer companies in 2007 than
in 2001 with fewer employees. Employment fell at an average annual rate of 3.3 percent since 2001
while the number of companies fell at a rate of 2 percent nationally. On the positive side, the
average pay has been increasing. The music industry in Louisiana is relatively small with less than
100 firms in the state and less than one percent (0.6%) of the industry’s total employment. In 2007,
there were 370 people employed at 89 firms in Louisiana. Despite enacting legislation to encourage
the development of this industry in Louisiana, there has been a slight decline in the industry, in part
reflecting national trends as well as the effects of Hurricane Katrina. As with employment in the
motion picture industry, many jobs in the music industry are characterized by part-time and short-
term projects in Louisiana, not traditional full-time, year-round employment. Many musicians, like
actors, are employed full-time in other industries in order to supplement their wages.
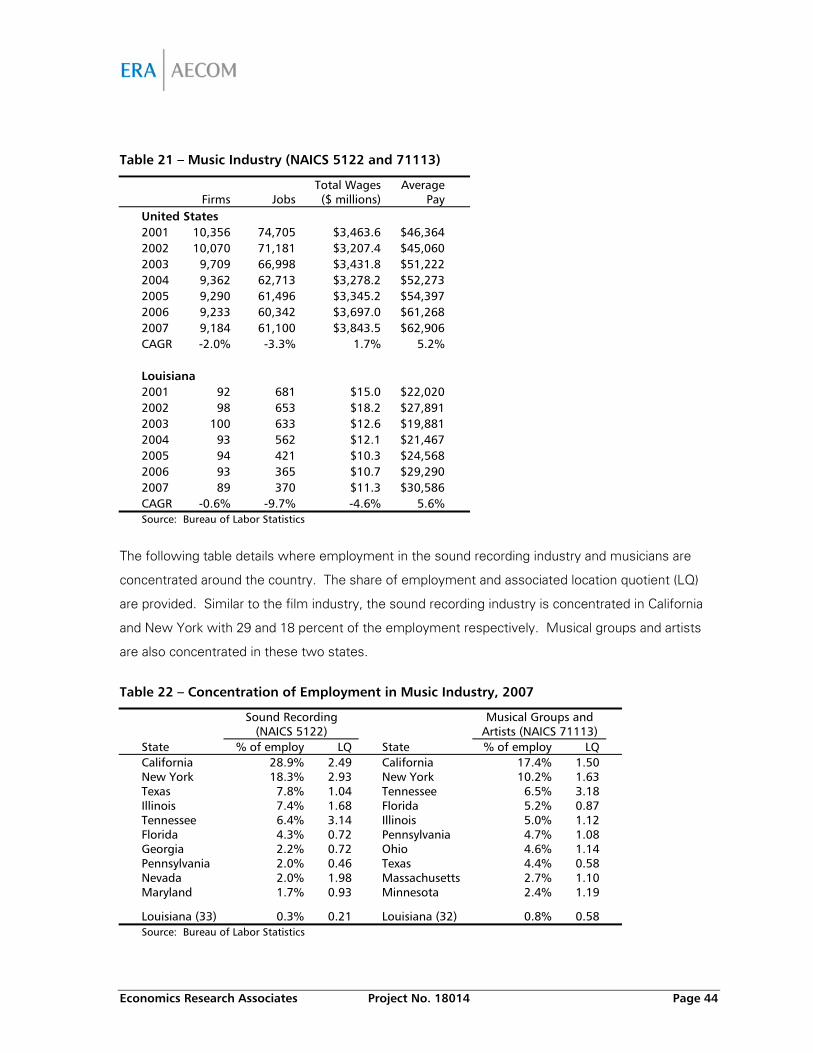
Economics Research Associates Project No. 18014 Page 44
Table 21 – Music Industry (NAICS 5122 and 71113)
Firms Jobs
Total Wages ($ millions)
Average Pay
United States 2001 10,356 74,705 $3,463.6 $46,364 2002 10,070 71,181 $3,207.4 $45,060 2003 9,709 66,998 $3,431.8 $51,222 2004 9,362 62,713 $3,278.2 $52,273 2005 9,290 61,496 $3,345.2 $54,397 2006 9,233 60,342 $3,697.0 $61,268 2007 9,184 61,100 $3,843.5 $62,906 CAGR -2.0% -3.3% 1.7% 5.2% Louisiana 2001 92 681 $15.0 $22,020 2002 98 653 $18.2 $27,891 2003 100 633 $12.6 $19,881 2004 93 562 $12.1 $21,467 2005 94 421 $10.3 $24,568 2006 93 365 $10.7 $29,290 2007 89 370 $11.3 $30,586 CAGR -0.6% -9.7% -4.6% 5.6% Source: Bureau of Labor Statistics
The following table details where employment in the sound recording industry and musicians are
concentrated around the country. The share of employment and associated location quotient (LQ)
are provided. Similar to the film industry, the sound recording industry is concentrated in California
and New York with 29 and 18 percent of the employment respectively. Musical groups and artists
are also concentrated in these two states.
Table 22 – Concentration of Employment in Music Industry, 2007
Sound Recording
(NAICS 5122) Musical Groups and
Artists (NAICS 71113) State % of employ LQ State % of employ LQ California 28.9% 2.49 California 17.4% 1.50 New York 18.3% 2.93 New York 10.2% 1.63 Texas 7.8% 1.04 Tennessee 6.5% 3.18 Illinois 7.4% 1.68 Florida 5.2% 0.87 Tennessee 6.4% 3.14 Illinois 5.0% 1.12 Florida 4.3% 0.72 Pennsylvania 4.7% 1.08 Georgia 2.2% 0.72 Ohio 4.6% 1.14 Pennsylvania 2.0% 0.46 Texas 4.4% 0.58 Nevada 2.0% 1.98 Massachusetts 2.7% 1.10 Maryland 1.7% 0.93 Minnesota 2.4% 1.19
Louisiana (33) 0.3% 0.21 Louisiana (32) 0.8% 0.58
Source: Bureau of Labor Statistics
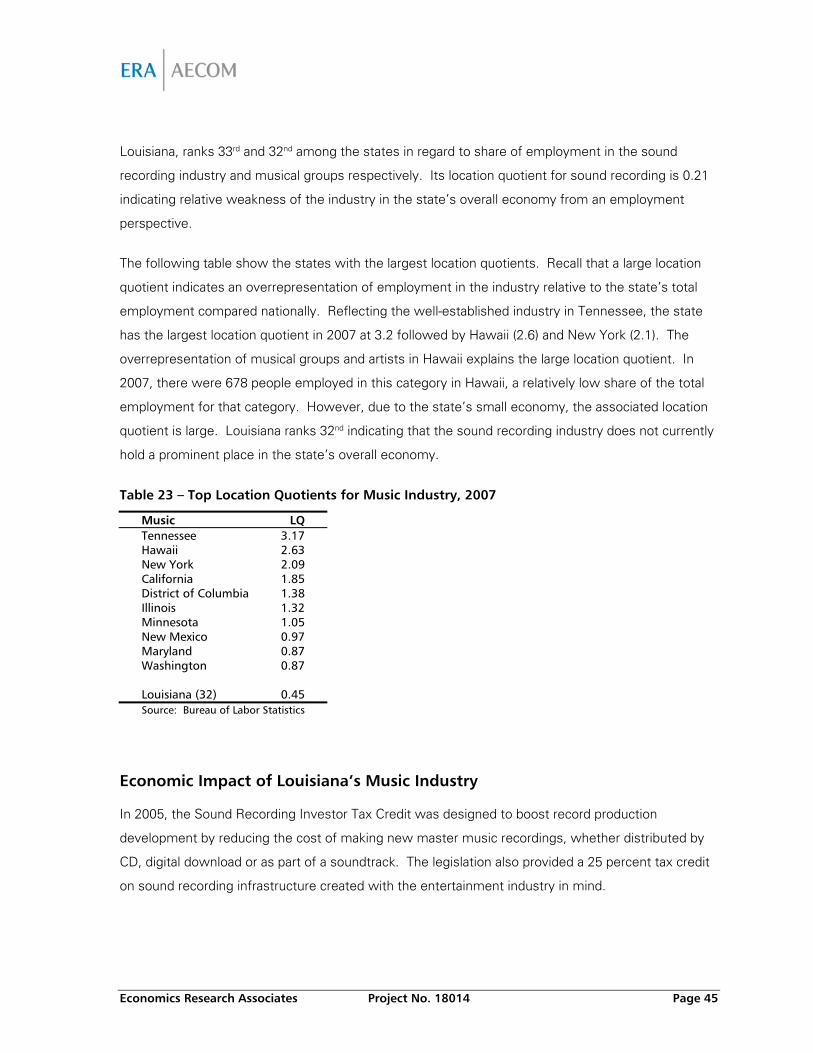
Economics Research Associates Project No. 18014 Page 45
Louisiana, ranks 33rd and 32nd among the states in regard to share of employment in the sound
recording industry and musical groups respectively. Its location quotient for sound recording is 0.21
indicating relative weakness of the industry in the state’s overall economy from an employment
perspective.
The following table show the states with the largest location quotients. Recall that a large location
quotient indicates an overrepresentation of employment in the industry relative to the state’s total
employment compared nationally. Reflecting the well-established industry in Tennessee, the state
has the largest location quotient in 2007 at 3.2 followed by Hawaii (2.6) and New York (2.1). The
overrepresentation of musical groups and artists in Hawaii explains the large location quotient. In
2007, there were 678 people employed in this category in Hawaii, a relatively low share of the total
employment for that category. However, due to the state’s small economy, the associated location
quotient is large. Louisiana ranks 32nd indicating that the sound recording industry does not currently
hold a prominent place in the state’s overall economy.
Table 23 – Top Location Quotients for Music Industry, 2007
Music LQ Tennessee 3.17 Hawaii 2.63 New York 2.09 California 1.85 District of Columbia 1.38 Illinois 1.32 Minnesota 1.05 New Mexico 0.97 Maryland 0.87 Washington 0.87 Louisiana (32) 0.45 Source: Bureau of Labor Statistics
Economic Impact of Louisiana’s Music Industry
In 2005, the Sound Recording Investor Tax Credit was designed to boost record production
development by reducing the cost of making new master music recordings, whether distributed by
CD, digital download or as part of a soundtrack. The legislation also provided a 25 percent tax credit
on sound recording infrastructure created with the entertainment industry in mind.
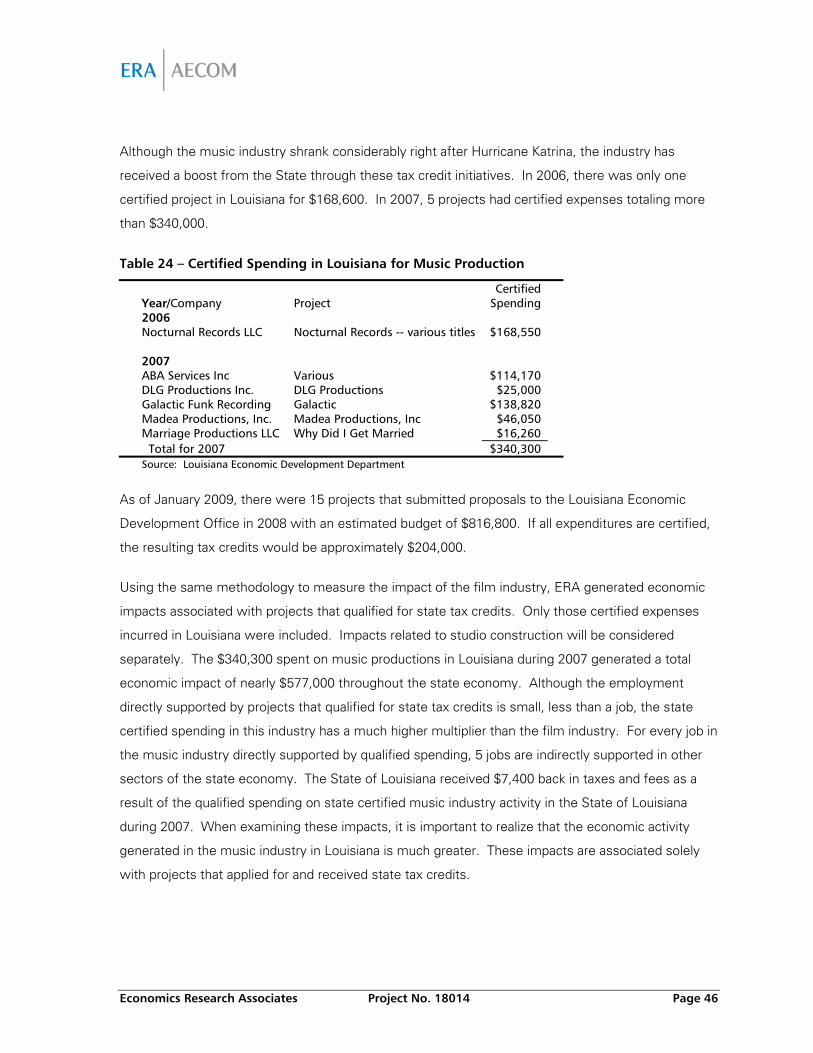
Economics Research Associates Project No. 18014 Page 46
Although the music industry shrank considerably right after Hurricane Katrina, the industry has
received a boost from the State through these tax credit initiatives. In 2006, there was only one
certified project in Louisiana for $168,600. In 2007, 5 projects had certified expenses totaling more
than $340,000.
Table 24 – Certified Spending in Louisiana for Music Production
Year/Company Project Certified
Spending
2006 Nocturnal Records LLC Nocturnal Records -- various titles $168,550 2007 ABA Services Inc Various $114,170 DLG Productions Inc. DLG Productions $25,000 Galactic Funk Recording Galactic $138,820 Madea Productions, Inc. Madea Productions, Inc $46,050 Marriage Productions LLC Why Did I Get Married $16,260 Total for 2007 $340,300
Source: Louisiana Economic Development Department
As of January 2009, there were 15 projects that submitted proposals to the Louisiana Economic
Development Office in 2008 with an estimated budget of $816,800. If all expenditures are certified,
the resulting tax credits would be approximately $204,000.
Using the same methodology to measure the impact of the film industry, ERA generated economic
impacts associated with projects that qualified for state tax credits. Only those certified expenses
incurred in Louisiana were included. Impacts related to studio construction will be considered
separately. The $340,300 spent on music productions in Louisiana during 2007 generated a total
economic impact of nearly $577,000 throughout the state economy. Although the employment
directly supported by projects that qualified for state tax credits is small, less than a job, the state
certified spending in this industry has a much higher multiplier than the film industry. For every job in
the music industry directly supported by qualified spending, 5 jobs are indirectly supported in other
sectors of the state economy. The State of Louisiana received $7,400 back in taxes and fees as a
result of the qualified spending on state certified music industry activity in the State of Louisiana
during 2007. When examining these impacts, it is important to realize that the economic activity
generated in the music industry in Louisiana is much greater. These impacts are associated solely
with projects that applied for and received state tax credits.
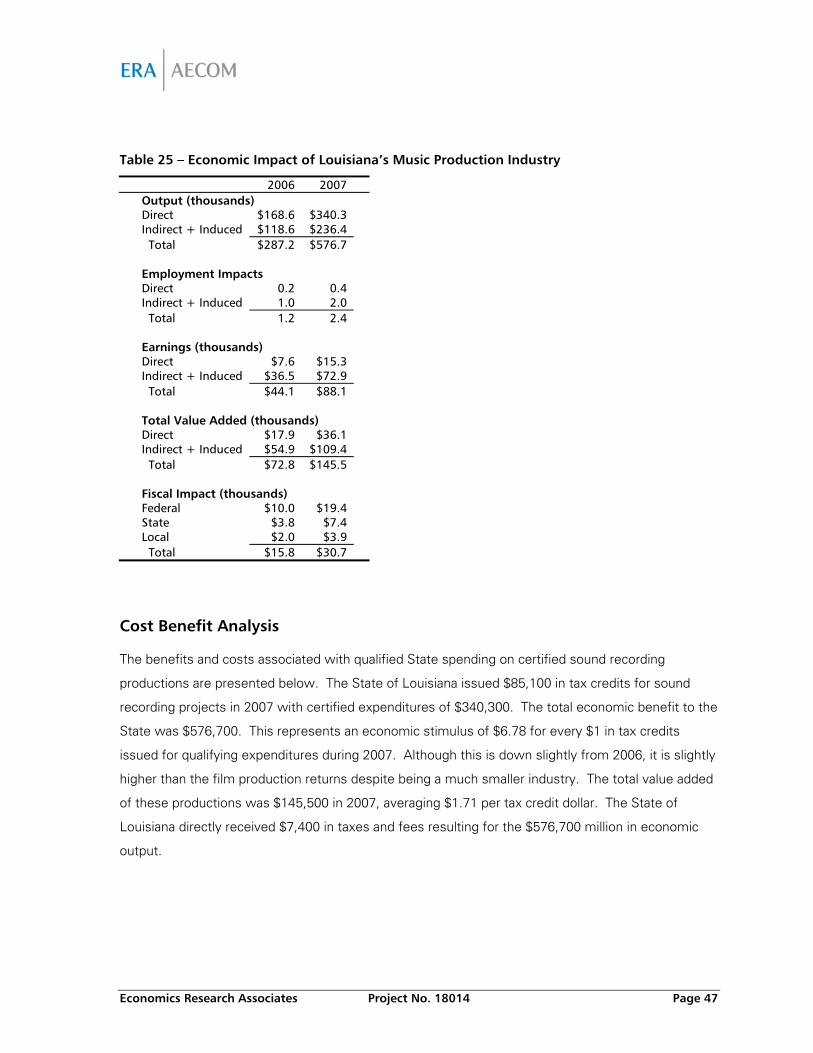
Economics Research Associates Project No. 18014 Page 47
Table 25 – Economic Impact of Louisiana’s Music Production Industry
2006 2007 Output (thousands) Direct $168.6 $340.3 Indirect + Induced $118.6 $236.4 Total $287.2 $576.7 Employment Impacts Direct 0.2 0.4 Indirect + Induced 1.0 2.0 Total 1.2 2.4 Earnings (thousands) Direct $7.6 $15.3 Indirect + Induced $36.5 $72.9 Total $44.1 $88.1 Total Value Added (thousands) Direct $17.9 $36.1 Indirect + Induced $54.9 $109.4 Total $72.8 $145.5 Fiscal Impact (thousands) Federal $10.0 $19.4 State $3.8 $7.4 Local $2.0 $3.9 Total $15.8 $30.7
Cost Benefit Analysis
The benefits and costs associated with qualified State spending on certified sound recording
productions are presented below. The State of Louisiana issued $85,100 in tax credits for sound
recording projects in 2007 with certified expenditures of $340,300. The total economic benefit to the
State was $576,700. This represents an economic stimulus of $6.78 for every $1 in tax credits
issued for qualifying expenditures during 2007. Although this is down slightly from 2006, it is slightly
higher than the film production returns despite being a much smaller industry. The total value added
of these productions was $145,500 in 2007, averaging $1.71 per tax credit dollar. The State of
Louisiana directly received $7,400 in taxes and fees resulting for the $576,700 million in economic
output.
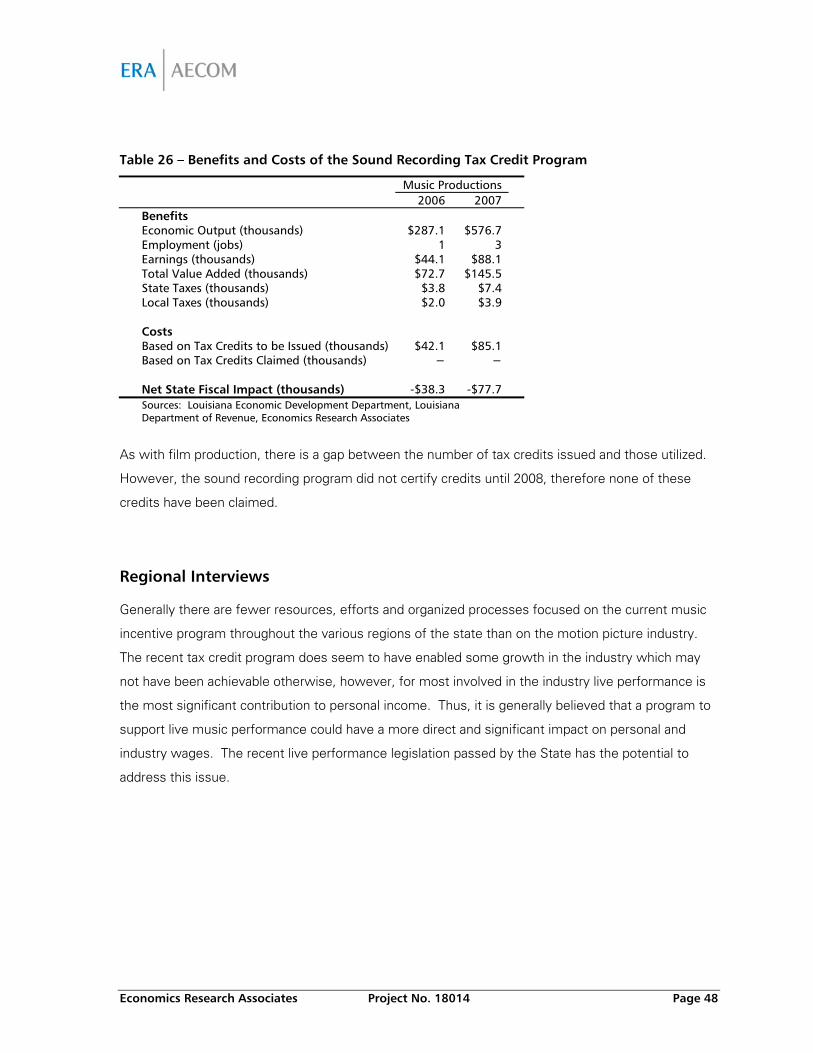
Economics Research Associates Project No. 18014 Page 48
Table 26 – Benefits and Costs of the Sound Recording Tax Credit Program
Music Productions 2006 2007 Benefits Economic Output (thousands) $287.1 $576.7 Employment (jobs) 1 3 Earnings (thousands) $44.1 $88.1 Total Value Added (thousands) $72.7 $145.5 State Taxes (thousands) $3.8 $7.4 Local Taxes (thousands) $2.0 $3.9 Costs Based on Tax Credits to be Issued (thousands) $42.1 $85.1 Based on Tax Credits Claimed (thousands) − − Net State Fiscal Impact (thousands) -$38.3 -$77.7 Sources: Louisiana Economic Development Department, Louisiana
Department of Revenue, Economics Research Associates
As with film production, there is a gap between the number of tax credits issued and those utilized.
However, the sound recording program did not certify credits until 2008, therefore none of these
credits have been claimed.
Regional Interviews
Generally there are fewer resources, efforts and organized processes focused on the current music
incentive program throughout the various regions of the state than on the motion picture industry.
The recent tax credit program does seem to have enabled some growth in the industry which may
not have been achievable otherwise, however, for most involved in the industry live performance is
the most significant contribution to personal income. Thus, it is generally believed that a program to
support live music performance could have a more direct and significant impact on personal and
industry wages. The recent live performance legislation passed by the State has the potential to
address this issue.
Economics Research Associates Project No. 18014 Page 49
VI. Overview of the Digital Media Industry
Digital media simply defined is media that can be delivered electronically. However, this can
encompass a wide variety of products and a precise, agreed upon definition is difficult to come by.
For example, the Digital Media Alliance Florida, a digital media industry association, defines digital
media as “the creative convergence of digital arts, science, technology and business for human
expression, communication, social interaction and education.” Most often, when digital media is
referred to it includes things such as:
E-commerce
Electronic games played online, on cell phones or video game consoles
Internet publishing of books, music and videos
Mobile communication including cell phones and GPS navigation
Online learning
Video conferencing
Watching film, television, videos on the Internet
Web design and development
Although digital media can take many forms, what is agreed upon is that digital media is transforming
how people create and tell visual stories and how audiences watch and discuss them. For purposes
of this analysis, we will focus in on the evolution and current state of the video game industry since
that is the focus of Louisiana’s Digital Interactive Media Act.
Video games actually have their history in coin operated games such as pinball which have been
around since the 1880s. As the electromechanical pinball components were replaced with new
electronic circuitry, the games moved quickly across the country. The game, Spacewar, developed
in 1962 by an MIT graduate student was one of the first video games played on a PDP-1 mainframe
computer. In 1968 the first console that could be used to display games on television sets was
developed and sold to Magnavox. However it wasn’t until the early 1970s that the price of electronic
computing power made electronic games more economically feasible. Although their original intent
was to transform Spacewar, which had a large cult following among computer buffs, into a coin-op
game, they instead developed a simple tennis-like game called Pong. Pong was a huge hit which
triggered the development of home video games. The market became oversaturated however and
interest began waning until Space Invaders, an arcade game, was introduced. In addition to
capturing wide audience interest, it was the first machine game to demonstrate the emerging
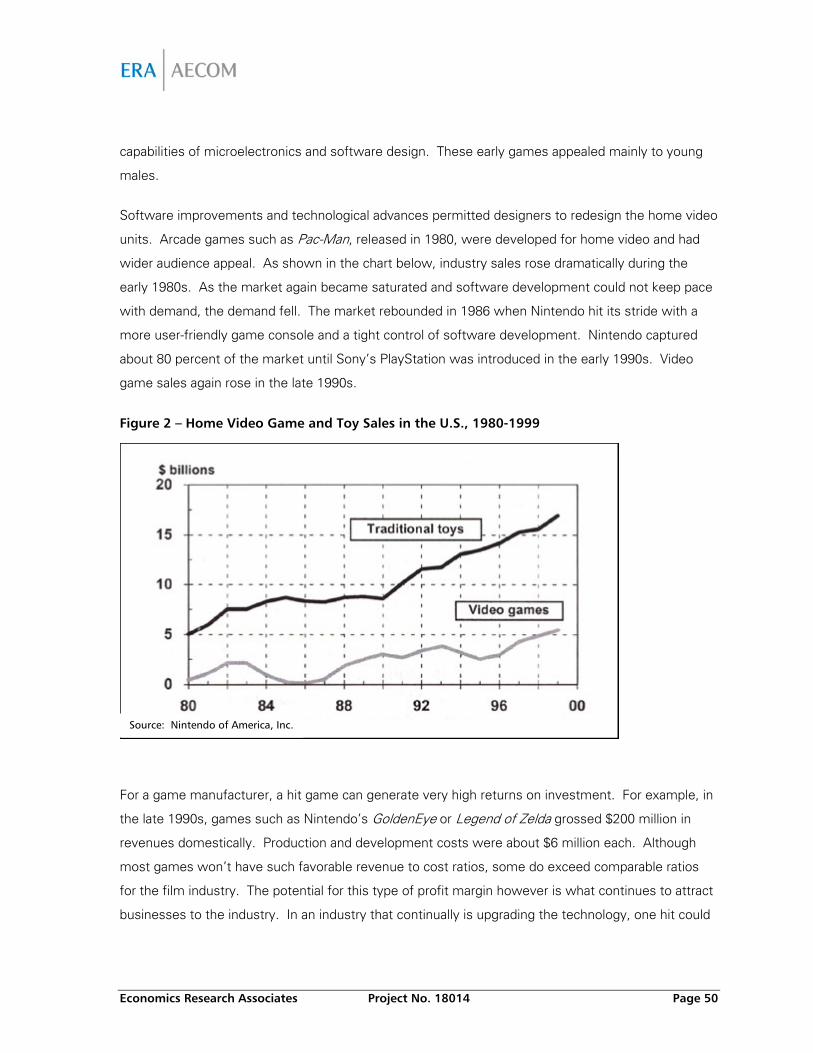
Economics Research Associates Project No. 18014 Page 50
capabilities of microelectronics and software design. These early games appealed mainly to young
males.
Software improvements and technological advances permitted designers to redesign the home video
units. Arcade games such as Pac-Man, released in 1980, were developed for home video and had
wider audience appeal. As shown in the chart below, industry sales rose dramatically during the
early 1980s. As the market again became saturated and software development could not keep pace
with demand, the demand fell. The market rebounded in 1986 when Nintendo hit its stride with a
more user-friendly game console and a tight control of software development. Nintendo captured
about 80 percent of the market until Sony’s PlayStation was introduced in the early 1990s. Video
game sales again rose in the late 1990s.
Figure 2 – Home Video Game and Toy Sales in the U.S., 1980-1999
For a game manufacturer, a hit game can generate very high returns on investment. For example, in
the late 1990s, games such as Nintendo’s GoldenEye or Legend of Zelda grossed $200 million in
revenues domestically. Production and development costs were about $6 million each. Although
most games won’t have such favorable revenue to cost ratios, some do exceed comparable ratios
for the film industry. The potential for this type of profit margin however is what continues to attract
businesses to the industry. In an industry that continually is upgrading the technology, one hit could
Source: Nintendo of America, Inc.
Economics Research Associates Project No. 18014 Page 51
offset the costs of lower returns on other products making the investment worthwhile for many
developers and software companies.
Video games, which were once solitary diversions, have been transformed and appeal to diverse
segments of the population. Games have been developed for people to use for play, work and
educational purposes. In addition to the traditional arcade game experiences, users can solve
puzzles, “play” simulated instruments, “hit” a tennis ball, design cities, etc. Some such games are
interactive with players connected through the Internet. Companies and organizations are using
games to reach and inform tech savvy consumers. For example, the United Nations World Food
Programme created a computer game to educate children about world hunger. The National
Education Association recommends city building games to improve students’ problem-solving and
analytical skills. And large corporations are developing interactive training that includes game-like
simulations. In Louisiana, the offensive coordinator for Louisiana State University’s football team
used a custom made video game to help his quarterbacks learn to read defenses.
State of the Video Game Industry
The entertainment software industry, defined as firms that develop and/or publish entertainment
software for use with a personal computer, game console, mobile device or online, is one of the best
performing sectors in the U.S. economy. According to a recent report by the Entertainment
Software Association (ESA), revenues in the entertainment software industry increased at an
average annual rate of 12.5 percent since 1996, far outpacing the national economy. In 1996, the
U.S. entertainment software industry accounted for a modest 74.1 million units sold and $2.6 billion
in sales revenue. In 2007, computer and video game companies sold 267.8 million units generating
$9.5 billion in revenue.
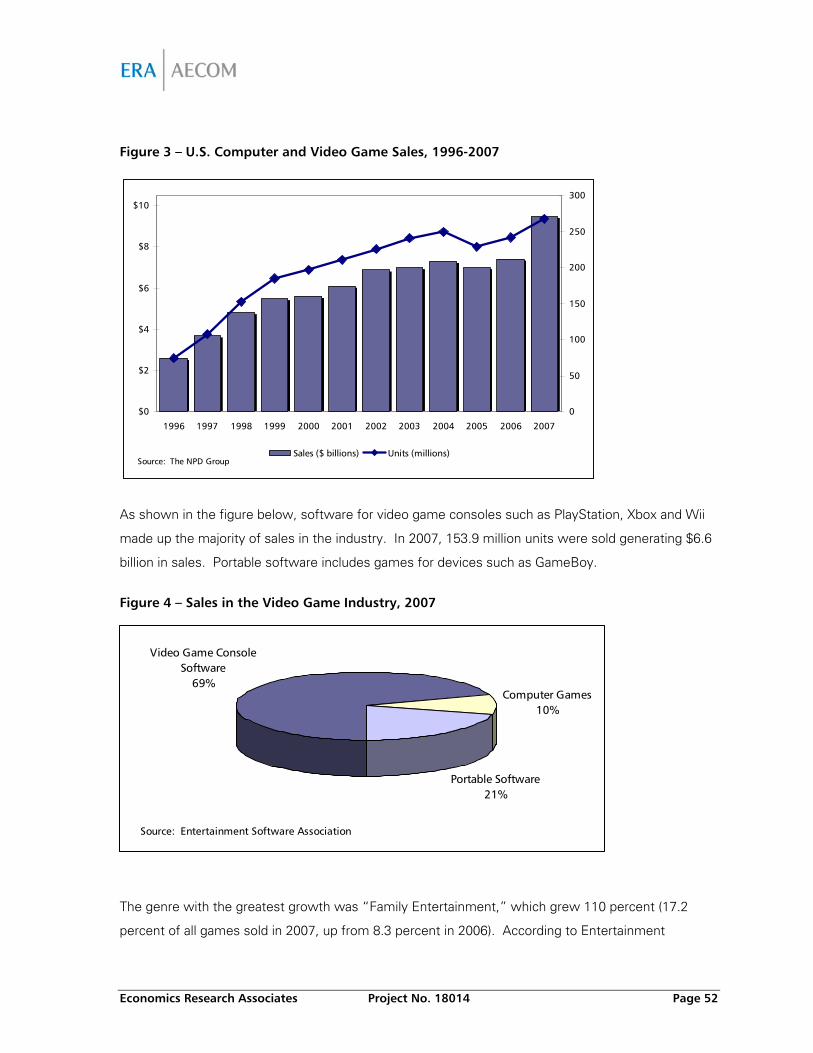
Economics Research Associates Project No. 18014 Page 52
Figure 3 – U.S. Computer and Video Game Sales, 1996-2007
$0
$2
$4
$6
$8
$10
1996 1997 1998 1999 2000 2001 2002 2003 2004 2005 2006 2007
Source: The NPD Group
0
50
100
150
200
250
300
Sales ($ billions) Units (millions)
As shown in the figure below, software for video game consoles such as PlayStation, Xbox and Wii
made up the majority of sales in the industry. In 2007, 153.9 million units were sold generating $6.6
billion in sales. Portable software includes games for devices such as GameBoy.
Figure 4 – Sales in the Video Game Industry, 2007
The genre with the greatest growth was “Family Entertainment,” which grew 110 percent (17.2
percent of all games sold in 2007, up from 8.3 percent in 2006). According to Entertainment
Source: Entertainment Software Association
Video Game Console Software
69%Computer Games
10%
Portable Software21%
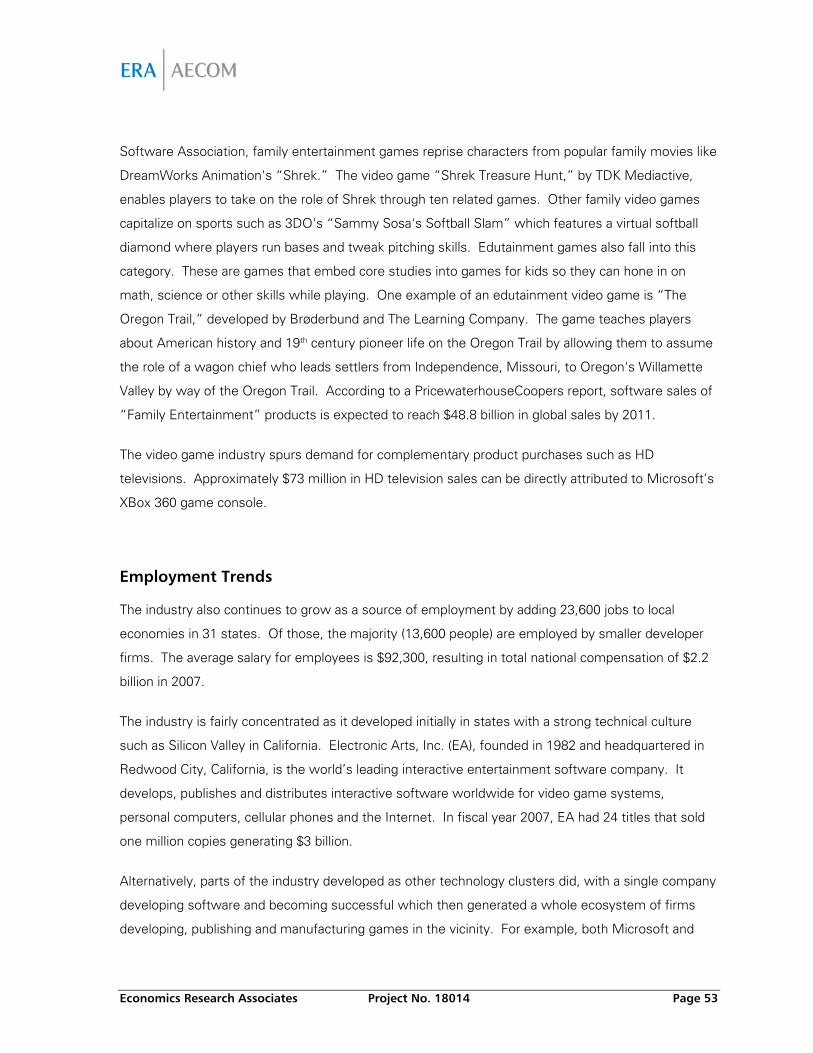
Economics Research Associates Project No. 18014 Page 53
Software Association, family entertainment games reprise characters from popular family movies like
DreamWorks Animation's “Shrek.” The video game “Shrek Treasure Hunt,” by TDK Mediactive,
enables players to take on the role of Shrek through ten related games. Other family video games
capitalize on sports such as 3DO's “Sammy Sosa's Softball Slam” which features a virtual softball
diamond where players run bases and tweak pitching skills. Edutainment games also fall into this
category. These are games that embed core studies into games for kids so they can hone in on
math, science or other skills while playing. One example of an edutainment video game is “The
Oregon Trail,” developed by Brøderbund and The Learning Company. The game teaches players
about American history and 19th century pioneer life on the Oregon Trail by allowing them to assume
the role of a wagon chief who leads settlers from Independence, Missouri, to Oregon's Willamette
Valley by way of the Oregon Trail. According to a PricewaterhouseCoopers report, software sales of
“Family Entertainment” products is expected to reach $48.8 billion in global sales by 2011.
The video game industry spurs demand for complementary product purchases such as HD
televisions. Approximately $73 million in HD television sales can be directly attributed to Microsoft’s
XBox 360 game console.
Employment Trends
The industry also continues to grow as a source of employment by adding 23,600 jobs to local
economies in 31 states. Of those, the majority (13,600 people) are employed by smaller developer
firms. The average salary for employees is $92,300, resulting in total national compensation of $2.2
billion in 2007.
The industry is fairly concentrated as it developed initially in states with a strong technical culture
such as Silicon Valley in California. Electronic Arts, Inc. (EA), founded in 1982 and headquartered in
Redwood City, California, is the world’s leading interactive entertainment software company. It
develops, publishes and distributes interactive software worldwide for video game systems,
personal computers, cellular phones and the Internet. In fiscal year 2007, EA had 24 titles that sold
one million copies generating $3 billion.
Alternatively, parts of the industry developed as other technology clusters did, with a single company
developing software and becoming successful which then generated a whole ecosystem of firms
developing, publishing and manufacturing games in the vicinity. For example, both Microsoft and
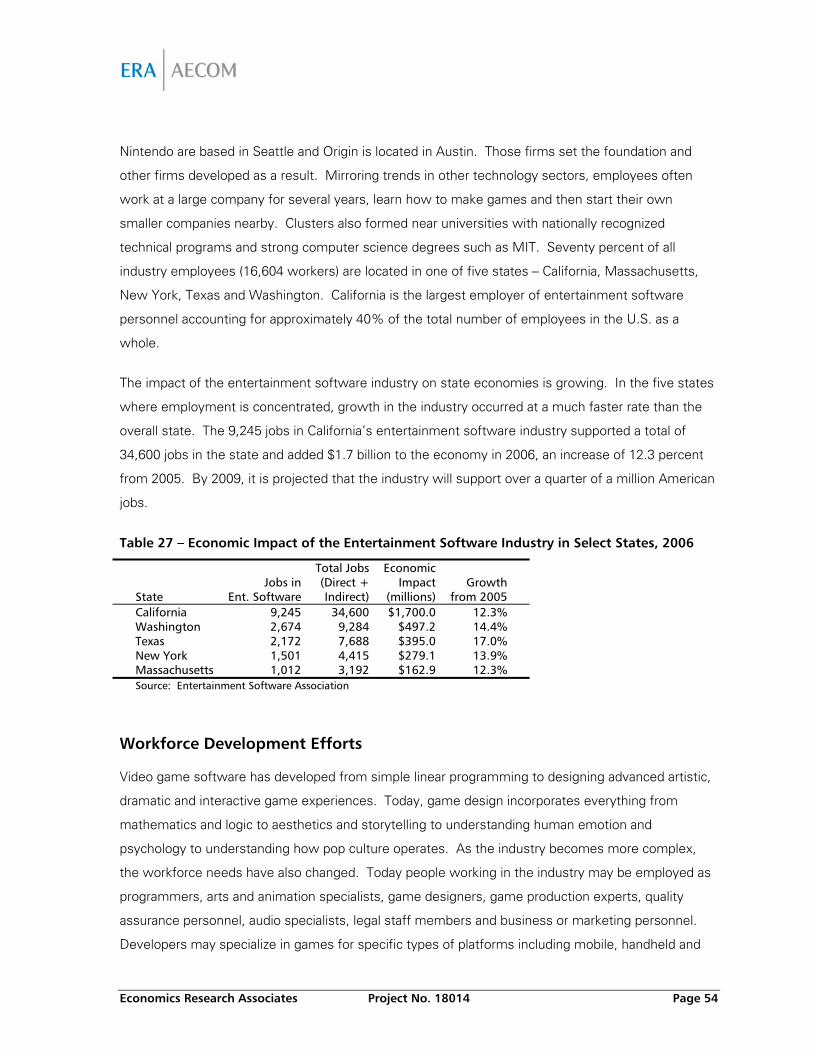
Economics Research Associates Project No. 18014 Page 54
Nintendo are based in Seattle and Origin is located in Austin. Those firms set the foundation and
other firms developed as a result. Mirroring trends in other technology sectors, employees often
work at a large company for several years, learn how to make games and then start their own
smaller companies nearby. Clusters also formed near universities with nationally recognized
technical programs and strong computer science degrees such as MIT. Seventy percent of all
industry employees (16,604 workers) are located in one of five states – California, Massachusetts,
New York, Texas and Washington. California is the largest employer of entertainment software
personnel accounting for approximately 40% of the total number of employees in the U.S. as a
whole.
The impact of the entertainment software industry on state economies is growing. In the five states
where employment is concentrated, growth in the industry occurred at a much faster rate than the
overall state. The 9,245 jobs in California’s entertainment software industry supported a total of
34,600 jobs in the state and added $1.7 billion to the economy in 2006, an increase of 12.3 percent
from 2005. By 2009, it is projected that the industry will support over a quarter of a million American
jobs.
Table 27 – Economic Impact of the Entertainment Software Industry in Select States, 2006
State
Jobs in
Ent. Software
Total Jobs (Direct + Indirect)
Economic Impact
(millions)
Growth
from 2005
California 9,245 34,600 $1,700.0 12.3% Washington 2,674 9,284 $497.2 14.4% Texas 2,172 7,688 $395.0 17.0% New York 1,501 4,415 $279.1 13.9% Massachusetts 1,012 3,192 $162.9 12.3% Source: Entertainment Software Association
Workforce Development Efforts
Video game software has developed from simple linear programming to designing advanced artistic,
dramatic and interactive game experiences. Today, game design incorporates everything from
mathematics and logic to aesthetics and storytelling to understanding human emotion and
psychology to understanding how pop culture operates. As the industry becomes more complex,
the workforce needs have also changed. Today people working in the industry may be employed as
programmers, arts and animation specialists, game designers, game production experts, quality
assurance personnel, audio specialists, legal staff members and business or marketing personnel.
Developers may specialize in games for specific types of platforms including mobile, handheld and
Economics Research Associates Project No. 18014 Page 55
online media. The production of a single video game can create 35 jobs in a small company and up
to 250 jobs in a large company. The production cycle is typically between three and five years.
To develop and support this industry, a concentrated and highly skilled workforce is essential. Thus
specialized training relating to various industry functions is viewed as an important prerequisite to
ongoing industry development in this field. Many universities across the country are developing
programs to meet these workforce needs. Across the United States, there are several schools
offering video game degrees, most notably are the University of Southern California (USC) and
Worcester Polytechnic Institute in Massachusetts. USC offers a minor and major in video game
design and management at the undergraduate and graduate level and Worcester Polytechnic
Institute offers a bachelor’s of science in interactive media and game development. New York
University (NYU) recently announced that beginning in the Fall of 2009, the NYC Game Center will
offer undergraduate and graduate programs in the research, design and development of digital
games.
Gamers
The entertainment software industry creates a wide variety of computer and video games to meet
the diverse interests of gamers. The millions of Americans playing games come from all ages and
backgrounds. According to a 2008 consumer survey conducted by the Entertainment Software
Association (ESA), nearly two-thirds of all American households play computer or video games. The
average gamer is 35 years old and has been playing for 13 years. In fact, there were slightly more
gamers over the age of 50 (26%) than under the age of 18 (25%). As the very first gamers have
grown up, they are introducing games to their children. While more men play games than women,
60 percent of gamers are male, adult women represent a greater portion of the gaming population
(33 percent) than boys ages 17 or younger (15 percent).
People are changing the way in which they play games as well with more people playing online. In
2004, only 8 percent of frequent game players said they played online. This increased to 22 percent
by 2008. Another trend is gaming on wireless handheld devices such as cell phone and PDAs with
more than one-third of American heads of households (36%) using them. This is up from 20 percent
in 2002.
Economics Research Associates Project No. 18014 Page 56
Future of the Industry
The video game industry has evolved from a few companies producing rudimentary games such as
Spacewar, Pong and Pac Man that appealed mainly to young males into an economic powerhouse.
The recent success of home gaming systems such as Nintendo’s Wii, PlayStation 2 and Xbox 360
has opened up the industry and the games being created have a much broader reach. Entertainment
software has become one of the fastest growing segments within the entertainment industry.
As for where the industry is heading, there are several trends worth watching. As broadband
Internet becomes more accessible, video games may become more available for digital distribution.
Although the majority of game sales occur in tradition retail outlets such as Wal-Mart and Best Buy,
downloadable games and component upgrades are increasing in overall market share. Microsoft’s
Xbox 360, PlayStation 3 and the Nintendo Wii all currently offer their own online marketplaces to
download smaller games and purchase add-ons and upgrades. Another trend developing is the
inclusion of advertisements in downloadable games.
As for the future of game development, there are two separate trains of thought. Some believe that
as computers evolve, games will increasingly incorporate artificial intelligence and virtual reality
capabilities. These games will require more than just hand-eye coordination but rather complex
strategies and abstract reasoning to play. On the other hand, reflecting the diverse spectrum of
gamers, some experts predict that video games will be easier to comprehend and shorter in length in
order to reach a wider audience.
Innovation will be the constant in this industry. For Gamelab, a small company in New York, that
means finding new audiences that wouldn’t ordinarily play a game, creating a game for a context you
wouldn’t think of having games, finding new kinds of visual and audio aesthetics for games or having
new kinds of narrative or cultural content in their games. No matter how technology evolves and
shapes this industry, the secret of success has remained constant – create a game that is simple to
understand and easy to play on an elementary level, but is addictive and maddeningly difficult to fully
master.
Economics Research Associates Project No. 18014 Page 57
VII. Louisiana’s Digital Media Industry
The entertainment software industry is starting to take root in Louisiana in part due to the recent
enactment of the Digital Interactive Media Act. In this section ERA will first look at broad industry
trends occurring in the U.S. and Louisiana through employment data. ERA will then examine how
the tax incentives are being used. Finally, ERA will provide the economic impact estimates of the
spending associated with the certified tax credits.
Employment Trends
The previous section provided industry specific data as measured by the Entertainment Software
Association. This was custom research done in part since software game publishing is not identified
as a separate U.S. industry in the North American Industry Classification System (NAICS). Typically
broader industry groupings are used to identify this industry. Often entertainment software is
included within the boarder industry category of software publishing (NAICS 5112). According to the
official 2007 U.S. NAICS Manual, computer software publishing is comprised of “establishments
primarily engaged in computer software publishing or publishing and reproduction. Establishments in
this industry carry out operations necessary for producing and distributing computer software, such
as designing, providing documentation, assisting in installation and providing support services to
software publishers. These establishments may design, develop and publish, or publish only.”
Within software publishing is home entertainment computer software which is where video game
development would most likely fall. Other types of software classified in this NAICS code are:
Application computer software
Business oriented computer software
Educational computer software
Operating systems computer software
Prepackaged software
Publisher's computer software
Utility computer software
Word processing computer software
For purposes of this analysis, ERA also included Custom Computer Programming Services (NAICS
541511) as part of its definition of the digital media industry. This industry comprises establishments
primarily engaged in writing, modifying, testing and supporting software to meet the needs of a
particular customer. Combined ERA felt that the types of firms operating under these classifications
would be not only the types of companies targeted by the Digital Interactive Media Act, but would be
most likely to be part of the video game industry. As noted previously, digital media is a
technological process which has broad ramifications in the ways that content is created and
Economics Research Associates Project No. 18014 Page 58
delivered to end users. The video game industry is one subset of this much larger digital media
market. ERA is using these two sectors to capture this growing sector, not to represent the entire
digital media industry. In addition, it should be noted that employment in the animation components
of video game development may be included within the film industry definition we are using since
cartoon production for both motion pictures and television are part of the NAICS 512110, motion
picture and video production.
The digital media industry as represented by software publishers and custom computer
programming service providers has experienced some fluctuation in employment levels since 2001
but has been increasing steadily since 2004 reaching 847,000 employees nationally. Despite
fluctuations in employment levels, the average number of employees per firm has remained
relatively stable over time. At the national level, software publishing firms employ an average of 24
people and approximately 8 work at custom computer programming firms. Wages did grow in both
sectors over this time period indicating that sales levels may have continued to rise even as the
industry shed workers. Wages in the custom computer programming services sector grew at a
compound annual growth rate (CAGR) of 3.8 percent from 2001 through 2007.
Following these trends, the number of people working in Louisiana’s digital media industry has also
fluctuated throughout this time period and appears to be rebounding. In fact, growth in Louisiana is
far outpacing national growth rates. For example, in 2007, there were 4,381 people employed in
digital media firms throughout Louisiana. This represents an average annual growth rate of 9.0
percent since 2001 in the digital media industry compared to an average growth rate of 0.4% for the
country. These jobs are significant for the state economy as they paid an average wage of more
than $50,000 in 2007. In addition these jobs are more stable and not subject to seasonality as other
segments of the entertainment industry. Average firm size is significantly smaller in Louisiana with
approximately 6 employees per firm in these segments.
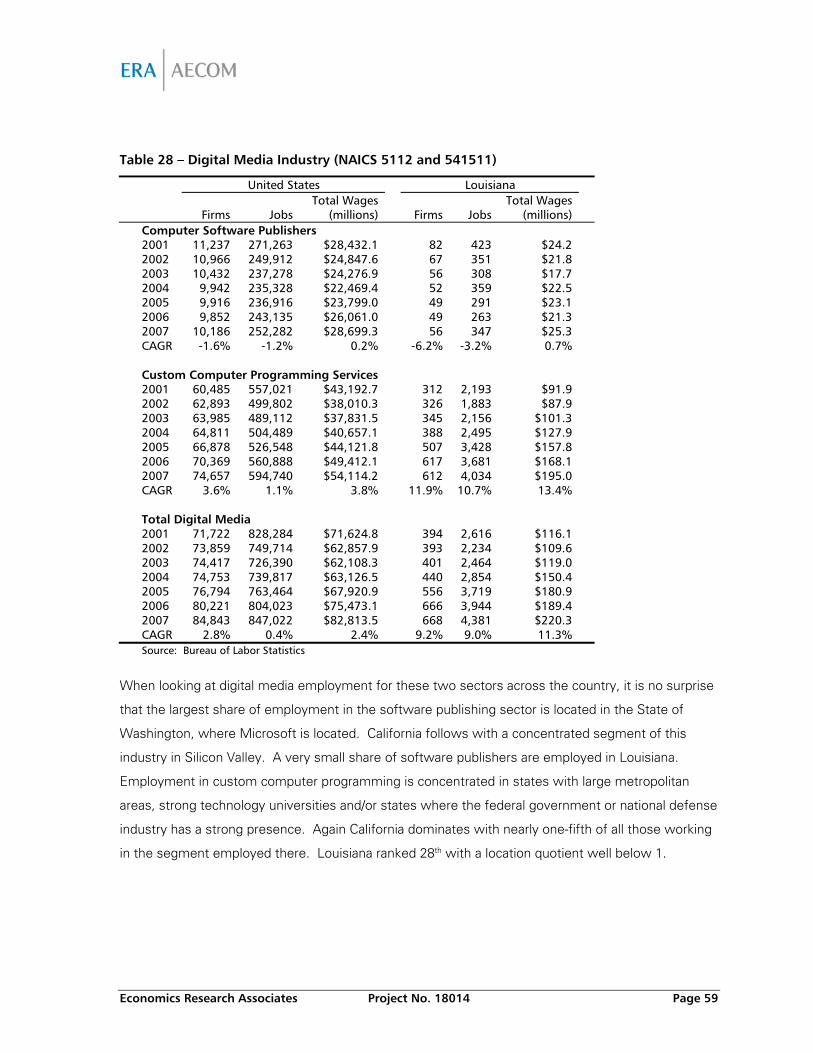
Economics Research Associates Project No. 18014 Page 59
Table 28 – Digital Media Industry (NAICS 5112 and 541511)
United States Louisiana
Firms Jobs Total Wages
(millions) Firms Jobs Total Wages
(millions) Computer Software Publishers 2001 11,237 271,263 $28,432.1 82 423 $24.2 2002 10,966 249,912 $24,847.6 67 351 $21.8 2003 10,432 237,278 $24,276.9 56 308 $17.7 2004 9,942 235,328 $22,469.4 52 359 $22.5 2005 9,916 236,916 $23,799.0 49 291 $23.1 2006 9,852 243,135 $26,061.0 49 263 $21.3 2007 10,186 252,282 $28,699.3 56 347 $25.3 CAGR -1.6% -1.2% 0.2% -6.2% -3.2% 0.7% Custom Computer Programming Services 2001 60,485 557,021 $43,192.7 312 2,193 $91.9 2002 62,893 499,802 $38,010.3 326 1,883 $87.9 2003 63,985 489,112 $37,831.5 345 2,156 $101.3 2004 64,811 504,489 $40,657.1 388 2,495 $127.9 2005 66,878 526,548 $44,121.8 507 3,428 $157.8 2006 70,369 560,888 $49,412.1 617 3,681 $168.1 2007 74,657 594,740 $54,114.2 612 4,034 $195.0 CAGR 3.6% 1.1% 3.8% 11.9% 10.7% 13.4% Total Digital Media 2001 71,722 828,284 $71,624.8 394 2,616 $116.1 2002 73,859 749,714 $62,857.9 393 2,234 $109.6 2003 74,417 726,390 $62,108.3 401 2,464 $119.0 2004 74,753 739,817 $63,126.5 440 2,854 $150.4 2005 76,794 763,464 $67,920.9 556 3,719 $180.9 2006 80,221 804,023 $75,473.1 666 3,944 $189.4 2007 84,843 847,022 $82,813.5 668 4,381 $220.3 CAGR 2.8% 0.4% 2.4% 9.2% 9.0% 11.3%
Source: Bureau of Labor Statistics
When looking at digital media employment for these two sectors across the country, it is no surprise
that the largest share of employment in the software publishing sector is located in the State of
Washington, where Microsoft is located. California follows with a concentrated segment of this
industry in Silicon Valley. A very small share of software publishers are employed in Louisiana.
Employment in custom computer programming is concentrated in states with large metropolitan
areas, strong technology universities and/or states where the federal government or national defense
industry has a strong presence. Again California dominates with nearly one-fifth of all those working
in the segment employed there. Louisiana ranked 28th with a location quotient well below 1.
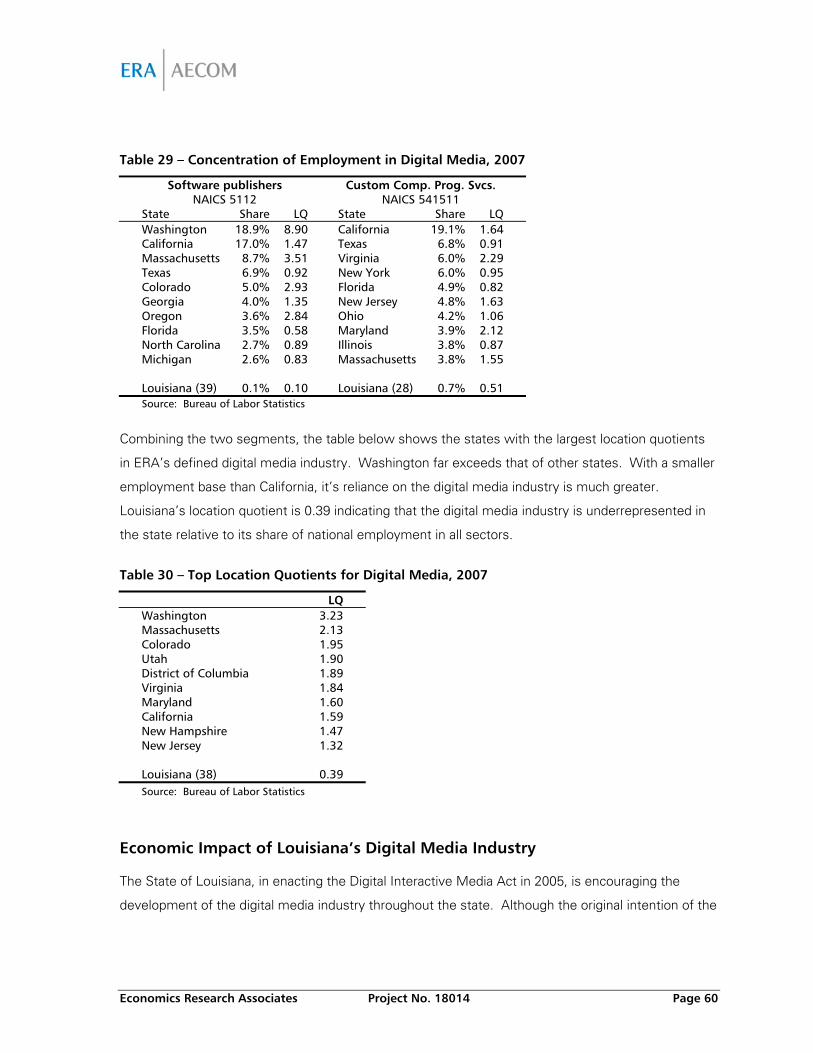
Economics Research Associates Project No. 18014 Page 60
Table 29 – Concentration of Employment in Digital Media, 2007
Software publishers
NAICS 5112 Custom Comp. Prog. Svcs.
NAICS 541511 State Share LQ State Share LQ Washington 18.9% 8.90 California 19.1% 1.64 California 17.0% 1.47 Texas 6.8% 0.91 Massachusetts 8.7% 3.51 Virginia 6.0% 2.29 Texas 6.9% 0.92 New York 6.0% 0.95 Colorado 5.0% 2.93 Florida 4.9% 0.82 Georgia 4.0% 1.35 New Jersey 4.8% 1.63 Oregon 3.6% 2.84 Ohio 4.2% 1.06 Florida 3.5% 0.58 Maryland 3.9% 2.12 North Carolina 2.7% 0.89 Illinois 3.8% 0.87 Michigan 2.6% 0.83 Massachusetts 3.8% 1.55 Louisiana (39) 0.1% 0.10 Louisiana (28) 0.7% 0.51
Source: Bureau of Labor Statistics
Combining the two segments, the table below shows the states with the largest location quotients
in ERA’s defined digital media industry. Washington far exceeds that of other states. With a smaller
employment base than California, it’s reliance on the digital media industry is much greater.
Louisiana’s location quotient is 0.39 indicating that the digital media industry is underrepresented in
the state relative to its share of national employment in all sectors.
Table 30 – Top Location Quotients for Digital Media, 2007
LQ Washington 3.23 Massachusetts 2.13 Colorado 1.95 Utah 1.90 District of Columbia 1.89 Virginia 1.84 Maryland 1.60 California 1.59 New Hampshire 1.47 New Jersey 1.32 Louisiana (38) 0.39 Source: Bureau of Labor Statistics
Economic Impact of Louisiana’s Digital Media Industry
The State of Louisiana, in enacting the Digital Interactive Media Act in 2005, is encouraging the
development of the digital media industry throughout the state. Although the original intention of the
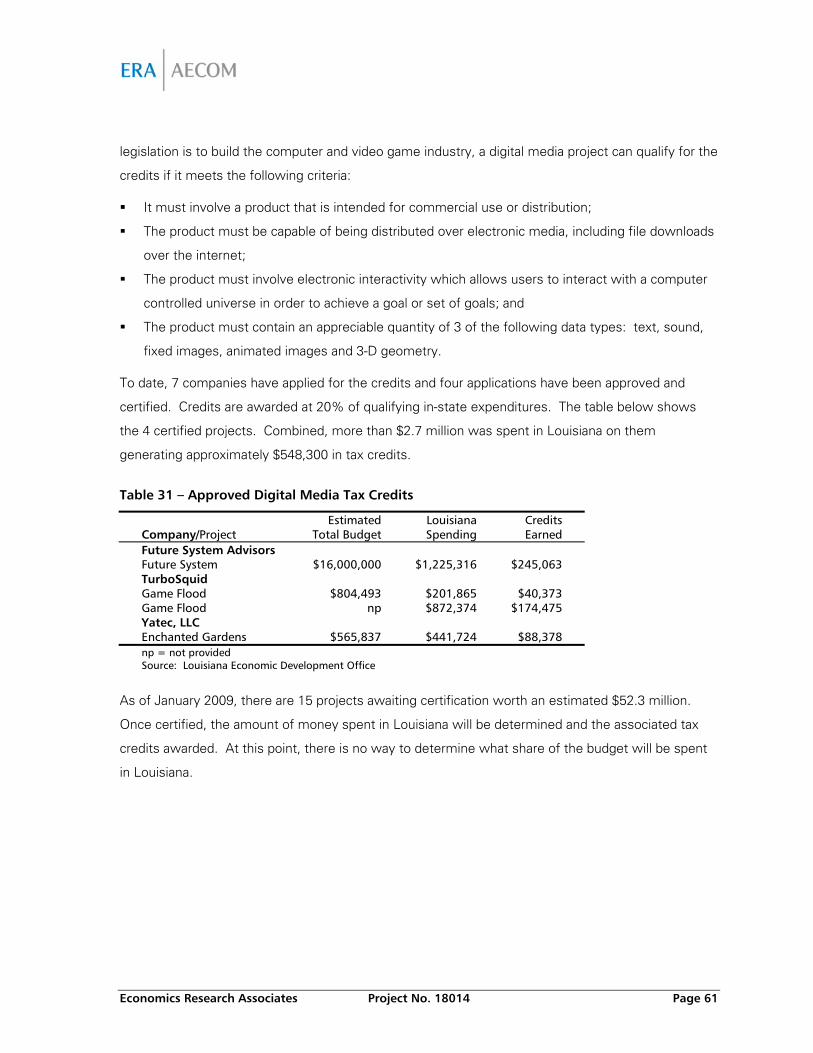
Economics Research Associates Project No. 18014 Page 61
legislation is to build the computer and video game industry, a digital media project can qualify for the
credits if it meets the following criteria:
It must involve a product that is intended for commercial use or distribution;
The product must be capable of being distributed over electronic media, including file downloads
over the internet;
The product must involve electronic interactivity which allows users to interact with a computer
controlled universe in order to achieve a goal or set of goals; and
The product must contain an appreciable quantity of 3 of the following data types: text, sound,
fixed images, animated images and 3-D geometry.
To date, 7 companies have applied for the credits and four applications have been approved and
certified. Credits are awarded at 20% of qualifying in-state expenditures. The table below shows
the 4 certified projects. Combined, more than $2.7 million was spent in Louisiana on them
generating approximately $548,300 in tax credits.
Table 31 – Approved Digital Media Tax Credits
Company/Project Estimated
Total Budget Louisiana Spending
Credits Earned
Future System Advisors Future System $16,000,000 $1,225,316 $245,063 TurboSquid Game Flood $804,493 $201,865 $40,373 Game Flood np $872,374 $174,475 Yatec, LLC Enchanted Gardens $565,837 $441,724 $88,378
np = not provided Source: Louisiana Economic Development Office
As of January 2009, there are 15 projects awaiting certification worth an estimated $52.3 million.
Once certified, the amount of money spent in Louisiana will be determined and the associated tax
credits awarded. At this point, there is no way to determine what share of the budget will be spent
in Louisiana.
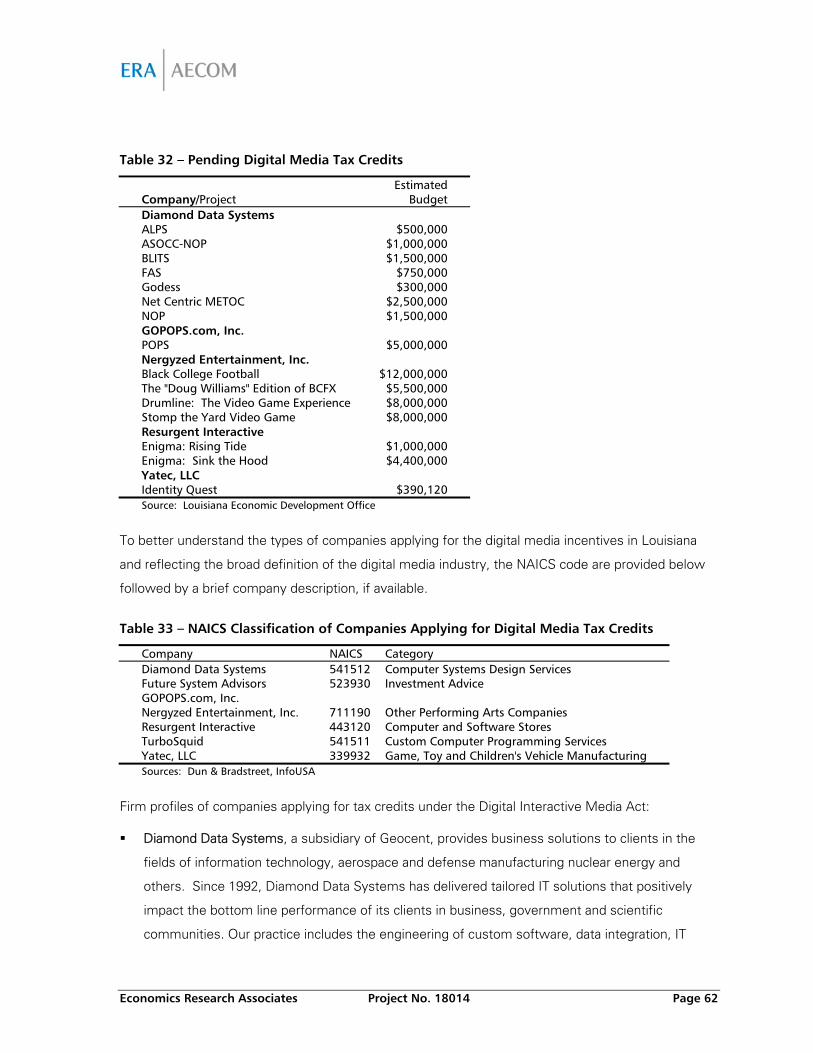
Economics Research Associates Project No. 18014 Page 62
Table 32 – Pending Digital Media Tax Credits
Company/Project Estimated
Budget Diamond Data Systems ALPS $500,000 ASOCC-NOP $1,000,000 BLITS $1,500,000 FAS $750,000 Godess $300,000 Net Centric METOC $2,500,000 NOP $1,500,000 GOPOPS.com, Inc. POPS $5,000,000 Nergyzed Entertainment, Inc. Black College Football $12,000,000 The "Doug Williams" Edition of BCFX $5,500,000 Drumline: The Video Game Experience $8,000,000 Stomp the Yard Video Game $8,000,000 Resurgent Interactive Enigma: Rising Tide $1,000,000 Enigma: Sink the Hood $4,400,000 Yatec, LLC Identity Quest $390,120
Source: Louisiana Economic Development Office
To better understand the types of companies applying for the digital media incentives in Louisiana
and reflecting the broad definition of the digital media industry, the NAICS code are provided below
followed by a brief company description, if available.
Table 33 – NAICS Classification of Companies Applying for Digital Media Tax Credits
Company NAICS Category Diamond Data Systems 541512 Computer Systems Design Services Future System Advisors 523930 Investment Advice GOPOPS.com, Inc. Nergyzed Entertainment, Inc. 711190 Other Performing Arts Companies Resurgent Interactive 443120 Computer and Software Stores TurboSquid 541511 Custom Computer Programming Services Yatec, LLC 339932 Game, Toy and Children's Vehicle Manufacturing Sources: Dun & Bradstreet, InfoUSA
Firm profiles of companies applying for tax credits under the Digital Interactive Media Act:
Diamond Data Systems, a subsidiary of Geocent, provides business solutions to clients in the
fields of information technology, aerospace and defense manufacturing nuclear energy and
others. Since 1992, Diamond Data Systems has delivered tailored IT solutions that positively
impact the bottom line performance of its clients in business, government and scientific
communities. Our practice includes the engineering of custom software, data integration, IT
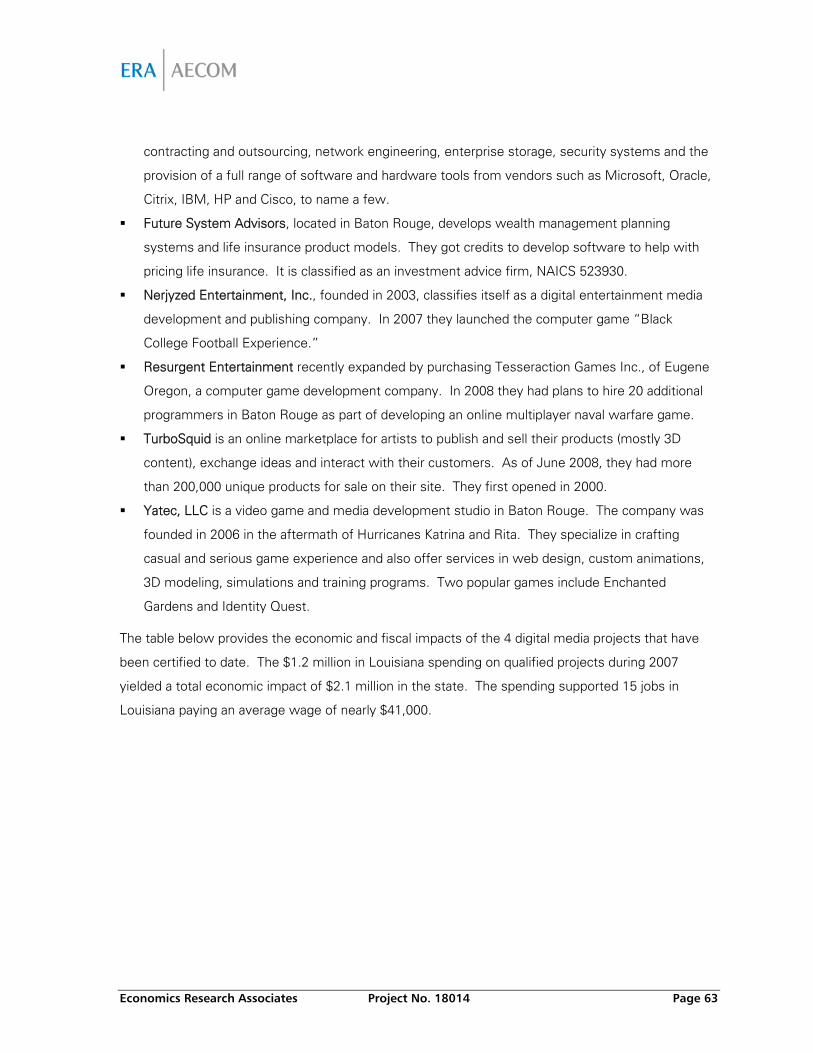
Economics Research Associates Project No. 18014 Page 63
contracting and outsourcing, network engineering, enterprise storage, security systems and the
provision of a full range of software and hardware tools from vendors such as Microsoft, Oracle,
Citrix, IBM, HP and Cisco, to name a few.
Future System Advisors, located in Baton Rouge, develops wealth management planning
systems and life insurance product models. They got credits to develop software to help with
pricing life insurance. It is classified as an investment advice firm, NAICS 523930.
Nerjyzed Entertainment, Inc., founded in 2003, classifies itself as a digital entertainment media
development and publishing company. In 2007 they launched the computer game “Black
College Football Experience.”
Resurgent Entertainment recently expanded by purchasing Tesseraction Games Inc., of Eugene
Oregon, a computer game development company. In 2008 they had plans to hire 20 additional
programmers in Baton Rouge as part of developing an online multiplayer naval warfare game.
TurboSquid is an online marketplace for artists to publish and sell their products (mostly 3D
content), exchange ideas and interact with their customers. As of June 2008, they had more
than 200,000 unique products for sale on their site. They first opened in 2000.
Yatec, LLC is a video game and media development studio in Baton Rouge. The company was
founded in 2006 in the aftermath of Hurricanes Katrina and Rita. They specialize in crafting
casual and serious game experience and also offer services in web design, custom animations,
3D modeling, simulations and training programs. Two popular games include Enchanted
Gardens and Identity Quest.
The table below provides the economic and fiscal impacts of the 4 digital media projects that have
been certified to date. The $1.2 million in Louisiana spending on qualified projects during 2007
yielded a total economic impact of $2.1 million in the state. The spending supported 15 jobs in
Louisiana paying an average wage of nearly $41,000.
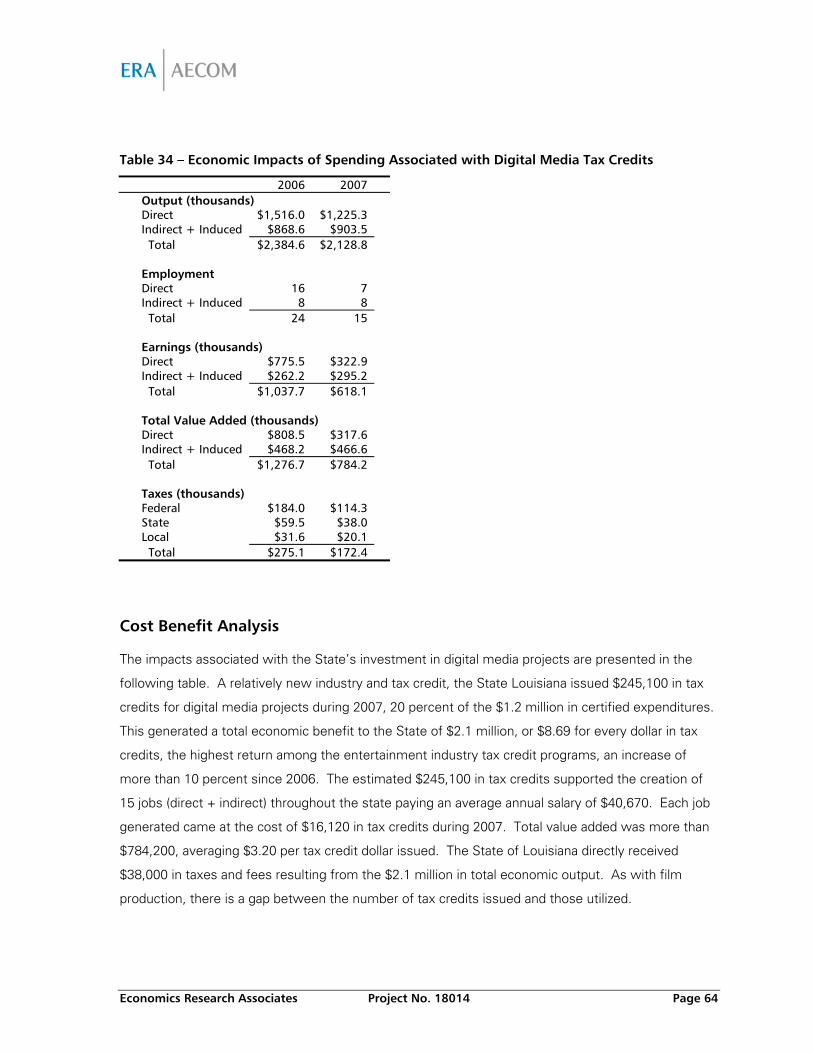
Economics Research Associates Project No. 18014 Page 64
Table 34 – Economic Impacts of Spending Associated with Digital Media Tax Credits
2006 2007 Output (thousands) Direct $1,516.0 $1,225.3 Indirect + Induced $868.6 $903.5 Total $2,384.6 $2,128.8 Employment Direct 16 7 Indirect + Induced 8 8 Total 24 15 Earnings (thousands) Direct $775.5 $322.9 Indirect + Induced $262.2 $295.2 Total $1,037.7 $618.1 Total Value Added (thousands) Direct $808.5 $317.6 Indirect + Induced $468.2 $466.6 Total $1,276.7 $784.2 Taxes (thousands) Federal $184.0 $114.3 State $59.5 $38.0 Local $31.6 $20.1 Total $275.1 $172.4
Cost Benefit Analysis
The impacts associated with the State’s investment in digital media projects are presented in the
following table. A relatively new industry and tax credit, the State Louisiana issued $245,100 in tax
credits for digital media projects during 2007, 20 percent of the $1.2 million in certified expenditures.
This generated a total economic benefit to the State of $2.1 million, or $8.69 for every dollar in tax
credits, the highest return among the entertainment industry tax credit programs, an increase of
more than 10 percent since 2006. The estimated $245,100 in tax credits supported the creation of
15 jobs (direct + indirect) throughout the state paying an average annual salary of $40,670. Each job
generated came at the cost of $16,120 in tax credits during 2007. Total value added was more than
$784,200, averaging $3.20 per tax credit dollar issued. The State of Louisiana directly received
$38,000 in taxes and fees resulting from the $2.1 million in total economic output. As with film
production, there is a gap between the number of tax credits issued and those utilized.
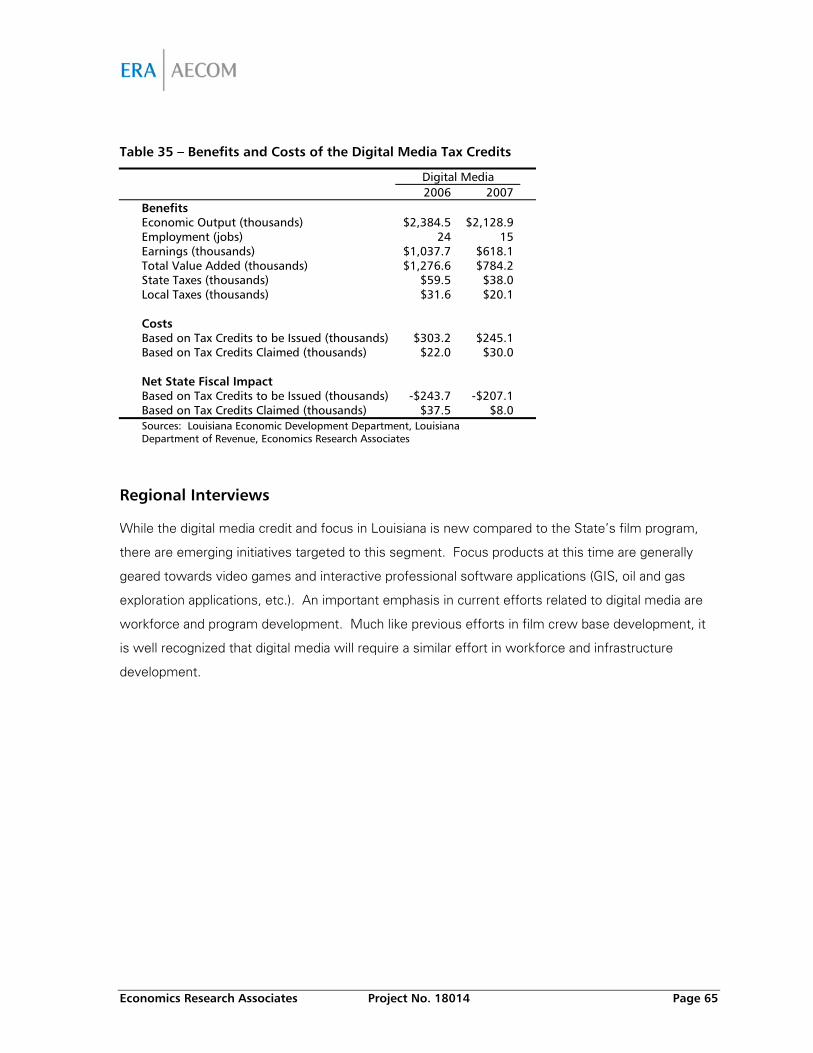
Economics Research Associates Project No. 18014 Page 65
Table 35 – Benefits and Costs of the Digital Media Tax Credits
Digital Media 2006 2007 Benefits Economic Output (thousands) $2,384.5 $2,128.9 Employment (jobs) 24 15 Earnings (thousands) $1,037.7 $618.1 Total Value Added (thousands) $1,276.6 $784.2 State Taxes (thousands) $59.5 $38.0 Local Taxes (thousands) $31.6 $20.1 Costs Based on Tax Credits to be Issued (thousands) $303.2 $245.1 Based on Tax Credits Claimed (thousands) $22.0 $30.0 Net State Fiscal Impact Based on Tax Credits to be Issued (thousands) -$243.7 -$207.1 Based on Tax Credits Claimed (thousands) $37.5 $8.0 Sources: Louisiana Economic Development Department, Louisiana
Department of Revenue, Economics Research Associates
Regional Interviews
While the digital media credit and focus in Louisiana is new compared to the State’s film program,
there are emerging initiatives targeted to this segment. Focus products at this time are generally
geared towards video games and interactive professional software applications (GIS, oil and gas
exploration applications, etc.). An important emphasis in current efforts related to digital media are
workforce and program development. Much like previous efforts in film crew base development, it
is well recognized that digital media will require a similar effort in workforce and infrastructure
development.
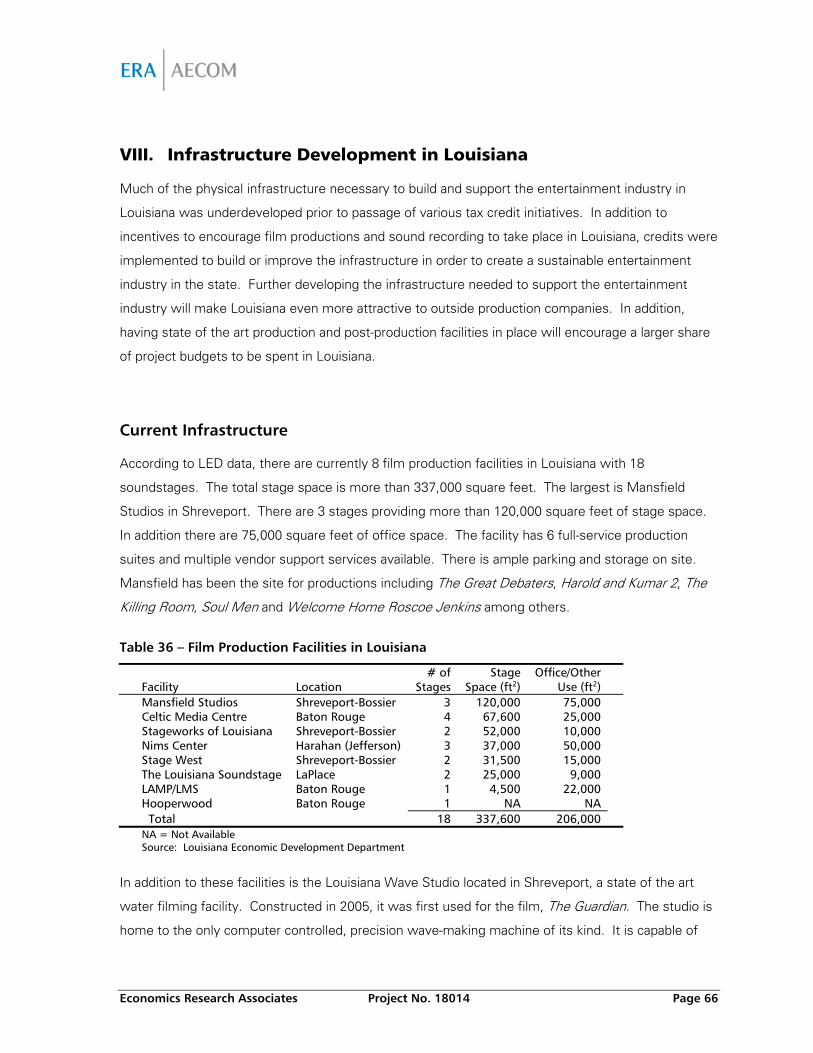
Economics Research Associates Project No. 18014 Page 66
VIII. Infrastructure Development in Louisiana
Much of the physical infrastructure necessary to build and support the entertainment industry in
Louisiana was underdeveloped prior to passage of various tax credit initiatives. In addition to
incentives to encourage film productions and sound recording to take place in Louisiana, credits were
implemented to build or improve the infrastructure in order to create a sustainable entertainment
industry in the state. Further developing the infrastructure needed to support the entertainment
industry will make Louisiana even more attractive to outside production companies. In addition,
having state of the art production and post-production facilities in place will encourage a larger share
of project budgets to be spent in Louisiana.
Current Infrastructure
According to LED data, there are currently 8 film production facilities in Louisiana with 18
soundstages. The total stage space is more than 337,000 square feet. The largest is Mansfield
Studios in Shreveport. There are 3 stages providing more than 120,000 square feet of stage space.
In addition there are 75,000 square feet of office space. The facility has 6 full-service production
suites and multiple vendor support services available. There is ample parking and storage on site.
Mansfield has been the site for productions including The Great Debaters, Harold and Kumar 2, The
Killing Room, Soul Men and Welcome Home Roscoe Jenkins among others.
Table 36 – Film Production Facilities in Louisiana
Facility Location # of
Stages Stage
Space (ft2) Office/Other
Use (ft2) Mansfield Studios Shreveport-Bossier 3 120,000 75,000 Celtic Media Centre Baton Rouge 4 67,600 25,000 Stageworks of Louisiana Shreveport-Bossier 2 52,000 10,000 Nims Center Harahan (Jefferson) 3 37,000 50,000 Stage West Shreveport-Bossier 2 31,500 15,000 The Louisiana Soundstage LaPlace 2 25,000 9,000 LAMP/LMS Baton Rouge 1 4,500 22,000 Hooperwood Baton Rouge 1 NA NA Total 18 337,600 206,000
NA = Not Available Source: Louisiana Economic Development Department
In addition to these facilities is the Louisiana Wave Studio located in Shreveport, a state of the art
water filming facility. Constructed in 2005, it was first used for the film, The Guardian. The studio is
home to the only computer controlled, precision wave-making machine of its kind. It is capable of
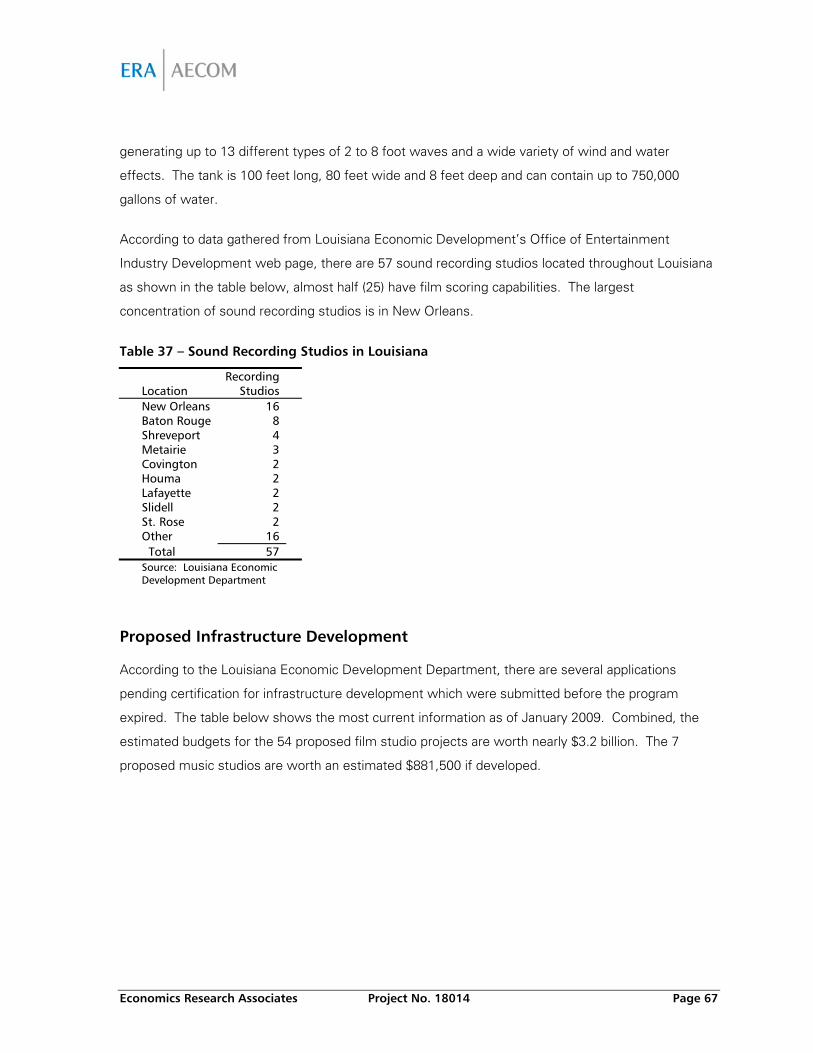
Economics Research Associates Project No. 18014 Page 67
generating up to 13 different types of 2 to 8 foot waves and a wide variety of wind and water
effects. The tank is 100 feet long, 80 feet wide and 8 feet deep and can contain up to 750,000
gallons of water.
According to data gathered from Louisiana Economic Development’s Office of Entertainment
Industry Development web page, there are 57 sound recording studios located throughout Louisiana
as shown in the table below, almost half (25) have film scoring capabilities. The largest
concentration of sound recording studios is in New Orleans.
Table 37 – Sound Recording Studios in Louisiana
Location Recording
Studios New Orleans 16 Baton Rouge 8 Shreveport 4 Metairie 3 Covington 2 Houma 2 Lafayette 2 Slidell 2 St. Rose 2 Other 16 Total 57
Source: Louisiana Economic Development Department
Proposed Infrastructure Development
According to the Louisiana Economic Development Department, there are several applications
pending certification for infrastructure development which were submitted before the program
expired. The table below shows the most current information as of January 2009. Combined, the
estimated budgets for the 54 proposed film studio projects are worth nearly $3.2 billion. The 7
proposed music studios are worth an estimated $881,500 if developed.
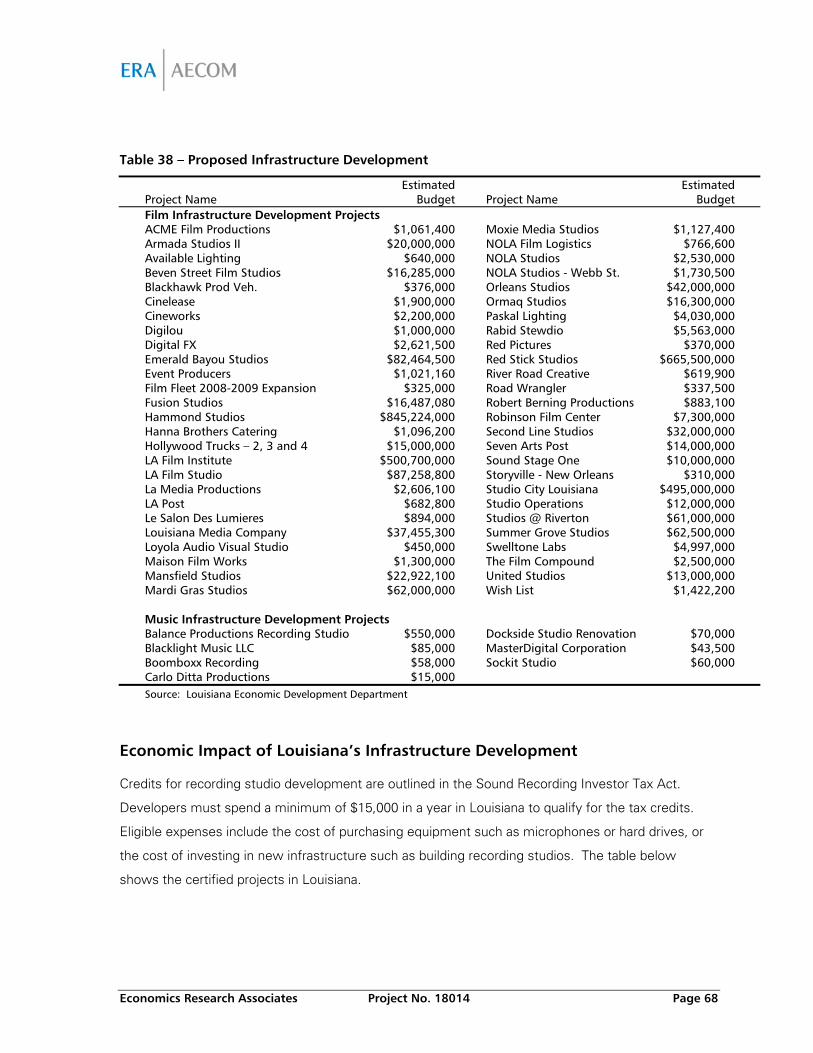
Economics Research Associates Project No. 18014 Page 68
Table 38 – Proposed Infrastructure Development
Project Name
Estimated Budget
Project Name
Estimated Budget
Film Infrastructure Development Projects ACME Film Productions $1,061,400 Moxie Media Studios $1,127,400 Armada Studios II $20,000,000 NOLA Film Logistics $766,600 Available Lighting $640,000 NOLA Studios $2,530,000 Beven Street Film Studios $16,285,000 NOLA Studios - Webb St. $1,730,500 Blackhawk Prod Veh. $376,000 Orleans Studios $42,000,000 Cinelease $1,900,000 Ormaq Studios $16,300,000 Cineworks $2,200,000 Paskal Lighting $4,030,000 Digilou $1,000,000 Rabid Stewdio $5,563,000 Digital FX $2,621,500 Red Pictures $370,000 Emerald Bayou Studios $82,464,500 Red Stick Studios $665,500,000 Event Producers $1,021,160 River Road Creative $619,900 Film Fleet 2008-2009 Expansion $325,000 Road Wrangler $337,500 Fusion Studios $16,487,080 Robert Berning Productions $883,100 Hammond Studios $845,224,000 Robinson Film Center $7,300,000 Hanna Brothers Catering $1,096,200 Second Line Studios $32,000,000 Hollywood Trucks – 2, 3 and 4 $15,000,000 Seven Arts Post $14,000,000 LA Film Institute $500,700,000 Sound Stage One $10,000,000 LA Film Studio $87,258,800 Storyville - New Orleans $310,000 La Media Productions $2,606,100 Studio City Louisiana $495,000,000 LA Post $682,800 Studio Operations $12,000,000 Le Salon Des Lumieres $894,000 Studios @ Riverton $61,000,000 Louisiana Media Company $37,455,300 Summer Grove Studios $62,500,000 Loyola Audio Visual Studio $450,000 Swelltone Labs $4,997,000 Maison Film Works $1,300,000 The Film Compound $2,500,000 Mansfield Studios $22,922,100 United Studios $13,000,000 Mardi Gras Studios $62,000,000 Wish List $1,422,200 Music Infrastructure Development Projects Balance Productions Recording Studio $550,000 Dockside Studio Renovation $70,000 Blacklight Music LLC $85,000 MasterDigital Corporation $43,500 Boomboxx Recording $58,000 Sockit Studio $60,000 Carlo Ditta Productions $15,000 Source: Louisiana Economic Development Department
Economic Impact of Louisiana’s Infrastructure Development
Credits for recording studio development are outlined in the Sound Recording Investor Tax Act.
Developers must spend a minimum of $15,000 in a year in Louisiana to qualify for the tax credits.
Eligible expenses include the cost of purchasing equipment such as microphones or hard drives, or
the cost of investing in new infrastructure such as building recording studios. The table below
shows the certified projects in Louisiana.
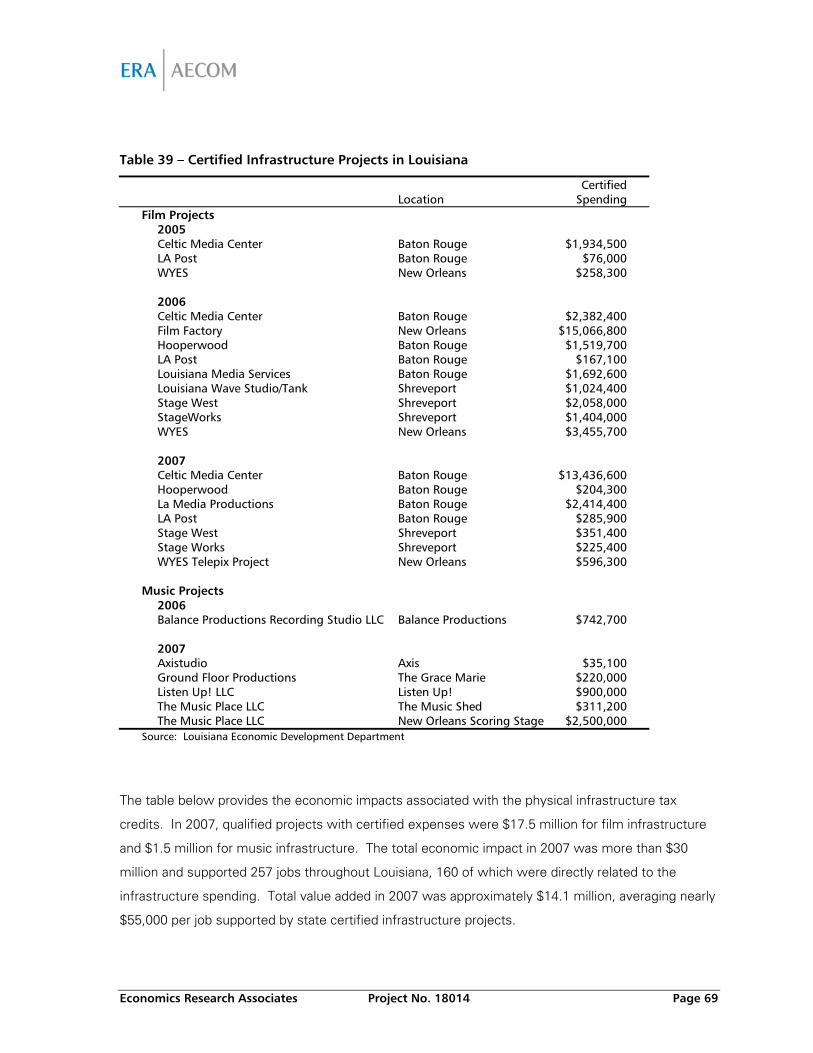
Economics Research Associates Project No. 18014 Page 69
Table 39 – Certified Infrastructure Projects in Louisiana
Location Certified
Spending Film Projects 2005 Celtic Media Center Baton Rouge $1,934,500 LA Post Baton Rouge $76,000 WYES New Orleans $258,300 2006 Celtic Media Center Baton Rouge $2,382,400 Film Factory New Orleans $15,066,800 Hooperwood Baton Rouge $1,519,700 LA Post Baton Rouge $167,100 Louisiana Media Services Baton Rouge $1,692,600 Louisiana Wave Studio/Tank Shreveport $1,024,400 Stage West Shreveport $2,058,000 StageWorks Shreveport $1,404,000 WYES New Orleans $3,455,700 2007 Celtic Media Center Baton Rouge $13,436,600 Hooperwood Baton Rouge $204,300 La Media Productions Baton Rouge $2,414,400 LA Post Baton Rouge $285,900 Stage West Shreveport $351,400 Stage Works Shreveport $225,400 WYES Telepix Project New Orleans $596,300 Music Projects 2006 Balance Productions Recording Studio LLC Balance Productions $742,700 2007 Axistudio Axis $35,100 Ground Floor Productions The Grace Marie $220,000 Listen Up! LLC Listen Up! $900,000 The Music Place LLC The Music Shed $311,200 The Music Place LLC New Orleans Scoring Stage $2,500,000 Source: Louisiana Economic Development Department
The table below provides the economic impacts associated with the physical infrastructure tax
credits. In 2007, qualified projects with certified expenses were $17.5 million for film infrastructure
and $1.5 million for music infrastructure. The total economic impact in 2007 was more than $30
million and supported 257 jobs throughout Louisiana, 160 of which were directly related to the
infrastructure spending. Total value added in 2007 was approximately $14.1 million, averaging nearly
$55,000 per job supported by state certified infrastructure projects.
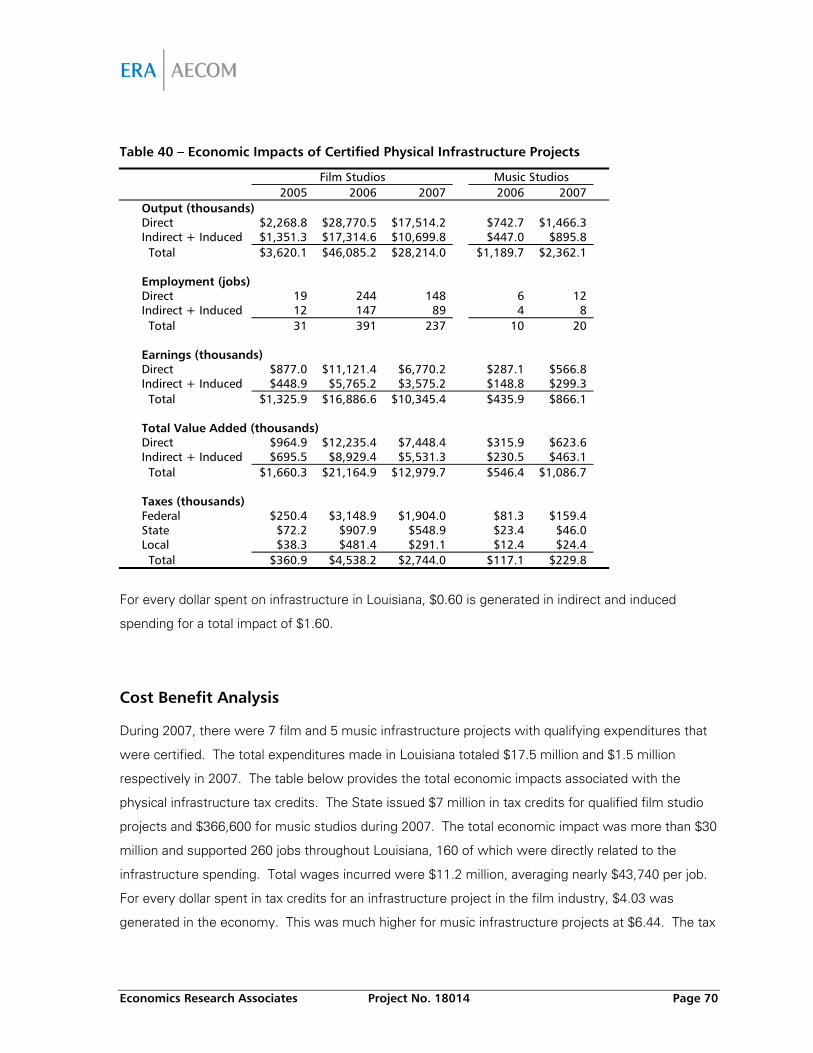
Economics Research Associates Project No. 18014 Page 70
Table 40 – Economic Impacts of Certified Physical Infrastructure Projects
Film Studios Music Studios 2005 2006 2007 2006 2007 Output (thousands) Direct $2,268.8 $28,770.5 $17,514.2 $742.7 $1,466.3 Indirect + Induced $1,351.3 $17,314.6 $10,699.8 $447.0 $895.8 Total $3,620.1 $46,085.2 $28,214.0 $1,189.7 $2,362.1 Employment (jobs) Direct 19 244 148 6 12 Indirect + Induced 12 147 89 4 8 Total 31 391 237 10 20 Earnings (thousands) Direct $877.0 $11,121.4 $6,770.2 $287.1 $566.8 Indirect + Induced $448.9 $5,765.2 $3,575.2 $148.8 $299.3 Total $1,325.9 $16,886.6 $10,345.4 $435.9 $866.1 Total Value Added (thousands) Direct $964.9 $12,235.4 $7,448.4 $315.9 $623.6 Indirect + Induced $695.5 $8,929.4 $5,531.3 $230.5 $463.1 Total $1,660.3 $21,164.9 $12,979.7 $546.4 $1,086.7 Taxes (thousands) Federal $250.4 $3,148.9 $1,904.0 $81.3 $159.4 State $72.2 $907.9 $548.9 $23.4 $46.0 Local $38.3 $481.4 $291.1 $12.4 $24.4 Total $360.9 $4,538.2 $2,744.0 $117.1 $229.8
For every dollar spent on infrastructure in Louisiana, $0.60 is generated in indirect and induced
spending for a total impact of $1.60.
Cost Benefit Analysis
During 2007, there were 7 film and 5 music infrastructure projects with qualifying expenditures that
were certified. The total expenditures made in Louisiana totaled $17.5 million and $1.5 million
respectively in 2007. The table below provides the total economic impacts associated with the
physical infrastructure tax credits. The State issued $7 million in tax credits for qualified film studio
projects and $366,600 for music studios during 2007. The total economic impact was more than $30
million and supported 260 jobs throughout Louisiana, 160 of which were directly related to the
infrastructure spending. Total wages incurred were $11.2 million, averaging nearly $43,740 per job.
For every dollar spent in tax credits for an infrastructure project in the film industry, $4.03 was
generated in the economy. This was much higher for music infrastructure projects at $6.44. The tax
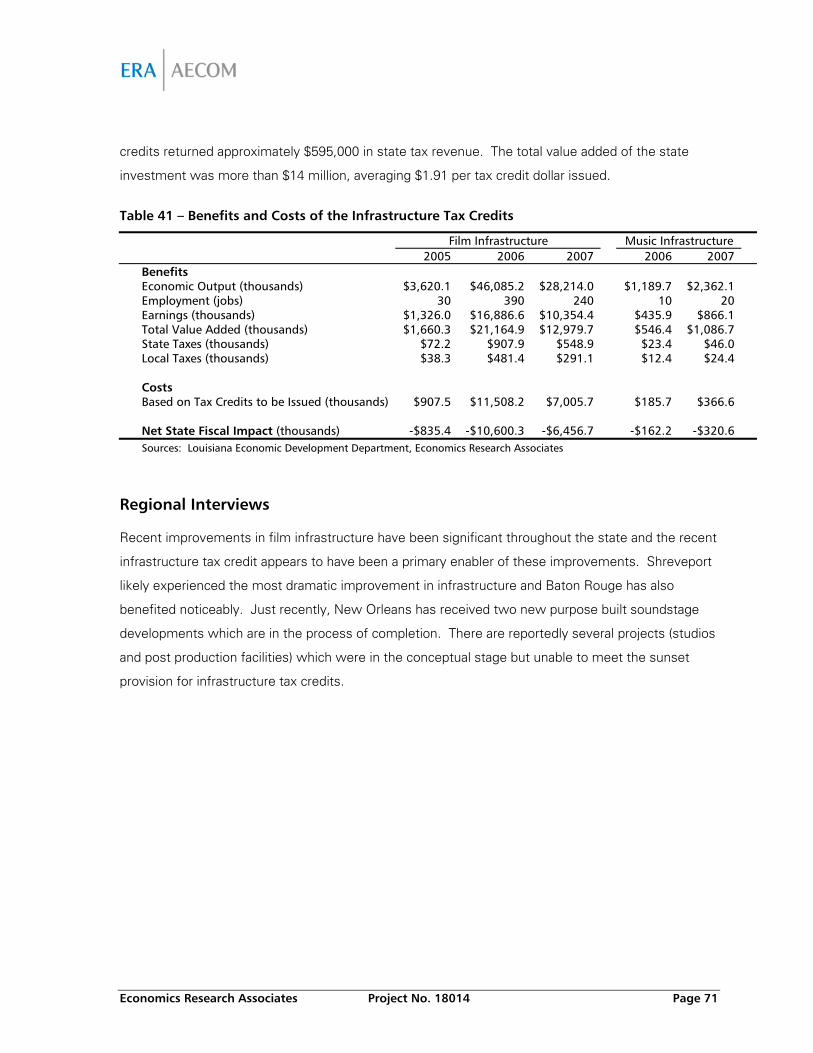
Economics Research Associates Project No. 18014 Page 71
credits returned approximately $595,000 in state tax revenue. The total value added of the state
investment was more than $14 million, averaging $1.91 per tax credit dollar issued.
Table 41 – Benefits and Costs of the Infrastructure Tax Credits
Film Infrastructure Music Infrastructure 2005 2006 2007 2006 2007 Benefits Economic Output (thousands) $3,620.1 $46,085.2 $28,214.0 $1,189.7 $2,362.1 Employment (jobs) 30 390 240 10 20 Earnings (thousands) $1,326.0 $16,886.6 $10,354.4 $435.9 $866.1 Total Value Added (thousands) $1,660.3 $21,164.9 $12,979.7 $546.4 $1,086.7 State Taxes (thousands) $72.2 $907.9 $548.9 $23.4 $46.0 Local Taxes (thousands) $38.3 $481.4 $291.1 $12.4 $24.4 Costs Based on Tax Credits to be Issued (thousands) $907.5 $11,508.2 $7,005.7 $185.7 $366.6 Net State Fiscal Impact (thousands) -$835.4 -$10,600.3 -$6,456.7 -$162.2 -$320.6 Sources: Louisiana Economic Development Department, Economics Research Associates
Regional Interviews
Recent improvements in film infrastructure have been significant throughout the state and the recent
infrastructure tax credit appears to have been a primary enabler of these improvements. Shreveport
likely experienced the most dramatic improvement in infrastructure and Baton Rouge has also
benefited noticeably. Just recently, New Orleans has received two new purpose built soundstage
developments which are in the process of completion. There are reportedly several projects (studios
and post production facilities) which were in the conceptual stage but unable to meet the sunset
provision for infrastructure tax credits.
Economics Research Associates Project No. 18014 Page 72
IX. Entertainment Industry Incentive Programs
In this section, ERA reviews film tax credit incentives currently available in other states. Such
production tax credits are frequently used by state or local governments as a temporary measure
that jumpstarts specific businesses or industries, with the rationale being that once the industry has
developed, it will generate tax revenues that match or exceed those of the tax credits provided.
Types of Incentives for Film Production
Direct Production Incentives
Direct production incentives in other states – both new and revised – are making for an increasingly
competitive landscape. The table that follows lists the seven most common types of direct
production incentives and provides a brief description of each. In general, the most common types
of incentives packages apply either tax credits or rebates to local qualifying expenditures. There is an
important difference. A rebate is money back from the state, whereas a tax credit is a reduction in
the filmmaker’s overall tax liability.
The difference between a refundable tax credit and a transferable tax credit is a crucial one, but it is
often overlooked. Refundable tax credits are far more lucrative to filmmakers. When productions
have tax liability, a refundable tax credit entitles them to a check from the state for their out-of-
pocket liability. In the instance of a transferable credit, however, the production company must sell
its remaining tax credits to other taxpayers (often wealthy individuals or companies).
This is often less desirable to filmmakers for a few reasons. First, buyers of these transferable tax
credits do not pay the full value of the tax credits – they buy them at a discount. Second, the
process involves accountants, lawyers and other middlemen, who also must be paid for their time.
Third, the process can be an administrative burden and often takes many months for the production
to claim the proceeds of their remaining tax credits. Every step in this process chips away some
value from the incentive. This contrasts with a refundable tax credit, whereby productions often get
a check for their full liability within 30 days of ending their production.
The issue with the grants is that, unlike a tax credit, they provide a limited sum of money available on
an annual basis. Therefore, productions starting later in the fiscal year may be out of luck if funding
has been depleted.
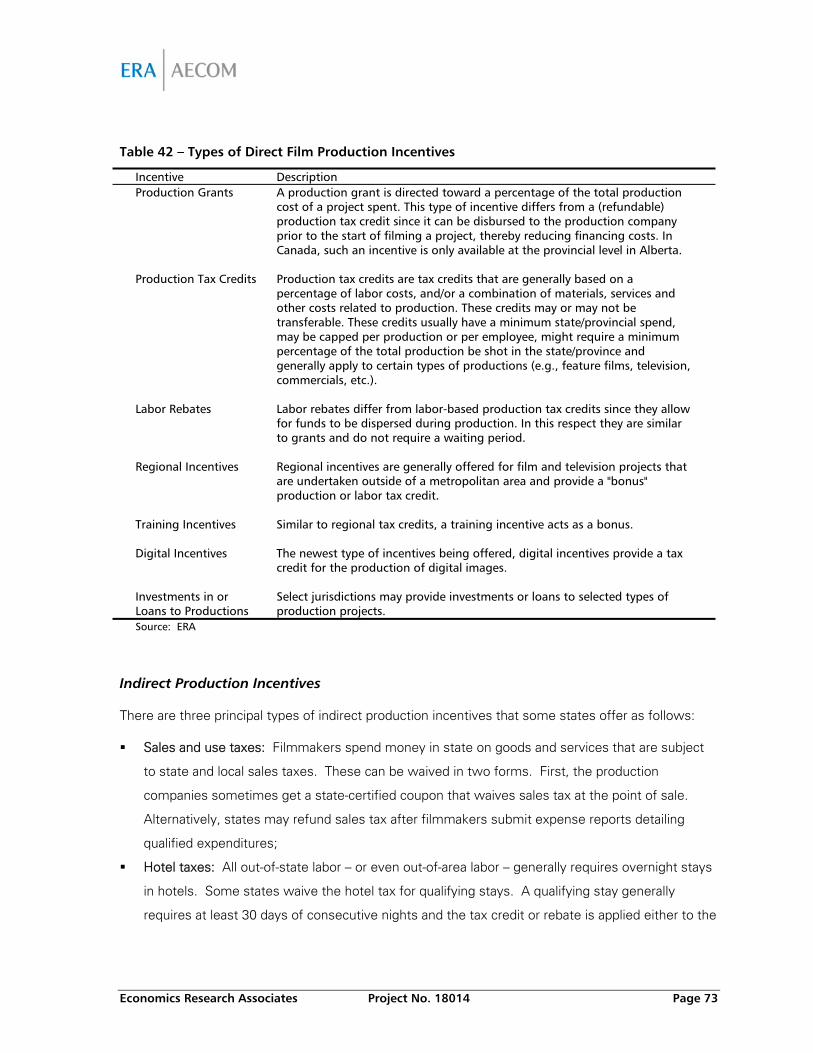
Economics Research Associates Project No. 18014 Page 73
Table 42 – Types of Direct Film Production Incentives
Incentive Description Production Grants A production grant is directed toward a percentage of the total production
cost of a project spent. This type of incentive differs from a (refundable) production tax credit since it can be disbursed to the production company prior to the start of filming a project, thereby reducing financing costs. In Canada, such an incentive is only available at the provincial level in Alberta.
Production Tax Credits Production tax credits are tax credits that are generally based on a
percentage of labor costs, and/or a combination of materials, services and other costs related to production. These credits may or may not be transferable. These credits usually have a minimum state/provincial spend, may be capped per production or per employee, might require a minimum percentage of the total production be shot in the state/province and generally apply to certain types of productions (e.g., feature films, television, commercials, etc.).
Labor Rebates Labor rebates differ from labor-based production tax credits since they allow
for funds to be dispersed during production. In this respect they are similar to grants and do not require a waiting period.
Regional Incentives Regional incentives are generally offered for film and television projects that
are undertaken outside of a metropolitan area and provide a "bonus" production or labor tax credit.
Training Incentives Similar to regional tax credits, a training incentive acts as a bonus. Digital Incentives The newest type of incentives being offered, digital incentives provide a tax
credit for the production of digital images.
Investments in or
Loans to Productions Select jurisdictions may provide investments or loans to selected types of production projects.
Source: ERA
Indirect Production Incentives
There are three principal types of indirect production incentives that some states offer as follows:
Sales and use taxes: Filmmakers spend money in state on goods and services that are subject
to state and local sales taxes. These can be waived in two forms. First, the production
companies sometimes get a state-certified coupon that waives sales tax at the point of sale.
Alternatively, states may refund sales tax after filmmakers submit expense reports detailing
qualified expenditures;
Hotel taxes: All out-of-state labor – or even out-of-area labor – generally requires overnight stays
in hotels. Some states waive the hotel tax for qualifying stays. A qualifying stay generally
requires at least 30 days of consecutive nights and the tax credit or rebate is applied either to the
Economics Research Associates Project No. 18014 Page 74
total stay, or to all nights past the required minimum. Although this benefits feature filmmakers,
it has the effect of incentivizing out-of-area labor;
Fee-Free Filming: Many states provide state parks, municipal and state buildings and other
public property available to filmmakers free of charge. It is also common for public employees
like police to be fee-free as well.
Current U.S. Production Incentives
Incentives in other states – both new and revised – are making for an increasingly competitive
landscape. A comprehensive table with current types of incentives being offered by state is given
below. This chart includes the estimated state population, gross state product (GSP), amount of the
production incentive, indicates whether an infrastructure tax credit is available, any wage withholding
credits and the availability of indirect production incentives like sales and lodging tax exemptions.
Only two states in the U.S. currently do not offer any type of production incentive – direct and
indirect.
Some restrictions and qualifications apply individually to each state. Most states require a minimum
qualifying local expenditure. For example, Mississippi’s program offers a cash rebate of 20 percent
of in-state production costs; 20 percent of payroll paid to non-residents; and 25 percent of payroll to
residents with a minimum local spend of $20,000.
Annual state compensation/funding and per project caps are also frequently put in place. For
example, Mississippi’s program places a cap of $1 million on resident and non-resident payroll and an
$8 million cap per project. A statewide fiscal year cap of $20 million is also in place. The types of
productions that qualify for these incentives also vary accordingly. For instance, Florida’s 15 percent
rebate applies to everything from film, television and commercials, to industrial videos, promotional
videos, digital media effects productions and reality television series.
Among those 39 states with direct production incentives in place, transferable tax credits (27
percent), cash rebates (25 percent) and refundable tax credits (20 percent) and wage/labor credits (18
percent) are the most common type of incentive. In addition, six states currently offer incentives for
infrastructure. A total of 10 states currently offer indirect incentives only. Again, Arkansas and
Delaware are the only two states that do not offer any form of incentive at this time.
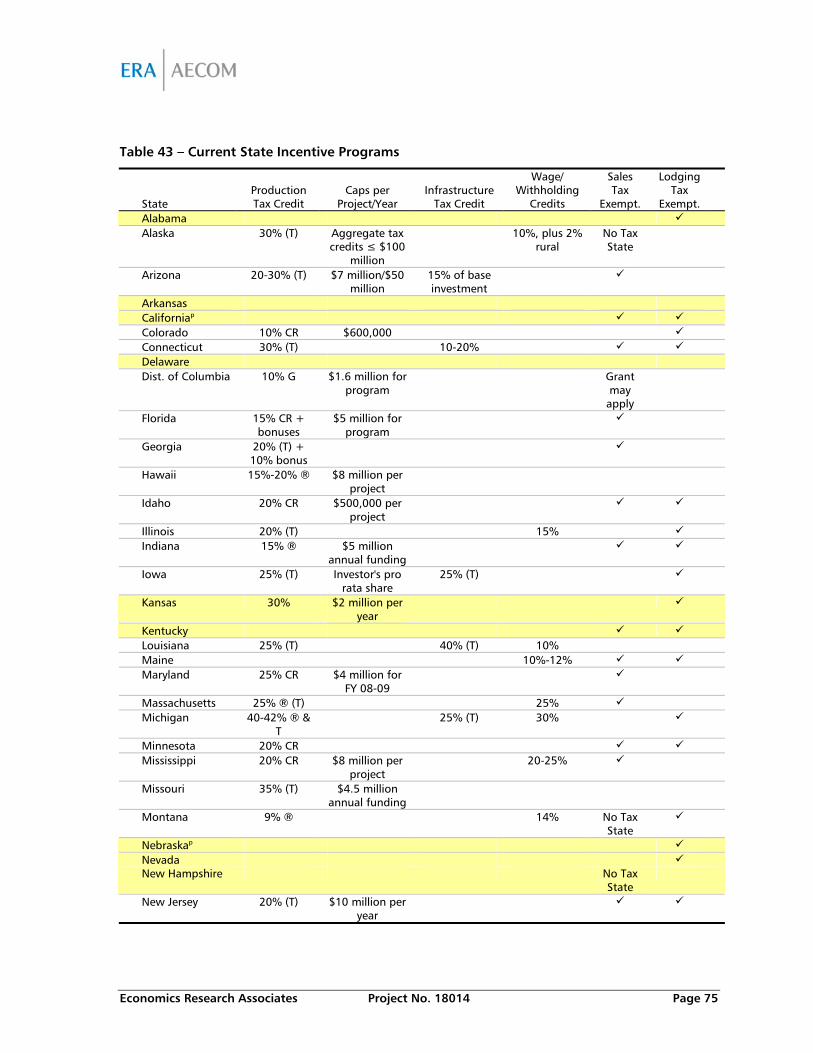
Economics Research Associates Project No. 18014 Page 75
Table 43 – Current State Incentive Programs
State Production Tax Credit
Caps per Project/Year
Infrastructure Tax Credit
Wage/ Withholding
Credits
Sales Tax
Exempt.
Lodging Tax
Exempt. Alabama Alaska 30% (T) Aggregate tax
credits ≤ $100 million
10%, plus 2% rural
No Tax State
Arizona 20-30% (T) $7 million/$50 million
15% of base investment
Arkansas Californiap Colorado 10% CR $600,000 Connecticut 30% (T) 10-20% Delaware Dist. of Columbia 10% G $1.6 million for
program Grant
may apply
Florida 15% CR + bonuses
$5 million for program
Georgia 20% (T) + 10% bonus
Hawaii 15%-20% ® $8 million per project
Idaho 20% CR $500,000 per project
Illinois 20% (T) 15% Indiana 15% ® $5 million
annual funding
Iowa 25% (T) Investor's pro rata share
25% (T)
Kansas 30% $2 million per year
Kentucky Louisiana 25% (T) 40% (T) 10% Maine 10%-12% Maryland 25% CR $4 million for
FY 08-09
Massachusetts 25% ® (T) 25% Michigan 40-42% ® &
T 25% (T) 30%
Minnesota 20% CR Mississippi 20% CR $8 million per
project 20-25%
Missouri 35% (T) $4.5 million annual funding
Montana 9% ® 14% No Tax State
Nebraskap Nevada New Hampshire No Tax
State
New Jersey 20% (T) $10 million per year
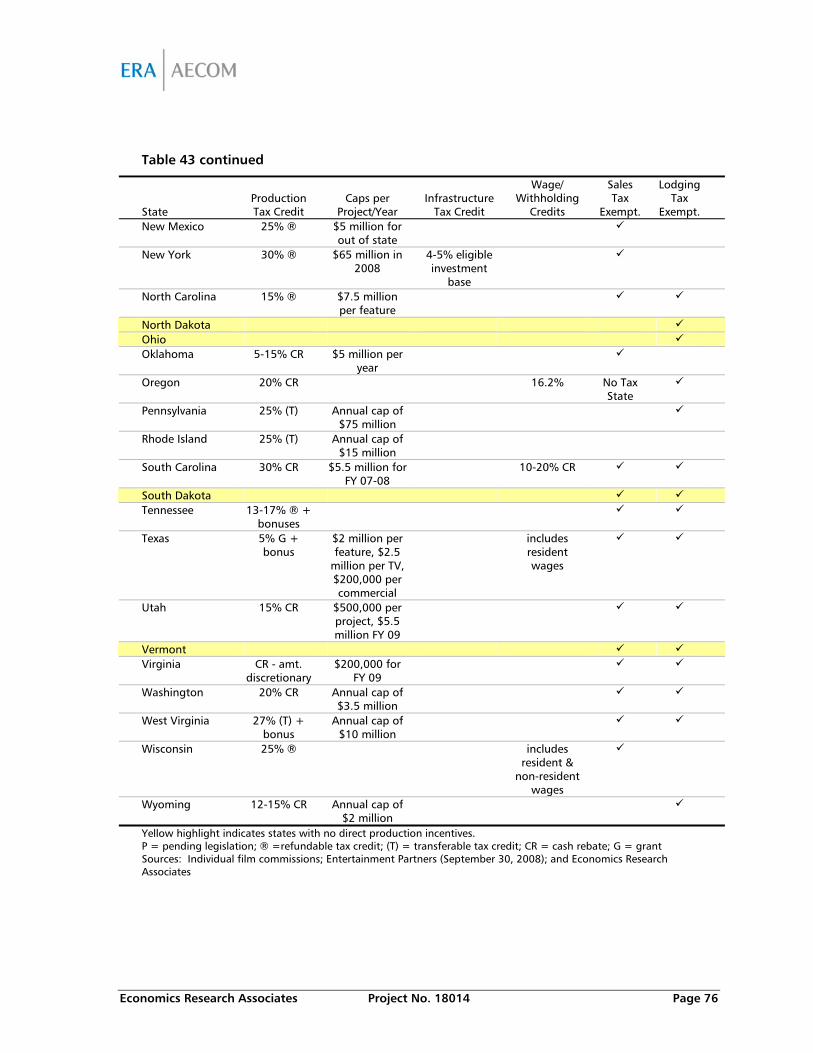
Economics Research Associates Project No. 18014 Page 76
Table 43 continued
State Production Tax Credit
Caps per Project/Year
Infrastructure Tax Credit
Wage/ Withholding
Credits
Sales Tax
Exempt.
Lodging Tax
Exempt. New Mexico 25% ® $5 million for
out of state
New York 30% ® $65 million in 2008
4-5% eligible investment
base
North Carolina 15% ® $7.5 million per feature
North Dakota Ohio Oklahoma 5-15% CR $5 million per
year
Oregon 20% CR 16.2% No Tax State
Pennsylvania 25% (T) Annual cap of $75 million
Rhode Island 25% (T) Annual cap of $15 million
South Carolina 30% CR $5.5 million for FY 07-08
10-20% CR
South Dakota Tennessee 13-17% ® +
bonuses
Texas 5% G + bonus
$2 million per feature, $2.5
million per TV, $200,000 per commercial
includes resident wages
Utah 15% CR $500,000 per project, $5.5 million FY 09
Vermont Virginia CR - amt.
discretionary $200,000 for
FY 09
Washington 20% CR Annual cap of $3.5 million
West Virginia 27% (T) + bonus
Annual cap of $10 million
Wisconsin 25% ® includes resident &
non-resident wages
Wyoming 12-15% CR Annual cap of $2 million
Yellow highlight indicates states with no direct production incentives. P = pending legislation; ® =refundable tax credit; (T) = transferable tax credit; CR = cash rebate; G = grant Sources: Individual film commissions; Entertainment Partners (September 30, 2008); and Economics Research Associates
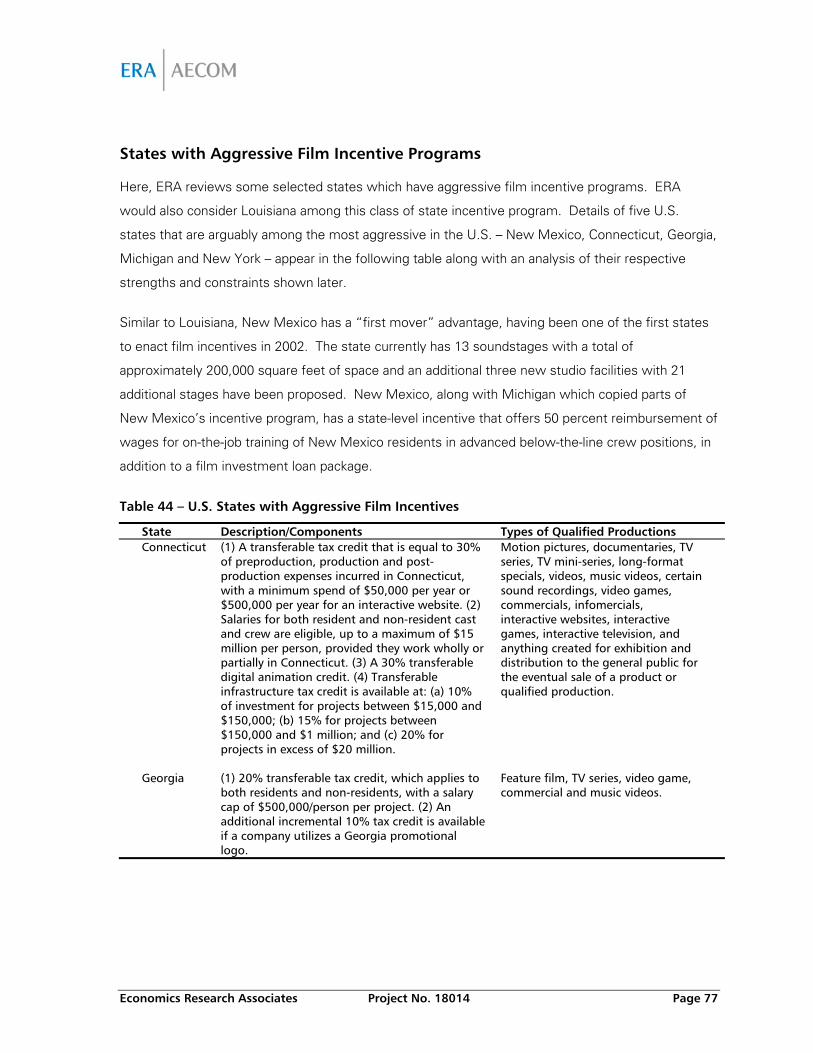
Economics Research Associates Project No. 18014 Page 77
States with Aggressive Film Incentive Programs
Here, ERA reviews some selected states which have aggressive film incentive programs. ERA
would also consider Louisiana among this class of state incentive program. Details of five U.S.
states that are arguably among the most aggressive in the U.S. – New Mexico, Connecticut, Georgia,
Michigan and New York – appear in the following table along with an analysis of their respective
strengths and constraints shown later.
Similar to Louisiana, New Mexico has a “first mover” advantage, having been one of the first states
to enact film incentives in 2002. The state currently has 13 soundstages with a total of
approximately 200,000 square feet of space and an additional three new studio facilities with 21
additional stages have been proposed. New Mexico, along with Michigan which copied parts of
New Mexico’s incentive program, has a state-level incentive that offers 50 percent reimbursement of
wages for on-the-job training of New Mexico residents in advanced below-the-line crew positions, in
addition to a film investment loan package.
Table 44 – U.S. States with Aggressive Film Incentives
State Description/Components Types of Qualified Productions
Connecticut (1) A transferable tax credit that is equal to 30% of preproduction, production and post-production expenses incurred in Connecticut, with a minimum spend of $50,000 per year or $500,000 per year for an interactive website. (2) Salaries for both resident and non-resident cast and crew are eligible, up to a maximum of $15 million per person, provided they work wholly or partially in Connecticut. (3) A 30% transferable digital animation credit. (4) Transferable infrastructure tax credit is available at: (a) 10% of investment for projects between $15,000 and $150,000; (b) 15% for projects between $150,000 and $1 million; and (c) 20% for projects in excess of $20 million.
Motion pictures, documentaries, TV series, TV mini-series, long-format specials, videos, music videos, certain sound recordings, video games, commercials, infomercials, interactive websites, interactive games, interactive television, and anything created for exhibition and distribution to the general public for the eventual sale of a product or qualified production.
Georgia (1) 20% transferable tax credit, which applies to both residents and non-residents, with a salary cap of $500,000/person per project. (2) An additional incremental 10% tax credit is available if a company utilizes a Georgia promotional logo.
Feature film, TV series, video game, commercial and music videos.
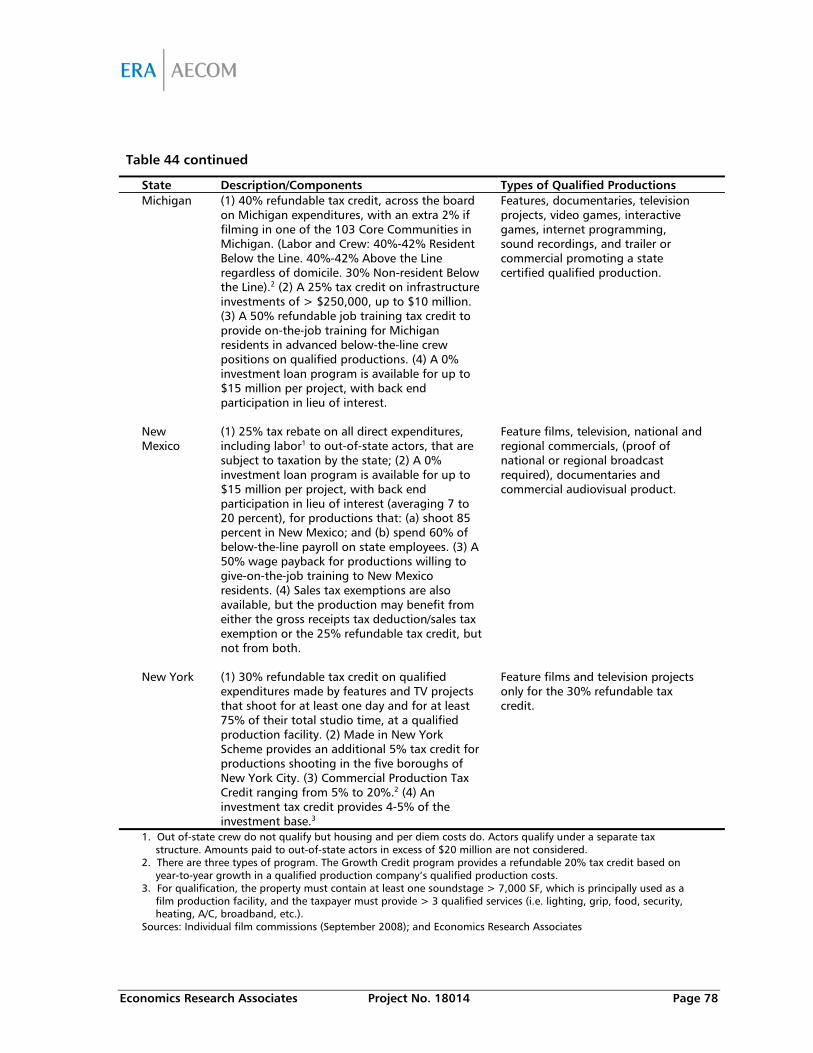
Economics Research Associates Project No. 18014 Page 78
Table 44 continued
State Description/Components Types of Qualified Productions
Michigan (1) 40% refundable tax credit, across the board on Michigan expenditures, with an extra 2% if filming in one of the 103 Core Communities in Michigan. (Labor and Crew: 40%-42% Resident Below the Line. 40%-42% Above the Line regardless of domicile. 30% Non-resident Below the Line).2 (2) A 25% tax credit on infrastructure investments of > $250,000, up to $10 million. (3) A 50% refundable job training tax credit to provide on-the-job training for Michigan residents in advanced below-the-line crew positions on qualified productions. (4) A 0% investment loan program is available for up to $15 million per project, with back end participation in lieu of interest.
Features, documentaries, television projects, video games, interactive games, internet programming, sound recordings, and trailer or commercial promoting a state certified qualified production.
New Mexico
(1) 25% tax rebate on all direct expenditures, including labor1 to out-of-state actors, that are subject to taxation by the state; (2) A 0% investment loan program is available for up to $15 million per project, with back end participation in lieu of interest (averaging 7 to 20 percent), for productions that: (a) shoot 85 percent in New Mexico; and (b) spend 60% of below-the-line payroll on state employees. (3) A 50% wage payback for productions willing to give-on-the-job training to New Mexico residents. (4) Sales tax exemptions are also available, but the production may benefit from either the gross receipts tax deduction/sales tax exemption or the 25% refundable tax credit, but not from both.
Feature films, television, national and regional commercials, (proof of national or regional broadcast required), documentaries and commercial audiovisual product.
New York (1) 30% refundable tax credit on qualified expenditures made by features and TV projects that shoot for at least one day and for at least 75% of their total studio time, at a qualified production facility. (2) Made in New York Scheme provides an additional 5% tax credit for productions shooting in the five boroughs of New York City. (3) Commercial Production Tax Credit ranging from 5% to 20%.2 (4) An investment tax credit provides 4-5% of the investment base.3
Feature films and television projects only for the 30% refundable tax credit.
1. Out of-state crew do not qualify but housing and per diem costs do. Actors qualify under a separate tax structure. Amounts paid to out-of-state actors in excess of $20 million are not considered.
2. There are three types of program. The Growth Credit program provides a refundable 20% tax credit based on year-to-year growth in a qualified production company’s qualified production costs.
3. For qualification, the property must contain at least one soundstage > 7,000 SF, which is principally used as a film production facility, and the taxpayer must provide > 3 qualified services (i.e. lighting, grip, food, security, heating, A/C, broadband, etc.).
Sources: Individual film commissions (September 2008); and Economics Research Associates
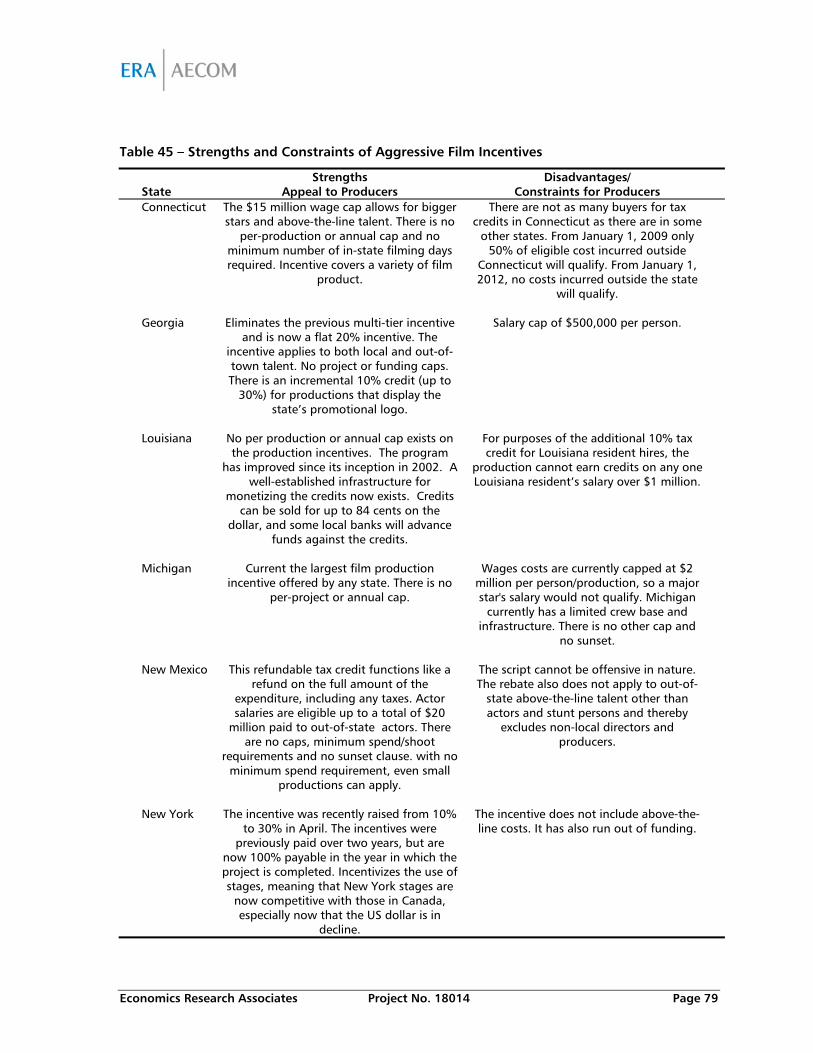
Economics Research Associates Project No. 18014 Page 79
Table 45 – Strengths and Constraints of Aggressive Film Incentives
State Strengths
Appeal to Producers Disadvantages/
Constraints for Producers Connecticut The $15 million wage cap allows for bigger
stars and above-the-line talent. There is no per-production or annual cap and no
minimum number of in-state filming days required. Incentive covers a variety of film
product.
There are not as many buyers for tax credits in Connecticut as there are in some
other states. From January 1, 2009 only 50% of eligible cost incurred outside
Connecticut will qualify. From January 1, 2012, no costs incurred outside the state
will qualify.
Georgia Eliminates the previous multi-tier incentive
and is now a flat 20% incentive. The incentive applies to both local and out-of-town talent. No project or funding caps. There is an incremental 10% credit (up to
30%) for productions that display the state’s promotional logo.
Salary cap of $500,000 per person.
Louisiana No per production or annual cap exists on
the production incentives. The program has improved since its inception in 2002. A
well-established infrastructure for monetizing the credits now exists. Credits
can be sold for up to 84 cents on the dollar, and some local banks will advance
funds against the credits.
For purposes of the additional 10% tax credit for Louisiana resident hires, the
production cannot earn credits on any one Louisiana resident’s salary over $1 million.
Michigan Current the largest film production
incentive offered by any state. There is no per-project or annual cap.
Wages costs are currently capped at $2 million per person/production, so a major star's salary would not qualify. Michigan
currently has a limited crew base and infrastructure. There is no other cap and
no sunset.
New Mexico This refundable tax credit functions like a
refund on the full amount of the expenditure, including any taxes. Actor salaries are eligible up to a total of $20
million paid to out-of-state actors. There are no caps, minimum spend/shoot
requirements and no sunset clause. with no minimum spend requirement, even small
productions can apply.
The script cannot be offensive in nature. The rebate also does not apply to out-of-
state above-the-line talent other than actors and stunt persons and thereby
excludes non-local directors and producers.
New York The incentive was recently raised from 10%
to 30% in April. The incentives were previously paid over two years, but are
now 100% payable in the year in which the project is completed. Incentivizes the use of stages, meaning that New York stages are
now competitive with those in Canada, especially now that the US dollar is in
decline.
The incentive does not include above-the-line costs. It has also run out of funding.
Economics Research Associates Project No. 18014 Page 80
The Effectiveness of Film Incentives
In 2005, the Ministry of Economic Development in British Columbia commissioned a report to
analyze the impact of tax credits in various U.S. and Canadian states/provinces. Their analysis
reviewed production spending growth both before and after the introduction of tax credits.
It was found that average annual production spending in Canadian provinces was consistently strong
before the introduction of tax credits. The opposite was true for selected U.S. states – Louisiana,
New Mexico, Illinois and Hawaii – prior to the introduction of tax credits. With the exception of
Hawaii, these states all experienced negative annual growth before the advent of tax credits
according to the study. Following the introduction of tax credits, however, production spending
increased significantly. At least by this measure, such programs have often met with success.
The opposite was true in the Canadian provinces, all of which experienced flat or negative growth
following the introduction of tax credits. This can be partially attributed to the fact that Canada
already had a competitive advantage due to: (a) lower exchange rates; (b) lower labor rates, even in
U.S. dollars; and (c) the existence of a skilled crew base, except in the Prairie provinces, which have
added labor training provisions.
The introduction of tax credits, however, had a significant impact on states such as Louisiana, New
Mexico and Illinois. It should be noted, however, that these states had significantly less production
spending, prior to the introduction of tax credits, compared to Ontario and British Columbia.
Therefore, one or more mid- or large-scale productions could considerably change the industry’s rate
of growth in such states.
For the short term, as in the case of states such as Louisiana, film tax credits do attract film
production and create jobs in states that have little or no film industry. Revenues generated by what
is often referred to as the “multiplier effects” can partially reduce losses. Film producers can earn
profits, pay wages and purchase goods and services from suppliers. This generates additional
economic activity. In turn, this activity generates revenues ranging from personal income tax, the
general sales tax and property tax. At the same time, tax incentives can cost states considerable
foregone tax revenue since they may not necessarily “pay for themselves”. Film tax credits can also
benefit firms not engaged in production or that would have filmed locally anyway.
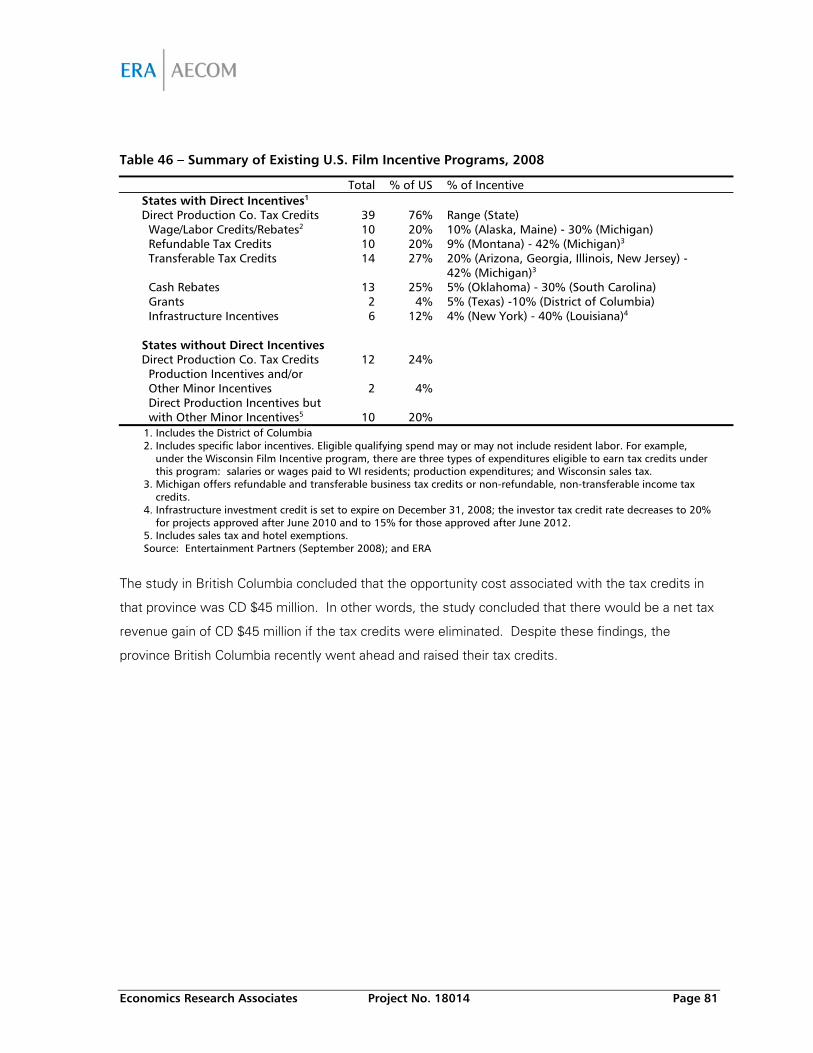
Economics Research Associates Project No. 18014 Page 81
Table 46 – Summary of Existing U.S. Film Incentive Programs, 2008
Total % of US % of Incentive States with Direct Incentives1 Direct Production Co. Tax Credits 39 76% Range (State) Wage/Labor Credits/Rebates2 10 20% 10% (Alaska, Maine) - 30% (Michigan) Refundable Tax Credits 10 20% 9% (Montana) - 42% (Michigan)3 Transferable Tax Credits 14 27% 20% (Arizona, Georgia, Illinois, New Jersey) -
42% (Michigan)3
Cash Rebates 13 25% 5% (Oklahoma) - 30% (South Carolina) Grants 2 4% 5% (Texas) -10% (District of Columbia) Infrastructure Incentives 6 12% 4% (New York) - 40% (Louisiana)4 States without Direct Incentives Direct Production Co. Tax Credits 12 24%
Production Incentives and/or Other Minor Incentives 2 4%
Direct Production Incentives but with Other Minor Incentives5 10 20%
1. Includes the District of Columbia 2. Includes specific labor incentives. Eligible qualifying spend may or may not include resident labor. For example,
under the Wisconsin Film Incentive program, there are three types of expenditures eligible to earn tax credits under this program: salaries or wages paid to WI residents; production expenditures; and Wisconsin sales tax.
3. Michigan offers refundable and transferable business tax credits or non-refundable, non-transferable income tax credits.
4. Infrastructure investment credit is set to expire on December 31, 2008; the investor tax credit rate decreases to 20% for projects approved after June 2010 and to 15% for those approved after June 2012.
5. Includes sales tax and hotel exemptions. Source: Entertainment Partners (September 2008); and ERA
The study in British Columbia concluded that the opportunity cost associated with the tax credits in
that province was CD $45 million. In other words, the study concluded that there would be a net tax
revenue gain of CD $45 million if the tax credits were eliminated. Despite these findings, the
province British Columbia recently went ahead and raised their tax credits.
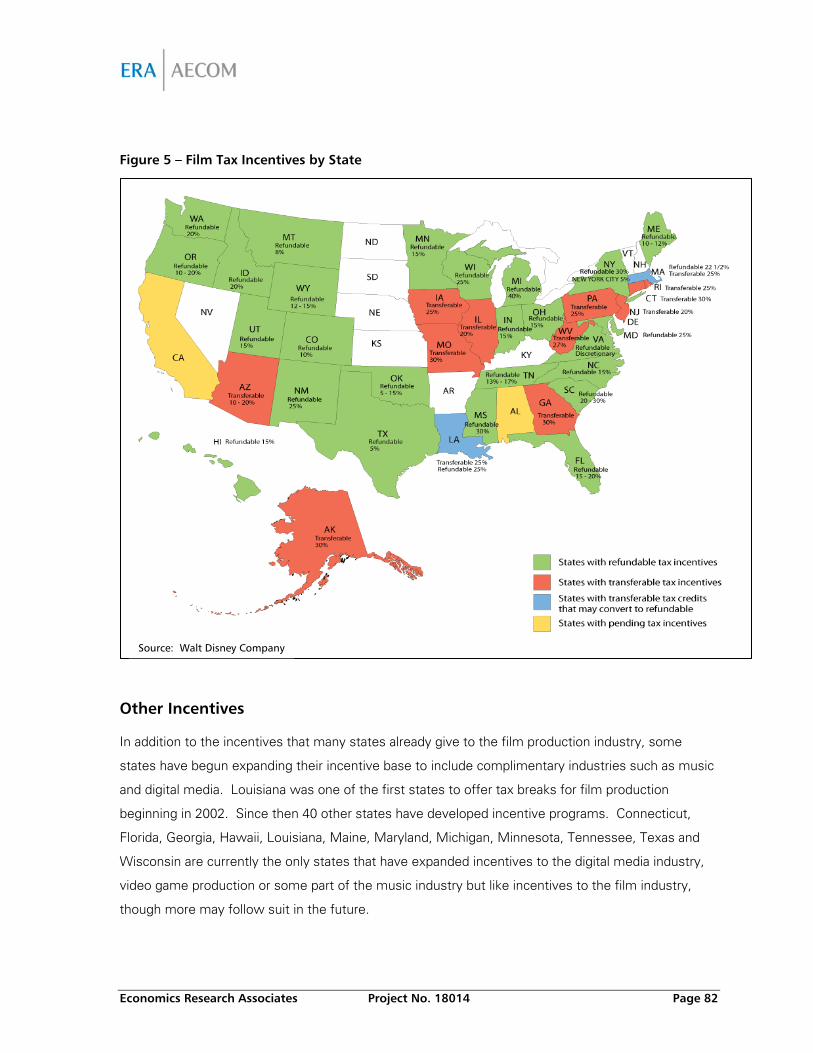
Economics Research Associates Project No. 18014 Page 82
Figure 5 – Film Tax Incentives by State
Other Incentives
In addition to the incentives that many states already give to the film production industry, some
states have begun expanding their incentive base to include complimentary industries such as music
and digital media. Louisiana was one of the first states to offer tax breaks for film production
beginning in 2002. Since then 40 other states have developed incentive programs. Connecticut,
Florida, Georgia, Hawaii, Louisiana, Maine, Maryland, Michigan, Minnesota, Tennessee, Texas and
Wisconsin are currently the only states that have expanded incentives to the digital media industry,
video game production or some part of the music industry but like incentives to the film industry,
though more may follow suit in the future.
Source: Walt Disney Company
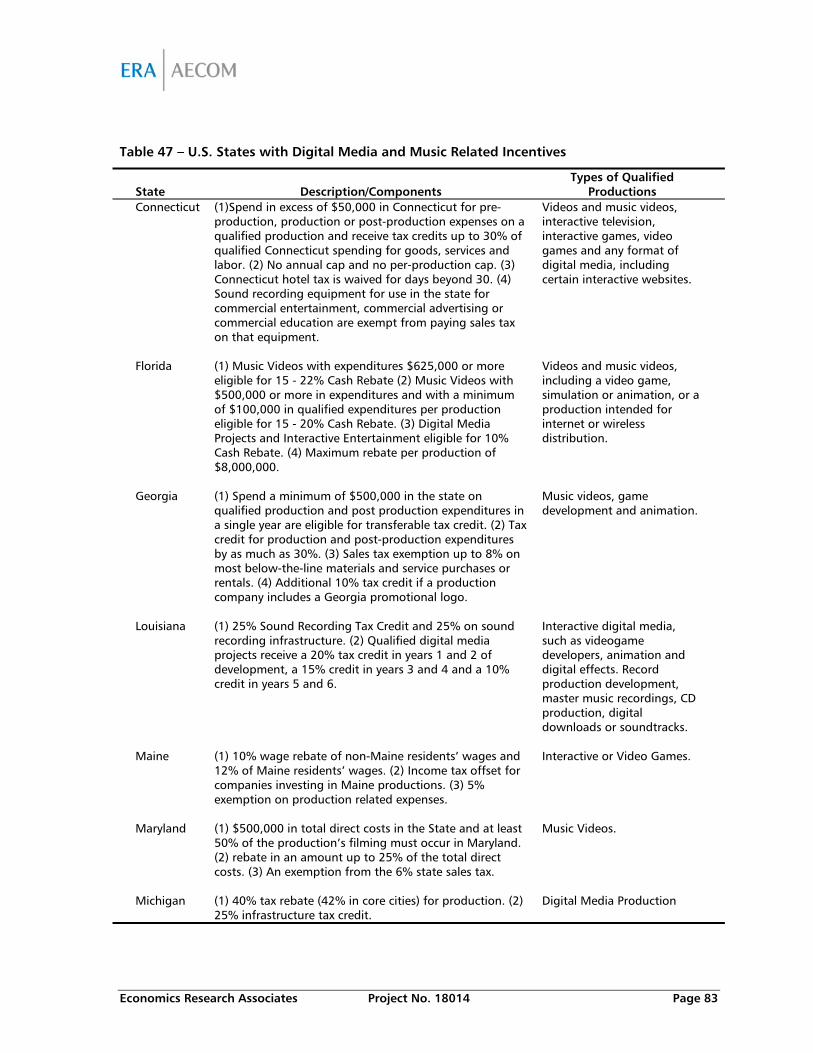
Economics Research Associates Project No. 18014 Page 83
Table 47 – U.S. States with Digital Media and Music Related Incentives
State Description/Components
Types of Qualified Productions
Connecticut (1)Spend in excess of $50,000 in Connecticut for pre-production, production or post-production expenses on a qualified production and receive tax credits up to 30% of qualified Connecticut spending for goods, services and labor. (2) No annual cap and no per-production cap. (3) Connecticut hotel tax is waived for days beyond 30. (4) Sound recording equipment for use in the state for commercial entertainment, commercial advertising or commercial education are exempt from paying sales tax on that equipment.
Videos and music videos, interactive television, interactive games, video games and any format of digital media, including certain interactive websites.
Florida (1) Music Videos with expenditures $625,000 or more
eligible for 15 - 22% Cash Rebate (2) Music Videos with $500,000 or more in expenditures and with a minimum of $100,000 in qualified expenditures per production eligible for 15 - 20% Cash Rebate. (3) Digital Media Projects and Interactive Entertainment eligible for 10% Cash Rebate. (4) Maximum rebate per production of $8,000,000.
Videos and music videos, including a video game, simulation or animation, or a production intended for internet or wireless distribution.
Georgia (1) Spend a minimum of $500,000 in the state on
qualified production and post production expenditures in a single year are eligible for transferable tax credit. (2) Tax credit for production and post-production expenditures by as much as 30%. (3) Sales tax exemption up to 8% on most below-the-line materials and service purchases or rentals. (4) Additional 10% tax credit if a production company includes a Georgia promotional logo.
Music videos, game development and animation.
Louisiana (1) 25% Sound Recording Tax Credit and 25% on sound
recording infrastructure. (2) Qualified digital media projects receive a 20% tax credit in years 1 and 2 of development, a 15% credit in years 3 and 4 and a 10% credit in years 5 and 6.
Interactive digital media, such as videogame developers, animation and digital effects. Record production development, master music recordings, CD production, digital downloads or soundtracks.
Maine (1) 10% wage rebate of non-Maine residents’ wages and
12% of Maine residents’ wages. (2) Income tax offset for companies investing in Maine productions. (3) 5% exemption on production related expenses.
Interactive or Video Games.
Maryland (1) $500,000 in total direct costs in the State and at least
50% of the production’s filming must occur in Maryland. (2) rebate in an amount up to 25% of the total direct costs. (3) An exemption from the 6% state sales tax.
Music Videos.
Michigan (1) 40% tax rebate (42% in core cities) for production. (2)
25% infrastructure tax credit. Digital Media Production
Economics Research Associates Project No. 18014 Page 84
Table 47 continued
State Description/Components
Types of Qualified Productions
Minnesota (1) 15% rebate of Minnesota expenditures available. (2) Commercial Sales Tax Exemption.
Music Videos
Tennessee 2% of the Qualified Expenses (up to a maximum rebate of
$100,000) shall be available if a production company spends at least $20,000 during postproduction in acquisition costs for music created by Tennessee residents and/or for recording of music in Tennessee.
Movie Soundtracks
Texas (1) Moving Image Industry Incentive Program returns 5%
of TX spending for commercials/video games spending at least $100K in Texas. 80% of production must be completed in Texas and 70% of crew/cast must be Texas residents. Capped a $250K for video games. (2) Grant increases to 6.25% if 25% of production occurs in underused area.
Video Games Production
Wisconsin (1) Tax Credit of 25% of direct production expenditures.
(2) Investment tax credit of 25% for investing in Wisconsin based productions. (3) Income tax credit of 15% for production businesses that make a capital investment by starting a business in Wisconsin.
Video Games Production
Source: Economics Research Associates
The expanded benefits offered by these states have primarily impacted the digital media industry –
interactive television and games, video game development, digital animation and web applications.
Louisiana is the only state that offers special incentives to the music and recording industry, with
other states simply offering incentives to the producers of music video, which in essence is a form a
film and not traditional music production. Tennessee also offers incentives to film producers who
hire local musicians and facilities to reinvents in post-development music for film soundtracks.
All of these states besides Florida offer incentives in the form of transferable tax credits. In
Connecticut, Florida, Georgia and Louisiana (the most proactive states with expanded incentive
packages) they are in essence an expansion of current legislation and incentives offered to the film
production industry. While some states, such as Michigan, offer incentive tax credit rates that are
higher in absolute value as compared to Louisiana, they also have higher barrier and restriction
requirements. Texas, for example, requires that 80 percent of the production be produced in the
state and 70 percent of the production crew or cast be residents of Texas. So, while Louisiana may
not be the only player in the market offering incentives to the digital media industry it offers
competitive incentives that are, in some respects, more flexible than many other states.
Economics Research Associates Project No. 18014 Page 85
Appendix A – Overview of Louisiana’s Entertainment Legislation
2002
Motion Picture Incentive Act passed creating 10% tax credit (investments between $300,000 and
$1,000,000) and 15% tax credit (investment greater than $1,000,000) for all production dollars spent
including out of state spend. A 10% employment credit on resident payroll (in state spend between
$300,000 and $1,000,000) and a 20% employment credit (in state spend greater than $1,000,000).
The minimum threshold was set at $300,000. Acts 1 and 2 of the 2002 Extraordinary Session
2003
Motion Picture Incentive Act amended to make the credit transferrable and abolish the Film
Commission, but created the Governor’s Office of Film & Television Development within LED,
Thresholds changed for 10% credit to investment between $300,000 and $8,000,000 and to
investment above $8,000,000 for 15% credit. Employment credits remained the same and the sales
and use tax exemption was added. Acts 551 and 1240 of the 2003 Regular Session
2005
Motion Picture incentive Act changed to a 25% tax credit for instate spend only and a 10% additional
credit for Louisiana resident payroll. An audited expenditure report requirement was added for tax
credit certification and 15% infrastructure credit was added to the program. Sales and use tax
exemption abolished. Act 456 of the 2005 Regular Session
Digital Interactive Media tax incentive passed creating a transferrable 20% production tax credit for
the development of interactive media (i.e.: video games). No minimum threshold. Act 346 of the
2007 Regular Session
Sound Recording tax incentive program passed, creating a 15% production and infrastructure tax
credit with a minimum threshold of $15,000. This credit is not transferrable. Entire program capped
at $3 million. Act 368 of the 2007 Regular Session
Economics Research Associates Project No. 18014 Page 86
October 2005
Attorney General issued opinion declaring language in motion picture incentive act indicates
infrastructure tax credit is 40% (Language in the law inadvertently added the 25% production credit
to the 15% infrastructure credit).
2006
Name changed from Governor’s Office of Film and Television to the Office of Entertainment Industry
Development. Act 346 of the 2006 Regular Session
2007
Motion Picture Incentive Act amended to further clarify legislative intent regarding infrastructure (no
condos, golf courses etc.), extends the sunset on the infrastructure credit by one year, grandfathers
projects that applied by August 1, 2007 and sets minimum thresholds and creates a $25 million per
project credit cap for new infrastructure applications. Act 456 of 2007 Regular Session
Live Performance Incentive Act (Broadway South) passed offering 4 new transferrable production tax
credits and 1 new transferrable infrastructure credit at 10% to 25% with thresholds ranging from
$100,000 to $1 million. Infrastructure credit is capped at $10 million per project and $60 million per
year for the program. Act 482 of 2007 Regular Session
Sound Recording Incentive program is amended to provide for a 25% tax credit for production and
infrastructure and removes the DOA from certification process. The $3 million program cap remains.
Act 368 0f 2007 Regular Session
Economics Research Associates Project No. 18014 Page 87
Appendix B – Motion Picture Productions in Louisiana
Below is a list of motion picture projects that were produced in Louisiana, by year of production from
the Office of Entertainment Industry Development in the Louisiana Economic Development
Department.
Project Name Type Location 2002 Evil Remains Feature New Orleans 2003 A Love Song for Bobby Long Feature New Orleans A Twisted Trust MOW New Orleans Because of Winn-Dixie Feature New Orleans Deacon John's Jump Blues Documentary Flood of Fear MOW Freshman Year Feature Jefferson Parish Growing Pains Reunion 2 MOW New Orleans Jedakis Video Music Video Mr. 3000 Feature New Orleans Music Videos (5 videos) Music Video Ray Feature New Orleans Runaway Jury Feature New Orleans Sky Italia Launch Campaign Commercial Torn Apart Feature Waiting Feature Jefferson Parish 2004 Brooke Ellison MOW Jefferson Parish Canal Street Brothel MOW New Orleans Dead Will Tell MOW New Orleans Dreamer Feature St. Tammany Dukes of Hazzard Feature Baton Rouge, New Orleans, Clinton Five Fingers Feature New Orleans Frankenstein MOW Glory Road Feature New Orleans, Baton Rouge Heartless MOW Jefferson Parish Infidelity MOW Jefferson Parish Last Holiday Feature New Orleans Miracle Run MOW New Orleans Odd Girl Out MOW Jefferson Parish Pop Rocks MOW New Orleans Search for the World's Greatest Kid Magician MOW Searching for David's Heart MOW Shooting Gallery (aka Pool Hall Prophets) Feature New Orleans Skeleton Key Feature St. James Parish Stuck in Suburbs MOW New Orleans Thief MOW New Orleans, Shreveport Venom (aka Backwater) Feature New Orleans, Choctaw
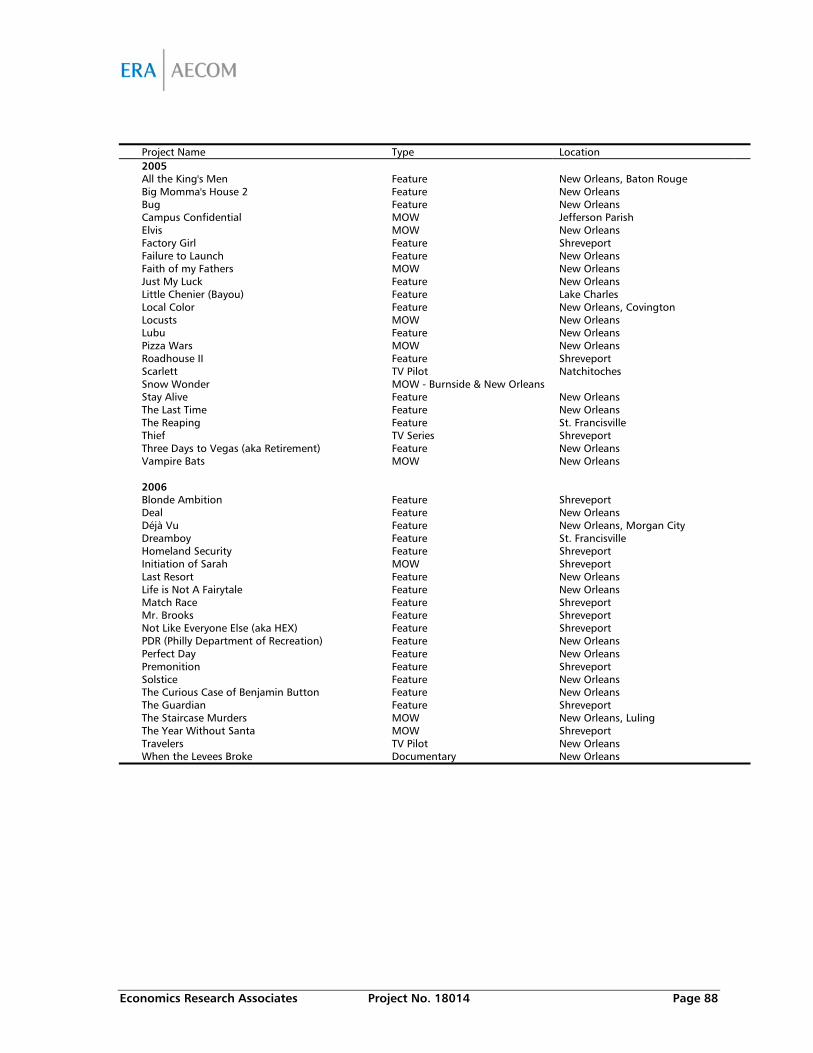
Economics Research Associates Project No. 18014 Page 88
Project Name Type Location 2005 All the King's Men Feature New Orleans, Baton Rouge Big Momma's House 2 Feature New Orleans Bug Feature New Orleans Campus Confidential MOW Jefferson Parish Elvis MOW New Orleans Factory Girl Feature Shreveport Failure to Launch Feature New Orleans Faith of my Fathers MOW New Orleans Just My Luck Feature New Orleans Little Chenier (Bayou) Feature Lake Charles Local Color Feature New Orleans, Covington Locusts MOW New Orleans Lubu Feature New Orleans Pizza Wars MOW New Orleans Roadhouse II Feature Shreveport Scarlett TV Pilot Natchitoches Snow Wonder MOW - Burnside & New Orleans Stay Alive Feature New Orleans The Last Time Feature New Orleans The Reaping Feature St. Francisville Thief TV Series Shreveport Three Days to Vegas (aka Retirement) Feature New Orleans Vampire Bats MOW New Orleans 2006 Blonde Ambition Feature Shreveport Deal Feature New Orleans Déjà Vu Feature New Orleans, Morgan City Dreamboy Feature St. Francisville Homeland Security Feature Shreveport Initiation of Sarah MOW Shreveport Last Resort Feature New Orleans Life is Not A Fairytale Feature New Orleans Match Race Feature Shreveport Mr. Brooks Feature Shreveport Not Like Everyone Else (aka HEX) Feature Shreveport PDR (Philly Department of Recreation) Feature New Orleans Perfect Day Feature New Orleans Premonition Feature Shreveport Solstice Feature New Orleans The Curious Case of Benjamin Button Feature New Orleans The Guardian Feature Shreveport The Staircase Murders MOW New Orleans, Luling The Year Without Santa MOW Shreveport Travelers TV Pilot New Orleans When the Levees Broke Documentary New Orleans
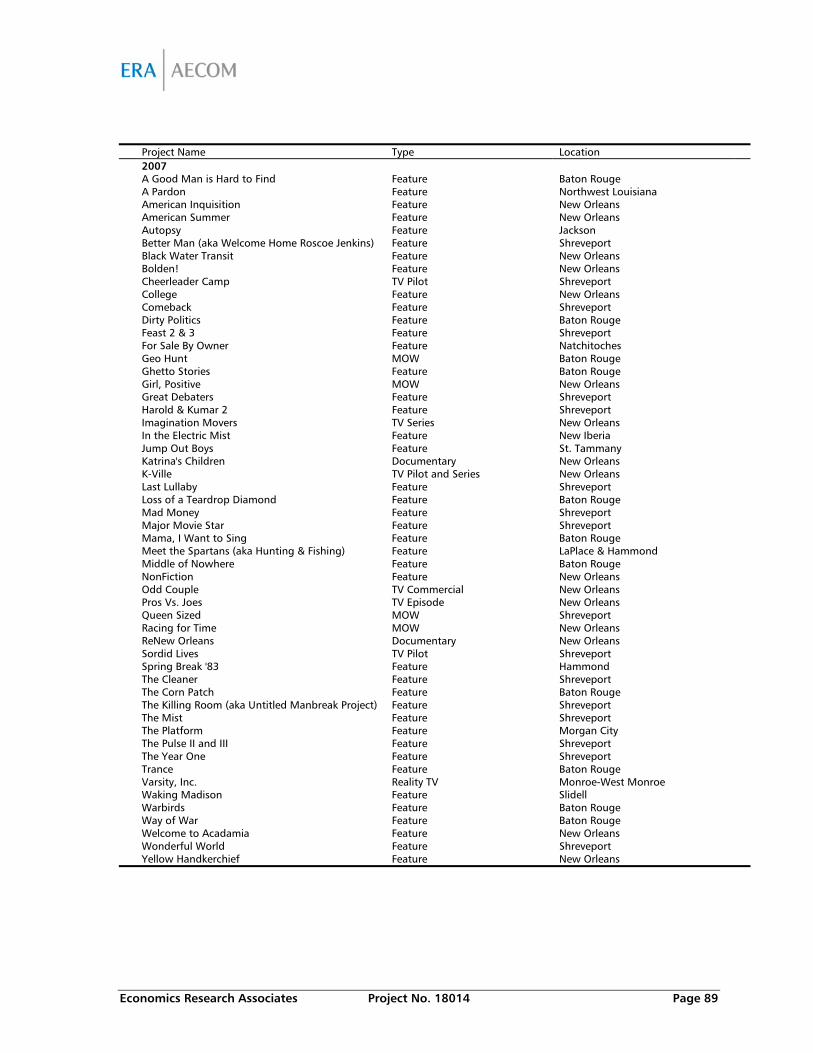
Economics Research Associates Project No. 18014 Page 89
Project Name Type Location 2007 A Good Man is Hard to Find Feature Baton Rouge A Pardon Feature Northwest Louisiana American Inquisition Feature New Orleans American Summer Feature New Orleans Autopsy Feature Jackson Better Man (aka Welcome Home Roscoe Jenkins) Feature Shreveport Black Water Transit Feature New Orleans Bolden! Feature New Orleans Cheerleader Camp TV Pilot Shreveport College Feature New Orleans Comeback Feature Shreveport Dirty Politics Feature Baton Rouge Feast 2 & 3 Feature Shreveport For Sale By Owner Feature Natchitoches Geo Hunt MOW Baton Rouge Ghetto Stories Feature Baton Rouge Girl, Positive MOW New Orleans Great Debaters Feature Shreveport Harold & Kumar 2 Feature Shreveport Imagination Movers TV Series New Orleans In the Electric Mist Feature New Iberia Jump Out Boys Feature St. Tammany Katrina's Children Documentary New Orleans K-Ville TV Pilot and Series New Orleans Last Lullaby Feature Shreveport Loss of a Teardrop Diamond Feature Baton Rouge Mad Money Feature Shreveport Major Movie Star Feature Shreveport Mama, I Want to Sing Feature Baton Rouge Meet the Spartans (aka Hunting & Fishing) Feature LaPlace & Hammond Middle of Nowhere Feature Baton Rouge NonFiction Feature New Orleans Odd Couple TV Commercial New Orleans Pros Vs. Joes TV Episode New Orleans Queen Sized MOW Shreveport Racing for Time MOW New Orleans ReNew Orleans Documentary New Orleans Sordid Lives TV Pilot Shreveport Spring Break '83 Feature Hammond The Cleaner Feature Shreveport The Corn Patch Feature Baton Rouge The Killing Room (aka Untitled Manbreak Project) Feature Shreveport The Mist Feature Shreveport The Platform Feature Morgan City The Pulse II and III Feature Shreveport The Year One Feature Shreveport Trance Feature Baton Rouge Varsity, Inc. Reality TV Monroe-West Monroe Waking Madison Feature Slidell Warbirds Feature Baton Rouge Way of War Feature Baton Rouge Welcome to Acadamia Feature New Orleans Wonderful World Feature Shreveport Yellow Handkerchief Feature New Orleans
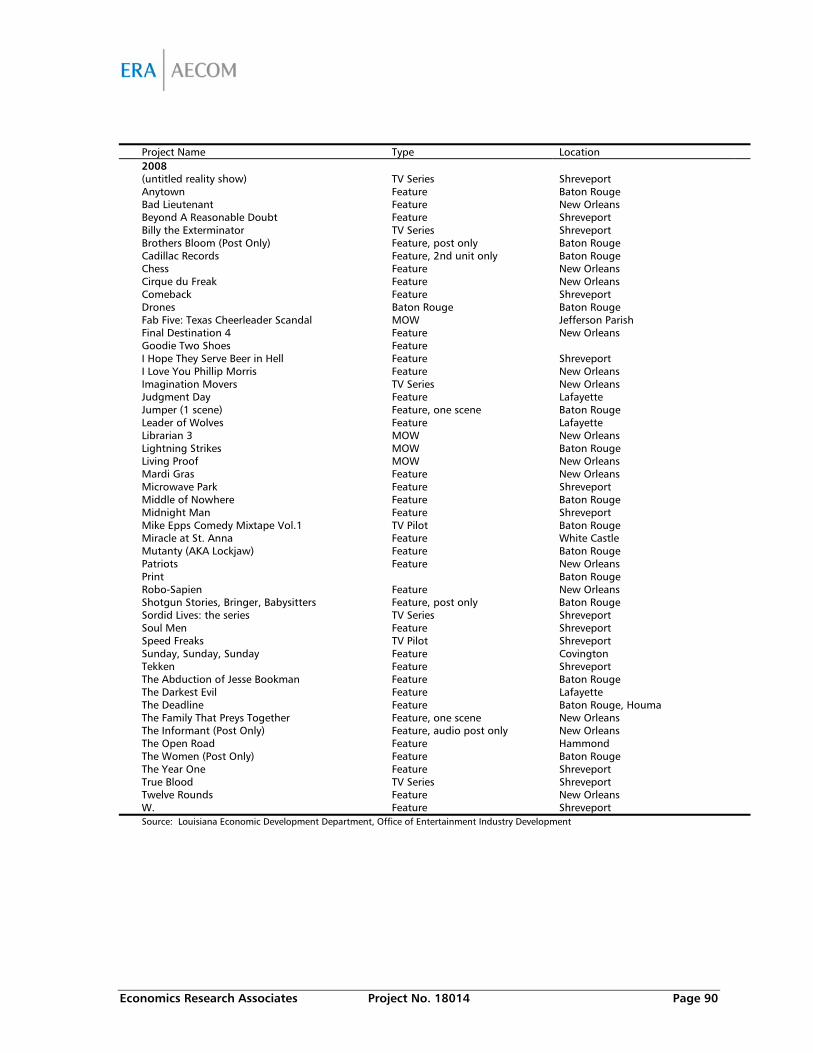
Economics Research Associates Project No. 18014 Page 90
Project Name Type Location 2008 (untitled reality show) TV Series Shreveport Anytown Feature Baton Rouge Bad Lieutenant Feature New Orleans Beyond A Reasonable Doubt Feature Shreveport Billy the Exterminator TV Series Shreveport Brothers Bloom (Post Only) Feature, post only Baton Rouge Cadillac Records Feature, 2nd unit only Baton Rouge Chess Feature New Orleans Cirque du Freak Feature New Orleans Comeback Feature Shreveport Drones Baton Rouge Baton Rouge Fab Five: Texas Cheerleader Scandal MOW Jefferson Parish Final Destination 4 Feature New Orleans Goodie Two Shoes Feature I Hope They Serve Beer in Hell Feature Shreveport I Love You Phillip Morris Feature New Orleans Imagination Movers TV Series New Orleans Judgment Day Feature Lafayette Jumper (1 scene) Feature, one scene Baton Rouge Leader of Wolves Feature Lafayette Librarian 3 MOW New Orleans Lightning Strikes MOW Baton Rouge Living Proof MOW New Orleans Mardi Gras Feature New Orleans Microwave Park Feature Shreveport Middle of Nowhere Feature Baton Rouge Midnight Man Feature Shreveport Mike Epps Comedy Mixtape Vol.1 TV Pilot Baton Rouge Miracle at St. Anna Feature White Castle Mutanty (AKA Lockjaw) Feature Baton Rouge Patriots Feature New Orleans Print Baton Rouge Robo-Sapien Feature New Orleans Shotgun Stories, Bringer, Babysitters Feature, post only Baton Rouge Sordid Lives: the series TV Series Shreveport Soul Men Feature Shreveport Speed Freaks TV Pilot Shreveport Sunday, Sunday, Sunday Feature Covington Tekken Feature Shreveport The Abduction of Jesse Bookman Feature Baton Rouge The Darkest Evil Feature Lafayette The Deadline Feature Baton Rouge, Houma The Family That Preys Together Feature, one scene New Orleans The Informant (Post Only) Feature, audio post only New Orleans The Open Road Feature Hammond The Women (Post Only) Feature Baton Rouge The Year One Feature Shreveport True Blood TV Series Shreveport Twelve Rounds Feature New Orleans W. Feature Shreveport Source: Louisiana Economic Development Department, Office of Entertainment Industry Development